Sample Category Title
AUDUSD Continues to Trade in Sideways Manner
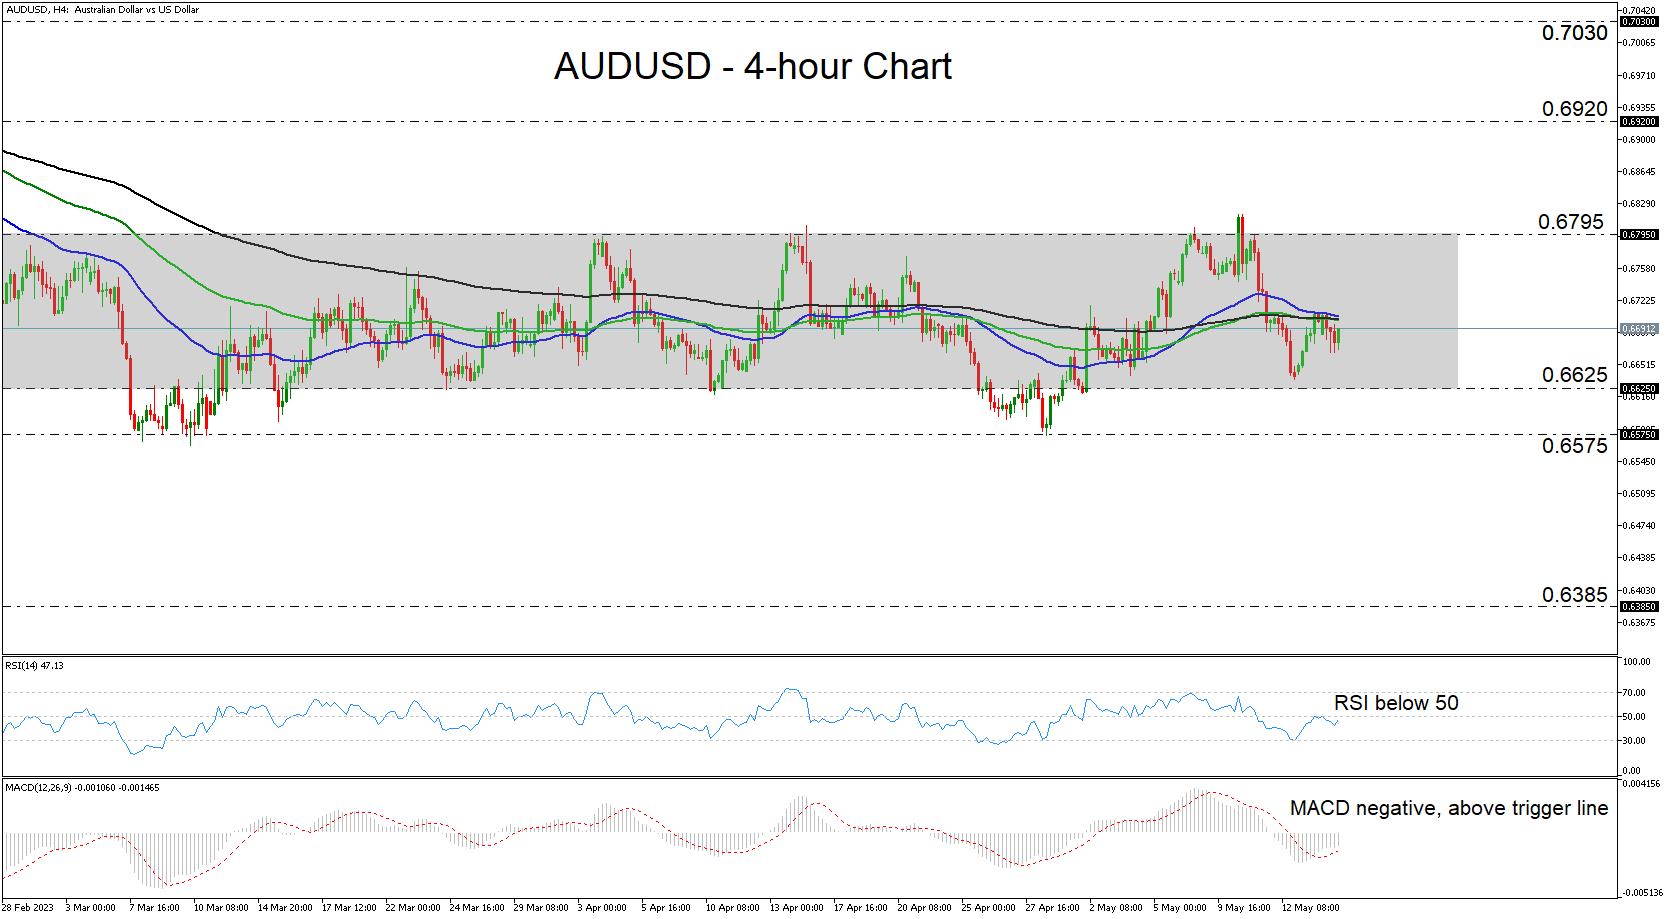
AUDUSD has been in a sliding mode this week, after hitting resistance near its 50-period exponential moving average (EMA). That said, in the bigger picture, the pair has been trading sideways since February 24, with most of the price action being contained between the 0.6625 and 0.6795 barriers. Therefore, the short-term outlook for now remains neutral.
Both the short-term oscillators are detecting negative momentum. The RSI is lying below 50, but it has turned up today, while the MACD, although below zero, is still running above its trigger line. This confirms the notion of waiting for stronger momentum and price action signals over a potential sustained directional move.
The bears could claim full control upon a dip below the lower bound of the range at 0.6625, which could initially aim for the 0.6575 barrier. That barrier offered strong support back in March and more recently on April 28. That said, a break below that zone could see scope for larger bearish implications, perhaps paving the way towards the low of November 10 at 0.6385.
On the upside, a break above 0.6795 may be needed for the picture to be considered bullish. Such a break could confirm the upside exit out of the aforementioned range and may set the stage for advances towards the 0.6920 territory that offered resistance on February 20. If the bulls are not willing to stop there, then they may extend their march towards the peak of February 14 at around 0.7030.
To summarize, AUDUSD has been largely contained within a sideways range since late February, between the 0.6625 and 0.6795 barriers. Therefore, a clear escape in either direction may be needed for the next trending phase to start being examined.
Fed Mester: The point of policy hold not reached yet
Cleveland Fed President Loretta Mester signaled her cautious approach towards interest rate adjustments. She emphasized her desire for the policy rate to reach a level where the next policy change could be equally a potential increase or decrease.
Mester stated at a conference today, "The approach I'm taking is that I would like the policy rate to get to a point where, when I'm thinking about what would the next policy change be, I want it to be equally a potential increase versus a decrease."
Mester further clarified her stance, indicating that once the desired policy rate is achieved, she envisions a period of stability. "When we get the policy to that rate, I think we're going to be holding for a while in order to make sure that the interest rate is coming back down. So I don't put it in terms of a pause, I put it in terms of a hold."
However, she noted that current data doesn't suggest that this rate has been reached yet. Expressing a need for more evidence of inflation trending downwards, Mester insisted on the importance of adhering to the current policy strategy. She said, "I need to see more evidence that inflation is still moving down. I think that we just have to stick with what we're doing."
Pound Ignores Lousy News, Including Labour Market
The UK labour market is deteriorating at an increasing rate. Data released this morning showed that jobless claims rose by 46.7k in April, following a 26.5k increase in March. Analysts had, on average, expected a rise of 31.2k.
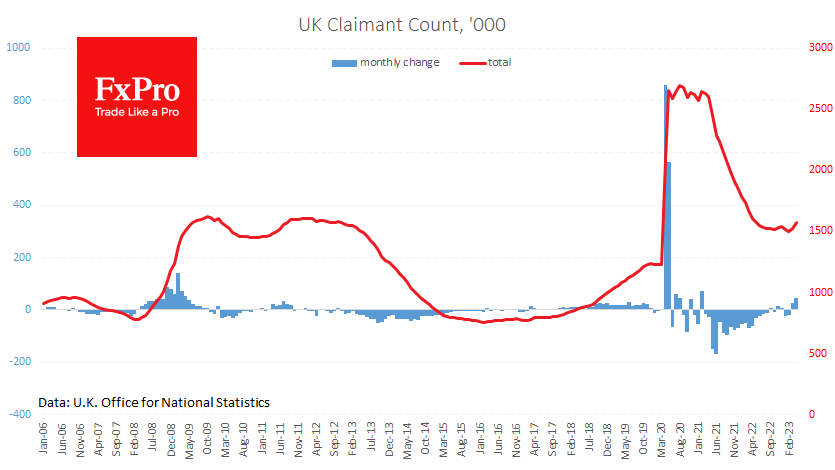
The unemployment rate rose to 3.9% (the highest since January 2022) from a low of 3.5% in August. This turnaround in employment trends has yet to lead to significant wage pressures. Average weekly earnings in the three months to March were up 5.8% year-on-year total pay and 6.7% excluding bonuses. Although this is slightly below expectations, it is difficult to see a reversal of the weakening trend.
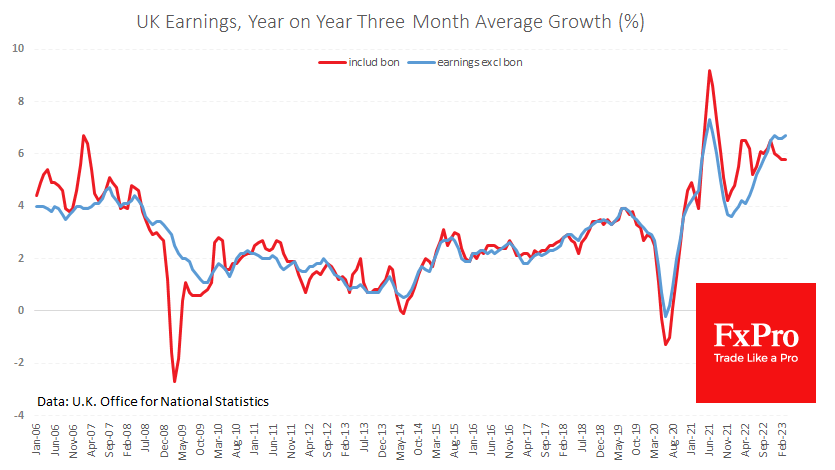
The juxtaposition of two trends – falling employment and rising wages – does not make things any easier for the Bank of England. On the one hand, increasing wages when inflation is already falling is a worrying signal, forcing a further tightening of policy. On the other hand, rising wages create the conditions for an inflationary spiral to take hold despite falling employment.
The GBPUSD reacted to the weak employment figures by falling 0.4% to 1.2465. However, the pair quickly digested the negativity and climbed out of the hole over the next few hours to reach 1.2545. Interestingly, the GBPUSD has rallied on relatively negative economic news this week. On Monday, the IMF said that the UK was the only G7 country facing a recession this year, but that didn’t stop GBPUSD from gaining 0.7%. Too much negativity may be already in prices.
US: Retail Sales Rise in April for the First Time in 3 Months
Retail sales rose 0.4% month-on-month (m/m) in April, roughly half the consensus forecast calling for an increase of 0.8% m/m. March's reading was revised up, changing last month's decline to -0.7% (previously -1.0%). Most of these revisions were due to the release of the 2021 Annual Retail Trade Survey on April 24th which is used as a benchmark for the monthly data.
Sales in the auto sector increased for the first time in three months, largely driven by strength in automotive parts & tire stores (+3.8). Motor vehicle sales rose by slightly less (+0.4%), up from March's upwardly revised decline of -1.4% (previously -1.6%). Excluding autos, retail sales were unchanged at 0.4% m/m.
Sales in other more volatile categories were mixed in April. The building materials and equipment category rose 0.5% m/m while sales at gasoline stations declined 0.8% m/m.
Retail sales in the "control group", which excludes the above categories and is used to estimate personal consumption expenditures (PCE), rose 0.7% m/m, up from a downwardly revised -0.4% m/m reading in March.
The largest gains by spending category were seen by miscellaneous retailers (+2.4% m/m), non-store retailers (+1.2% m/m), and general merchandise stores (+0.9% m/m). Spending at health & personal care stores also saw a 0.9% m/m increase after previously slowing in March.
Categories which continued to see losses in April include sporting goods, hobby, book, & music stores (-3.3% m/m), clothing & accessory stores (-0.3% m/m), and food & beverage stores (-0.2% m/m).
Food services & drinking places – the only services category in today's report – was up by 0.6% m/m in nominal terms but was flat after adjusting for inflation.
Key Implications
The arrival of warmer weather ushered in a moderate rebound in retail spending in April, marking the first increase in three months. However, there were notable downward revisions to 2023Q1, with annualized growth for the first three months of the year now sitting at 4.8% (previously 7%). April's rebound was underpinned by strength in auto spending, building materials & equipment, and general good products. Looking ahead we expect consumer spending to slow over the course of this year as past rate hikes continue to filter through the economy.
Last week we received the second quarter results of the Federal Reserve's Senior Loan Officer Opinion Survey which showed that consumer credit continued to tighten but remained relatively accessible despite recent regional bank stress. While the survey does not track the extent to which commercial banks are tightening credit standards, it did show that consumer demand for financing rose in April relative to January. As many consumers have exhausted their pandemic savings, there is an increasing reliance on financing to deal with elevated prices.
Sunset Market Commentary
Markets
There was a mild risk-off vibe at the European start this morning. Stocks slid 0.4% and core bond yields eased several bps in the US and Germany. But sentiment improved gradually and equities turned flat. Core bond yields bottomed and even show minimal daily gains in the US after the April retail sales. Considering the upward March revisions, the broadest (headline) gauge was more or less in line with expectations. Core measures including the control group (a solid 0.7% m/m) even topped analyst estimates. Seven out of 13 retail categories rose last month. US yields currently add 2.4-3.2 bps across the curve, helped higher by some Fed Mester quotes as well. The non-voting FOMC member said she needs more evidence that inflation is moving down, adding that data shows that rates are not sufficiently restrictive. The 2-y yield is seeking a return above 4%. German yields recouped 4 bps of losses. The dollar is going nowhere. EUR/USD trades unchanged near opening levels of around 1.088. DXY is fillings bids in the 102.4 area. A slew of Fed and ECB speeches due after wrapping up this report as well as the high-level debt ceiling talks may still influence trading later today.
The UK labour market report displayed strength in the first quarter by adding 182k jobs (160k expected) compared to the 2022Q4. The unemployment rate unexpectedly edged up, from 3.8% to a still historically low level of 3.9%. Wage growth accelerated slightly to 6.7% y/y in Q1. This news suggesting a very tight labour market was counterbalanced by the accompanying preliminary job growth estimate for April. The number of payrolled employees fell 136000. This figure is notorious for its often huge revisions but the fact that it was the first drop since February 2021 did not go unnoticed. It also added flavour to yesterday’s Bank of England Pill’s speech. The chief economist said he hoped last week’s 25 bps policy rate rise to 4.5% was the last one. Among the variables whether or not supporting his case for a pause is labour market tightness. UK money markets pared odds for a 5% terminal rate to 20% after the release. UK gilt yields lost up to 10 bps at the front end of the curve. Current changes vary between -2.2 (30-y) and 5 bps (2-y). Sterling lost in a kneejerk reaction but clawed back later. EUR/GBP went from 0.868 at the open towards the 0.8721 resistance after the release and back to (sub) 0.87 at the time of writing.
The Kingdom of Belgium successfully auctioned a €4bn 20y (OLO99, maturing June 22, 2043) bond. Final terms were set at MS+54 bps compared to +55 bps area guidance. Books ran above €19bn. Today’s syndication – the third once this year – included, the debt agency has completed about 58% of its €45bn OLO funding need for this year.
News & Views
The Hungarian Statistical Office (KSH) reported a first estimate of Q1 GDP growth. Economic activity in the country was 0.9% y/y. According to KSH, the industry was the largest contributor to the decrease. The good performance of agriculture and of services moderated the decline. The main contributor to the growth in services was health activities, approximating the level before the coronavirus pandemic. Activity shrank 0.2% Q/Q, after a decline of 0.6% and 0.8% in Q4 2022 and Q3 2022 respectively. Even so, it was less than the -0.7% feared. The forint remains well bid. At EUR/HUF 369, the Hungarian currency trades near the strongest level since April last year. This gives the MNB a chance to start reducing the emergency 18% O/N depo rate, probably already at next week’s policy meeting.
Poland also reported better than expected Q1 growth. Activity rebounded 3.9% Q/Q after a 2.3% contraction in the 2022Q4. A regular first estimate with details on growth composition will only be published May 31. The National Bank of Poland also published April core CPI. Inflation less food and energy was reported at 1.2% M/M and 12.3% Y/Y (1.3% M/M and 12.3 % Y/Y in March). Underlying dynamics thus remain elevated. Other core measures eased slightly more (ex. administered prices 0.7% M/M and 14.0% Y/Y from 15.7%, ex. most volatile prices 0.8% M/M and 15.3% Y/Y from 16%). Earlier this month, headline CPI was reported at 0.7% M/M and 14.7% Y/Y. At its May 10 policy meeting the NBP kept a wait-and-see approach. However, Polish interest rate markets this week underperformed the region as the government announced additional 2024 fiscal/social spending in the run-up to the election expected in autumn. This might further fuel inflation and delay future NBP rate cuts. The zloty this week extended its impressive rally. EUR/PLN is extensively testing the February 2022 low (4.4826).
Canada: Inflation Takes a Breather from its Downward Trek in April
Consumer price inflation surprised in April, ticking up to 4.4% year-on-year (y/y), from 4.3% in March. That was against market expectations for a slight deceleration.
Prices at the pump were a key part of the surprise, rising 6.3% on the month. Even with that steep monthly increase, gasoline prices were 7.7% below year ago levels when oil prices spiked in the early days of Russia's invasion of Ukraine.
Consumers did get some good news on their grocery bills, as inflation there cooled to 9.1% y/y in April from 9.7% in March.
Thankfully, shelter inflation moved in the right direction in April, up 4.9% y/y, down from 5.4% y/y in March. Homeowners' replacement costs continued to slow to 0.2% y/y in April reflecting a general cooling in the housing market. However, mortgage interest cost inflation keeps getting worse – up 28.5% versus a year ago in April.
Switching gears from March, core goods inflation ticked up a bit to 3.5% y/y in April from 3.3% in March. However, the good news is that "supercore" inflation – a measure of core services inflation – decelerated to 5.7% in April from 6.3% in March.
The Bank of Canada's underlying inflation pressures cooled modestly in April. CPI-trim eased to 4.2% y/y (4.4% in Mar.) and CPI-median at 4.2% y/y (4.5% in Mar.). However, looking at the recent monthly trends, there has been a slight heating up recently with CPI- trim on a three-month annualized basis at 3.7% and median at 3.8%, up from 3.3% and 3.6% in March.
Key Implications
Headline inflation took a breather on it's trek down the mountain in April thanks to surging gasoline prices. We expect the pause will be temporary and inflation will resume heading lower in the months ahead. As outlined in our March forecast, we expect core inflation to continue to decelerate below 3% y/y in the second half of the year, as does the Bank of Canada.
Cooler inflation for demand-sensitive services inflation, or "supercore" was the most encouraging development of the report, even though it was somewhat offset by hotter inflation for goods. This reinforces the challenge Governor Macklem has talked about in bringing inflation all the way back to 2%. This suggests that the BoC needs to remain vigilant to inflation pressures, and may need to hike again if momentum in the domestic economy does not cool as expected.
EUR/USD Mid-Day Outlook
Daily Pivots: (S1) 1.0850; (P) 1.0870; (R1) 1.0870; More...
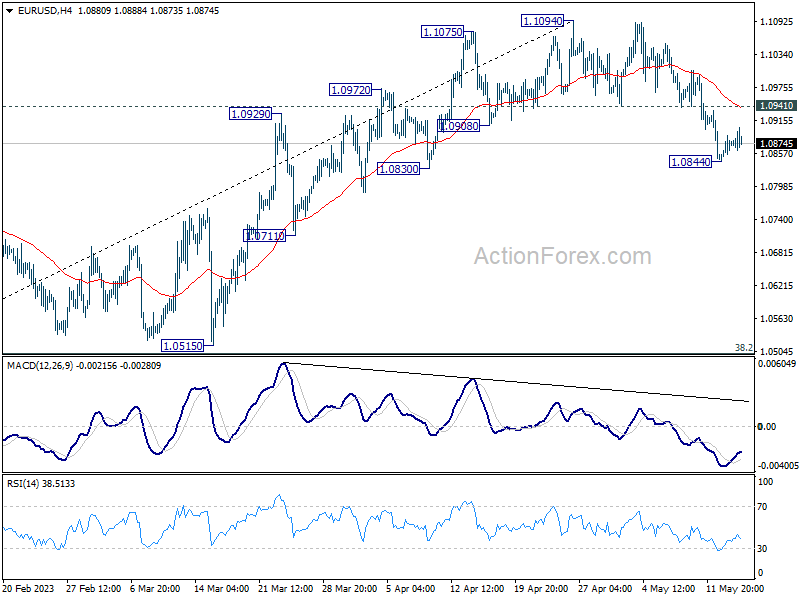
Intraday bias in EUR/USD is turned neutral first as consolidation from 1.0844 temporary low is extending. Further decline is expected as long as 1.0941 resistance holds. Fall from 1.1094 short term top is seen as correcting whole up trend from 0.9534. Below 1.0844 will target 1.0515 cluster support, 38.2% retracement of 0.9534 to 1.1094 at 1.0498. On the upside, though, above 1.0941 resistance will turn bias back to the upside for retesting 1.1094 high.
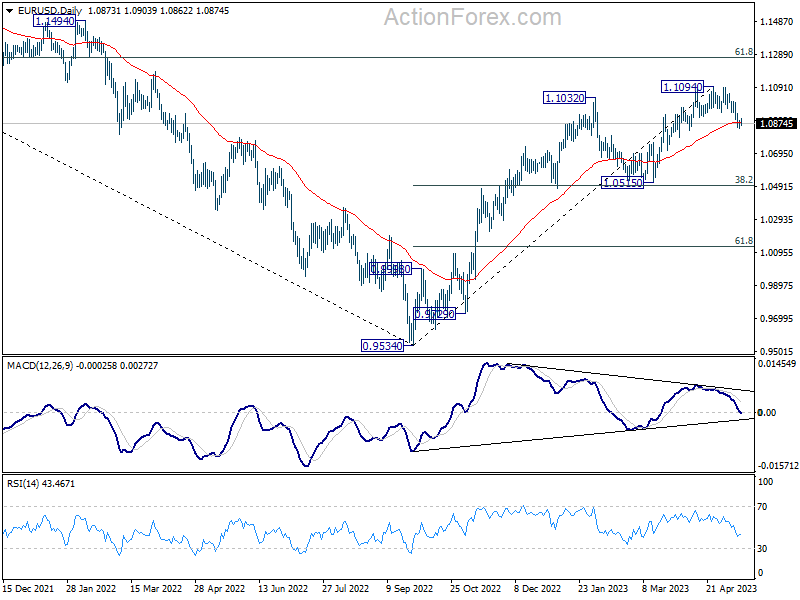
In the bigger picture, as long as 1.0515 support holds, rise from 0.9534 (2022 low) would still extend higher. Sustained break of 61.8% retracement of 1.2348 (2021 high) to 0.9534 at 1.1273 will solidify the case of bullish trend reversal and target 1.2348 resistance next (2021 high).
GBP/USD Mid-Day Outlook
Daily Pivots: (S1) 1.2470; (P) 1.2503; (R1) 1.2560; More...
Intraday bias in GBP/USD stays neutral as range trading continues. On the downside, firm break of 1.2434 will confirm short term topping at 1.2678, on bearish divergence condition in 4H MACD. Intraday bias will be back on the downside for 1.1801 cluster support (38.2% retracement of 1.0351 to 1.2678 at 1.1789), as correction to whole up trend from 1.0351. On the upside, however, break of 1.2678 will resume larger up trend from 1.0351 instead.
In the bigger picture, as long as 1.1801 support holds, rise from 1.0351 medium term bottom (2022 low) is expected to extend further. Sustained break of 61.8% retracement of 1.4248 (2021 high) to 1.0351 at 1.2759 will add to the case of long term bullish trend reversal. However, firm break of 1.1801 will indicate rejection by 1.2759, and bring deeper decline, even as a correction.
USD/CHF Mid-Day Outlook
Daily Pivots: (S1) 0.8937; (P) 0.8962; (R1) 0.8982; More...
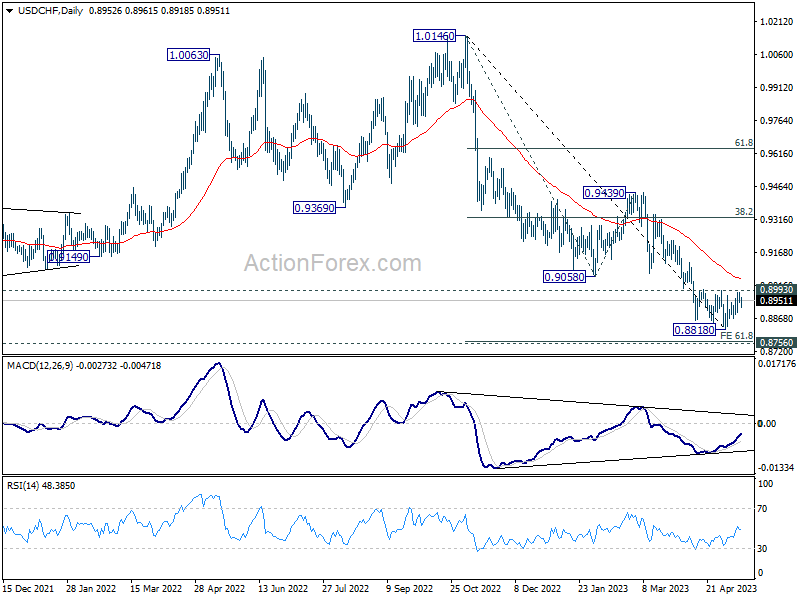
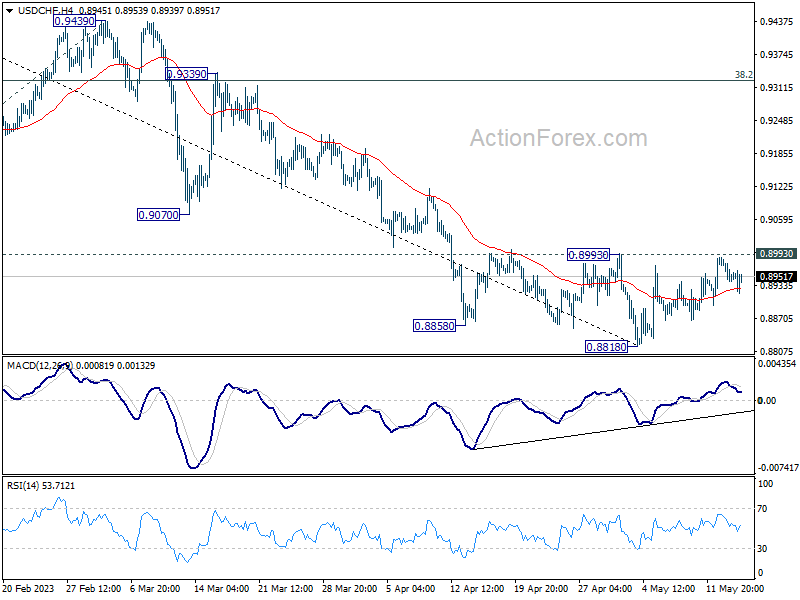
Intraday bias in USD/CHF remains neutral for the moment and outlook is unchanged. On the upside, decisive break of 0.8993 resistance will confirm short term bottoming at 0.8818, on bullish convergence condition in 4H MACD. Intraday bias will be turned back to the upside for 55 D EMA (now at 0.9040) and possibly above. In case of another fall, strong support should be seen from 61.8% projection of 1.0146 to 0.9058 from 0.9439 at 0.8767, which is close to 0.8756 long term support, to bring rebound.
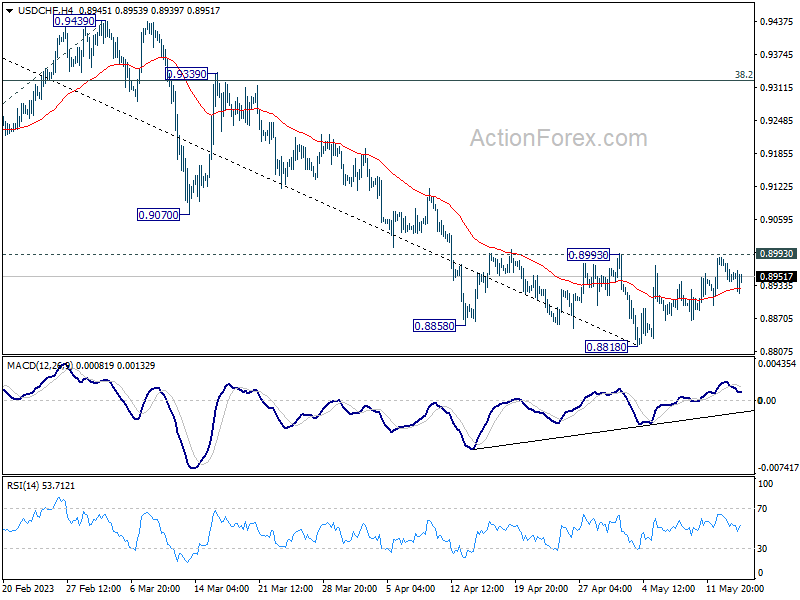
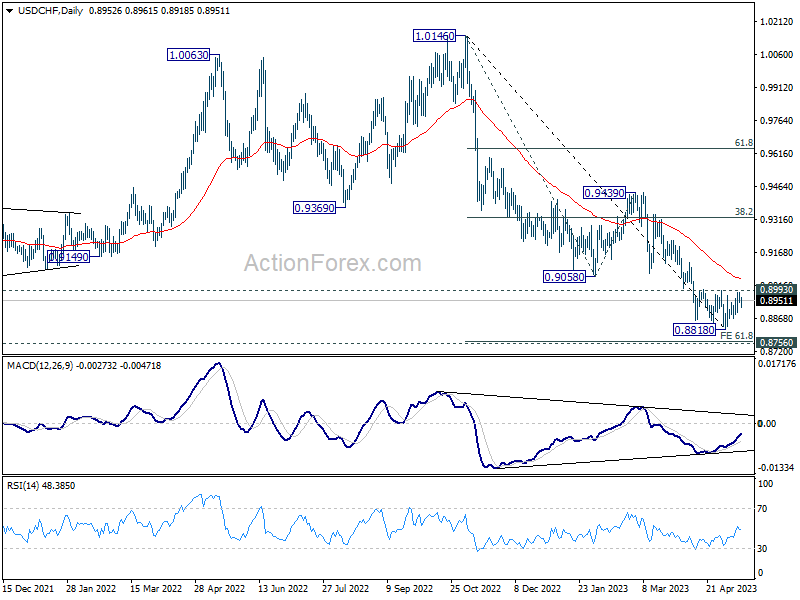
In the bigger picture, fall from 1.1046 (2022 high) is seen as a leg in the long term range pattern from 1.0342 (2016 high). So, downside should be contained by 0.8756 to bring reversal. Sustained break of 0.9058 support turned resistance will be the first sign of medium term bottoming. However, decisive break of 0.8756 will carry larger bearish implications.