

Sample Category Title
Fed Jefferson highlights persistent inflation challenges amid slowing progress
Fed Governor and Vice Chair Nominee, Philip Jefferson, has given a sobering assessment of the ongoing inflationary pressures that US economy is wrestling with. In a speech, he highlighted that, while inflation has decreased significantly since last summer, the high levels persist and progress in mitigating them appears to be slowing.
Jefferson made it clear that tackling inflation remains a substantial challenge. He stated, "While inflation has come down substantially since last summer, it is still too high, and by some measures progress has been slowing." Moreover, he underscored that "outside of energy and food, the progress on inflation remains a challenge."
The Vice Chair Nominee then offered a more granular perspective on core inflation, distinguishing between core goods inflation, housing services inflation, and nonhousing services inflation.
Jefferson noted, "Core goods inflation fell sharply over the second half of 2022 as supply-chain bottlenecks eased, but more recently it has stabilized at around 2.6 percent."
Housing services inflation, which includes rent and the equivalent for owner-occupied homes, was another key point of discussion. He pointed out that "Housing services inflation, which is 8.2 percent on a 12-month basis. Housing is a big part of inflation, and while rent increases on new leases have come down considerably over the past year, it will take some time for this softening in rents to show through to the 12-month changes."
As for nonhousing services, the largest component of services, inflation remains stubbornly high at around 4.5% with no substantial decrease in sight.
ETHUSD Analysis: Bullish Engulfing Pattern above $1,785
Bulls were able to take control of the market, and after touching a low of $1,785 on 17 May, the ETHUSD pair started moving upwards, with strong demand seen above $1,800.
On the H1 timeframe:
- ETHUSD is supported by bulls after its decline below the $1,800 handle with immediate targets of $1,850 and $1,900.
- The bullish engulfing pattern is above the $1,785 handle. It's a bullish pattern, which signifies the end of a bearish phase.
- The relative strength index is at 59.28, indicating a strong demand for Ether and a continuation of a buying sentiment in the market.
- Both the STOCH and ADX are giving a neutral signal, meaning that the Ethereum price is expected to remain in the consolidation phase in the short-term range.
- ETH price is now trading above the 100-hour simple and 200-hour exponential moving averages.
- ETH price bullish reversal is seen above the $1,785 mark.
- The average true range indicates low market volatility.
- The ultimate oscillator indicator provides a neutral signal.
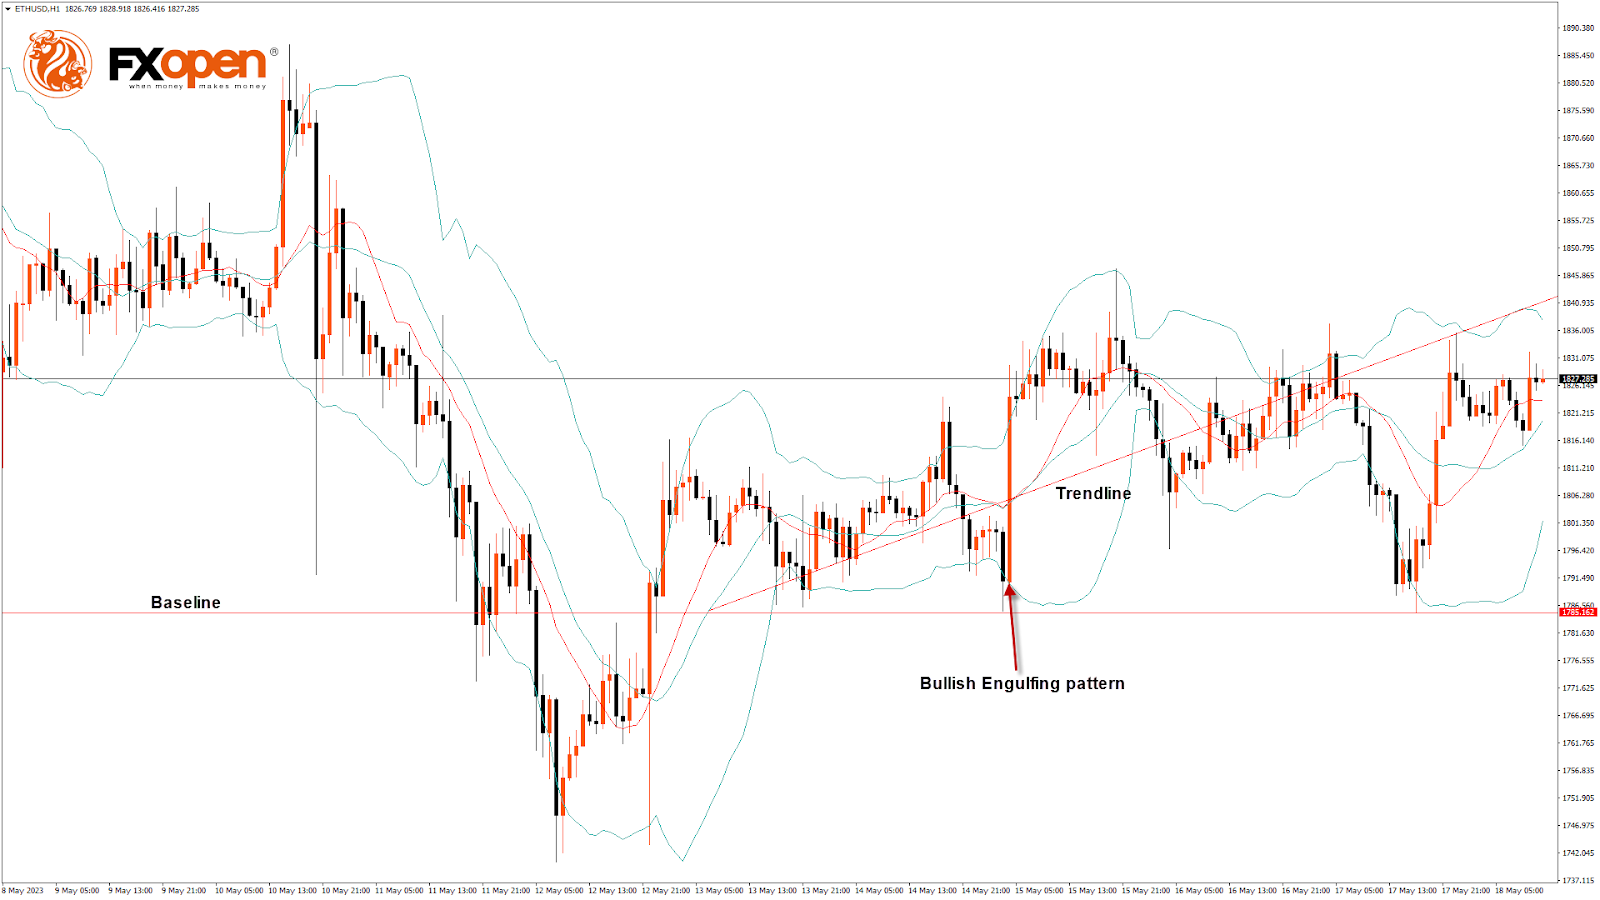
ETH Bullish Reversal Seen above $1,785
On the D1 timeframe:
- ETH price is trading just above its pivot level of $1,825 and is moving into a mild bullish channel.
- The price is about to break its classic resistance level of $1,833 and its Fibonacci resistance level of $1,839; further supports are $1,742 and $1,755.
- We can see the formation of a bullish engulfing pattern.
- The short-term range is expected to be mildly bullish.
- The resistance of the triangle and channel is broken.
On the weekly timeframe:
- The market opened bullish.
- The price is back over the pivot point.
- Some of the technical indicators signal a neutral tone in the market.
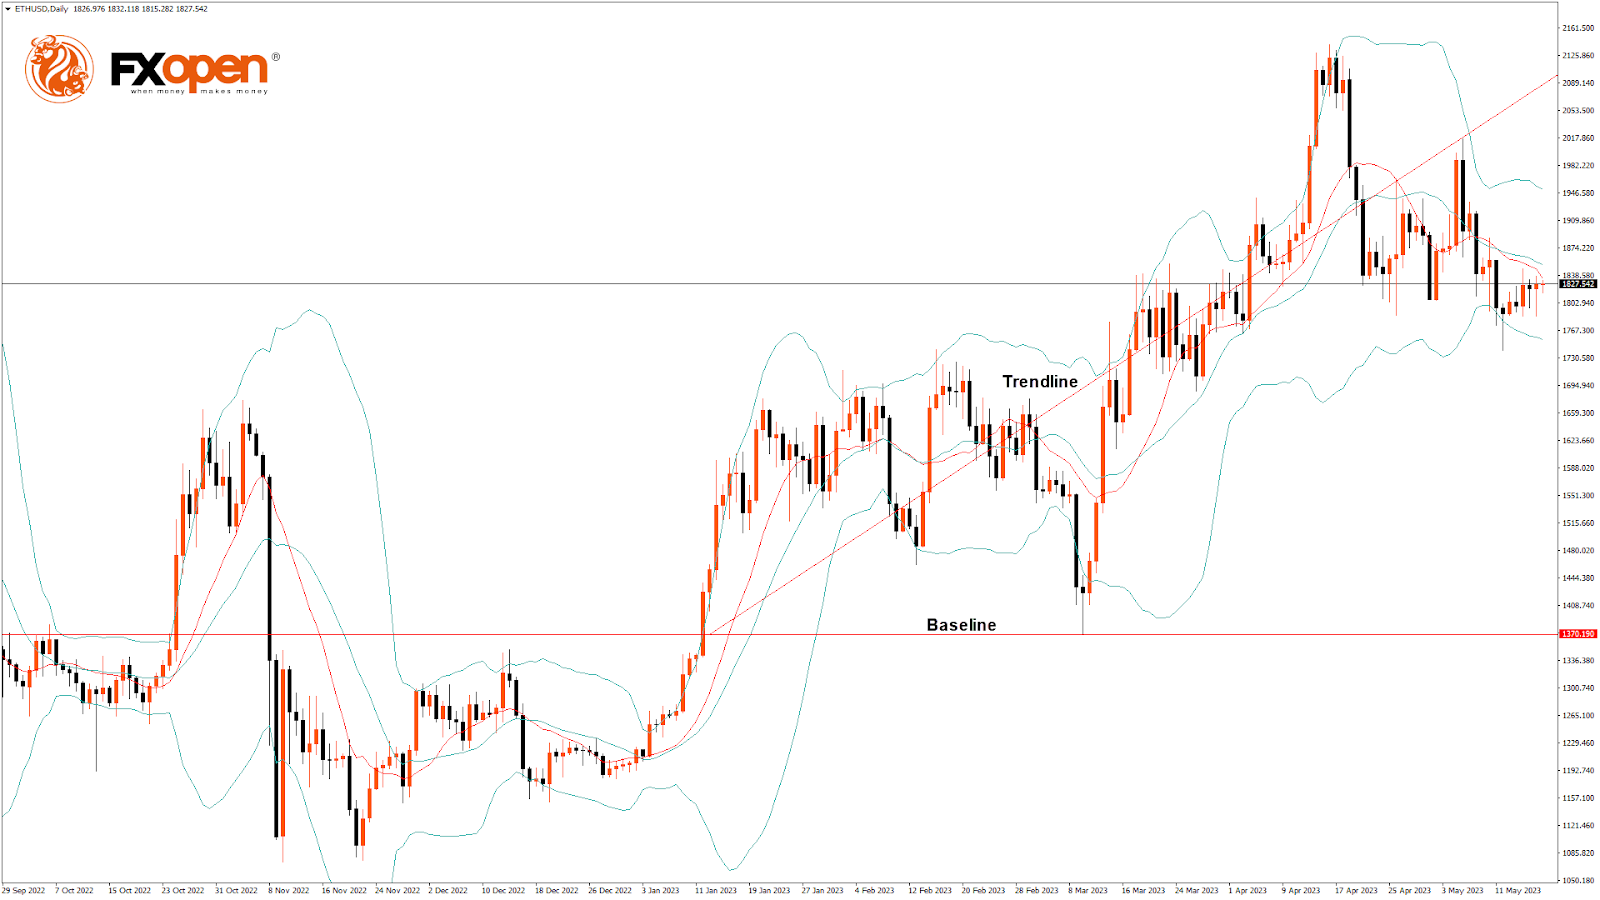
Most of the technical indicators are bullish. Most moving averages are bullish at the current market level of $1,826.
The key support levels to watch are $1,796, which is a 14-3 day raw stochastic at 20, and $1,816, which is a pivot point.
The Week Ahead
The Ethereum to USD exchange rate continues to correct higher, above $1,800, reflecting the bullish momentum and is expected to move towards the $1,850 level in the medium-term range in the H1 timeframe.
We see a short-term bullish trend line forming from $1,785 towards $1,842.
The immediate short-term outlook for ETH has turned mildly bullish, the medium-term outlook has turned bullish, and the long-term outlook is neutral in present market conditions.
The resistance zone is at $1,839, at which the price crosses a 18-day moving average, and at $1,852, which is a 14-day RSI at 50.
The weekly outlook for Ethereum price is $1,900, with a consolidation zone around $1,850.
LTCUSD Analysis: Inverted Hammer Pattern above $79.64
Bulls were able to take control of the market last week, and after touching a low of $79.64 on 13 May, the price started to correct higher against the US Dollar, crossing the $94.00 handle today in the European trading session.
The short-term outlook for Litecoin has turned mildly bullish.
On the H1 timeframe:
- There is an inverted hammer pattern above the $79.64 handle. It signifies the end of a bearish phase and the start of a bullish phase in the market.
- Litecoin price is trading above its 100-hour simple moving average and 200-hour exponential moving average and just above its pivot level of $92.97.
- The relative strength index is at 69.02, indicating a strong demand for Litecoin and a shift towards the bullish phase in the markets.
- Litecoin remains above most of the moving averages, which is a bullish signal at current market levels of $93.20.
- Some of the technical indicators are bullish.
- The average true range indicates low market volatility.
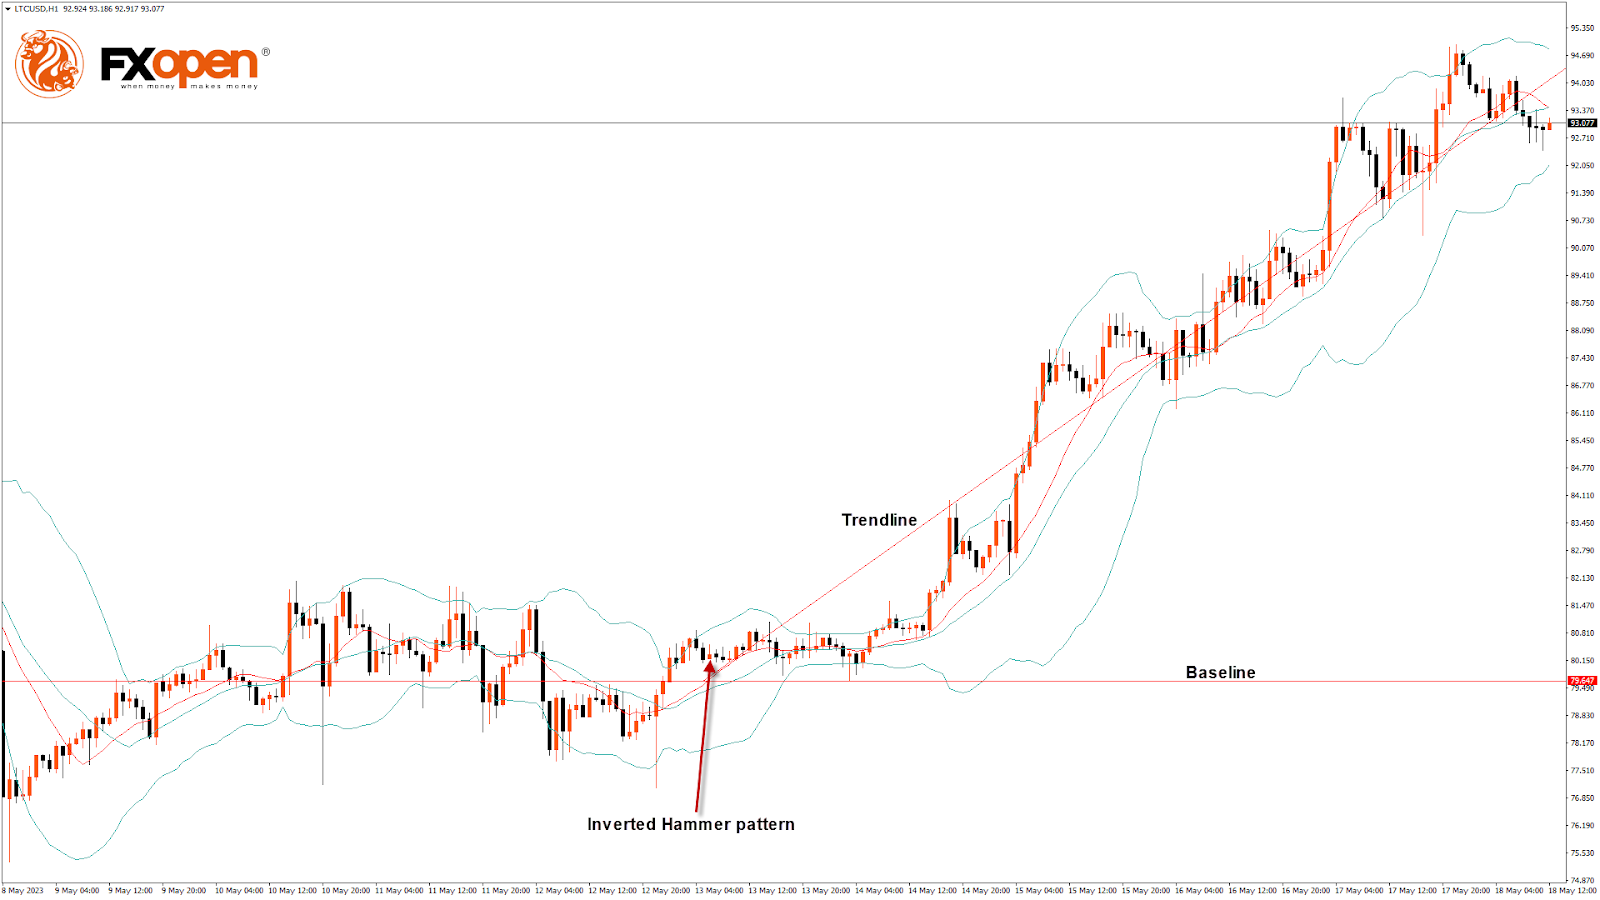
Litecoin Bullish Reversal Seen above $79.64
On the D1 timeframe:
- Litecoin continues to move in a bullish momentum after its recent decline below $80.00.
- Litecoin to USD exchange rate is ranging above $90.00 with more upsides at $94 and $95 levels.
- The resistance of the channel is broken.
On the weekly timeframe:
- The market opened bullish.
- We can see the formation of the morning star pattern, which indicates a bullish trend.
- We can see the formation of a bullish price crossover pattern with 20- and 50-period adaptive moving averages.
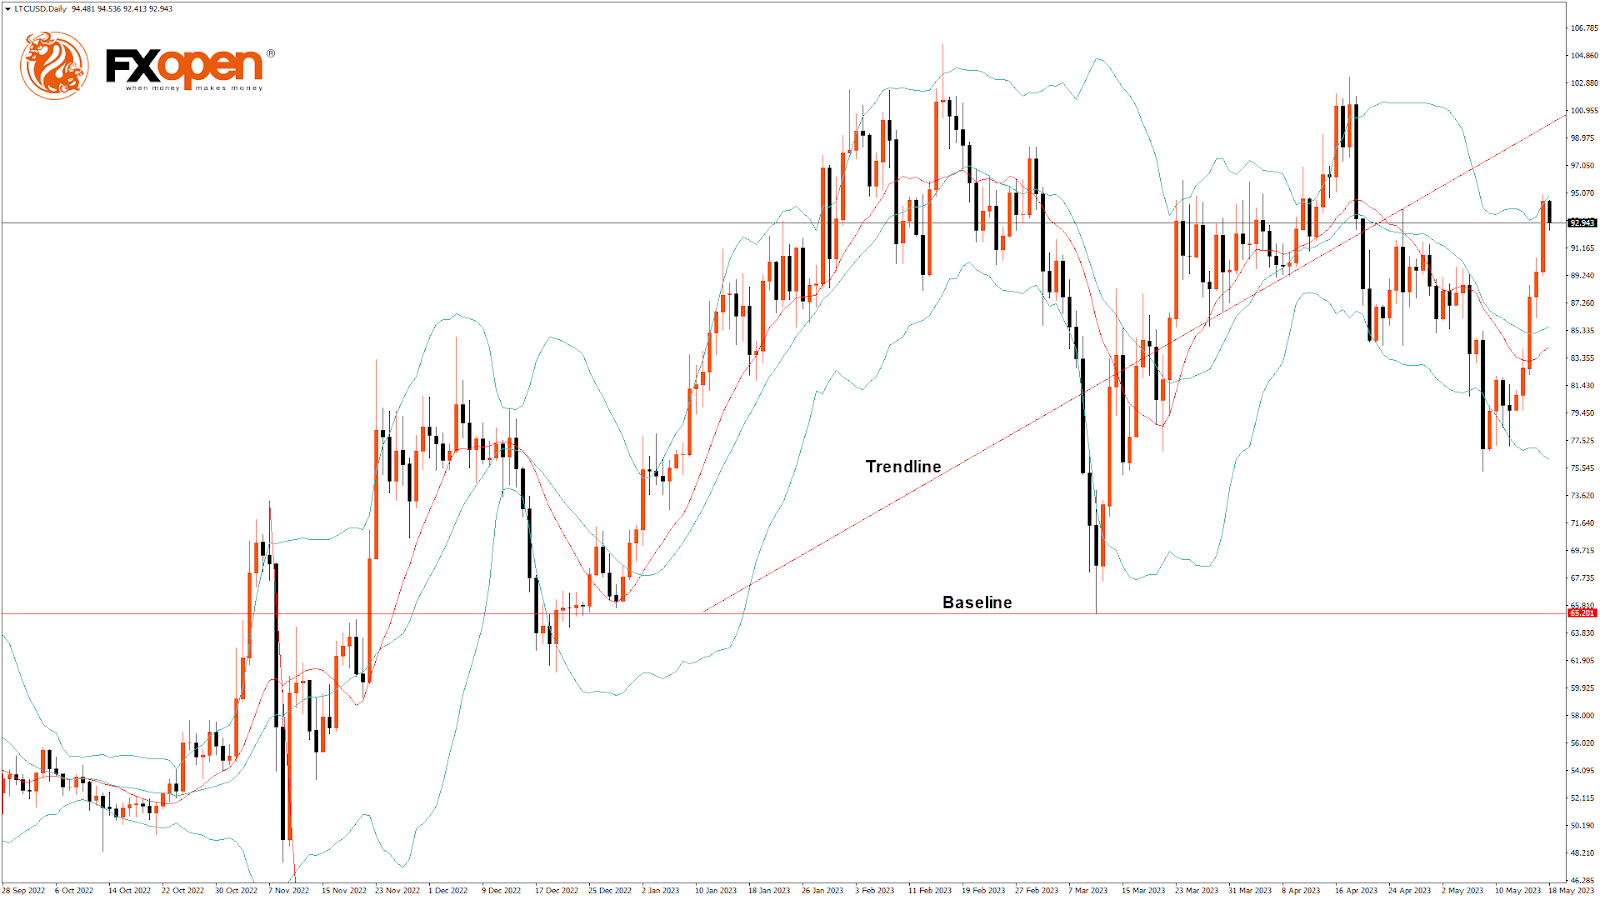
LTCUSD is about to break its classic resistance level of 93.55 and Fibonacci resistance level of 94.18, after which the path towards $95 will get cleared.
Litecoin faces resistance at $96.53, which is a pivot point’s first resistance level, and at $98.58, which is a pivot point’s second resistance level.
The Week Ahead
Litecoin price continues to correct higher against the US Dollar, and a strong bullish momentum is visible, with further upsides located at $95 and $100.
Most technical indicators signal a bullish sentiment in the market.
Litecoin price should stay above the important support level of $87.40, which is a 14-day RSI at 50, and at $88.65, at which the price crosses the 9-day moving average.
The weekly projection for Litecoin price is $98, with a consolidation zone near $95.
The short-term outlook for Litecoin has turned strongly bullish, the medium-term outlook is bullish, and the long-term outlook is neutral at present market conditions.
The Stock Market Has Helped Crypto
Market picture
The crypto market capitalisation rose 0.55% over the past 24 hours to 1.134 trillion. Late Wednesday afternoon, another attempt was made to break above 1.14 trillion, following the US stock market rally on the government debt ceiling news. However, it has so far failed to stay in this territory.
Bitcoin is up 0.7% at $27.2K, staying within the recovery trend that has been in place since the 12th. However, this recovery is painfully slow, and local resistance at $27.5K, which has been supporting since late March, remains in place.
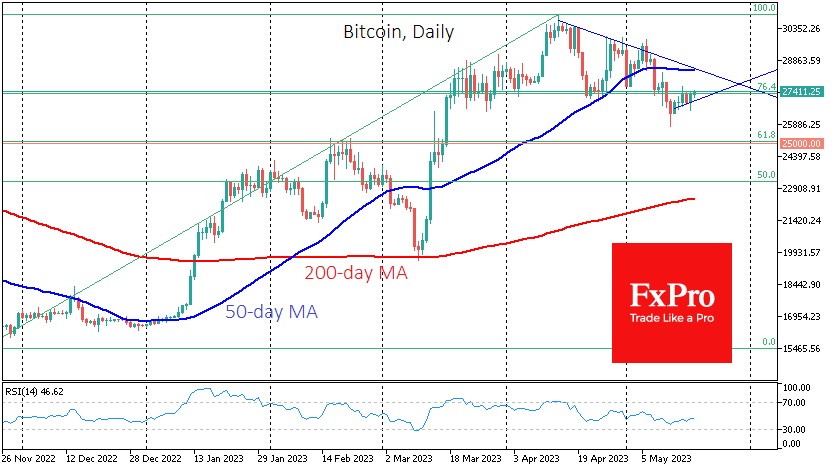
According to Santiment, large Bitcoin holders continue accumulating BTC – over the past five weeks, cryptocurrency holdings have increased by nearly 85,000 BTC ($2.3 billion). Santiment believes Bitcoin is now in a consolidation phase before a new surge.
News background
The stock and cryptocurrency markets will collapse if the US defaults, says Mike McGlone, senior strategist at Bloomberg Intelligence. He is bearish on cryptocurrencies but bullish on gold.
Lightning Labs, the developer of the Lightning Network, announced the release of Taproot Assets Protocol v 0.2, which avoids potential delays in transaction processing due to congestion on the Bitcoin network.
The UK Parliament has proposed regulating cryptocurrencies as gambling. Crypto assets can potentially be used for fraud and money laundering, posing a high risk to consumers and the economy.
Tether’s issuance team has decided to invest up to 15% of its net profits in Bitcoin monthly to diversify its reserves. It has already invested $1.5 billion in BTC. The bulk of USDT’s collateral is still in short-term US Treasuries.
According to a Bloomberg survey, only 31 of the top 60 cryptocurrency companies have successfully undergone external financial audits or confirmed reserves. Many auditors are reluctant to work with cryptocurrency companies or need more expertise.
EUR/USD Mid-Day Outlook
Daily Pivots: (S1) 1.0808; (P) 1.0841; (R1) 1.0872; More...
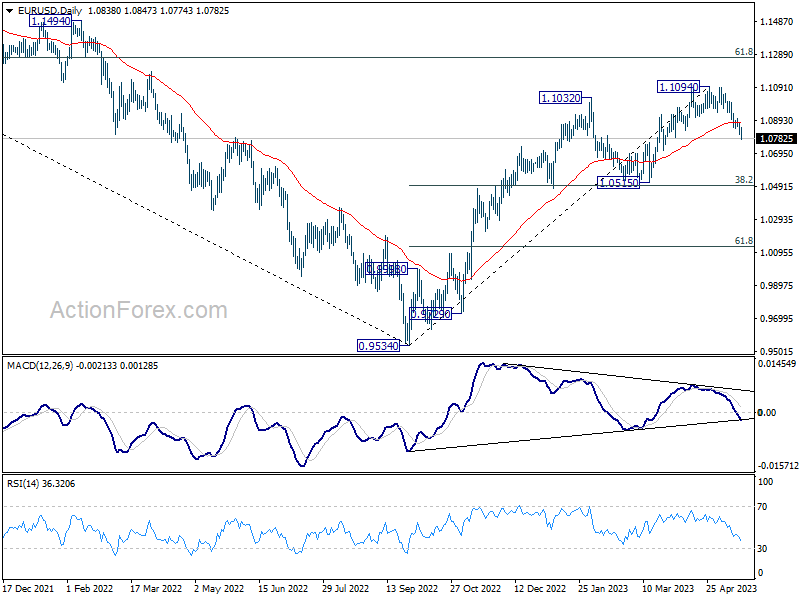
EUR/USD's decline from 1.1094 is still in progress and intraday bias stays on the downside. As a correction to whole up trend from 0.9534, current fall should target 1.0515 cluster support, 38.2% retracement of 0.9534 to 1.1094 at 1.0498. On the upside, above 1.0848 minor resistance will turn intraday bias neutral first.
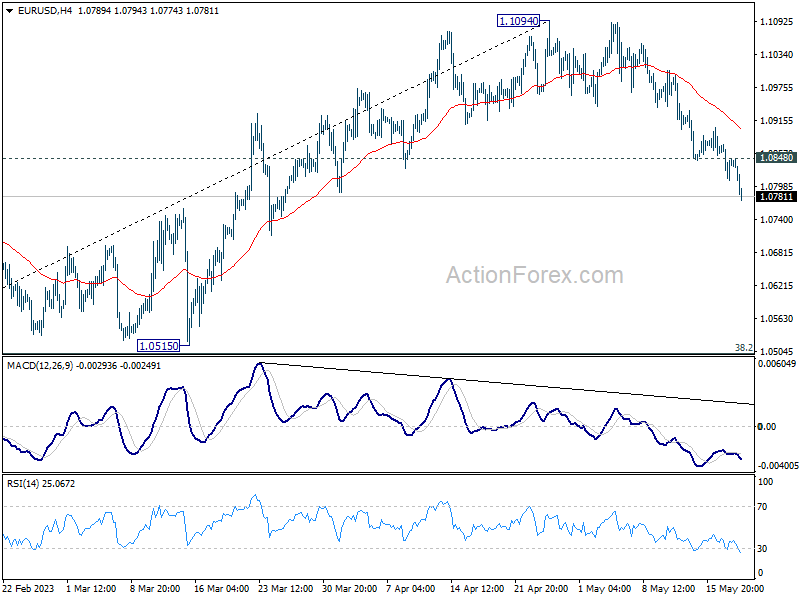
In the bigger picture, as long as 1.0515 support holds, rise from 0.9534 (2022 low) would still extend higher. Sustained break of 61.8% retracement of 1.2348 (2021 high) to 0.9534 at 1.1273 will solidify the case of bullish trend reversal and target 1.2348 resistance next (2021 high).
GBP/USD Mid-Day Outlook
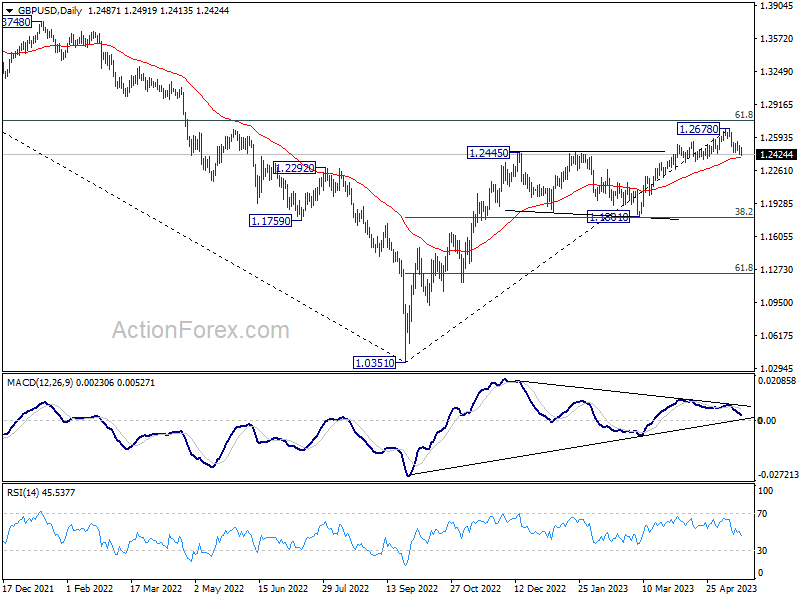
Daily Pivots: (S1) 1.2436; (P) 1.2473; (R1) 1.2524; More...
GBP/USD's break of 1.2434 support confirms short term topping at 1.2678. Considering bearish divergence condition in D MACD, it's probably corrective whole up trend from 1.0351. Intraday bias is now on the downside. Sustained trading below 55 D EMA (now at 1.2392) will affirm this case, and pave the way to 1.1801 cluster support (38.2% retracement of 1.0351 to 1.2678 at 1.1789). On the upside, above 1.2545 minor resistance will turn intraday bias neutral first.
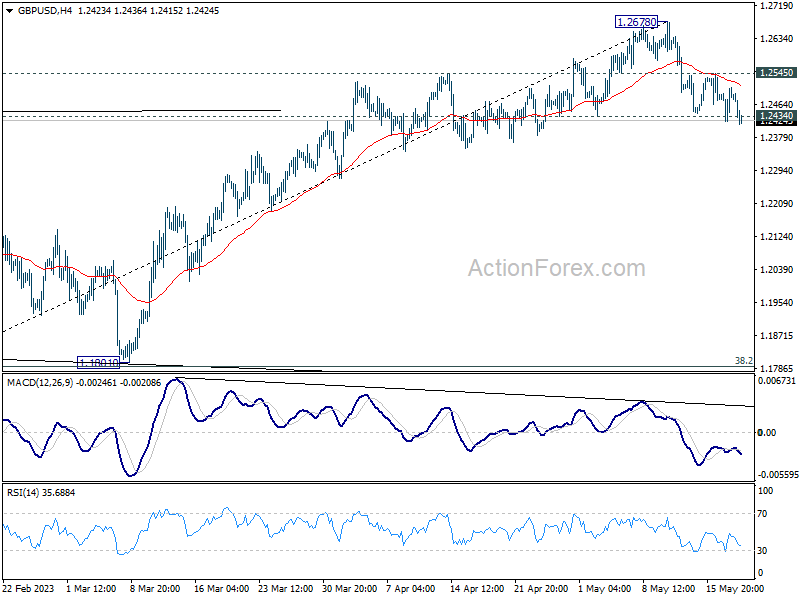
In the bigger picture, as long as 1.1801 support holds, rise from 1.0351 medium term bottom (2022 low) is expected to extend further. Sustained break of 61.8% retracement of 1.4248 (2021 high) to 1.0351 at 1.2759 will add to the case of long term bullish trend reversal. However, firm break of 1.1801 will indicate rejection by 1.2759, and bring deeper decline, even as a correction.
USD/CHF Mid-Day Outlook
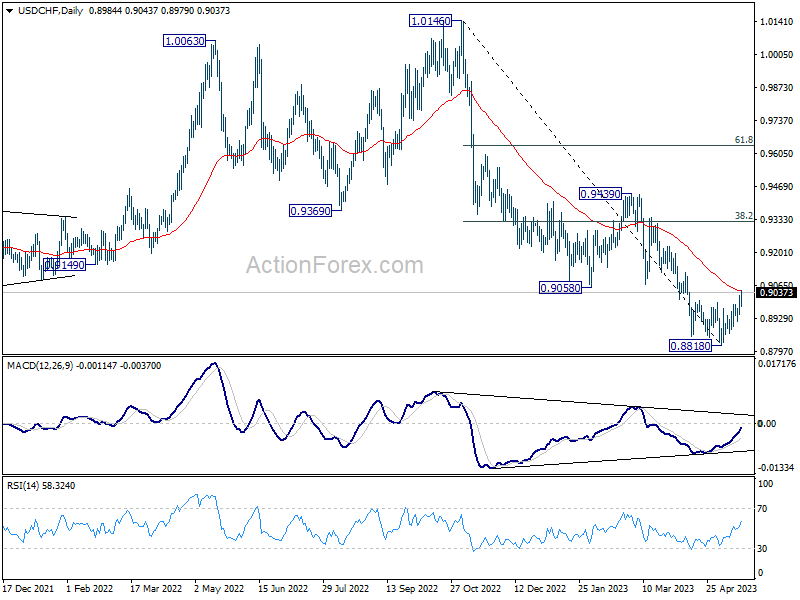
Daily Pivots: (S1) 0.8947; (P) 0.8987; (R1) 0.9024; More...
Intraday bias in USD/CHF remains on the upside as rise from 0.8818 short term bottom is extending. Sustained trading above 55 D EMA (now at 0.9042) should confirm that current rally is at least correcting whole down trend from 1.0146. Further rise should then be seen to 38.2% retracement of 1.0146 to 0.8818 at 0.9325. On the downside, below 0.8977 minor support will turn intraday bias neutral first.
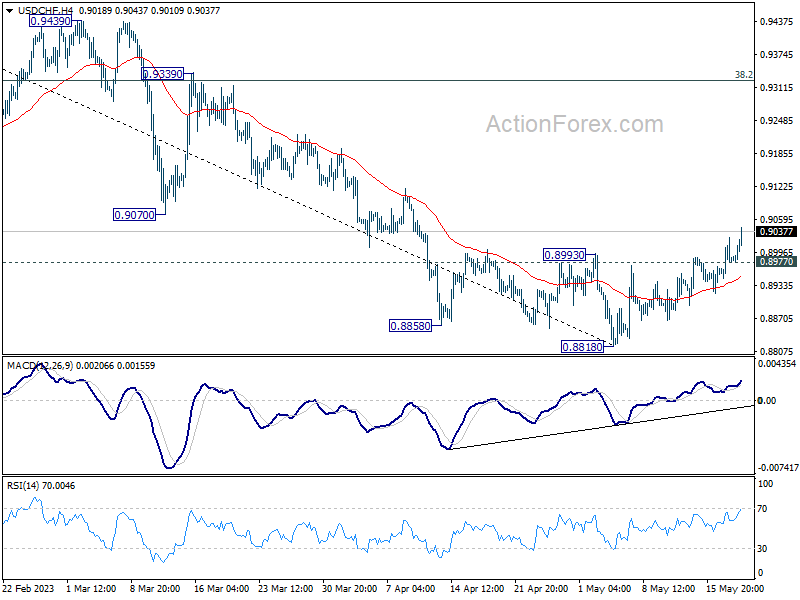
In the bigger picture, fall from 1.1046 (2022 high) is seen as a leg in the long term range pattern from 1.0342 (2016 high). So, downside should be contained by 0.8756 to bring reversal. Sustained break of 0.9058 support turned resistance will be the first sign of medium term bottoming. However, decisive break of 0.8756 will carry larger bearish implications.
USD/JPY Mid-Day Outlook
Daily Pivots: (S1) 136.78; (P) 137.24; (R1) 138.18; More...
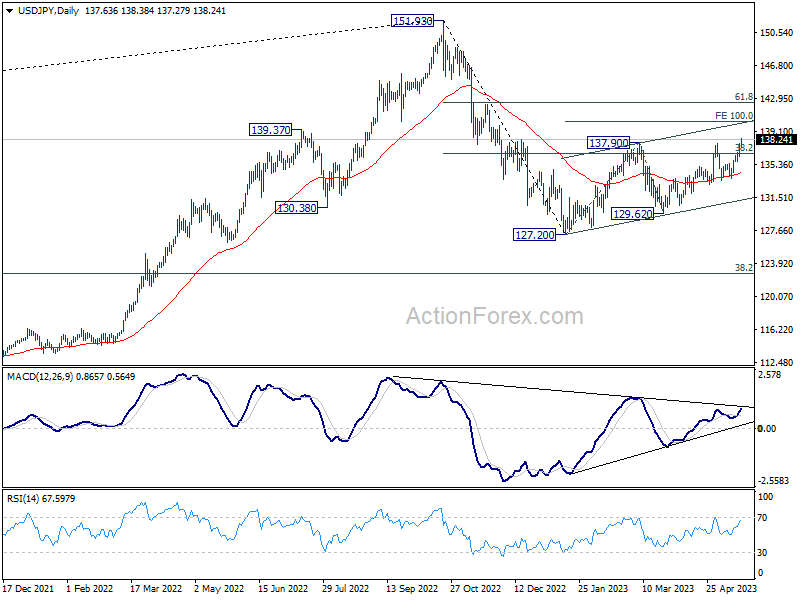
USD/JPY's rally continues today and break of 137.90 resumes indicate resumption of whole rebound from 127.20. Intraday bias stays on the upside. Next target is 100% projection of 127.20 to 137.90 from 129.62 at 140.32. Break there will target 142.48 fibonacci level. On the downside, below 137.27 minor support will turn intraday bias neutral first.
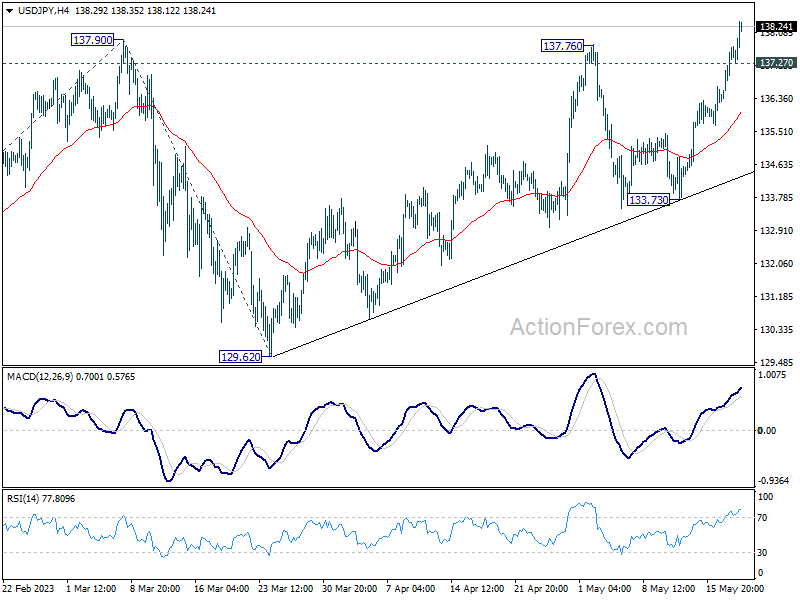
In the bigger picture, price actions from 151.93 high are currently seen as a corrective pattern to the long term up trend. The first leg should have completed at 127.20. Rebound from there is seen as the second leg. Sustained break of 38.2% retracement of 151.93 to 127.20 at 136.34 will bring stronger rise to 61.8% retracement at 142.48. Meanwhile, break of 129.62 will argue that the third leg is starting through 127.20 low.
Dollar Extends Rally, Gold Breaks Key Support
Dollar continues to power up today, as traders are rethinking Fed's policy path ahead. The odds of a hold at June 14 FOMC meeting has dropped to around 60%, as the economy continued to show resilience. The strong stock market rally this week is also helping. Canadian Dollar is currently following as second best, and then Swiss Franc. Aussie is the worst performer for the day so far, followed by Euro and Kiwi. While Yen is still the biggest loser for the week, selling has somewhat slowed a bit.
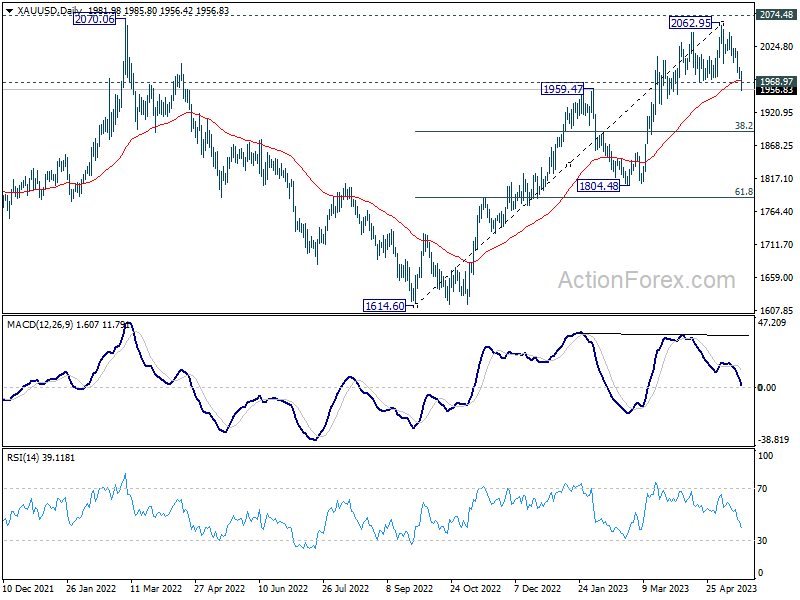
Technically, Gold has finally taken out 1968.97 key near term support, as well as 55 D EMA today, as selloff from 2062.95 extends. The development should confirm rejection by 2074.48 record high. Fall from 2062.95 is at least a correction to rise from 1614.60, with potential as the fifth leg of the long term sideway pattern from 2074.48. In either case, deeper decline is now expected to 38.2% retracement of 1614.60 to 2062.95 at 1891.69.
In Europe, at the time of writing, FTSE is up 0.38%. DAX is up 1.17%. CAC is up 0.62%. Germany 10-year yield is up 0.0971 at 2.438. Earlier in Asia, Nikkei rose 1.60%. Hong Kong HSI rose 0.85%. China Shanghai SSE rose 0.40%. Singapore Strait Times rose 0.27%. Japan 10-year JGB yield rose 0.0156 to 0.385.
Fed Logan: We haven't yet made the progress we need to make
Dallas Fed Lorie Logan said in speech, "after raising the target range for the federal funds rate at each of the last 10 FOMC meetings, we have made some progress."
Logan noted, "The data in coming weeks could yet show that it is appropriate to skip a meeting. As of today, though, we aren't there yet."
Addressing the inflation target, Logan emphasized the challenges that remain. "We haven't yet made the progress we need to make. And it's a long way from here to 2% inflation," she remarked.
US initial jobless claims dropped back to 242k, below expectation
US initial jobless claims dropped -22k to 242k in the week ending May 13, below expectation of 260k. Four-week moving average of initial claims dropped -1k to 244k.
Continuing claims dropped -8k to 1799k in the week ending May 6. Four-week moving average of continuing claims dropped -15.5k to 1812.5k.
BoE Bailey not seeing balance sheet returning to pre-financial crisis levels
In his remarks to the Treasury Committee, BoE Governor Bailey commented that he does not foresee the BoE's balance sheet returning to pre-financial crisis levels. Instead, he envisages a more proactive adjustment strategy, stating, "The Bank wants to adjust its balance sheet so that it has headroom to do whatever it might need to do in the future. It does not want its balance sheet to simply get larger after every economic shock."
In a rebuttal to critics linking the UK's inflation surge to QE policies, Bailey downplayed the connection, suggesting that the impact of COVID-19 supply chain disruptions was likely time-limited. "If the only shock that the world had experienced was that one [the Covid-19 supply chain disruption] then I think the evidence now suggests it had a limited time period. Unfortunately, of course, Ukraine came along, and there was no gap between these shocks," he explained.
Deputy governor Ben Broadbent supported Bailey's perspective, noting that the UK, along with other regions such as the US and the Eurozone, had engaged in a decade of QE without witnessing an inflation problem or robust money growth.
Addressing concerns about housing prices, Bailey refuted suggestions that the BoE's policies had contributed to a surge. "Actually, the period in which the house price to income ratio rose most was the period of 10 years before 2007. That was the period when it rose most substantially. It hasn't done the same thing since then," he noted.
Australia employment down -4.3k in Apr, unemployment rate up to 3.7%
Australia employment contracted -4.3k in April, much worse than expectation of 25k growth. Full time job decreased -27.1k while part-time jobs rose 22.8k. Unemployment rate rose from 3.5% to 3.7%, above expectation of being unchanged at 3.5%. Participation rate dropped -0.1% to 66.7%. Employment-to-population ratio fell -0.2% to 64.2%. Monthly hours worked rose 2.6% mom or 49m hours.
Bjorn Jarvis, ABS head of labour statistics, said: "The small fall in employment followed an average monthly increase of around 39,000 people during the first quarter of this year." Meanwhile, both employment-to-population ratio and participation rate "were still well above pre-COVID-19 pandemic levels and close to their historical highs in 2022".
Japan's exports grow at slowest pace since Feb 2021 despite setting record high for Apr
Japan's exports grew by a modest 2.6% yoy to JPY 8288B in April. Although this represented the lowest growth in exports since February 2021, it still marked the largest export figure for April on record.
A closer examination of the data reveals a shift in trading dynamics. Exports to China fell by -2.9% yoy, marking the fifth consecutive month of decline. The decrease was driven by downturns in shipments of cars, car parts, and steel. Similarly, exports to Asia overall declined by -6.6% yoy, continuing a contraction trend for the fourth month in a row.
However, things looked rosier elsewhere. Exports to the US and EU showed robust growth, rising by 10.5% yoy and 11.7% yoy respectively. This uptick was led by a rebound in exports of cars and car parts, which have seen easing supply constraints.
Contrasting with export trends, imports fell by -2.3% yoy to JPY 8721B, the first annual decline witnessed in 27 months. This decrease was largely attributed to a slump in imports of crude oil and liquefied natural gas. Consequently, Japan recorded a trade deficit of JPY -432B for the 21st month running.
In seasonally adjusted term, the situation presents a slightly different picture. Exports rose by 2.5% mom to JPY 8259B, while imports inched up by 0.1% mom to JPY 9276B. In light of this, trade deficit narrowed to JPY -1017B.
USD/JPY Mid-Day Outlook
Daily Pivots: (S1) 136.78; (P) 137.24; (R1) 138.18; More...
USD/JPY's rally continues today and break of 137.90 resumes indicate resumption of whole rebound from 127.20. Intraday bias stays on the upside. Next target is 100% projection of 127.20 to 137.90 from 129.62 at 140.32. Break there will target 142.48 fibonacci level. On the downside, below 137.27 minor support will turn intraday bias neutral first.
In the bigger picture, price actions from 151.93 high are currently seen as a corrective pattern to the long term up trend. The first leg should have completed at 127.20. Rebound from there is seen as the second leg. Sustained break of 38.2% retracement of 151.93 to 127.20 at 136.34 will bring stronger rise to 61.8% retracement at 142.48. Meanwhile, break of 129.62 will argue that the third leg is starting through 127.20 low.
Economic Indicators Update
| GMT | Ccy | Events | Actual | Forecast | Previous | Revised |
|---|---|---|---|---|---|---|
| 22:45 | NZD | PPI Input Q/Q Q1 | 0.20% | 0.50% | 0.50% | |
| 22:45 | NZD | PPI Output Q/Q Q1 | 0.30% | 0.80% | 0.90% | |
| 23:50 | JPY | Trade Balance (JPY) Apr | -1.02T | -1.08T | -1.21T | |
| 01:30 | AUD | Employment Change Apr | -4.3K | 25K | 53K | 61.1K |
| 01:30 | AUD | Unemployment Rate Apr | 3.70% | 3.50% | 3.50% | |
| 12:30 | CAD | New Housing Price Index M/M Apr | -0.10% | -0.10% | 0.00% | |
| 12:30 | USD | Initial Jobless Claims (May 12) | 242K | 260K | 264K | |
| 12:30 | USD | Philadelphia Fed Survey May | -10.4 | -20 | -31.3 | |
| 14:00 | USD | Existing Home Sales Apr | 4.35M | 4.44M | ||
| 14:30 | USD | Natural Gas Storage | 109B | 78B |
Fed Logan: We haven’t yet made the progress we need to make
Dallas Fed Lorie Logan said in speech, "after raising the target range for the federal funds rate at each of the last 10 FOMC meetings, we have made some progress."
Logan noted, "The data in coming weeks could yet show that it is appropriate to skip a meeting. As of today, though, we aren't there yet."
Addressing the inflation target, Logan emphasized the challenges that remain. "We haven't yet made the progress we need to make. And it's a long way from here to 2% inflation," she remarked.