Sample Category Title
The Weekly Bottom Line: Optimistic Markets Cheer the Small Wins
U.S. Highlights
- Financial markets remained eerily positive this week, despite the debt ceiling X-date looming with no bipartisan deal in sight.
- Retail sales data for April showed the continued resilience of the U.S. consumer, while housing starts are looking to have reached a bottom after having fallen 24% last year. Home sales were lower in April, and likely have a bit further to fall.
- Fed speakers diverged this week on the near-term trajectory of the fed funds rate. Financial markets are still pricing 50 bps of rate cuts by year-end.
Canadian Highlights
- CPI inflation surprised to the upside, rising by 4.4% year-on-year (y/y) in April, up from 4.3% y/y in March. This was the first increase in the inflation rate since June 2022.
- Real estate data also came in hot, as home sales shot up by 11% month-on-month (m/m) in April, and the average home price rose by 6% m/m.
- Canadian retail sales data came in at -1.4% m/m in March, but when we add in services, consumer spending grew at an above trend clip in the first quarter of 2023.
U.S. - Optimistic Markets Cheer the Small Wins
Risk sentiment remained eerily positive across global financial markets this week, despite the clock ticking down on the debt ceiling X-date. But instead of losing the forest for the trees, investors seemed to cheer the incremental progress made this week. President Biden and Speaker McCarthy, and their negotiators, met on Tuesday for a closed-door meeting, where there appears to be some common ground on several items including clawing back unspent pandemic relief funds, speeding up permitting of domestic energy projects, and applying stricter work requirements for some social safety net programs. However, the two parties remain deeply divided on the size of broader spending cuts. At the time of writing, equity markets are looking to end the week up 2%, while the 10-year Treasury is up 25 bps to 3.71%.
Turning to the economic data, retail sales data painted a picture of a still resilient consumer in April. Although headline retail sales (+0.4% m/m) came in below expectations (+0.8% m/m), this was partially the result of a pullback in gasoline sales – largely a price- driven decline. The headline was also weighed down by weaker growth in motor vehicle sales, despite wholesale auto sales showing a healthy gain last month. After removing the volatile items, the control group – a more precise measure of consumer spending – rose by a healthy 0.7% m/m. This suggests continued momentum for Q2 consumer spending, with our current tracking around 1%-1.5%.
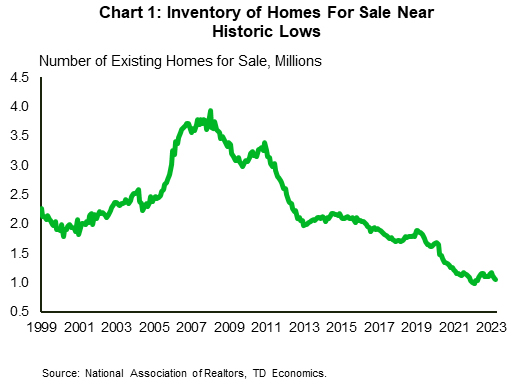
Data out this week on the housing market showed existing home sales fell by 3.4% m/m to 4.28 million units in April. The pullback comes after sales had shown signs of life earlier this year. However, much of that activity was the result of a pullback in mortgage rates that had occurred between October-January. Since then, mortgage rates have again turned higher, and at 7.1%, are not far off last year’s highs. Not only has this kept new homebuyers on the sidelines, but it has also discouraged move-up buyers from listing properties, which has kept inventory levels near historic lows (Chart 1).
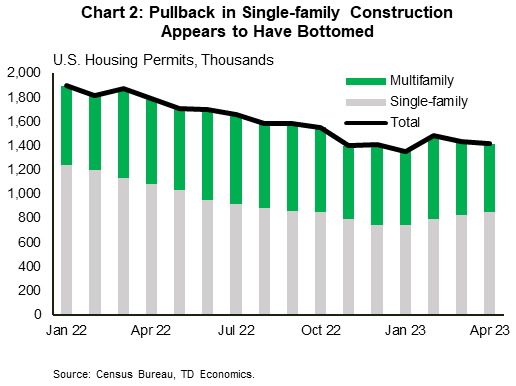
While home sales likely have a bit more room to fall, housing starts may have already reached a bottom. Residential construction rose 2.2% m/m to 1.4 million in April, with gains seen across both the multifamily (+3.2% m/m) and single-family (+1.6% m/m) segments. Permitting activity points to an uptick in construction in the single-family segment over the coming months, though this will likely be offset by some pullback in multifamily, which has yet to feel any correction through this tightening cycle (Chart 2).
Several Fed speakers this week showed a growing divergence among committee members on the near-term trajectory of the fed funds rate. While a few officials endorsed another rate hike, others are favoring a pause given the recent banking turmoil and the uncertainness it poses to the economic outlook. However, all officials still support rates remaining elevated through this year, which remains at odds with market pricing where 50 bps of cuts are still expected by year-end.
Canada – Canadian Economy is Too Hot to Handle
It was a busy week for Canadian economic data. CPI inflation readings showed an acceleration in prices, while the real estate market surged into the spring buying season. The hot data caused a massive repricing for the Bank of Canada (BoC), with markets now leaning towards another 25 basis point (bp) hike this summer. The Canada 2-year yield rose a whopping 40 bps, reaching its highest level since the start of the U.S. regional banking stress in March.
Consumer prices rose by 4.4% year-on-year (y/y) in April, up from 4.3% y/y in March. This was the first increase in the inflation rate since June 2022. Gasoline was the main contributor, with prices at the pump rising 6.3% month-on-month (m/m). Outside of energy, overall inflation was boosted by rising rent, mortgage interest costs, and prices for recreational vehicles.
The Bank of Canada's core inflation metrics (trimmed mean and median) were a little more encouraging, averaging 4.2% y/y, versus 4.5% y/y in March. Even our measure of 'supercore' inflation that reflects cyclically driven services inflation decelerated to 5.7% y/y, from 6.3% y/y in March (Chart 1). The cost of travel was the major disinflationary force as prices have come down from the peaks seen last year.
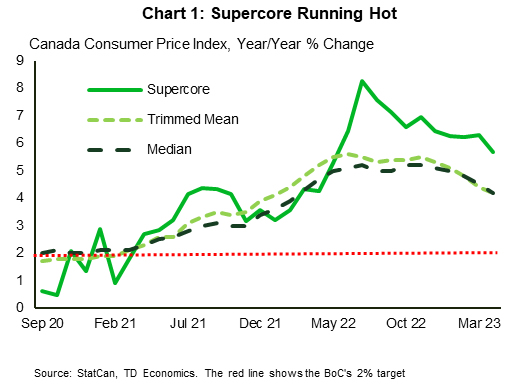
While the comparisons to last year are moving in the right direction, core readings on a three-month basis are more worrying. The average of the BoC's core measures increased to 3.7%, from 3.4% in March. These timelier measures point to more persistent inflation pressures than we expected in our March forecast.
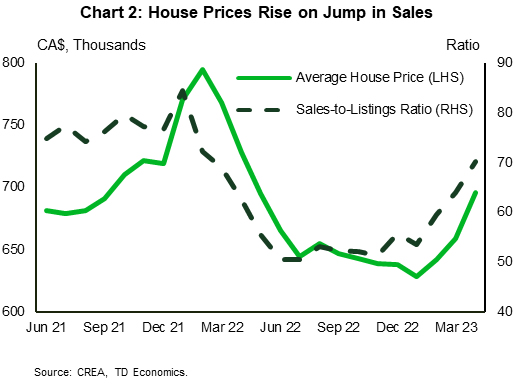
Speaking of hot, look no further than the Canadian real estate market. Home sales shot up by 11% m/m in April, as they jumped off the floor formed earlier in the year. At the same time, listings were only higher by 1.6% m/m, putting the sales-to-listings ratio firmly into sellers' territory at 70.2% (Chart 2). The demand/supply imbalance pushed the average home price up by 6% m/m. Housing starts also shot-up by 22% m/m in April, as the reigniting of the real estate market incentivized building.
Canada is in the midst of a cyclical upturn. The jobs market has accelerated on Canada's population boom, wages are growing faster than inflation, and governments are providing generous inflation support transfers. This income windfall has Canadians spending once again. While today's retail sales numbers showed a -1.4% m/m drop in March, they are missing the surge in services spending and strong demand from online shopping. Our more holistic tracking for consumer spending for 2023 Q1 is coming in around 5% (quarter-on-quarter, annualized)!
BoC Governor Macklem spoke this week following the release of the Bank's Financial System Review. Although the discussion was focused on the risks facing the Canadian financial system, it was notable that the Governor seemed to be looking past the recent upturn in economic data. While the BoC's view is that growth will slow in the coming months, should the economy continue to accelerate in line with recent data, another rate hike may be put back on the table by this summer.
Fed Powell notes lagged effects of tightening and banking stresses
Fed Chair Jerome Powell said at a conference today, "We've come a long way in policy tightening and the stance of policy is restrictive."
Also, "We face uncertainty about the lagged effects of our tightening so far and about the extent of credit tightening from recent banking stresses."
The Fed Chair suggested that the central bank now has room to scrutinize the economic data and evolving outlook more closely, and make measured assessments. "Having come this far, we can afford to look at the data and the evolving outlook to make careful assessments," he added.
Interestingly, Powell emphasized the influence of the banking sector on the current financial landscape. He said, "While the financial stability tools helped to calm conditions in the banking sector, developments there on the other hand are contributing to tighter credit conditions and are likely to weigh on economic growth, hiring and inflation."
"As a result, our policy rate may not need to rise as much as it would have otherwise to achieve our goals. Of course, the extent of that is highly uncertain," Powell concluded.
Canadian Data to Reveal Soft Spots
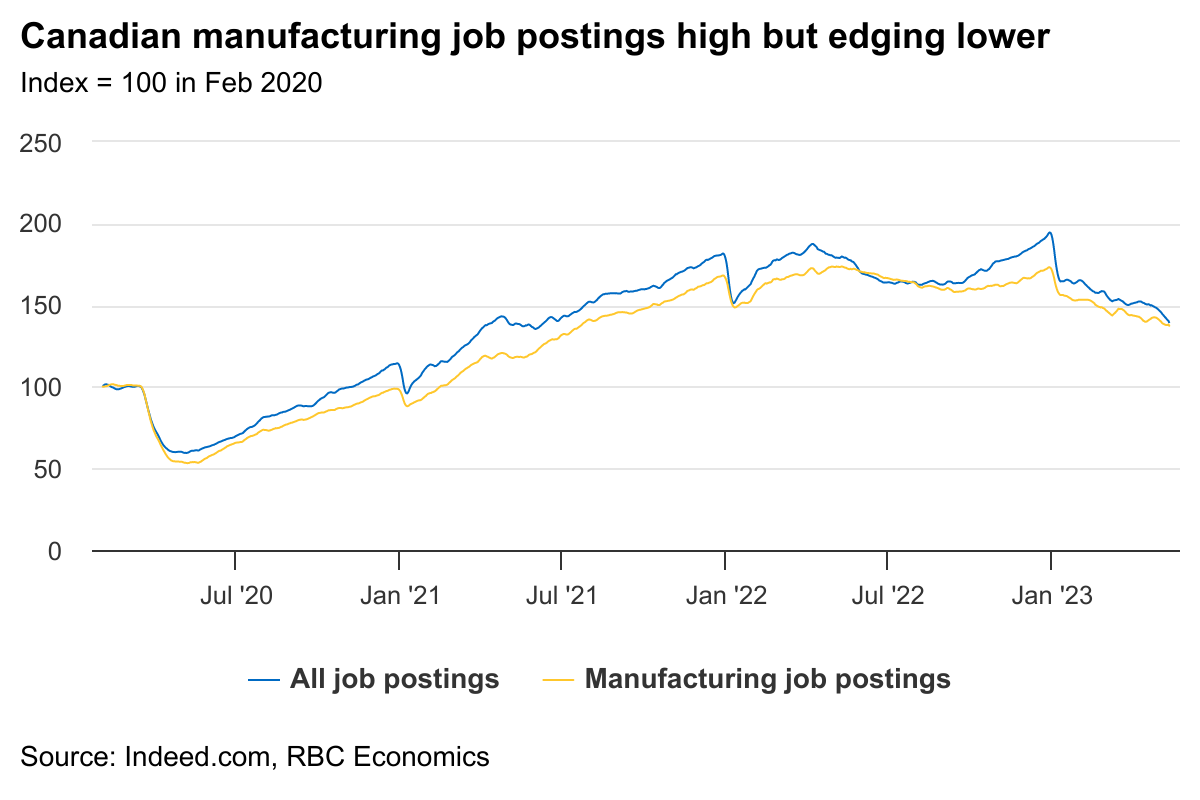
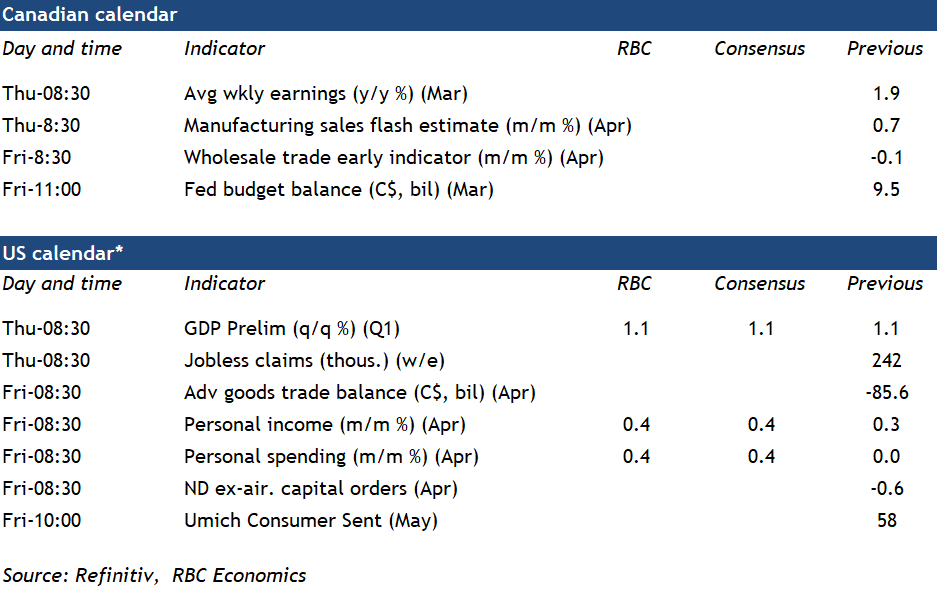
Did the economy lose steam early in Q2? Advance estimates of Canadian manufacturing sales for April will be watched carefully for signs of weakness. A surge in home resales and sticky ‘core’ inflation measures in April have markets speculating that the Bank of Canada might need to re-start interest rate hikes. Still, the economy had been slowing after a surge in activity in January. Early GDP estimates from Statistics Canada last month showed a small 0.1% increase in February output—and an outright decline in March, led by weakness in retail and wholesale trade. Manufacturing production likely fell in March as well, despite a tick higher in sales that was mostly supported by strength in transport equipment. That in mind, we expect next week’s advance manufacturing sales report for April to show even more softness. This would coincide with the decline we’ve seen in demand for discretionary consumer goods and lower manufacturing job postings into May. Adding to the headwinds was the strike among federal employment that lasted ~ten days in April.
Job vacancies are also on the radar next week as the March Survey of Employment, Payrolls & Hours (SEPH) is released. Vacancies have already declined steadily since peaking in spring 2022 but were more than 50% above where they were compared to 2019 levels. That helps explain the current backdrop for the Canadian labour market. Indeed, conditions remain overheated (as evidenced by strong headline employment growth and decade-low unemployment rates) but cracks of stalling labour demand are forming under the surface. All told, we continue anticipate more softening in activity to come as higher living costs strain household spending.
Solid U.S. retail sales for April (+0.4%) are pointing to a pickup in consumer spending after two softer months over February and March. Growth was likely supported by more spending on durable goods, especially cars. A jump in hours worked and average hourly wages in April is pointing to a 0.4% increase in household incomes.
Preview of RBNZ May 2023 Monetary Policy Statement
More mahi to occur.
- We expect the Reserve Bank to lift the OCR by 25 basis points to 5.5 percent next week.
- Fiscal spending and a surge in migration suggests a higher peak in interest rates than signalled in February.
- The RBNZ may not move immediately to Westpac's 6 percent OCR peak – but will signal an openness to getting there.
- If the RBNZ does move to Westpac's 6 percent OCR peak, then the chance of a 50-point hike is high.
- Expect an ongoing tightening bias to warn markets off pricing in rate reductions.
Recent developments.
In its February Monetary Policy Statement the Reserve Bank signalled a peak cash rate of 5.50% this year, with the contours of the projection most consistent with getting there in three further steps of 25 basis points. But we've already had signs that the RBNZ is wavering from that path, the most obvious one being the surprise 50 basis point hike at the April policy review.
That decision was preceded by a speech from RBNZ Chief Economist Conway that was distinctly on the hawkish side, including the comment that: "It is unclear whether inflation expectations are falling fast enough to mean current and projected OCR settings [our emphasis] are consistent with positive real interest rates, and thus likely to be disinflationary."
Economic developments since then have been a distinctly mixed bag for the RBNZ. Recent data outturns will have given them some comfort that monetary policy is working, and that inflation is on the way down from its highs. But at the same time, some fresh upside risks to the inflation outlook are starting to crystallise.
March quarter inflation fell well short of the RBNZ's forecast, with the annual rate dropping from 7.2% to 6.7% against the RBNZ's view that it would tick up to 7.3%. Most of the surprise reflected global influences, with the Covid-related disruptions to supply chains and shipping costs now unwinding. Locally driven inflation pressures are still running hot, although there are signs of softening in areas like homebuilding. Lower March quarter inflation and lower surveyed inflation expectations probably comforted the Reserve Bank and might knock about 30 basis points off the peak OCR in the RBNZ's projections.
The news on economic activity has been less clear. December quarter GDP was much weaker than the RBNZ expected, with a surprise decline of 0.6%. The disruptions caused by Cyclone Gabrielle also raise the risk that we see another dip in activity in the March quarter. However, that would be a short-lived effect, and more the result of a hit to the economy's capacity than to demand.
It's the forward-looking view, though, that will be more challenging for the RBNZ. Its forecasts effectively assumed that its 'engineered recession' would be under way by now, starting with a 0.5% fall in June quarter GDP. We're halfway through that period now, and there's little to suggest that the economy has turned that abruptly.
We see a similar story in the labour market. The unemployment rate held steady at 3.4% in the March quarter, a little better than the RBNZ's assumption of a small rise to 3.5%, but not meaningfully different. However, their forecasts then had unemployment lifting rapidly to 3.8% in the June quarter, with further large increases from then on. Again, there's very little to suggest that that's the path we're currently on. If anything, jobs growth has been accelerating lately, no doubt helped by the fact that there are more people around to hire.
In the April OCR review, the RBNZ noted three factors that could lead to more persistent inflation pressures: the risk of more stimulatory fiscal policy settings, the additional activity associated with the recovery from Cyclone Gabrielle, and the rebound in net migration. All three of those factors will have to be addressed in the May statement and all three imply more inflation pressure and a higher OCR.
The risk of a boost in fiscal spending has been on the cards for some time – not least to keep up with cost pressures in public services. That risk has now materialised, with yesterday's Budget revealing more than $8bn of additional spending over five years. We can only guess at how that compares to what the RBNZ feared. But given that as a rule the RBNZ takes the Treasury's fiscal forecasts as a given, this is something that wasn't in their central forecast previously. As a rough guide, we think this could add another 20 basis points to the OCR track.
The cyclone recovery is at least one area where the RBNZ may be feeling some relief. The Government has confirmed that its share of the rebuild (such as roads, bridges and water infrastructure) will largely be covered by deferring other capital spending plans. That will dampen the net boost to demand and the extent of the draw on the nation's capacity.
Net migration has surged to an inflow of 65,000 people over the last year, far in excess of what the RBNZ had expected at this point. Migration has complex effects on the economy, adding to both capacity and demand to varying degrees across different sectors. The key point here, though, is that the RBNZ has traditionally regarded migration as an inflationary force on balance. And the April policy statement confirmed that this remains the case – the RBNZ does not buy into the view that migrants will bring inflation down by alleviating labour shortages.
The resurgence in migration to date could be worth an additional 30 basis points on the OCR track. However, it may be worth even more depending on what the RBNZ is willing to assume going forward. We note that the Treasury made a fairly conservative assumption in yesterday's Budget, with a net inflow of 52,000 people for this year, effectively implying that the pace of inflows had already peaked. However, the RBNZ may be prepared to take a stronger view at this point.
The final concern for the RBNZ – possibly related to the migration rebound – is house prices. While the housing market remains weak, recent data suggests that it may be bottoming out, much earlier than the RBNZ assumed – its February forecasts included a further 13% fall in prices this year. The RBNZ does not directly target house prices, but it will need to consider the implications for consumer spending via the wealth effect.
Strategy going forward.
As discussed in our recent Economic Overview1 we see a need for some further monetary tightening and an increase in the OCR to 6 percent by August 2023. After that, we think the Reserve Bank will need to hold interest rates at that level until May 2024 when it should be more apparent and with greater confidence that inflation will sustainably fall to within the 1-3 percent target range. By then, CPI inflation should hopefully be close to 4 percent and in a fast downtrend.
On balance we see a strong case for an upgrade in the RBNZ's own assessment of the OCR peak. The key questions are the extent of the reassessment they do now and the balance of risks they portray around that OCR profile looking forward?
Our sense is that the RBNZ may not immediately go the full way and push the projected OCR profile to 6 percent. The RBNZ may want to see more data on the progression of the migration cycle before recognizing the need to push rates to 6 percent. The RBNZ might upgrade their migration profile a bit (and presumably more than Treasury's already out of date assumptions) and look for further data to make a fuller assessment. In the RBNZ's mind this might justify a move of the OCR peak to 5.75.
But we are sure the Bank will want to portray a hawkish tightening bias from that 5.75 peak to try prevent markets bringing forward expectations of interest rate cuts. A hawkish bias is also consistent with the Bank re-emphasising a data-dependent approach and looking to data available over June and early July to update their assessment of the migration cycle (new data will be available 13 June and 12 July), housing market developments, GDP, and the labour market. We expect that data to present a picture of ongoing strong migration, a slowing economy with some potential green shoots in areas most impacted by the migrant in flows (housing, retail spending, rentals). Hence, we are confident in our view the Bank will get to 6 percent by the August Monetary Policy Statement where they can present a new set of projections.
So, what does that mean for the OCR in the May meeting?
- Our central (modal) view: The RBNZ tightens by 25 basis points in May and shows another 25 points in the July meeting as well as an appreciable chance of a further tightening in August. This is consistent with the RBNZ taking a gradual approach to 5.75 percent and recognizing the risks of a further move to 6 percent.
- The alternative risk scenario (40 percent chance): The RBNZ tightens by 50 basis points and matches Westpac's forecast of a 6 percent peak OCR. The 50-point move in May covers a good amount of the required ground and allows one further 25-point increase in July to finish the job (and maintaining a hawkish bias from there).
Will a Slowdown in UK Inflation Change the BoE’s Plans?
With the BoE leaving the door open to more rate hikes at its latest gathering, pound traders will probably be sitting on the edge of their seats in anticipation of next week’s inflation numbers, scheduled to be released on Wednesday at 06:00 GMT. However, they could somewhat readjust their positions the day before, as they will get an idea of how the UK economy has been performing this month through the preliminary PMIs. The icing on the cake may be Friday’s retail sales.
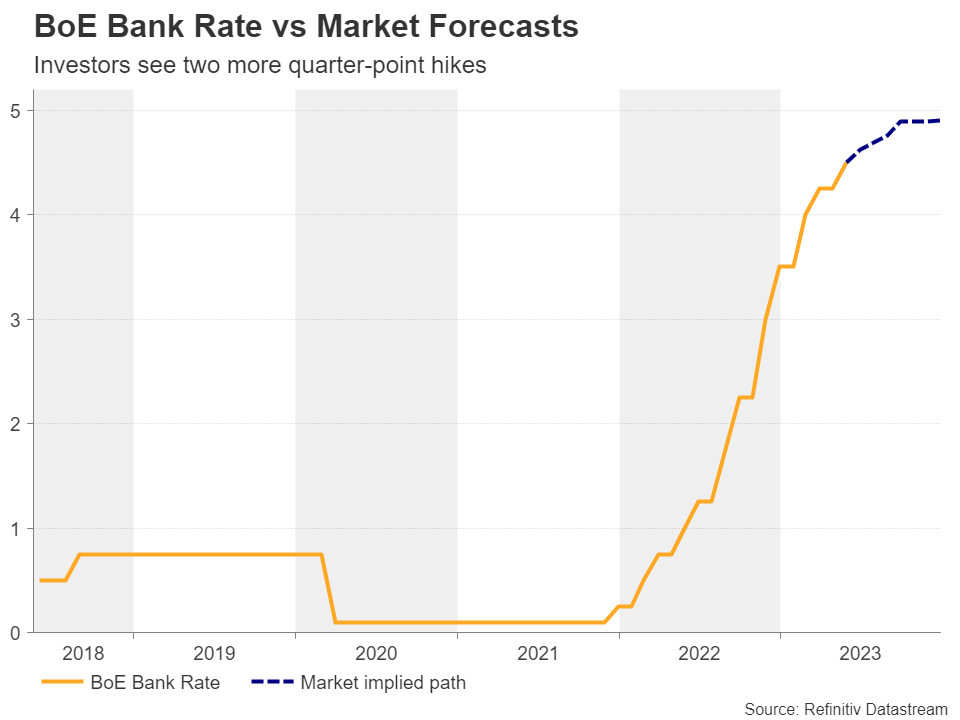
Investors expect two more hikes by the BoE
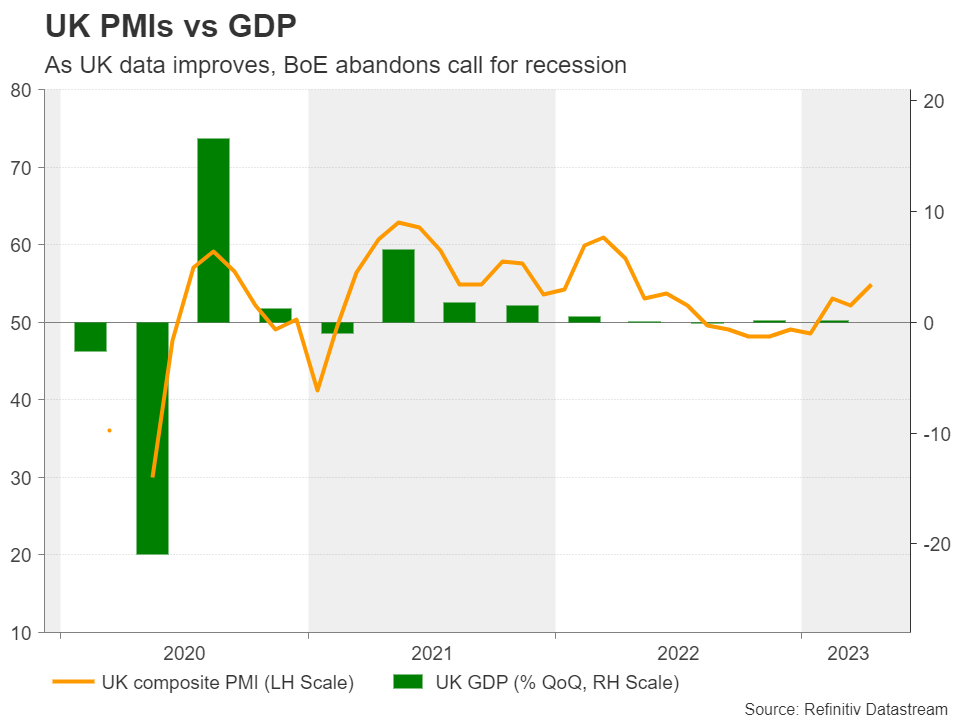
Just last week, the BoE decided to hike rates by another 25bps as was widely anticipated, keeping its forward guidance more or less unchanged, namely that should inflation pressures persist, they will not hesitate to raise rates further. However, the spotlight was thrown on the upside revisions in the economic and inflation projections, with the Bank abandoning its call for a recession.
Blending this with Governor Bailey’s remarks that they must “stay the course” to ensure that inflation falls back to the 2% objective, investors were allowed to maintain bets of more rate increases in the months to come. Currently, they are assigning a nearly 80% probability for another quarter-point hike at the June meeting and expect almost one more by the end of the year.
Will the data alter those expectations?
Although the manufacturing PMI remained subdued around 2 points below its equilibrium 50 barrier, pointing to contraction for the ninth consecutive month in April, the services index has been expanding for three months now, with April revealing a strong acceleration. This took the composite PMI up to 54.9 from 52.2. Further improvement in the May numbers could increase confidence that the UK economy has dodged a recession and thus, investors will remain convinced that more hikes are coming.
However, they are unlikely to play all their cards just a day ahead of the CPI data, as bringing inflation to heel is the BoE’s top priority. Both the headline and core CPI rates are expected to have declined in April, with the former slipping back below 10%, to 8.2% year-on-year from 10.1%, and the latter ticking down to 6.1% y/y from 6.2%.
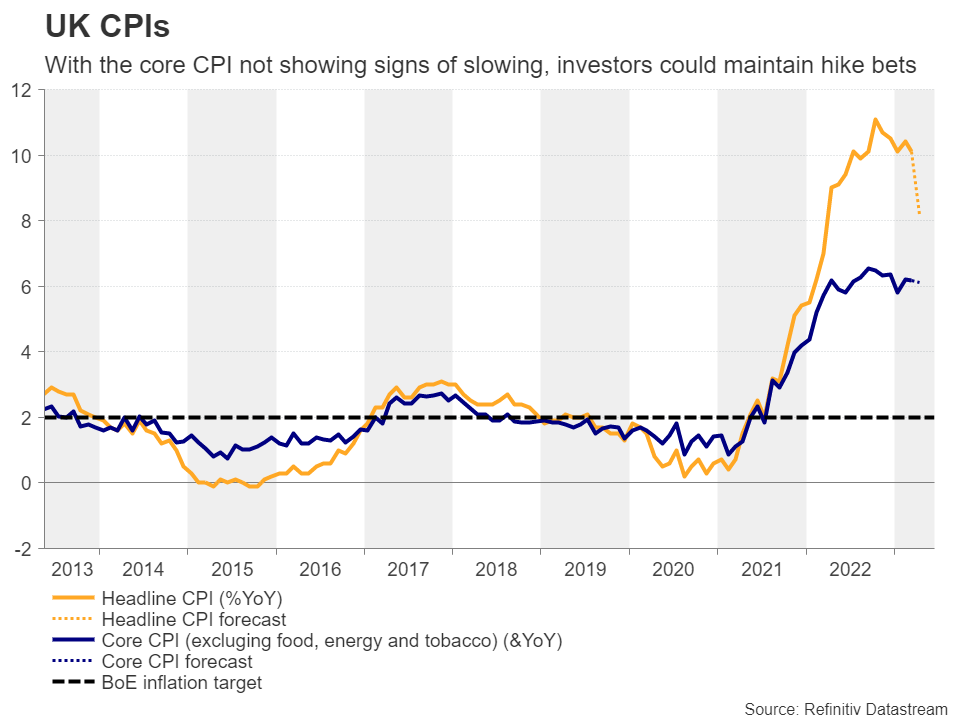
That said, according to the April PMIs, price-charged inflation accelerated during the month as private sector firms once again sought to defend margins from rapidly increasing staff costs. This likely tilts the risks surrounding Wednesday’s data to the upside. That said, even if the forecasts are met, inflation would still be well above the BoE’s 2% target, with the core metric not showing signs of sufficient slowdown. For market participants to start scaling back their hike bets, a downside surprise may be needed.
On Friday, retail sales are expected to have contracted again in April, but at a slower pace than in March, which adds to the narrative that inflation may not have cooled down as the forecasts suggest.
Pound could stay in uptrend, especially against aussie
This could further convince investors that another hike is in the BoE’s chamber and that at least another one is likely to follow. Thus, even if the pound corrects lower next week, it could remain in a broader uptrend mode. Nonetheless, exploiting further pound gains against the dollar, which has been receiving massive support from US data and hawkish Fed rhetoric, may not be the wisest choice. With the RBA seen maintaining a soft stance after the disappointment in Australia’s employment report for April and stepping back to the sidelines in June, pound/aussie may be a better option.
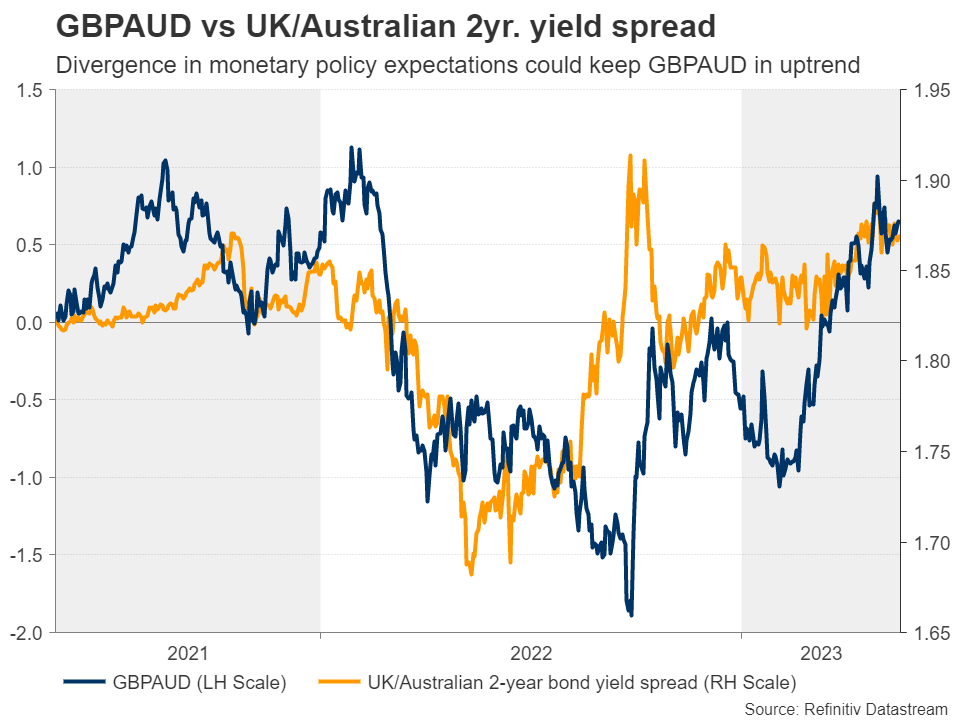
Pound/aussie has been in a sliding mode today, after it hit resistance nearly the 1.8830 level on Thursday. However, even if the pair extends its retreat below last week’s lows of 1.8585, the bulls will still have the opportunity to jump back into the action from above the uptrend line drawn from the low of February 2.
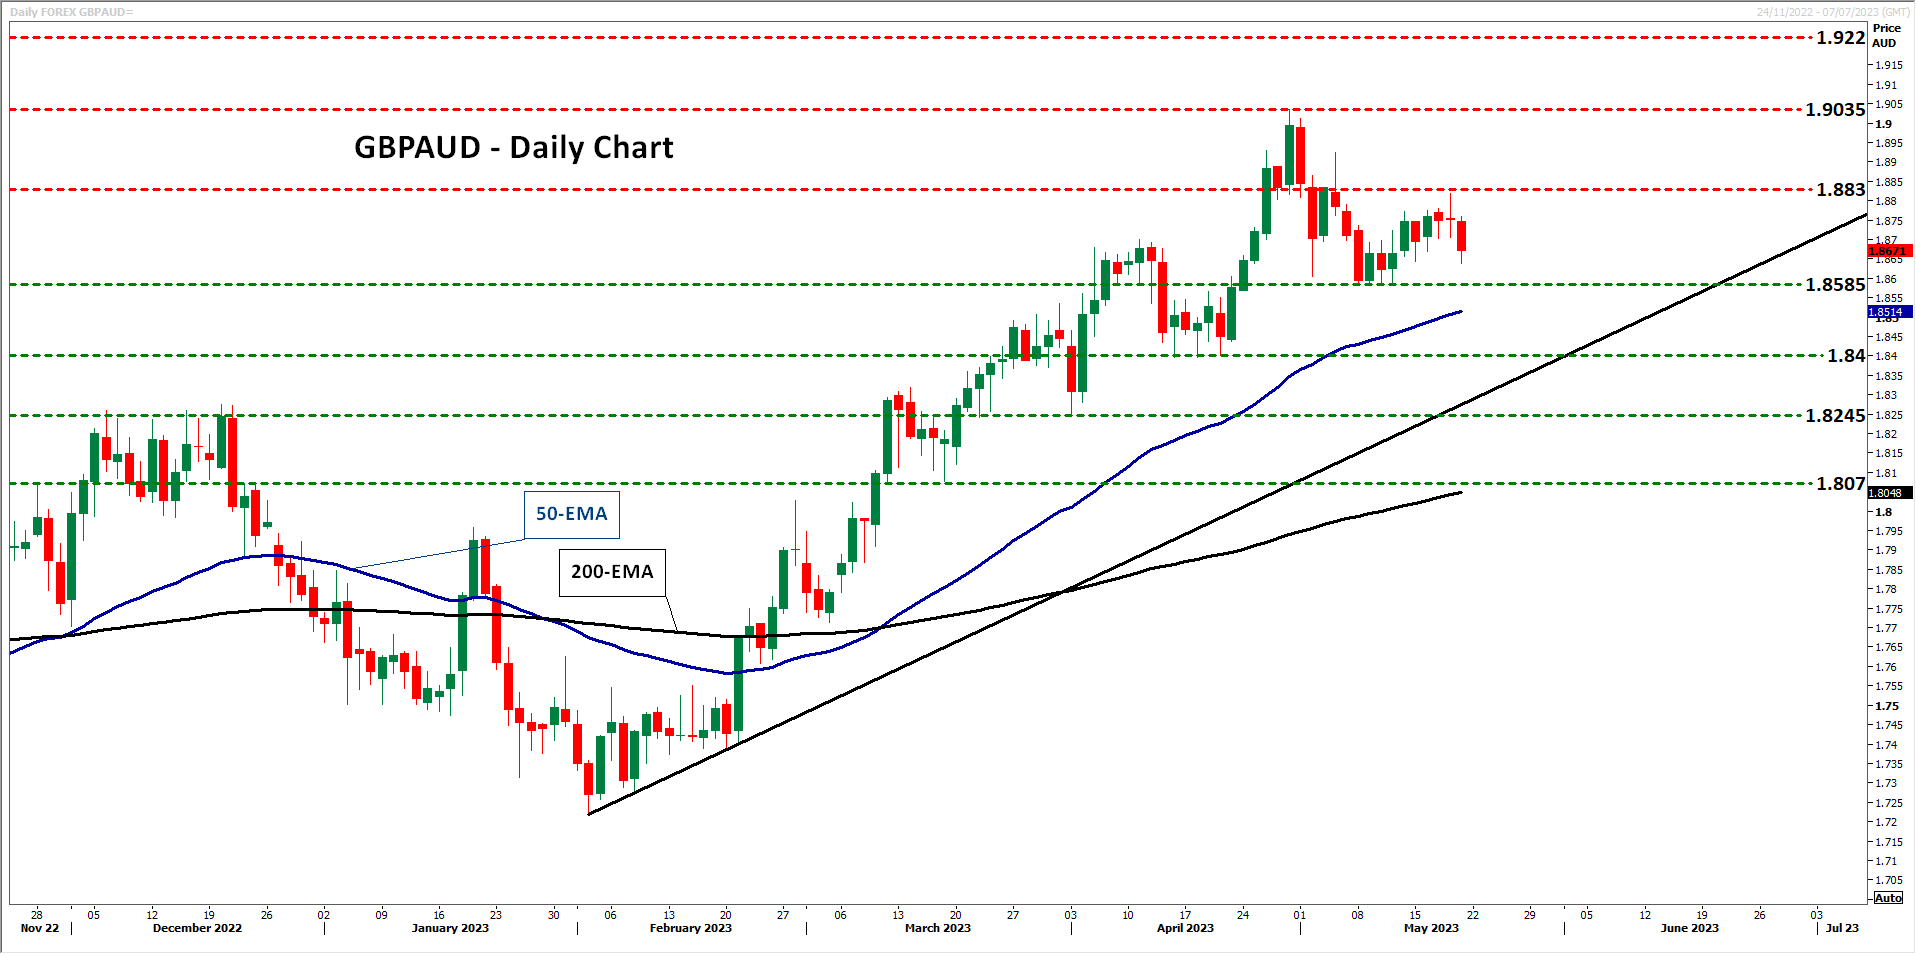
If so, they may push for another test at around 1.8830, the break of which could pave the way for the peak of April 28 at around 1.9035. If they are not willing to stop there either, they would then enter territories last seen in February 2022, with the next resistance perhaps being the high of January 28 of that year at 1.9220.
For a bearish trend reversal to start being examined, pound/aussie may need to fall below the 1.8400 zone, which offered support last month. Such a slide may also take the pair below the aforementioned uptrend line and perhaps allow declines towards the low of March 31 at 1.8245.
Week Ahead – RBNZ, Fed Minutes, UK & US Inflation, Flash PMIs to Headline Packed Week
The RBNZ looks set to raise rates for a 12th time in the coming week, while inflation figures out of the United Kingdom and United States will be crucial in shaping rate hike expectations. After some shockingly bad data recently, Germany’s PMI readings will likely capture the most attention from S&P Global’s flash surveys for May. With sentiment still fragile, the PMIs could set the tone for equity markets, but will they aid the US dollar’s advance or will the Fed’s May meeting minutes rein in the bulls?
RBNZ to hike again, but will it be the last?
The Reserve Bank of New Zealand will be the only major central bank holding a policy meeting next week. It is widely tipped to hike borrowing costs by 25 basis points when it meets on Wednesday. That would make it the 12th straight increase since the cycle began last October, taking the cash rate to 5.50% - the highest among advanced nations.
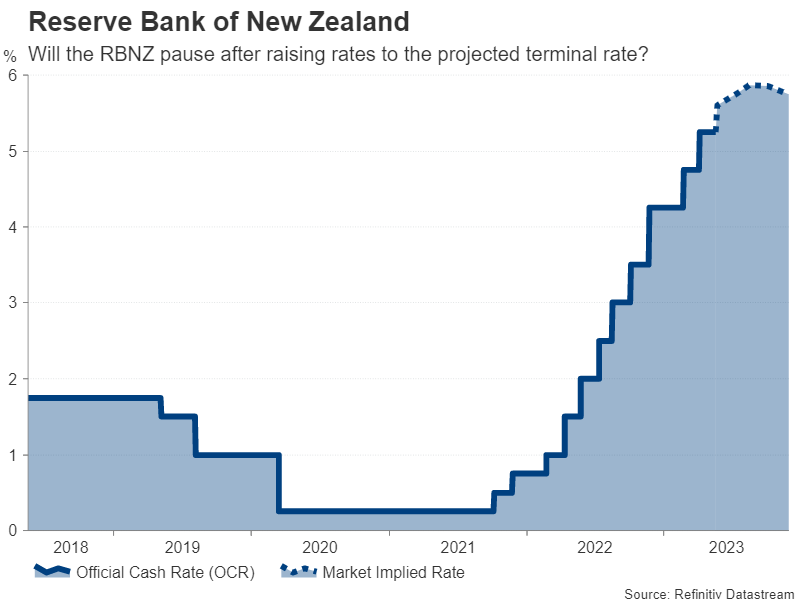
However, investors don’t think the RBNZ will stop there as a further 25-bps hike is priced in over the summer. This is more hawkish than the RBNZ’s own forecast of where rates will peak, which was projected at 5.50% back in February. The Bank will publish its updated forecasts in the quarterly Monetary Policy Statement on Wednesday and so the local dollar could gain if policymakers up their terminal rate to match or exceed the markets’.
The latest employment report supports the case for more tightening as the jobless rate remained low at 3.4% and wage growth accelerated slightly in the first quarter. Retail sales data due the same day as the policy decision could show that consumer spending bounced back in Q1.
However, there is also an argument to stop at 5.50% as in the RBNZ’s latest expectations survey, inflation expectations for two years ahead fell within the Bank’s 1-3% target band to 2.79%. Hence, there is some downside risk too for the kiwi from the meeting.
All eyes on US data as June Fed decision in the balance
With pause speculation also intensifying for the Fed, PCE inflation and the May FOMC meeting minutes will be watched across the Pacific next week. US economic indicators have been somewhat mixed lately, yet that underlying strength seems to be holding up even after 500-bps worth of rate increases and a mini banking crisis. From the recent Fedspeak, most officials appear to be swaying towards another hike in June and if there is a pause, it will likely be a conditional one. Wednesday’s Fed minutes could reveal more.
However, the reality is that policymakers haven’t quite made up their minds about the June decision yet and one of the reasons for that is there are still three major reports on the way before then, the first of which is Friday’s PCE inflation numbers.
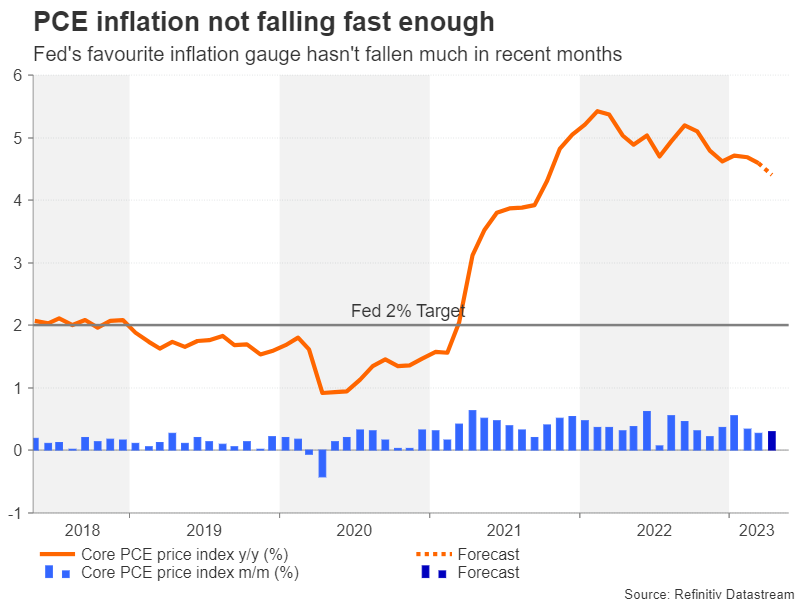
The core PCE price index – the Fed’s preferred price metric – is forecast to have moderated 0.2 percentage points to 4.4% in April. This would be a sign of progress after being stuck in the 4.6%-4.7% range for the past few months. The personal income and spending readings will be important as well, as US consumers do not appear to have turned significantly more cautious. In fact, personal consumption is expected to have risen by 0.4% m/m in April.
Durable goods orders are also due the same day, but ahead of Friday’s releases, the flash PMIs will be grabbing some attention on Tuesday. Investors will be scrutinizing the subcomponents of the PMI indices for an early look at new orders, employment and input prices in the first half of May.
Other data will include new home sales on Tuesday and the second estimate of Q1 GDP on Thursday.
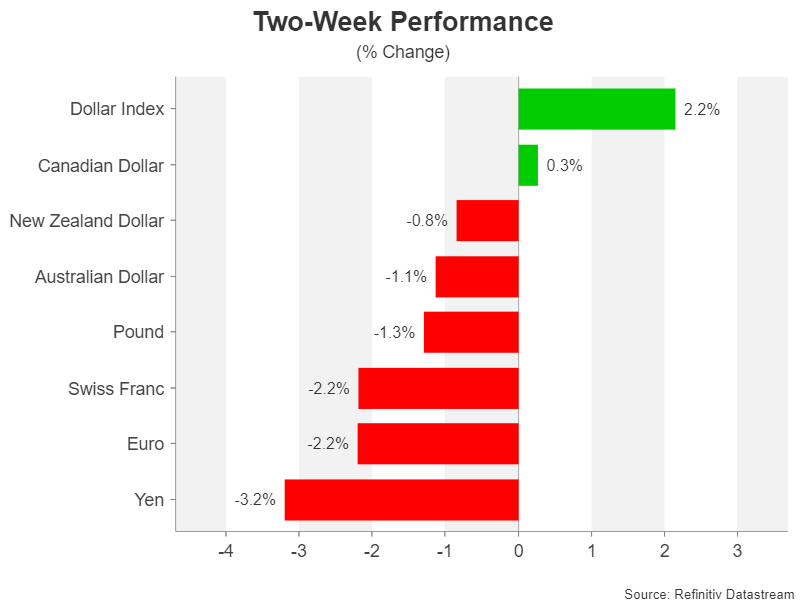
After two weeks of strong gains, the US dollar could be in line for a negative correction should the incoming numbers disappoint and rate cut expectations for the Fed are ramped up again. But if they reinforce the view that inflation and the broader economy are not slowing fast enough, the greenback’s upswing could turn into a rampage.
Can Eurozone PMIs lift the euro?
The euro, along with the yen, has been the biggest casualty of the dollar’s comeback efforts even though there’s been no dramatic repricing of rate hike probabilities for the European Central Bank. The recent batch of worrying German data has instilled a downward bias to the euro amid the greenback’s revival and the single currency has had to surrender some key levels.
Tuesday’s flash PMIs could play a vital role in either putting a floor under the euro’s slide or deepening its losses. The forecasts don’t point to much of a change in the economic picture in the Eurozone. The manufacturing sector is expected to contract again, with growth being propped up by services industries.
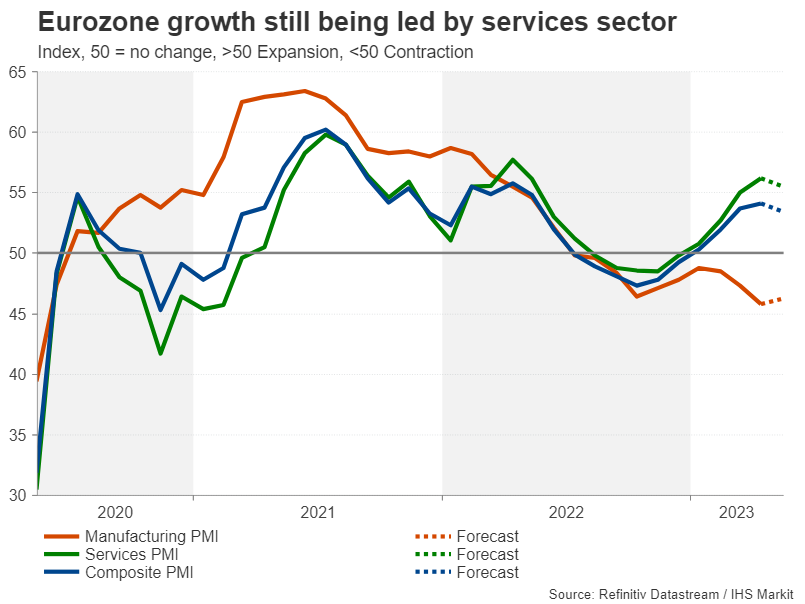
A surprise rebound in manufacturing output, especially in Germany, could help allay concerns about waning economic momentum. For the same reason, investors will also be watching Germany’s Ifo business climate gauge and the detailed Q2 GDP print on Wednesday and Thursday, respectively.
Some good news from UK CPI, but maybe not for the pound
The pound has been able to withstand the dollar’s resurgence somewhat better than the other majors. With the Bank of England recently saying it no longer anticipates a recession and inflation remaining in double-digit territory, investors think rate hikes have more room to run in the UK, versus rate cuts being priced in for the Fed.
But the consensus view that inflation in the UK will be more persistent than in other countries could begin to lose some clout on Wednesday when the consumer price index for April is released. The headline rate of CPI is expected to have finally dropped below 10% last month, easing to 7.9% from 10.1% in March. The core figure is forecast to fall to 5.7%.
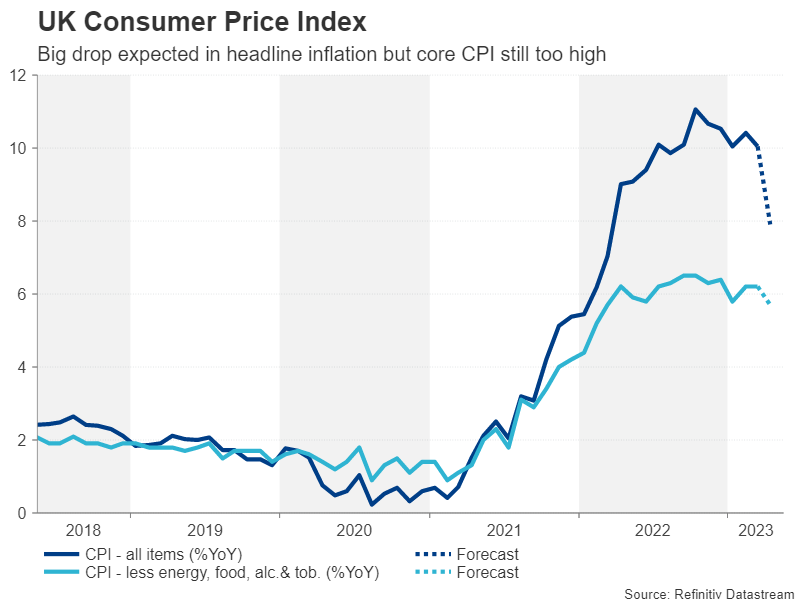
A day earlier, the May PMIs will be eyed for clues on how economic activity fared amid the extra public holiday to celebrate King Charles’ coronation. On Friday, the spotlight will fall on the April retail sales stats.
The overall strength of the data could determine whether or not sterling is able to maintain its relative outperformance against the dollar.
Elsewhere, the flash PMIs will be the main highlight in Australia, April wage figures due Thursday will be monitored in Canada, while in Japan, there’s a slew of data, including machinery orders (Monday), manufacturing PMI (Tuesday) and a preview of inflation in May with the Tokyo CPIs (Friday).
Gold: Strong Bearish Signal on Weekly Close Below Broken $1975 Higher Base
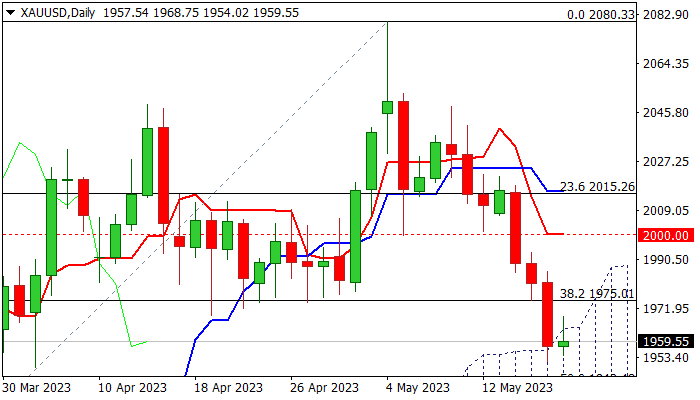
Gold edges higher on Friday in consolidation of sharp fall (2.9%) in past three days and on track for the biggest weekly loss since the last week of January.
Metal’s price fell on fresh optimism over debt ceiling talks and the latest hawkish shift in Fed’s rhetoric, which hinted possible further rate hikes, against signals of a pause in policy tightening cycle and speculations of rate cuts towards the end of the year, which made the dollar attractive.
Gold price lost ground on weaker sentiment and fell below important supports at $2000 / $1975 (psychological / Fibo 38.2% of $1804/$2080 / higher base), hitting two-month low, after penetrating rising and thickening daily cloud (top of the cloud lays at $1964).
Near-term action is likely to pause on oversold daily studies, but bears are expected to hold grip and keep in play expectations for further drop.
Weekly close below broken $1975 level (now reverted to resistance) to confirm break and keep bearish near-term stance, with close within the cloud, to boost negative signal for extension towards targets at $1942/26 (50% retracement of $1804/$2080 / daily cloud base) and risk test of $1920 (bull trendline drawn off $1616, Oct 2022 low) in extension.
Res: 1968; 1975; 1992; 2000.
Sup: 1951; 1942; 1926; 1920.
Canada: Retail Sales Decline in March, But February’s Reading Revised Up
Retail sales fell by 1.4% month-on-month (m/m) in March in line with the Statistics Canada's advanced estimate. However, February's print was revised up to a flat reading from an originally reported loss of 0.2%.
Adjusting for the impact of inflation, the volume of retail sales was 1.0% lower on the month.
The decline in today's headline reading was largely driven by decreases at motor vehicle and parts dealers (-4.4% m/m), where sales contracted for the first time in eight months, and gasoline stations and fuel vendors (-3.9% m/m).
Excluding these categories, core retail sales were 0.3% m/m higher in March.
The gain in core sales was led by higher sales at building material and garden equipment and supplies dealers (+1.6% m/m), miscellaneous retailers (+3.5%), electronics and appliance stores (+1.6% m/m) and general merchandise retailers (+0.6% m/m).
Meanwhile, clothing and clothing accessories stores (-1.2% m/m), sporting goods, hobby items, musical instruments and books stores (-1.6% m/m) and furniture and home furnishings stores (-1.4% m/m) were the biggest underperformers.
E-commerce sales, which are not included in the headline tally, slowed from a whopping 9.6% growth rate in February to a more modest 2.2% pace in March.
Statistics Canada's advanced estimate for April indicates a 0.2% m/m gain – that's in line with our internal card spending data (which excludes auto sales and tilts toward housing-related categories).
Key Implications
The most fitting epithet to today's report is "lethargic" - even auto sales, which seemed immune to higher rates and prices over the past eight months, have taken a March break. Still, upward revisions to February make the print a little less dire. Solid growth in core sales suggest that consumers, while a bit more cautious, haven't stopped spending. Meanwhile, our estimates of services activity (based on internal high-frequency card spend data) suggests that consumers still have a healthy appetite for spending on travel and going out. With that, we expect consumer spending growth to come in around 5 percent (annualized) in the first quarter of 2023.
Looking ahead, spending is poised to step down to a below trend growth as Canadians face stronger headwinds from rising costs of borrowing as the cumulative effect of higher policy rates works through the economy. According to the Bank of Canada's Financial System Review, one-third of all mortgages have already seen an increase in mortgage costs while the rest will be affected over the next three years, as more mortgages are refinanced at higher rates. Over this time, the Bank expects the median payment to rise by 20%, absorbing a good portion of past income growth and reducing spending capacity. While some homeowners may mitigate increasing costs by extending amortization or tapping into an estimated $140 billion in excess personal deposits, many will see a notable reduction in their financial flexibility. This, in turn, may limit the BoC's appetite for another rate hike.
USD/JPY Mid-Day Outlook
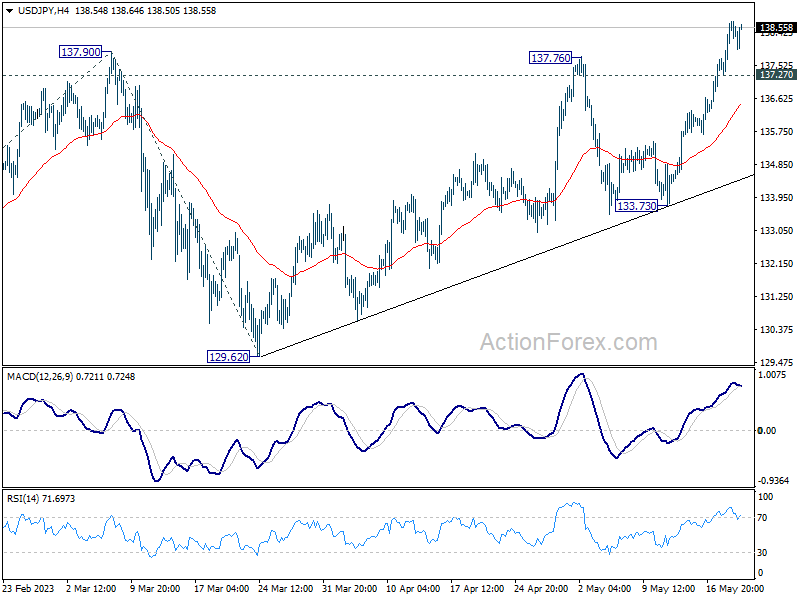
Daily Pivots: (S1) 137.75; (P) 138.25; (R1) 139.21; More...
Intraday bias in USD/JPY remains neutral and outlook is unchanged. Current rise is part of the whole rally from 127.20. Next target is 100% projection of 127.20 to 137.90 from 129.62 at 140.32. Break there will target 142.48 fibonacci level. On the downside, below 137.27 minor support will turn intraday bias neutral first.
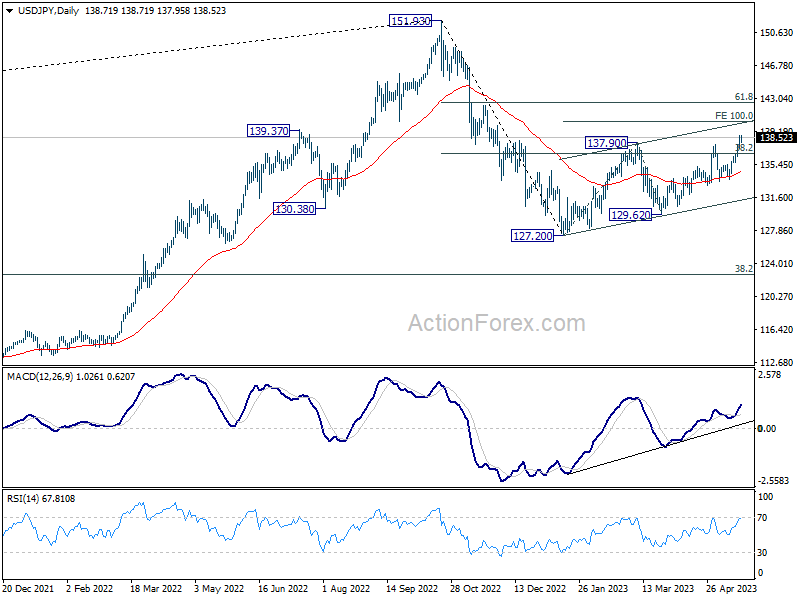
In the bigger picture, price actions from 151.93 high are currently seen as a corrective pattern to the long term up trend. The first leg should have completed at 127.20. Rebound from there is seen as the second leg. Sustained break of 38.2% retracement of 151.93 to 127.20 at 136.34 will bring stronger rise to 61.8% retracement at 142.48. Meanwhile, break of 129.62 will argue that the third leg is starting through 127.20 low.
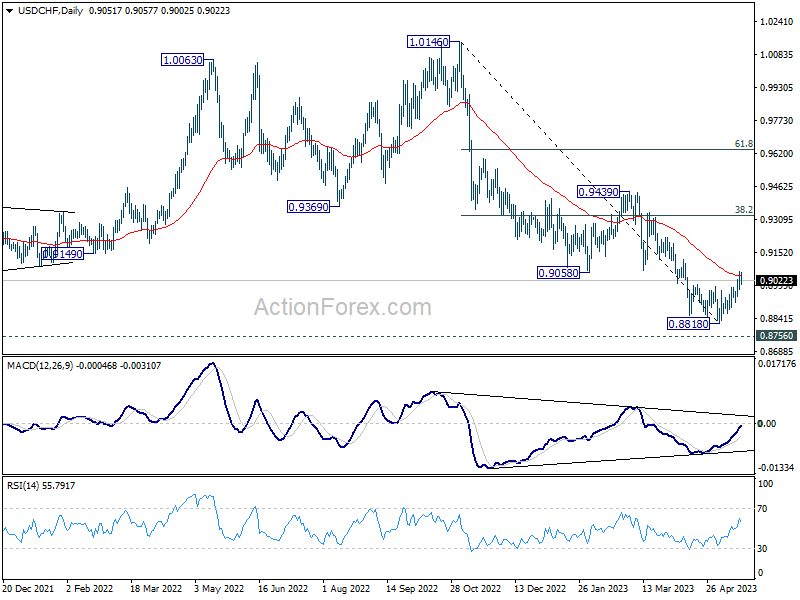
USD/CHF Mid-Day Outlook
Daily Pivots: (S1) 0.8997; (P) 0.9030; (R1) 0.9084; More...
Intraday bias in USD/CHF is turned neutral first with current retreat. Further rise will remain in favor as long as 0.8918 support holds. . Sustained trading above 55 D EMA (now at 0.9042) should confirm that current rally is at least correcting whole down trend from 1.0146. Further rise should then be seen to 38.2% retracement of 1.0146 to 0.8818 at 0.9325. On the downside, though, break of 0.8918 will bring retest of 0.8818 low instead.
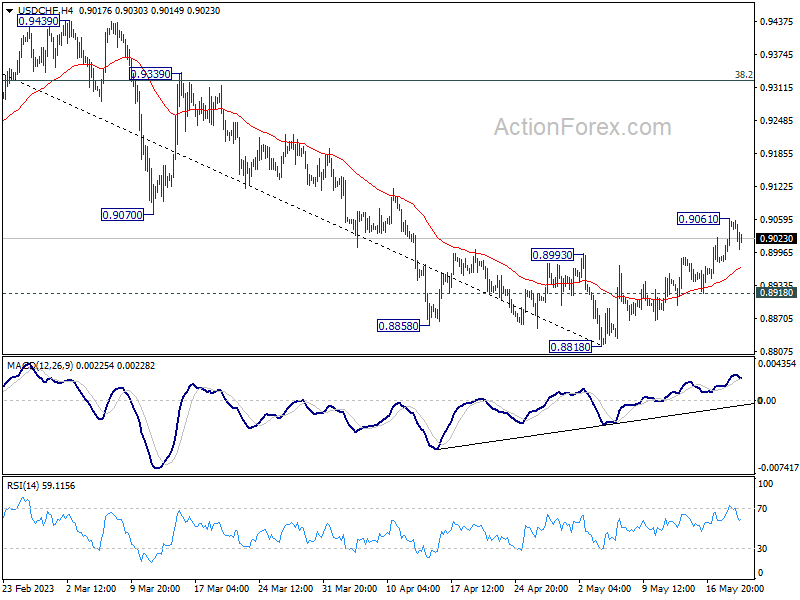
In the bigger picture, fall from 1.1046 (2022 high) is seen as a leg in the long term range pattern from 1.0342 (2016 high). So, downside should be contained by 0.8756 to bring reversal. Sustained break of 0.9058 support turned resistance will be the first sign of medium term bottoming. However, decisive break of 0.8756 will carry larger bearish implications.