

Sample Category Title
Gold Eases But Remains Above 2,000
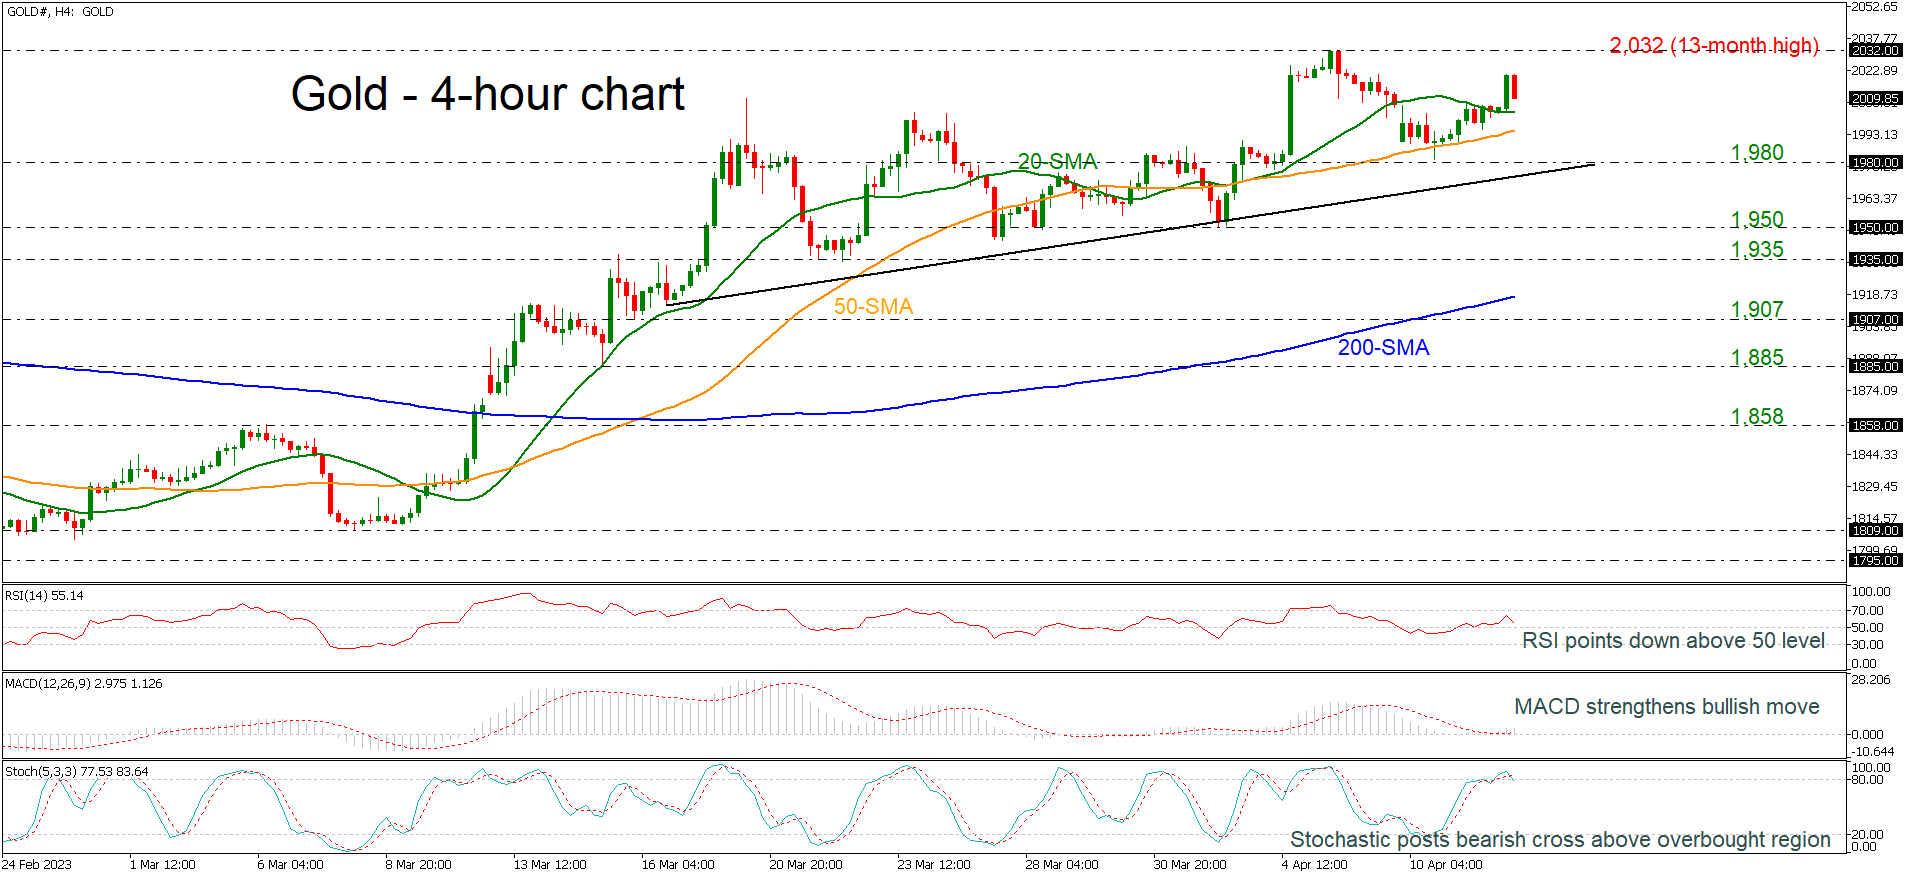
Gold is currently under pressure but is still above the 2,000 psychological mark and the short-term simple moving averages (SMAs) in the 4-hour chart. The short-term technical oscillators are showing some bearish signs and point to more weakness in the market. The RSI is pointing down above the 50 level and the stochastic is looking overstretched near the 80 level. However, the MACD is still above its trigger and zero lines, confirming the broader bullish outlook.
The next target to the downside is the 20-period SMA at 2,003 ahead of the 50-period SMA at 1,995. At this stage the market would see a retest of the 1,980 support level, which stands near the medium-term uptrend line.
Upside moves are likely to find resistance at a 13-month high of 2,032. There is an important resistance zone around 2,070, taken from the peak in March 2022.
In a nutshell, in the short term, the bullish phase remains in play especially if gold prices continue to trade above the ascending trend line and near the previous peak.
NZDUSD Slices Through 50-day SMA as Rebound Falters
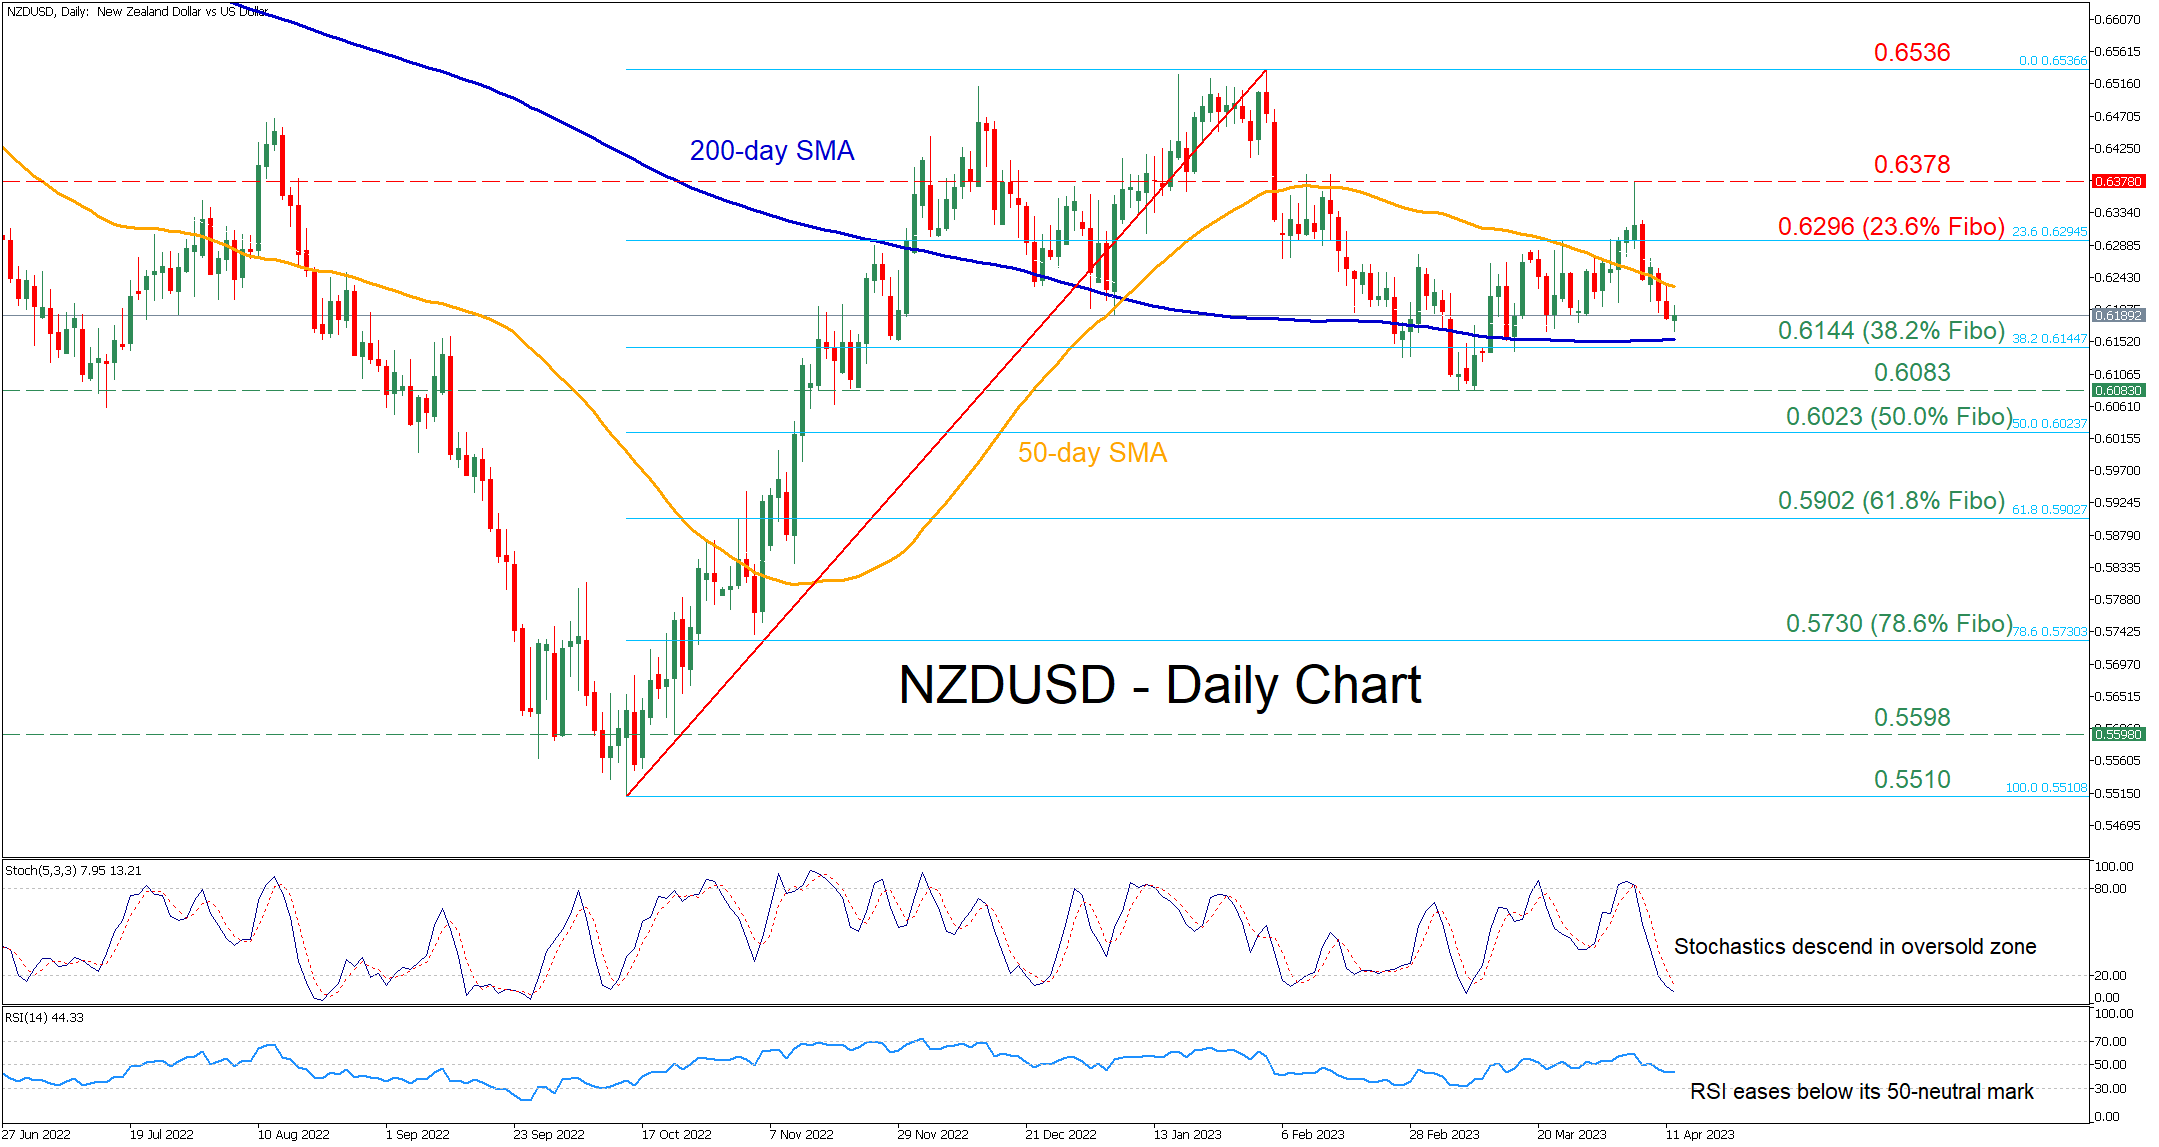
NZDUSD had been steadily gaining ground after finding its feet at the 2023 low of 0.6083 in early March. However, the recovery proved to be short-lived and the price reversed lower, diving beneath its 50-day simple moving average (SMA), while the focus has now shifted towards the 200-day SMA.
The momentum indicators currently suggest that near-term risks are tilted to the downside. Specifically, the stochastic oscillator is declining within the 20-oversold territory, while the RSI has flatlined beneath its 50-neutral mark.
Should bearish pressures intensify and the price cross below its 200-day SMA, 0.6144, which is the 38.2% Fibonacci retracement of the 0.5510-0.6536 upleg, it could act as the first line of defense. If that barricade fails, the spotlight could turn towards the 2023 low of 0.6083. Failing to halt there, the pair could challenge the 50.0% Fibo of 0.6023.
Alternatively, if buyers manage to pause the decline and push the price higher, immediate resistance could be met at the 23.6% Fibo of 0.6296. Piercing through that zone, the pair might ascend towards the recent rejection territory of 0.6378. A break above that region could pave the way for the 2023 peak of 0.6536.
Overall, NZDUSD’s technical picture has deteriorated after its latest rebound encountered strong resistance. Looking forward, the next move could be determined from whether the 200-day SMA manages to hold its ground.
USDCAD Posts Bearish Cross Within SMAs; Next Support at 1.3400
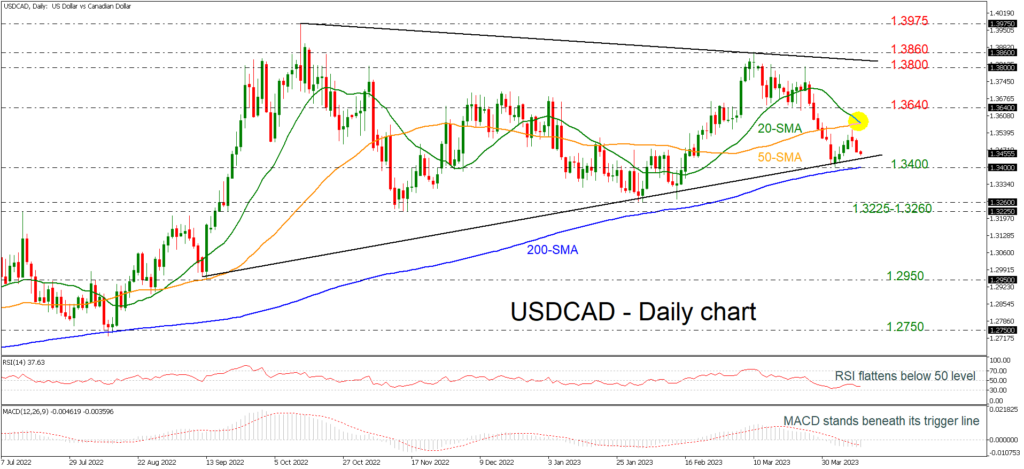
USDCAD is plunging towards the long-term uptrend line that may act as a turning point for traders. The 20- and the 50-day simple moving averages (SMAs) are ready to post a bearish crossover, confirming the recent bearish movement from the 1.3800 psychological mark. The RSI indicator is moving sideways beneath the 50 level, while the MACD is moving below its trigger and zero lines.
Any more losses could drive the market towards the immediate support of 1.3400, which overlaps with the 200-day SMA. If the bears send the price below these key levels, then they may switch the outlook to bearish, meeting the 1.3225-1.3260 support region.
Otherwise, any attempts to the upside may find strong resistance at the short-term SMAs currently at 1.3580 before testing the 1.3640 barrier. Above that, the 1.3800 psychological mark and the medium-term downtrend line around 1.3830 may halt bullish actions.
Summarizing, USDCAD is still standing within a triangle and only an advance above 1.3860 or below 1.3400 may decide the next directional movement.
Crypto Market Takes Profits
Market picture
Bitcoin hit a 10-month high above $30,500 on Tuesday. However, two attempts by the bulls to build a sustained rally were not supported by the market. On Wednesday morning, the price dropped below $30K, losing 0.4% over the past 24 hours.
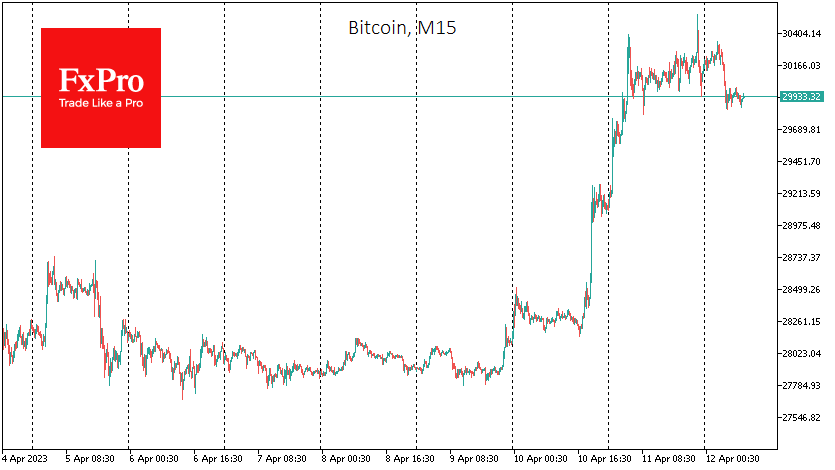
The crypto market has lost more than 1.2% over the same period to $1.22 trillion. Traders are rushing to lock in profits from the recent rally amid concerns about volatility ahead of today’s US inflation figures.
According to CoinShares, investments in cryptocurrencies rose by $57M last week, the third consecutive week of inflows. Bitcoin investments increased by $56M, Ethereum by $0.6M, Uniswap by $0.5M and Polkadot by $0.4M.
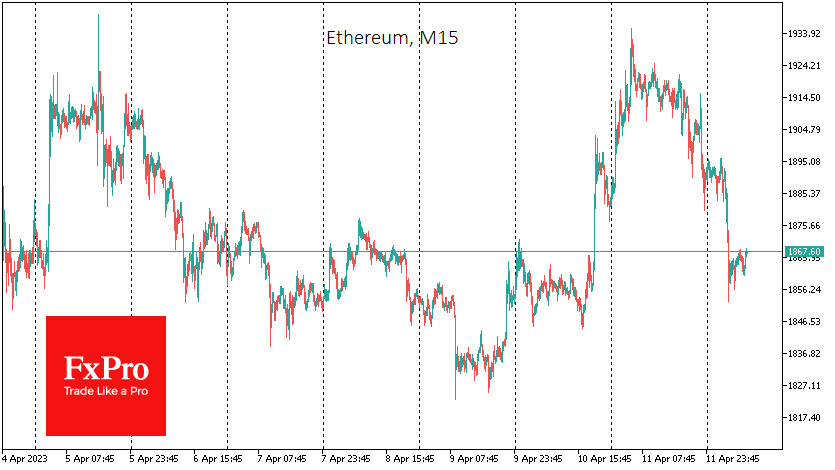
Despite the positive investor sentiment, trading volumes for the week were low at $970M. The same trend was seen in the global BTC exchange market, where trading volumes for the week were only 25% of the average since the beginning of the year, Coinshares noted.
News background
The US dollar is heading for an “absolute collapse” that will strongly boost Bitcoin’s growth, said Larry Lepard, founder of Equity Management Associates. In his view, a tight supply of 21 million coins would give BTC a key advantage over gold and play an important role in its “long-term parabolic growth”.
US business magazine Fortune has compiled its first ranking of the top 40 cryptocurrency companies in eight categories – the Crypto 40. In the protocol category, bitcoin gave way to Ethereum.
According to Messari, Cardano outperformed Bitcoin and Ethereum by blockchain transaction volume. However, Cardano lags far behind BTC and ETH in the number of active addresses.
GBP/JPY Daily Outlook
Daily Pivots: (S1) 165.48; (P) 165.84; (R1) 166.49; More...
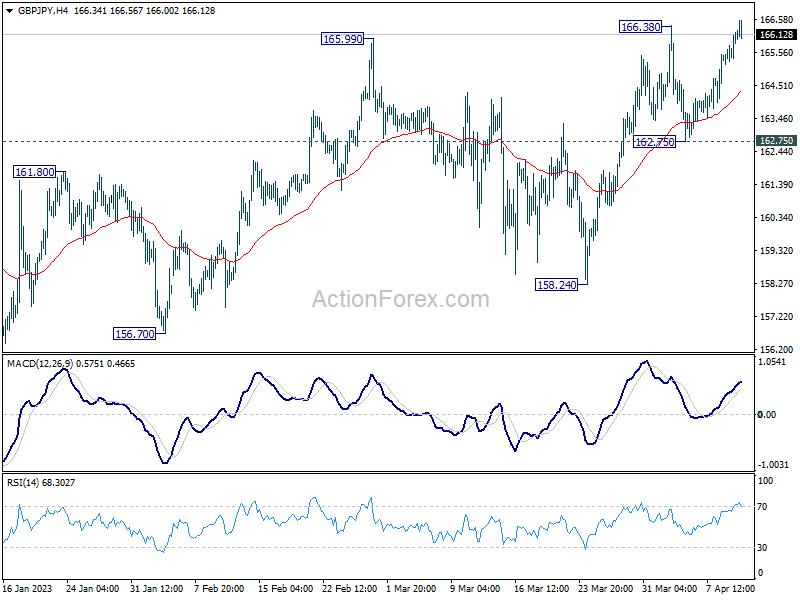
Intraday bias in GBP/JPY is back on the upside with break of 166.38 resistance. Rise from 155.33 is resuming and further rally should be seen to 69.26 resistance next. On the downside, however, break of 162.75 minor support will mix up the outlook and turn intraday bias to the downside for 158.24 support instead.
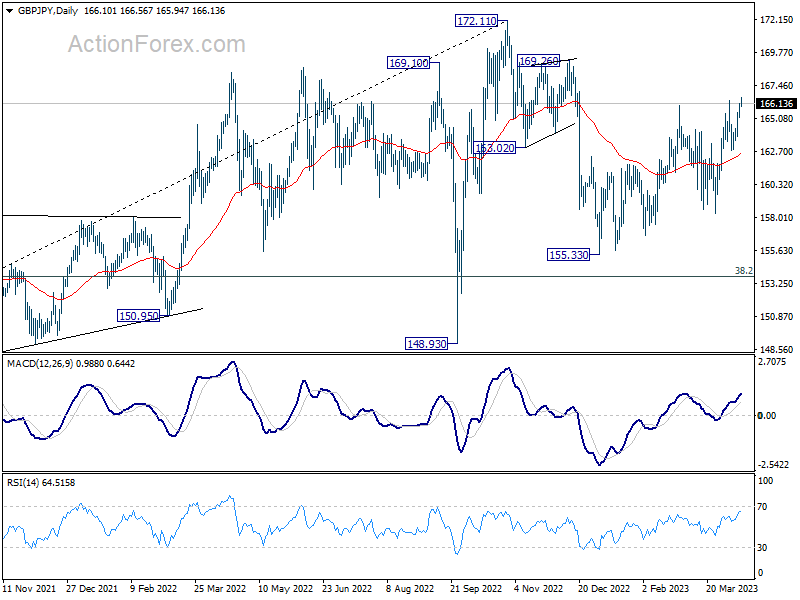
In the bigger picture, as long as 38.2% retracement of 123.94 (2020 low) to 172.11 (2022 high) at 153.70 holds, medium term bullishness is retained. That is, larger up trend from 123.94 (2020 low) is still in progress. Break of 172.11 high to resume such up trend is expected at a later stage.
EUR/JPY Daily Outlook
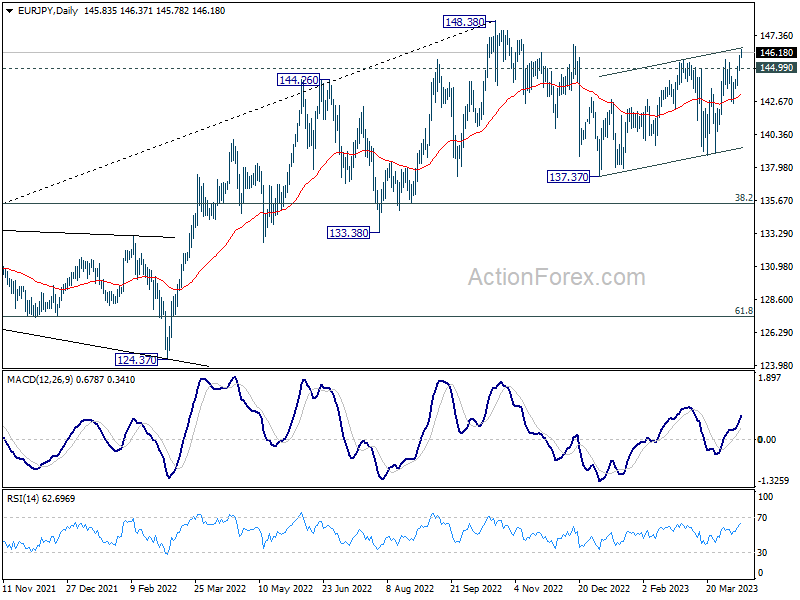
Daily Pivots: (S1) 145.20; (P) 145.58; (R1) 146.29; More....
Intraday bias in EUR/JPY is back on the upside with break of 145.66 resistance. Rise from 137.37 is resuming and further rally should be seen back to retest 148.38 high. Meanwhile, break of 144.99 minor support will mix up the outlook again and turn intraday bias neutral.
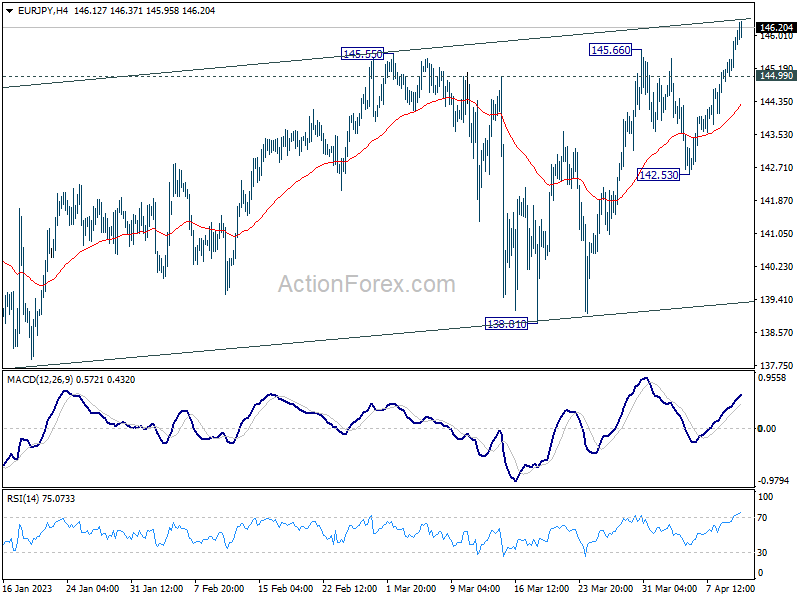
In the bigger picture, as long as 55 week EMA (now at 139.78) holds, larger up trend from 114.42 (2020 low) is still in progress for 149.76 long term resistance. However, sustained break of 55 week EMA will bring deeper fall to 38.2% retracement of 114.42 to 148.38 at 135.40. Decisive break there will raise the chance of trend reversal, and target 61.8% retracement at 127.39.
EUR/GBP Daily Outlook
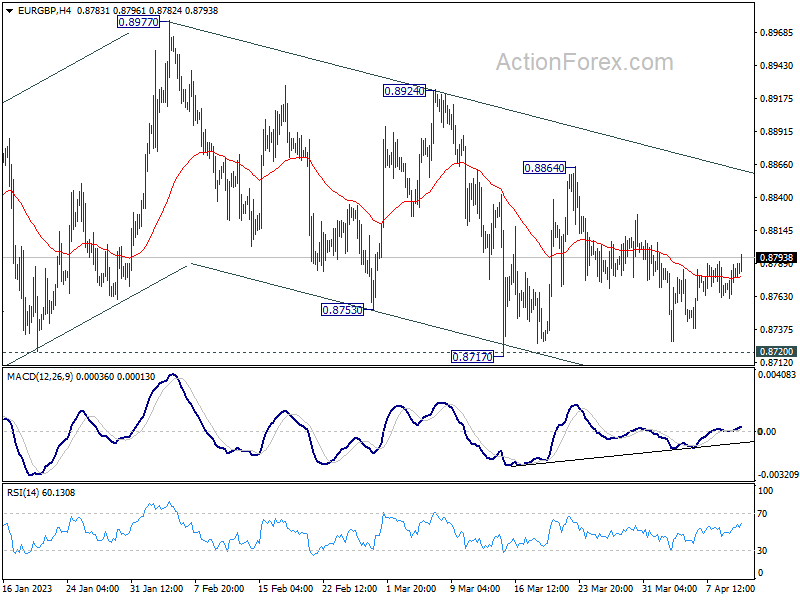
Daily Pivots: (S1) 0.8767; (P) 0.8779; (R1) 0.8794; More...
Intraday bias in EUR/GBP remains neutral as sideway trading continues. On the upside, break of 0.8864 will target 0.8924 resistance first. Firm break there should resume larger rise from 0.8545 through 0.8977 high. However, decisive break of 0.8717 support will resume the decline from 0.8977 instead.
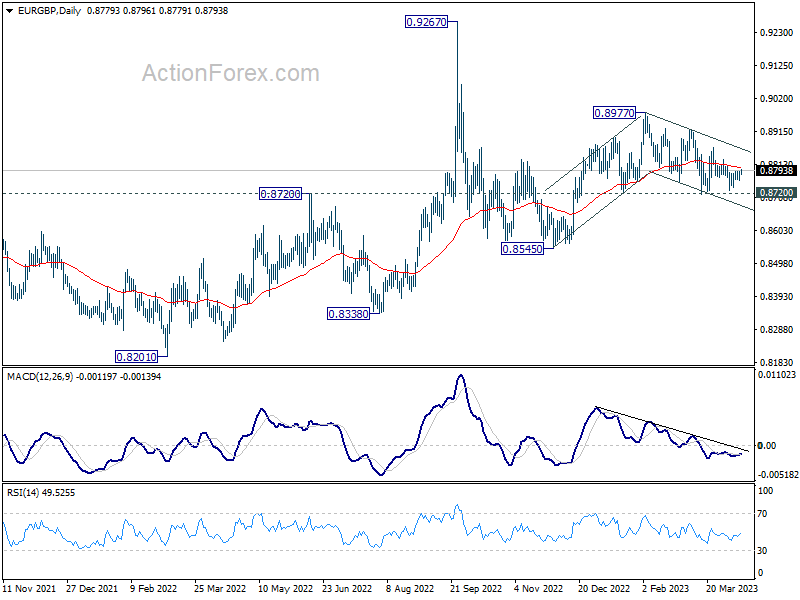
In the bigger picture, outlook remains rather mixed for now, except that price actions from 0.9267 (2022 high) are part of the long term range pattern from 0.9499 (2020 high). With 0.8720 support intact, rise from 0.8545 is in favor to continue through 0.8977. However, firm break of 0.8720 will argue that such rebound has completed, and open up deeper fall through this support level.
EUR/AUD Daily Outlook
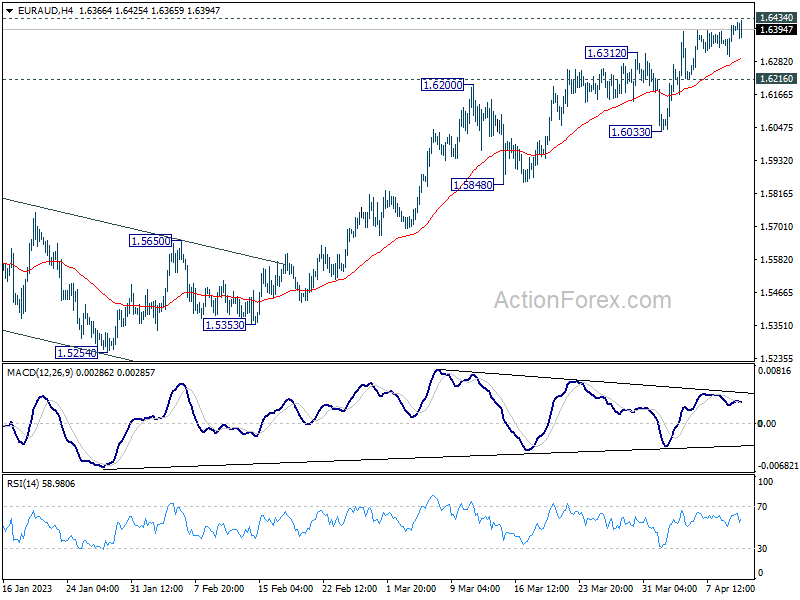
Daily Pivots: (S1) 1.6331; (P) 1.6371; (R1) 1.6441; More...
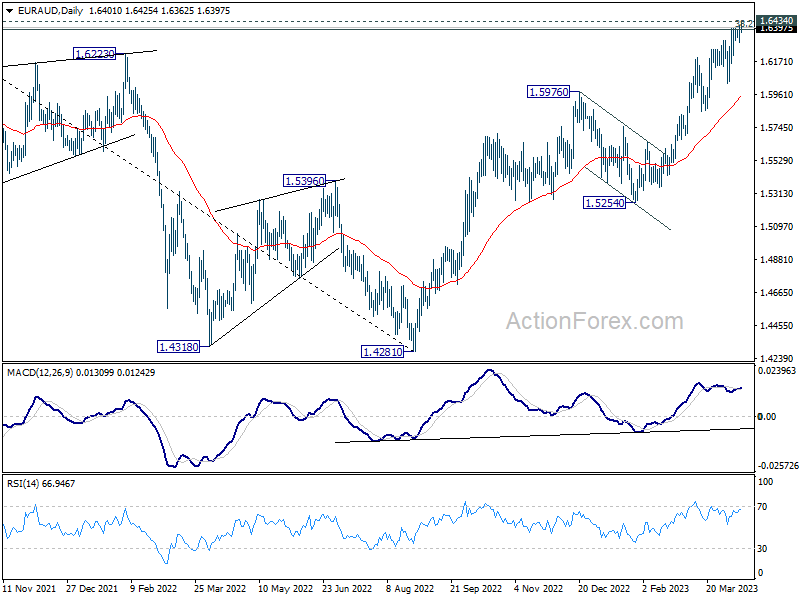
Focus is back on 1.6434 key resistance with EUR/AUD trading to resume recent rally. Decisive break there will carry larger bullish implications. Nevertheless, considering bearish divergence condition in 4H MACD, firm break of 1.6216 should confirm short term topping, after rejection by 1.6389/6434 cluster resistance zone. Intraday bias will be back on the downside in this case, to 1.6033 support and possibly below.
In the bigger picture, focus stays on 1.6389/6434 cluster resistance (38.2% retracement of 1.9799 to 1.4281 at 1.6389). Sustained break there should confirm that whole down trend from 1.9799 (2020 high) has completed. Further rally should then be seen to 61.8% retracement at 1.7691. However, rejection by this cluster resistance will make medium term outlook neutral at best.
EUR/CHF Daily Outlook
Daily Pivots: (S1) 0.9861; (P) 0.9875; (R1) 0.9891; More...
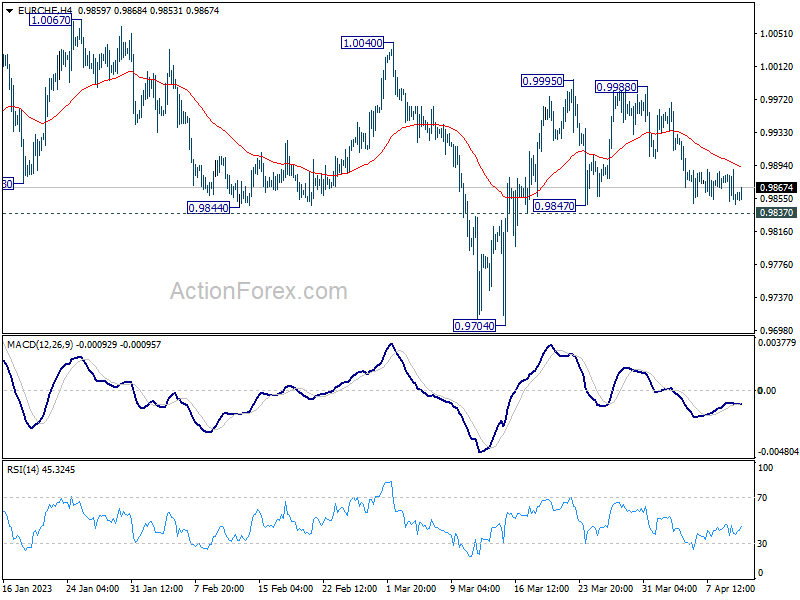
Range trading continues in EUR/CHF and intraday bias remains neutral for the moment. With 0.9837 support intact, rise from 0.9704 is still in favor to resume later. Break of 0.9995 will target a retest on 1.0067 high. However, firm break of 0.9837 will indicate that the rebound has completed, and turn bias back to the downside for retesting 0.9704 low.
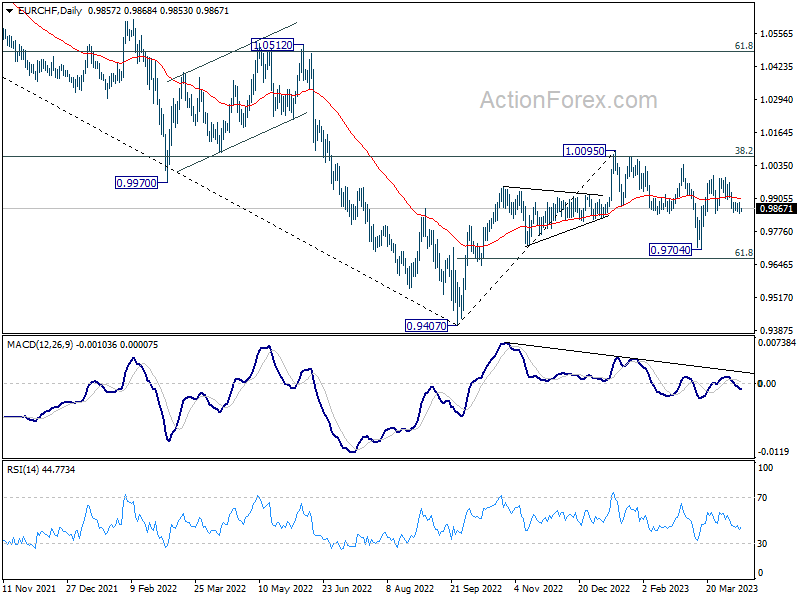
In the bigger picture, prior rejection by 55 week EMA (now at 1.1002) and 38.2% retracement of 1.1149 to 0.9407 at 1.0072 suggests that medium term outlook is staying bearish. That is, down trend from 1.2004 is not completed yet and is in favor to resume through 0.9407 at a later stage. However, decisive break of 1.0095 resistance will raise the chance of bullish trend reversal. Rise from 0.9407 should then target 1.0505 cluster resistance (2020 low at 1.0505, 61.8% retracement of 1.1149 to 0.9407 at 1.1484).
GBP/USD Starts Fresh Increase While EUR/GBP Eyes Upside Break
GBP/USD started a fresh increase above the 1.2400 resistance zone. EUR/GBP is struggling and facing resistance near 0.8790.
Important Takeaways for GBP/USD and EUR/GBP
- The British Pound started a fresh increase above the 1.2400 barrier against the US Dollar.
- There was a break above a key bearish trendline with resistance near 1.2410 on the hourly chart of GBP/USD.
- EUR/GBP is struggling to break the 0.8790 resistance zone.
- There is a major bullish trendline forming with support near 0.8770 on the EUR/GBP hourly chart.
GBP/USD Technical Analysis
This past week, the British Pound saw a downside correction below the 1.2400 support against the US Dollar. The GBP/USD pair tested the 1.2345 zone before the bulls took a stand.
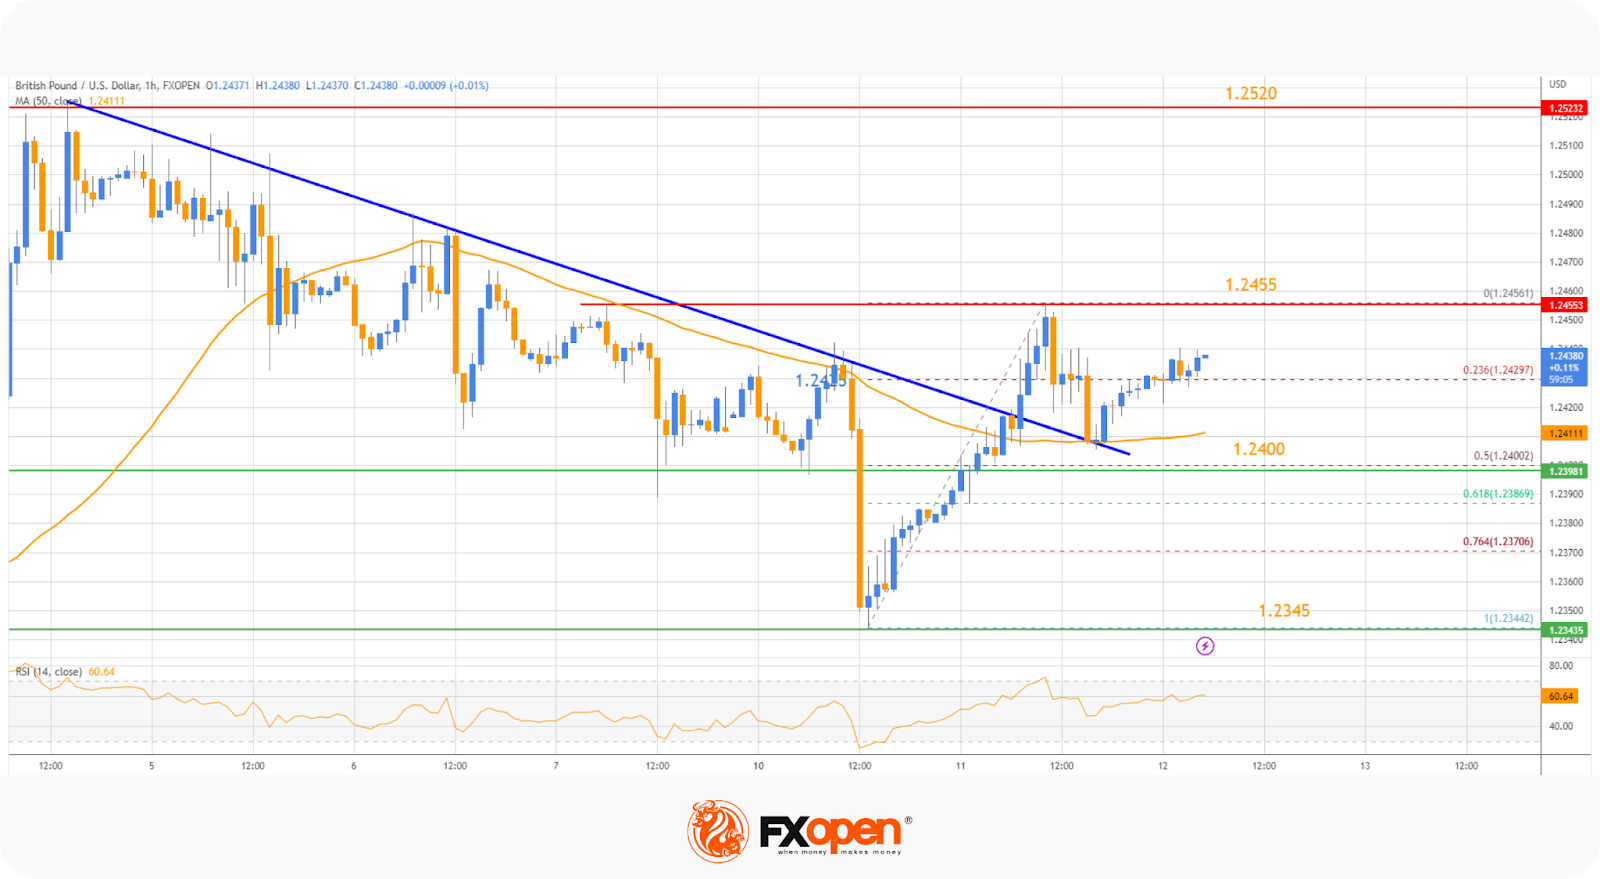
On the hourly chart at FXOpen, a low was formed near 1.2344, and the pair started a fresh increase. There was a clear move above the 1.2400 resistance zone. More importantly, there was a break above a key bearish trendline with resistance near 1.2410.
The pair traded at 1.2456 and settled above the 50-hour simple moving average. There was a minor downside correction below the 23.6% Fib retracement level of the upward move from the 1.2027 swing low to the 1.2205 high.
However, the pair remained well-bid above the 50% Fib retracement level at 1.2400.
If there is a downside break below the 1.2400 support, there is a risk of a sharp decline. In the stated case, GBP/USD may revisit the 1.2355 support. Any more losses could lead the pair toward 1.2300.
On the upside, resistance is near the 1.2355 level, above which the pair might resume its increase (considering the RSI is above 50). The next major resistance is near the 1.2520 level. A clear move above 1.2520 could trigger a rally toward 1.2600.
EUR/GBP Technical Analysis
On the hourly chart at FXOpen, the Euro traded in a small range below the 0.8790 resistance zone against the British Pound. The EUR/GBP pair made a couple of attempts to break the 0.8790 resistance but failed.
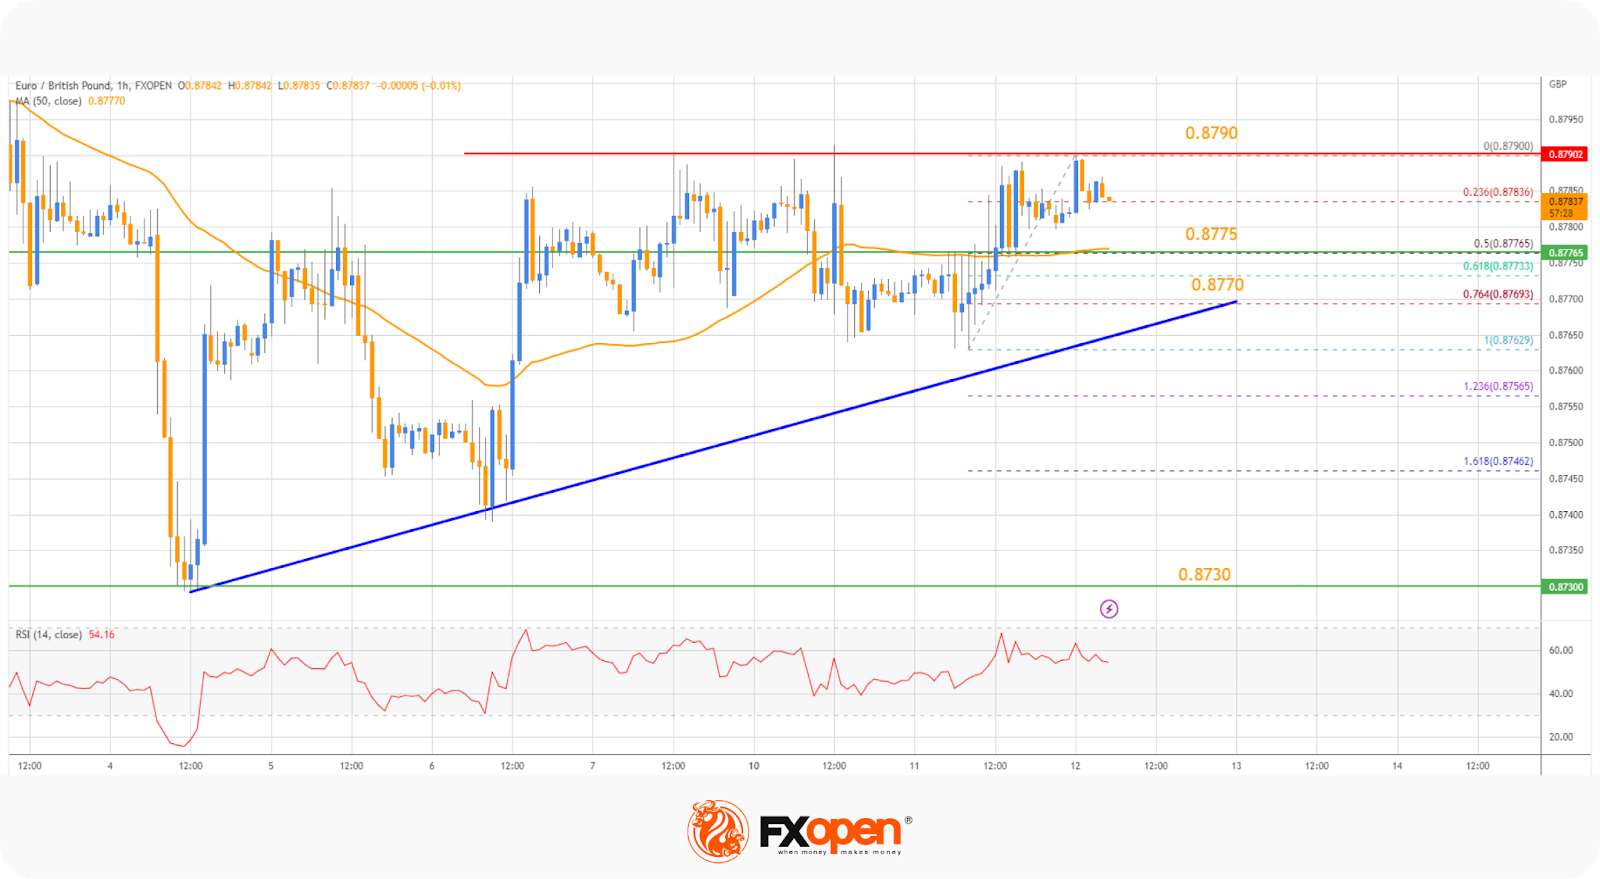
The recent high was formed near 0.8790, and the pair is now consolidating. If there is a bearish reaction and RSI falls below 50, the pair might find bids near the 50-hour simple moving average at 0.8755. The stated support coincides with the 50% Fib retracement level of the upward move from the 0.8762 swing low to the 0.8790 high.
The next major support is near a bullish trendline at 0.8770. A downside break below it may lead to more downward moves. In the stated case, the pair could decline toward the 0.8730 support level in the near term.
Conversely, the bulls could break above the 0.8790 resistance. The next major barrier for the bulls is near 0.8825, above which EUR/GBP could accelerate higher. In the stated case, the bulls may perhaps aim for a test of 0.8880. Any more gains might send the pair toward the 0.8900 level.