Sample Category Title
Banking Concerns Subside, Inflation Worries Ease, Dollar Lost Ground
Last week, investors appeared to view the banking crisis as well-contained, pushing it into the rearview mirror. Confidence saw a revival, resulting in significant gains for major global stock indexes. In tandem with the lower-than-anticipated inflation figures from the US, market sentiment underwent a notable shift, paving the way for a fresh start in Q4, with a renewed focus on economic data and interest rate projections..
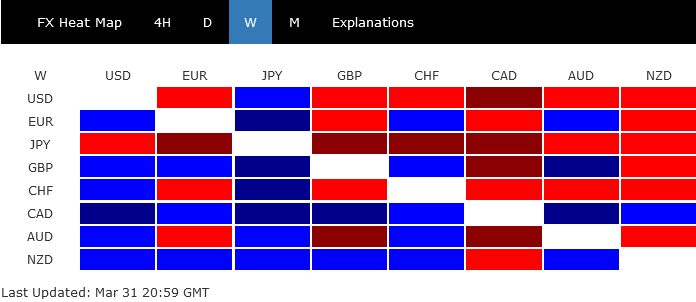
Yen, Dollar, and Swiss Franc, typically seen as safe-haven currencies, emerged as the weakest performers last week. Their late recoveries on Friday likely indicate month-end adjustments rather than a genuine return to risk aversion. On the other hand, Canadian Dollar was the top performer, benefitting from a surge in oil prices, followed by New Zealand Dollar, British Pound, and Australian Dollar. Euro's performance was mixed but leaned more towards strength.
With no meetings scheduled for Fed or ECB in April at the outset of Q2, the current risk-on trend has room to continue. This ongoing development could further restrain Dollar's rebound. The main question now is whether commodities will switch positions with their European counterparts. It's also important to keep an eye on Bitcoin, Gold, and oil prices, as their movements could confirm trends in stocks and currencies.
Optimism prevails with banking crisis in rearview mirror
Last week's strong finishes in major global stock indexes signaled an overall positive risk sentiment, as investors appeared to view the recent banking crisis as fully contained. Additionally, a lower-than-expected reading in Fed's preferred inflation gauge confirmed the ongoing disinflation process, suggesting there is less need for the Fed to revert to aggressive rate hikes. Some Fed officials have noted that recent developments could prompt banks to tighten lending standards, which could partially offset the need for additional rate increases.
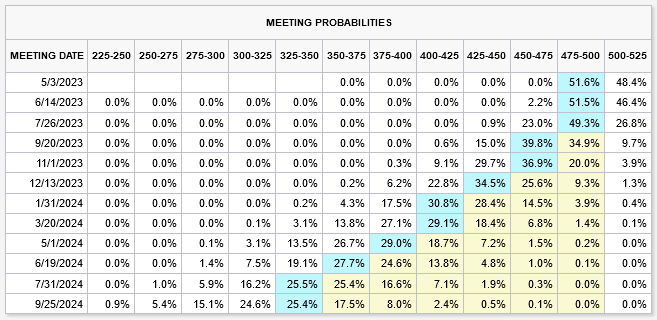
Fed fund futures are pricing in a 50/50 chance of another 25bps hike by Fed in May. But it's crucial to note the changing market expectations for rate path ahead. Currently, there is over a 55% chance of a cut back to 4.50-4.75% in September and over a 63% chance of interest rates returning to 4.25-4.50% by the end of the year.
NASDAQ ready for upside breakout, S&P 500 following
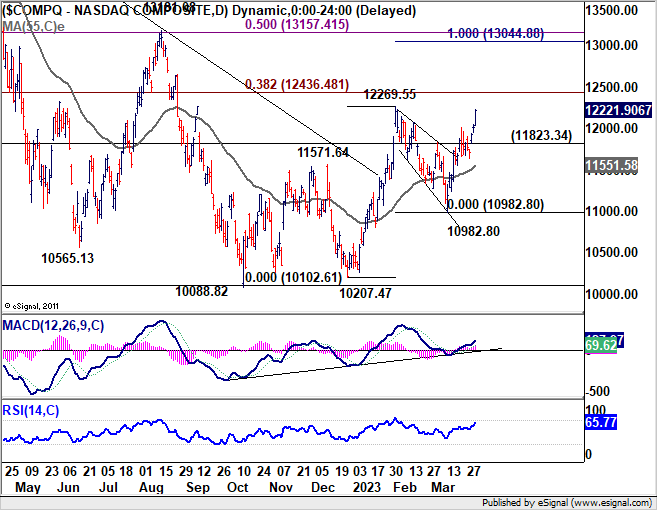
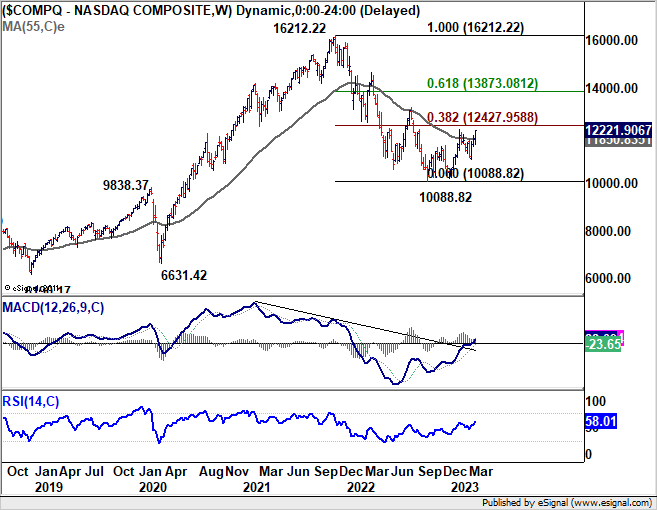
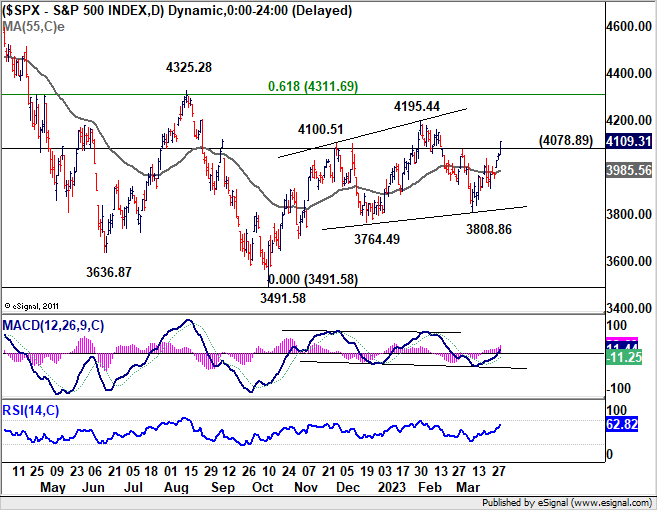
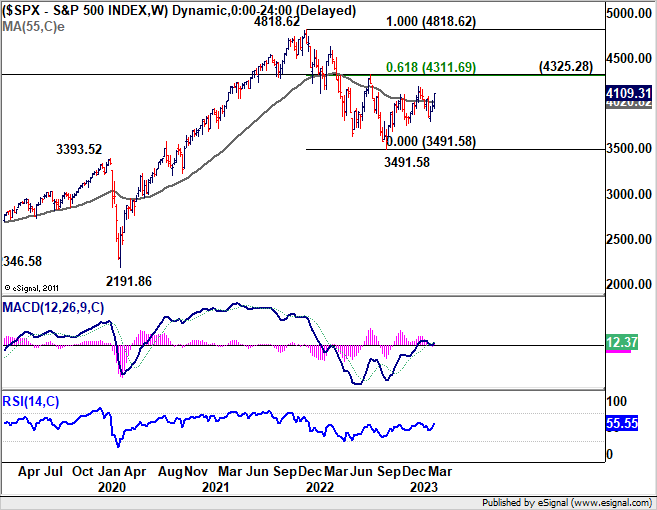
With improved market sentiment, NASDAQ was an outperformer for both March and Q1, up 6.69% and 16.77% respectively. It's indeed the best quarter for the tech-heavy index since 2020. S&P 500 was up 3.51% for the month and 7.03% for the quarter. DOW was a lagger, up only 1.89% for the month and only 0.38% in Q1.
Based on current momentum, NASDAQ should take out 12269.55 resumed very soon to resume the whole rally from 10088.82. 38.2% retracement of 16212.22 to 1088.82 at 12427.95 shouldn't be a big problem for the index. The real test lies in 100% projection of 10207.47 to 12269.55 from 10982.80 at 13044.88. The level is close to 50% retracement at 13157.41. Or to put it simple, around 13k handle. Reaction there would reveal much on whether NASDAQ is reversing whole fall from 16212.22, or it's just in a corrective rebound. But in any case, near term outlook will now stay bullish as long as 11823.34 support holds.
S&P 500's break of 4078.89 resistance last week was also a bullish development. Pull back from 4195.44 should have completed at 3808.86. Further rise is expected as long as 55 day EMA (now at 3985.56) holds. Break of 4195.44 resistance will resume whole rebound from 3491.58 to 61.8% retracement of 4818.62 to 3491.58 at 4311.69, which is close to 4325.58 resistance. Sustained break there will pave the way back to 4818.62 high, even as the second leg of the corrective pattern from there.
DAX reversed all banking crisis losses, Nikkei closed higher in range
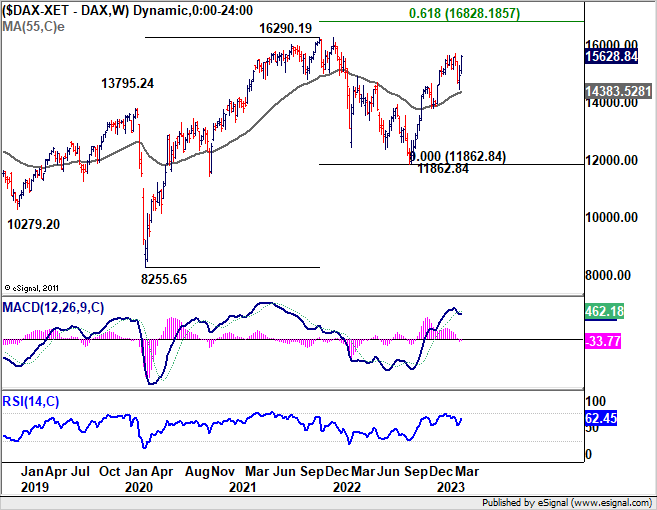
Performance of German DAX was also impressive as it ended the quarter with 12.25% gain with Friday's strong rally. The losses from the banking crisis was totally reversed. Immediate focus is now on 15706.37 resistance in the coming days. Decisive break there will resume the rise from 11862.84 to retest 16290.19 record high.
It should also be noted that the strong support from 55 week EMA (now at 14383.54) was a medium term bullish signal too. The rally might not hit real resistance until meeting 61.8% projection of 8255.65 to 16290.19 form 11862.84 at 16828.18 later in the quarter.
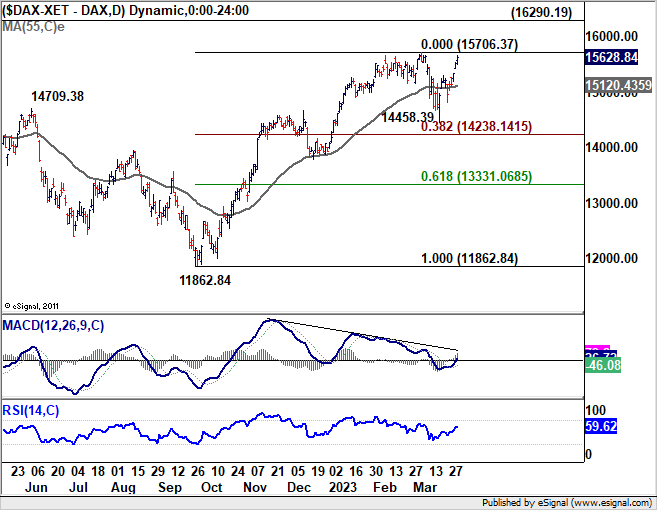
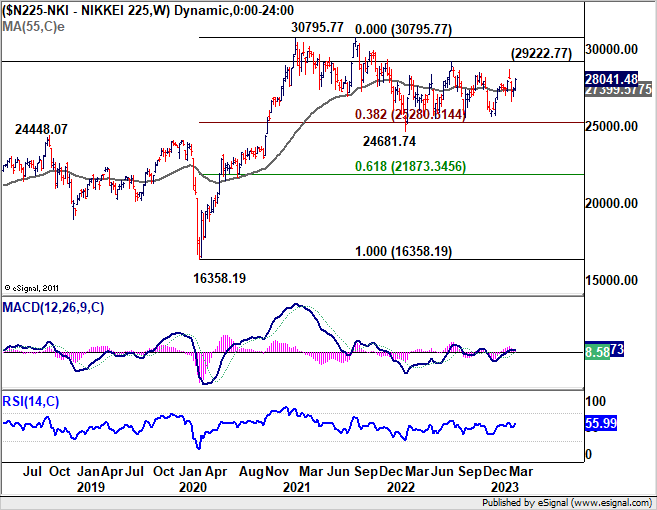
Nikkei's has a strong weekly close, even though it's still stuck in medium term range trading. Overall performance was indeed not bad. With the all market turbulence, it's just extending the sideway pattern that started back in late 2021. Indeed, barring a week of climax selloff to 24681.75, the index managed to defend 38.2% retracement of 16358.19 to 30795.77 at 25280.61 well.
Medium term outlook stays neutral in Nikkei for now, with favor on an upside breakout eventually. Break of 29222.77 could prompt further rise to retest 30795.77 high first.
Dollar index gyrated lower, but range trading is the base case
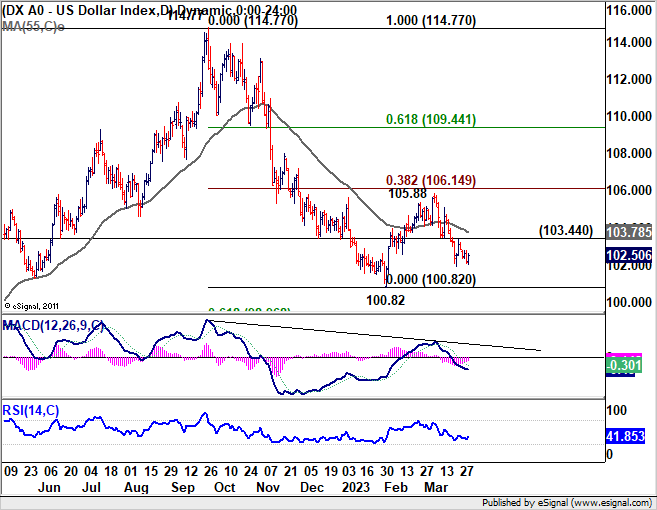
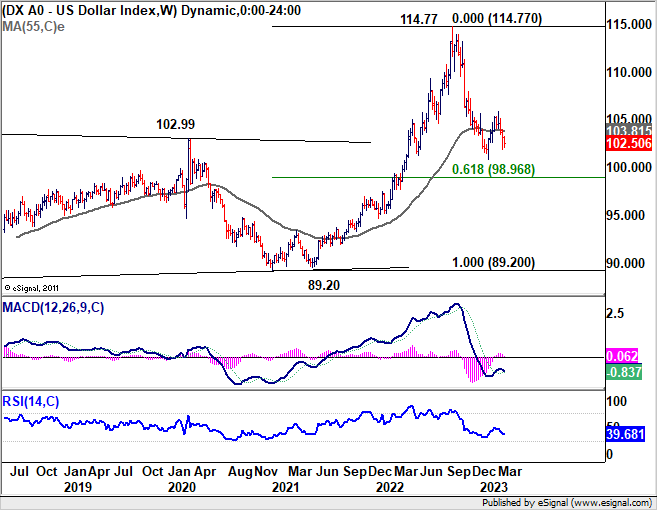
Dollar index gyrated lower last week after failing to break through 103.44 support turned resistance. The question remains on whether price action from 100.82 are developing into a three wave corrective pattern. Hence, even in case of deeper decline in the DXY, attention should be paid on reversal sign is it approaches 100.82 low. On the other hand, break of 103.44 will argue that the third leg of the pattern has started for 38.2% retracement of 114.77 to 100.82 at 106.14. After all, the favored case is for range trading to continue between 100.82 to 106.14 for a while.
Bitcoin, Gold and oil price are worth attention in April
Looking ahead in April, the developments in Bitcoin, Gold and oil prices are worth much attention.
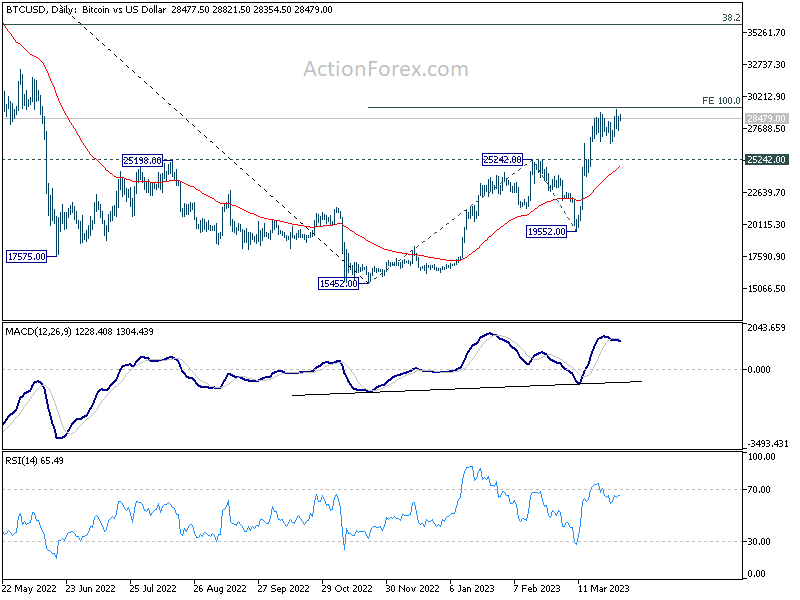
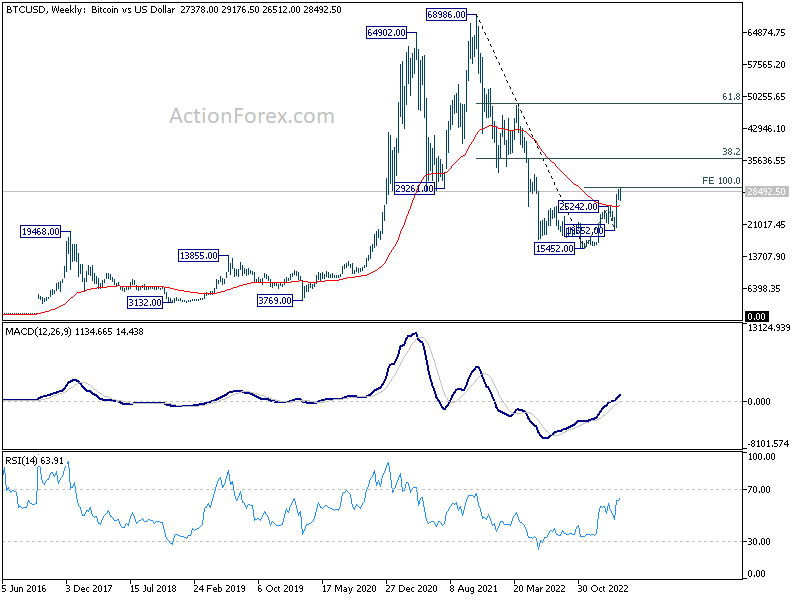
Bitcoin would continued to be seen as a gauge for overall risk sentiment, in particular as a proxy to NASDAQ. Rally from 15452 haled ahead of 100% projection of 15452. to 25242 from 19552 at 29342. Retreat is contained well above 25242 resistance turned support so far, keeping outlook bullish. Firm break of 29342, and probably more importantly the 30k handle, could prompt upside acceleration. That would bring further rise to 38.2% retracement of 68986 to 15452 at 35901 at least. If realized, NASDQ should also march towards 13k handle in tandem.
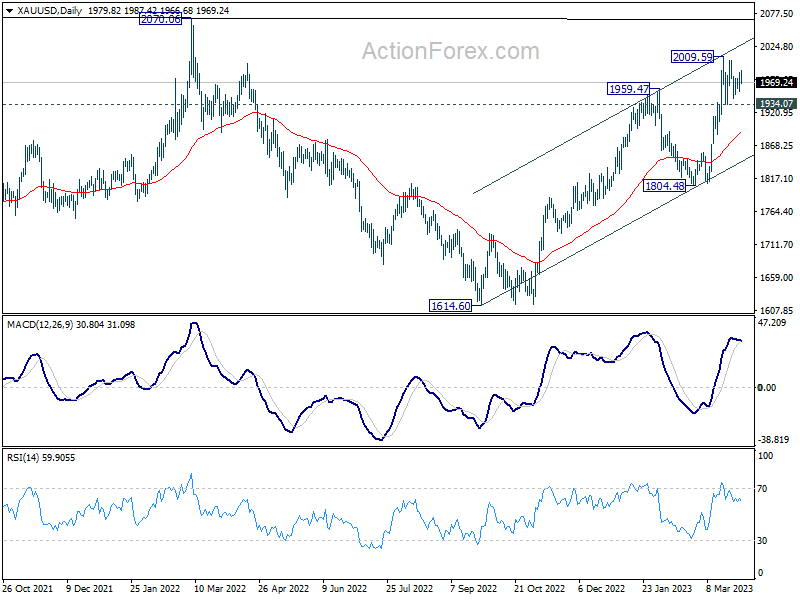
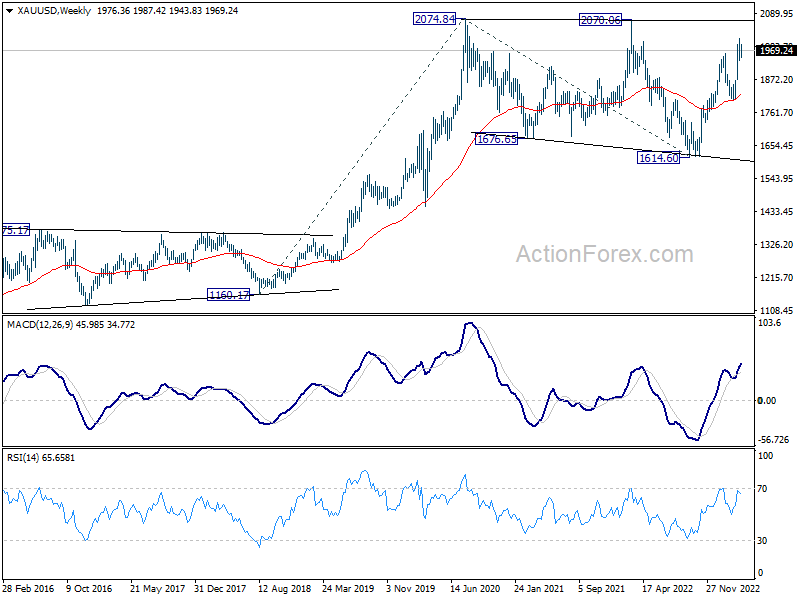
Gold will be used to gauge intensity if Dollar is back in selloff mode. So far, price actions in Gold price 2009.59 are corrective looking, keeping near term outlook bullish. Break of 2009.59 could extend the rise from 1614.60 to retest 2070.06/2074.84 key resistance zone. Rejection by this resistance zone, if happens, should come with DXY bouncing off 100.82 support. Firm break of 2074.84 in Gold could have DXY breaking through 100.82 low together. Meanwhile, break of 1934.07 support in Gold could also have DXY breaking through 103.44 resistance for a stronger rebound.
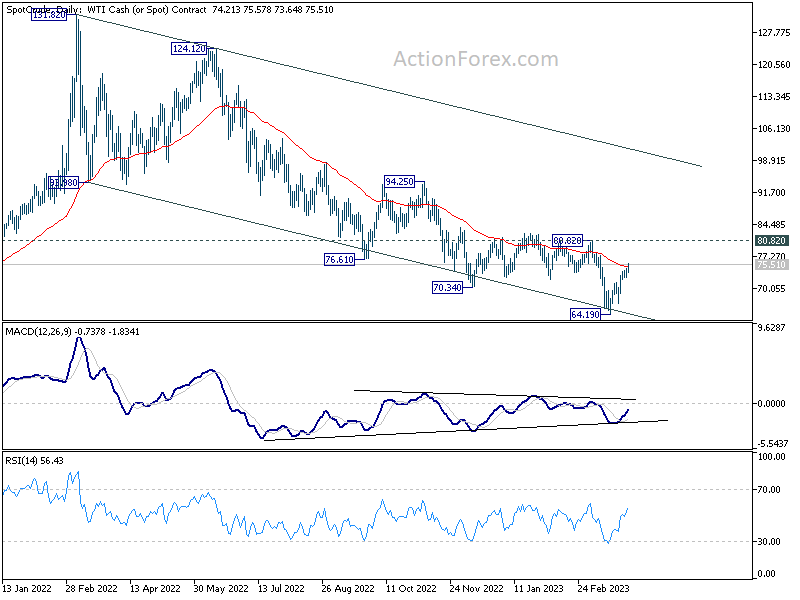
WTI crude oil extended the rebound from 64.19 last week on tightening supplies, as well as Fed expectations. With bullish convergence condition in daily MACD, there is reason for 64.19 to be a medium term bottom. But it's way too early to call for a bullish trend reversal, with upside capped well below 80.82, even though further rise is in favor towards this resistance level for the near term. So, while the support the Canadian Dollar could continue, it might not last long until 80.82 is cleanly taken out. In that case, traditional stocks in DOW could also undergo a revival too.
USD/CAD Weekly Outlook
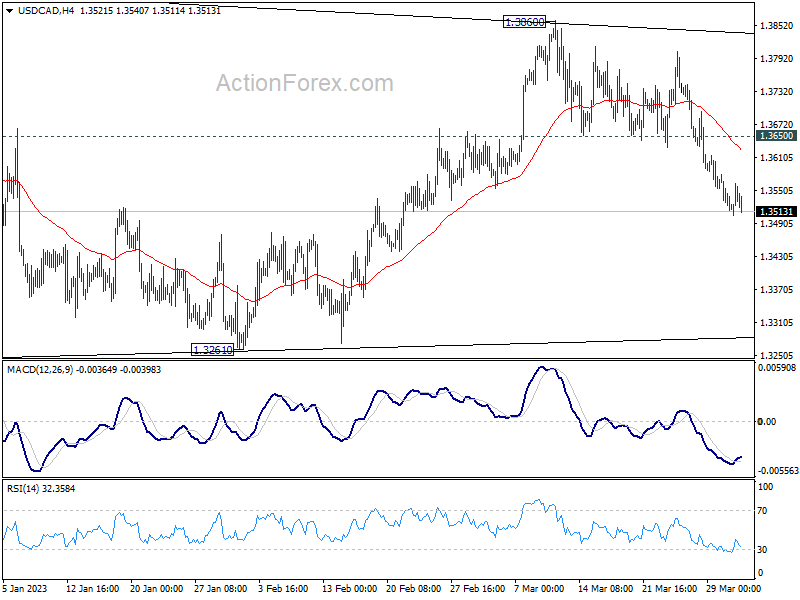
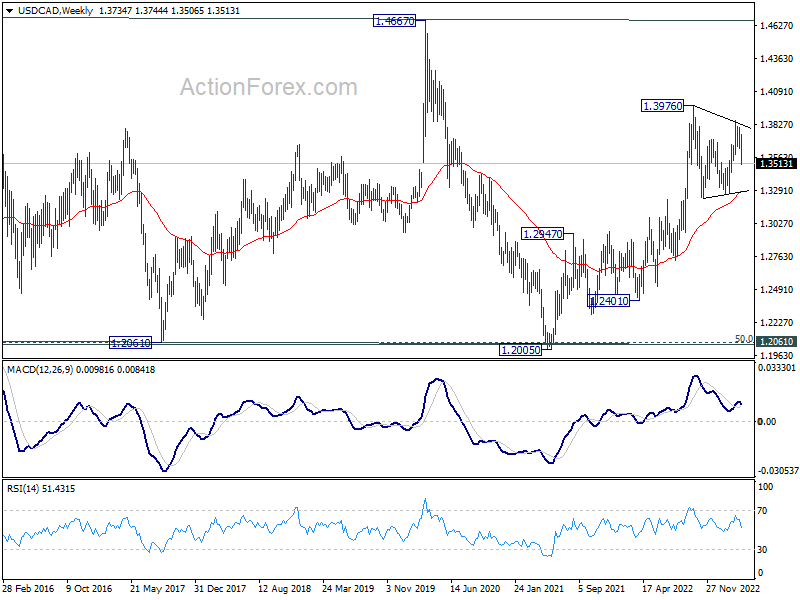
USD/CAD's decline from 1.3860 last week suggests that corrective pattern from 1.3976 is extending with another falling leg. Initial bias remains on the downside this week for 1.3224/61 support zone. But strong support should be seen around there to bring rebound. Still, break of 1.3650 support turned is needed to indicate completion of the decline first. Or further fall will remain in favor in case of recovery.
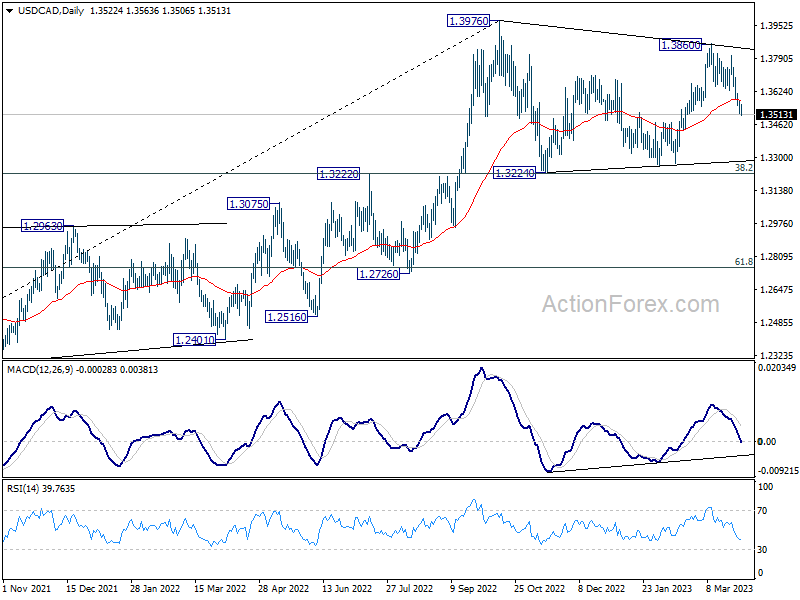
In the bigger picture, the up trend from 1.2005 (2021 low) is still in progress. Break of 1.3976 will confirm resumption and target 61.8% projection of 1.2401 to 1.3976 from 1.3261 at 1.4234. Firm break there will pave the way to long term resistance zone at 1.4667/89 (2016, 2020 highs). On the downside, sustained break of 55 week EMA (now at 1.3282) is needed to confirm medium term topping. Otherwise, outlook will remain bullish even in case of deep pull back.
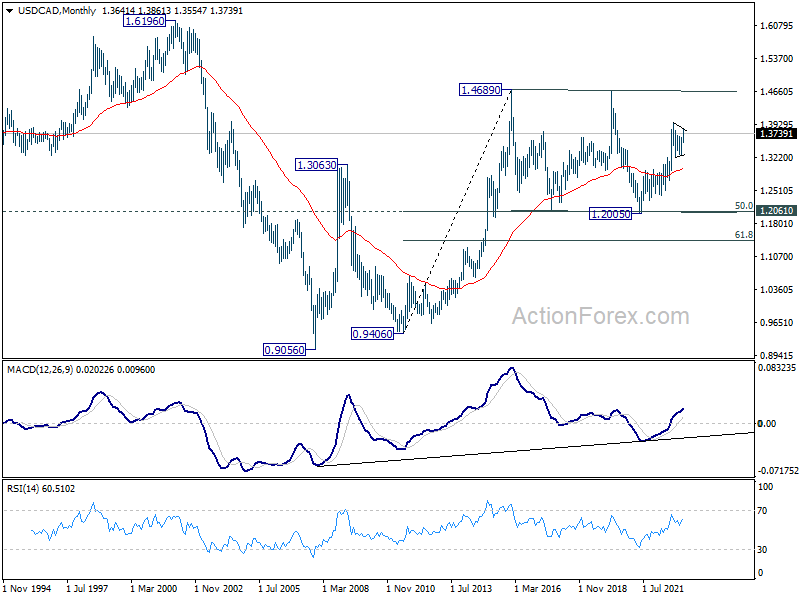
In the longer term picture, price actions from 1.4689 (2016 high) are seen as a consolidation pattern only, which might have completed at 1.2005. That is, up trend from 0.9506 (2007 low) is expected to resume at a later stage. This will remain the favored case as 55 month EMA (now at 1.3003) holds.
EUR/USD Weekly Outlook
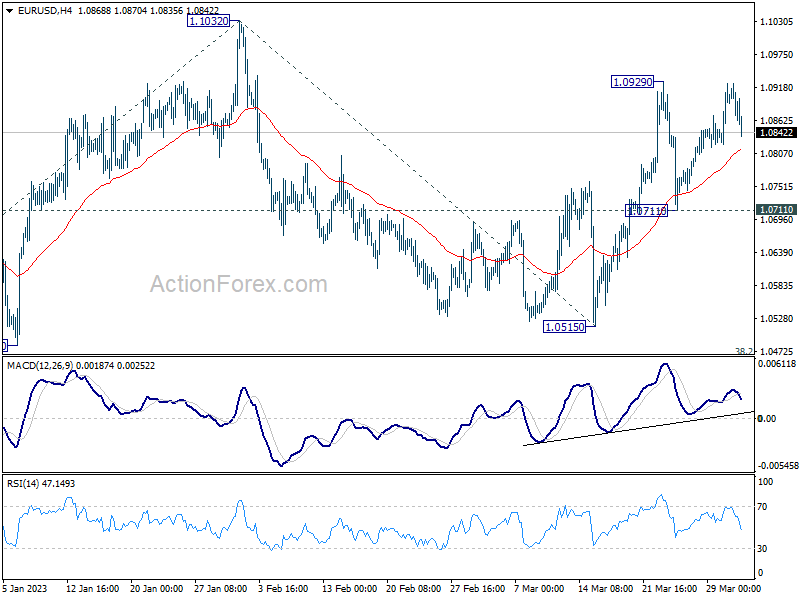
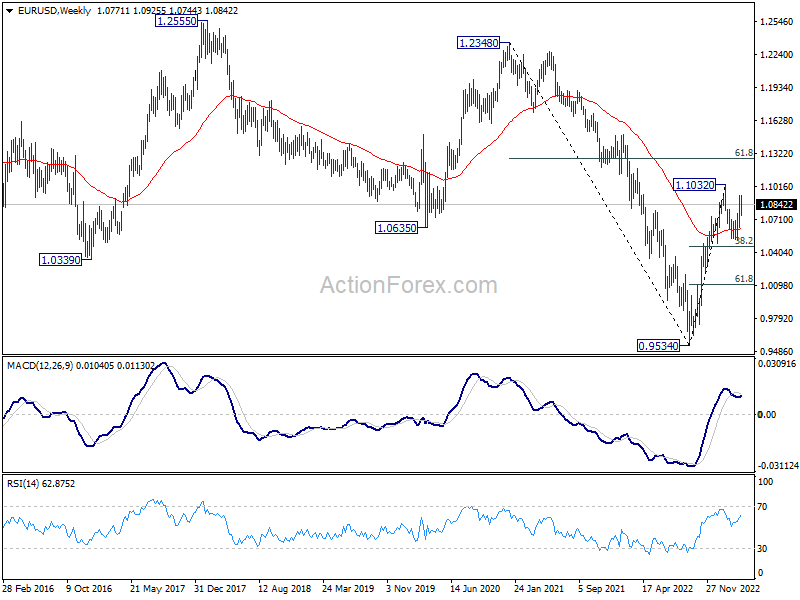
EUR/USD stayed in range below 1.0929 last week despite attempt to break through the resistance. Initial bias is turned neutral this week first. On the upside, break of 1.0929 will resume the rally from 1.0515 to retest 1.1032 high. Decisive break there will resume larger up trend from 0.9534 to 1.1273 fibonacci level next. On the downside, though, break of 1.0711 will turn bias to the downside to extend the corrective pattern from 1.1032 with another decline.
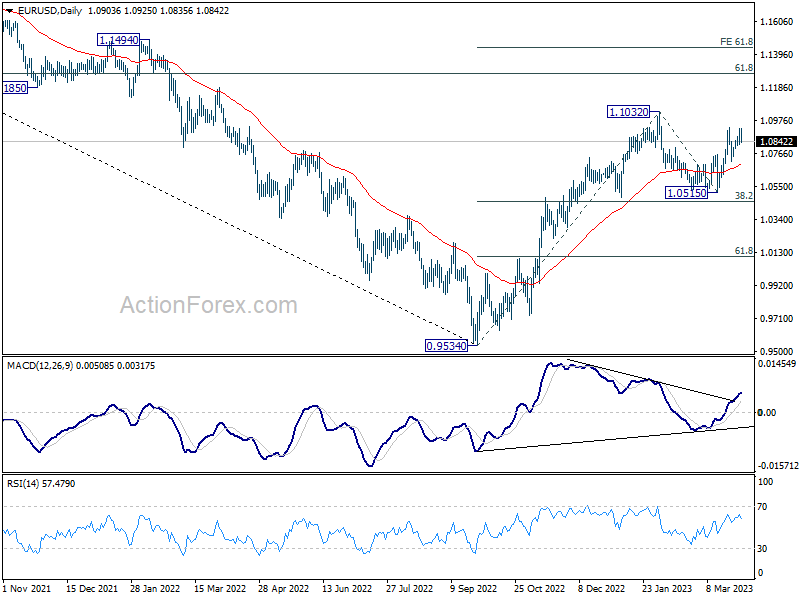
In the bigger picture, rise from 0.9534 (2022 low) is in progress with 38.2% retracement of 0.9534 to 1.1032 at 1.0460 intact. The strong support from 55 week EMA (now at 1.0625) was also a medium term bullish sign. Next target is 61.8% retracement of 1.2348 (2021 high) to 0.9534 at 1.1273. Sustained break there will solidify the case of bullish trend reversal and target 1.2348 resistance next (2021 high).
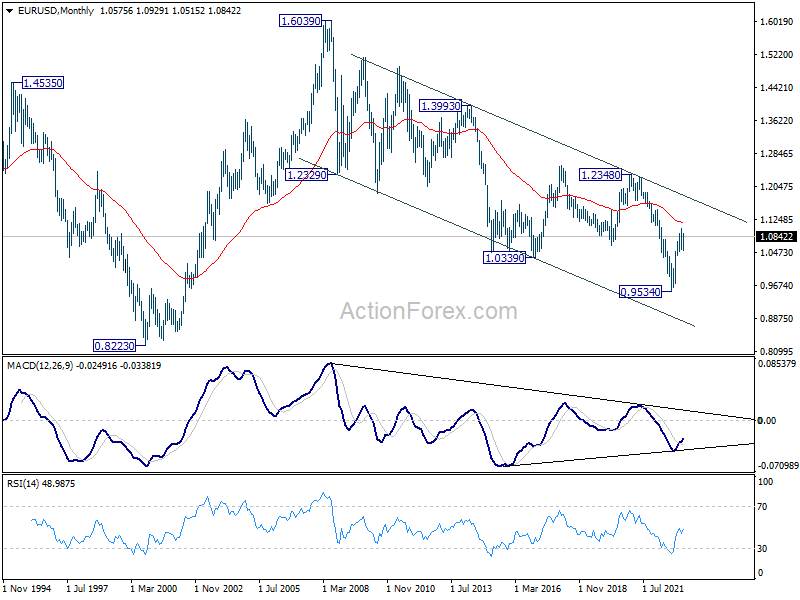
In the long term picture, while it's too early to call for long term trend reversal at this point, the strong break of 1.0635 support turned resistance (2020 low) should at least turn outlook neutral. Focus will turn to 55 month EMA (now at 1.1166). Rejection by this EMA will revive long term bearishness.
USD/JPY Weekly Outlook
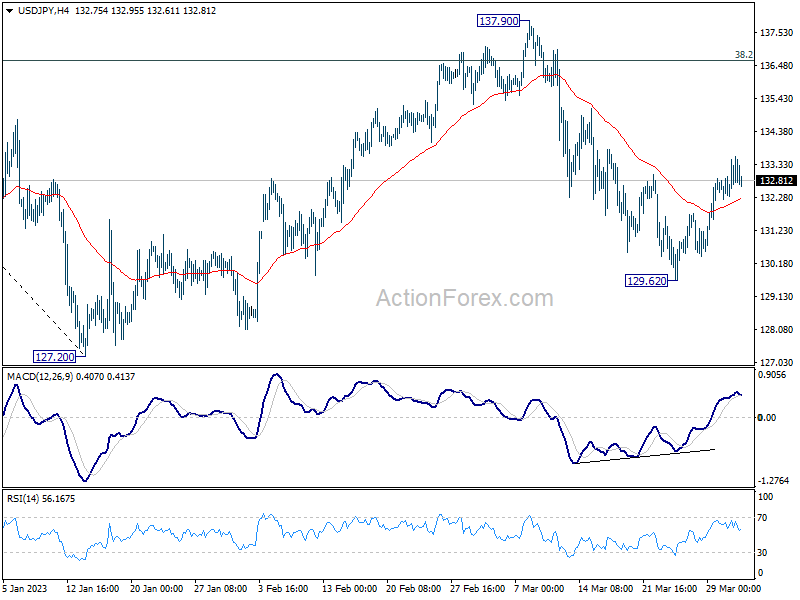
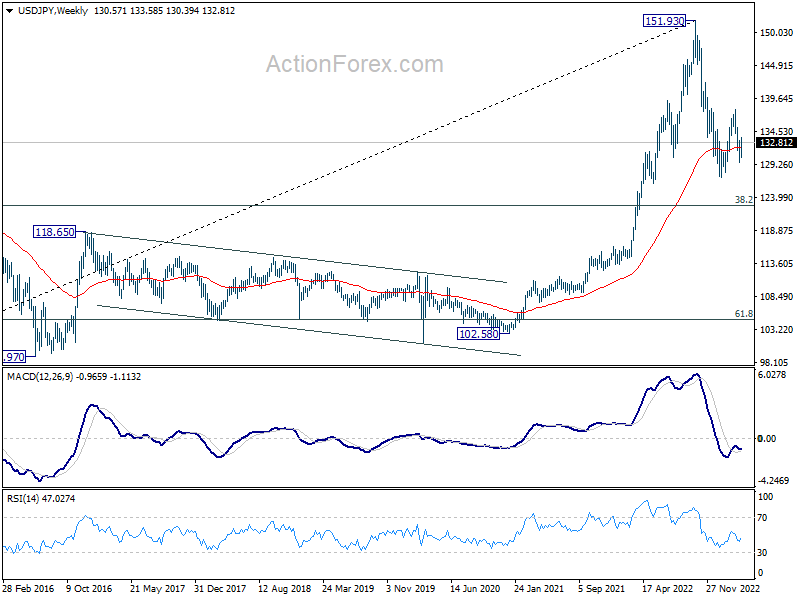
USD/JPY's extended rebound last week argues that fall from 137.90 has completed at 129.62. Rise from there is seen as the third leg of the corrective pattern from 127.20. Initial bias is mildly on the upside and sustained break of 55 day EMA (now at 133.43) will target 137.90 resistance. On the downside, though, break of 129.62 will bring retest of 127.20 low.
In the bigger picture, corrective pattern from 127.20 might be extending. But after all, down trend from 151.93 is expected to resume at a later stage. Break of 127.20 will resume this down trend and target 61.8% projection of 151.93 to 127.20 from 137.90 at 122.61. This will now be the favored case as long as 137.90 resistance holds.
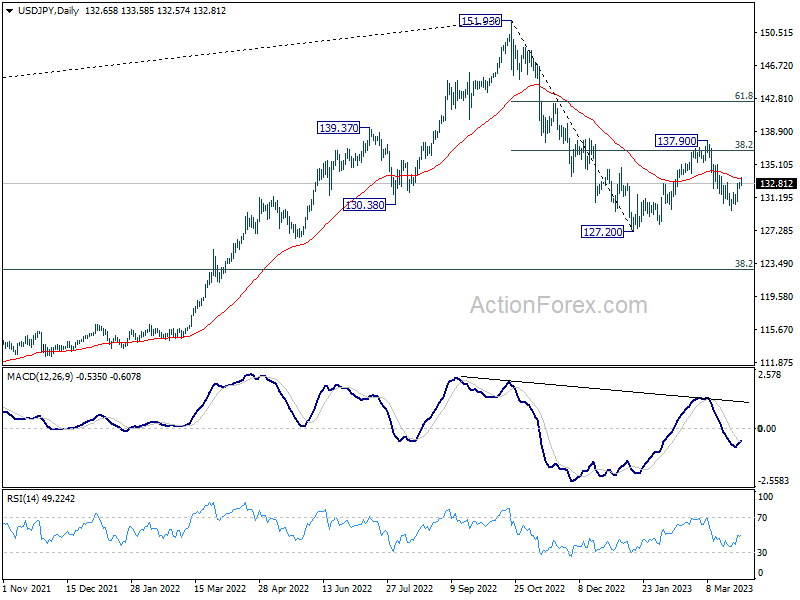
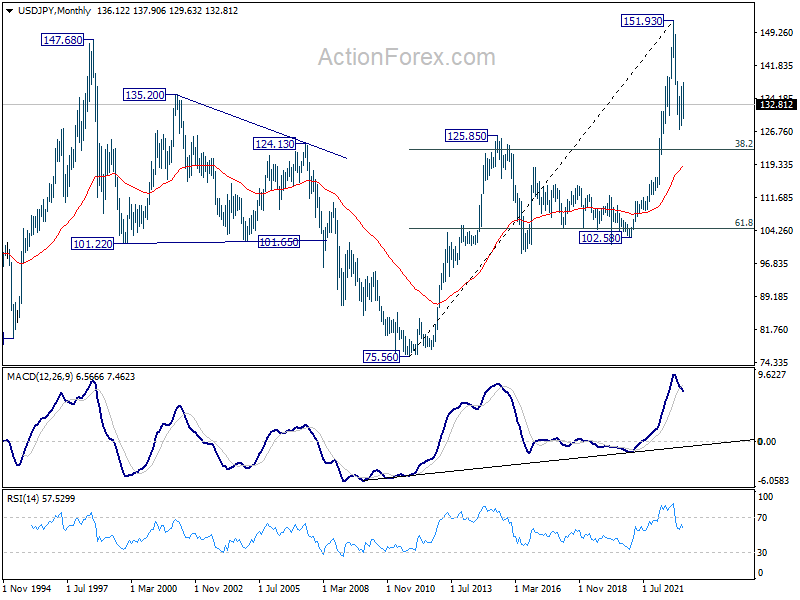
In the long term picture, price action from 151.93 is seen as developing into a corrective pattern to up trend from 75.56 (2011 low). While deeper decline cannot be ruled out, downside should be contained by 38.2% retracement of 75.56 to 151.93 at 122.75.
GBP/USD Weekly Outlook
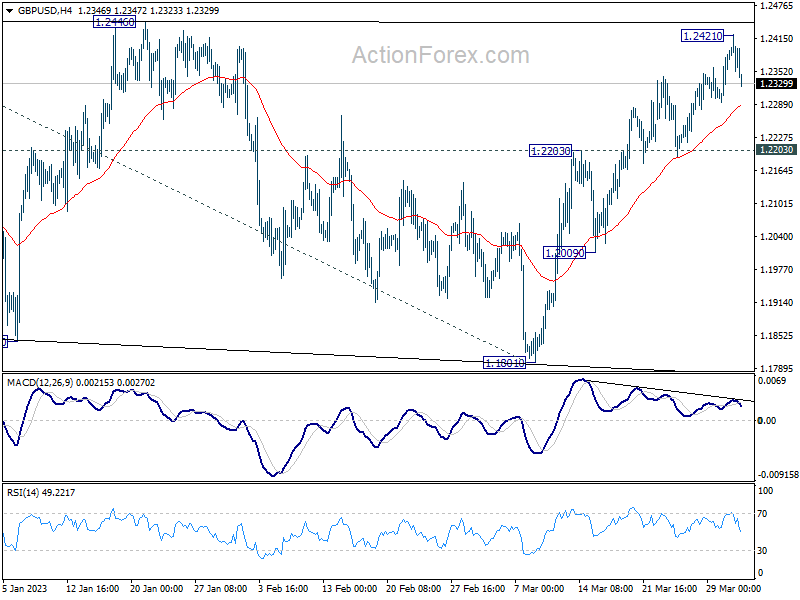
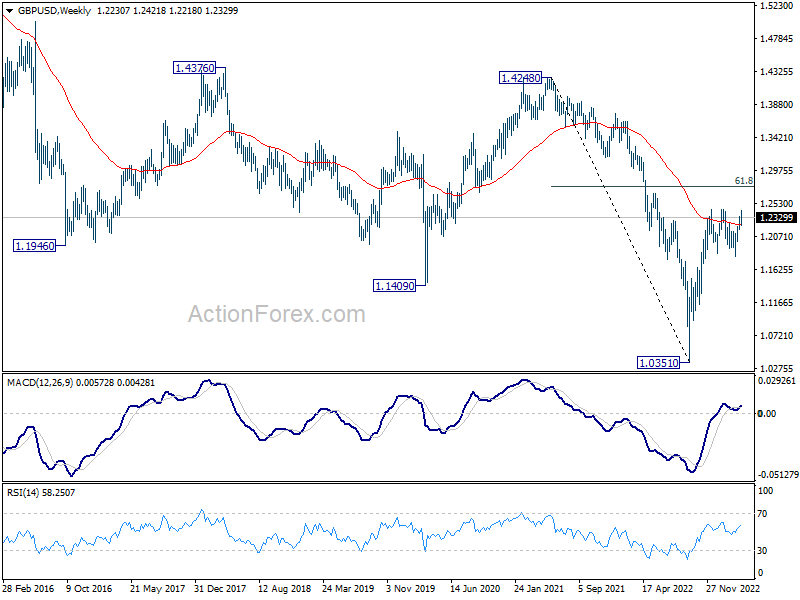
GBP/USD's rally from 1.1801 continued to as high as 1.2421 last week but failed to break through 1.2445/6 resistance zone. With a temporary top formed, initial bias is turned neutral this week first. On the upside, decisive break of 1.2445/6 resistance zone will resume larger rally from 1.0351, and target 1.2759 fibonacci level. However, break of 1.2203 resistance turned support will extend the corrective pattern from 1.2445 with another falling leg, and turn bias back to the downside.
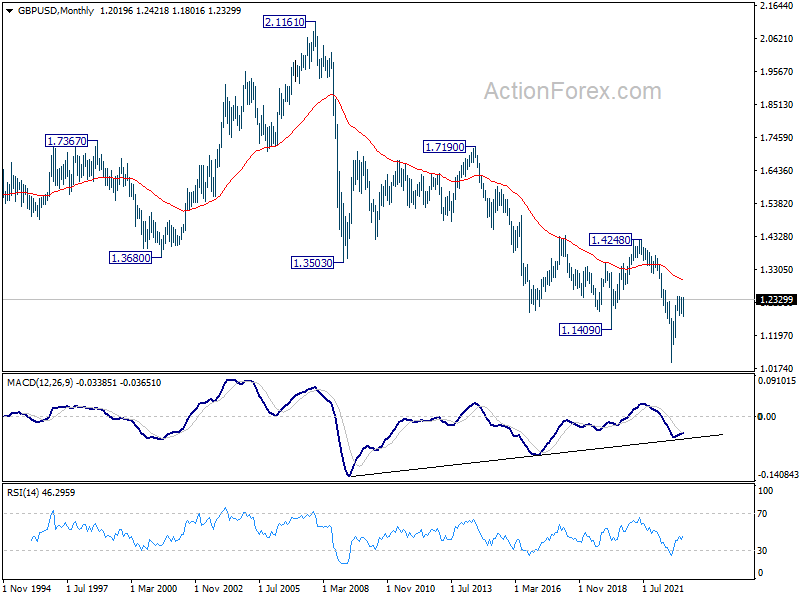
In the bigger picture, the rise from 1.0351 medium term term bottom (2022 low) is in progress for 61.8% retracement of 1.4248 (2021 high) to 1.0351 at 1.2759. Sustained break there will add to the case of long term bullish trend reversal. Further break of 61.8% projection of 1.0351 to 1.2445 from 1.1801 at 1.3095 could prompt upside acceleration to 100% projection at 1.3895. For now, this will remain the favored case as long as 1.1801 support holds, even in case of deep pull back.
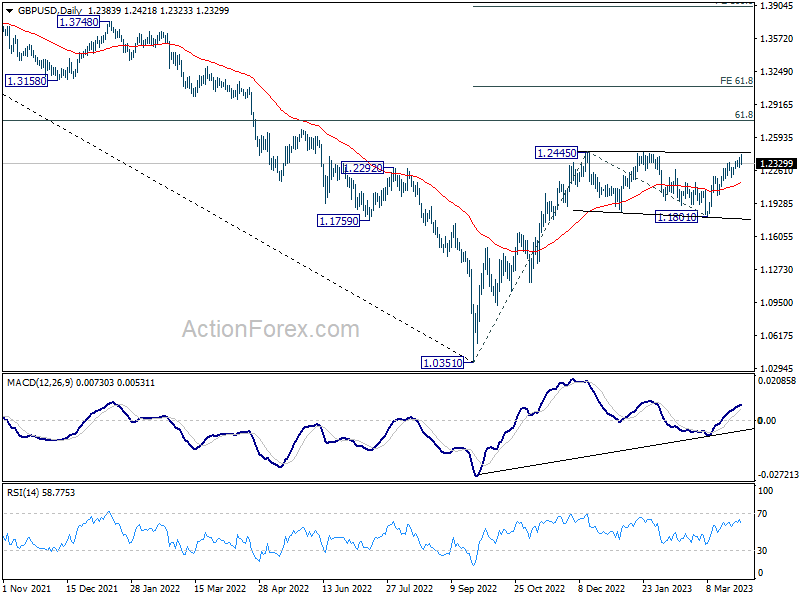
In the long term picture, while the rise from 1.0351 (2022 low) has been strong, there is no clear indicate of long term trend resistance yet. As long as 1.4248 resistance holds (2021 high), long term outlook will remain neutral at best.
USD/CHF Weekly Outlook
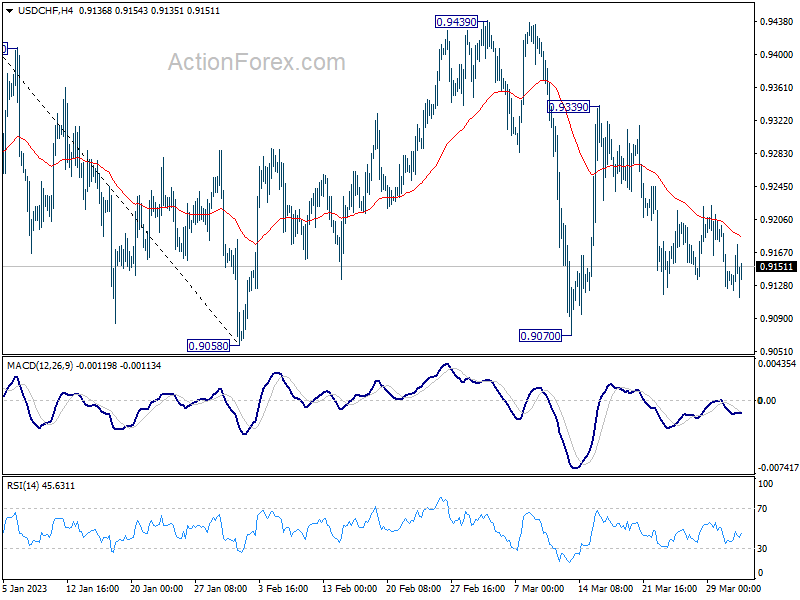
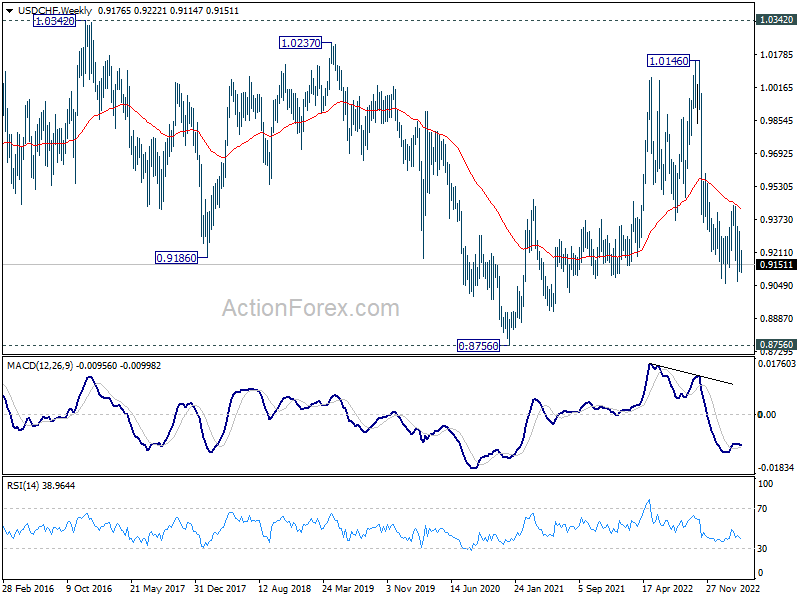
USD/CHF was still bounded in sideway trading last week and outlook is unchanged. Initial bias remains neutral this week first. Corrective pattern from 0.9058 low is extending and another rise cannot be ruled out. But upside should be limited by 0.9474 fibonacci level. On the downside, firm break of 0.9058 will resume larger down trend from 1.1046.
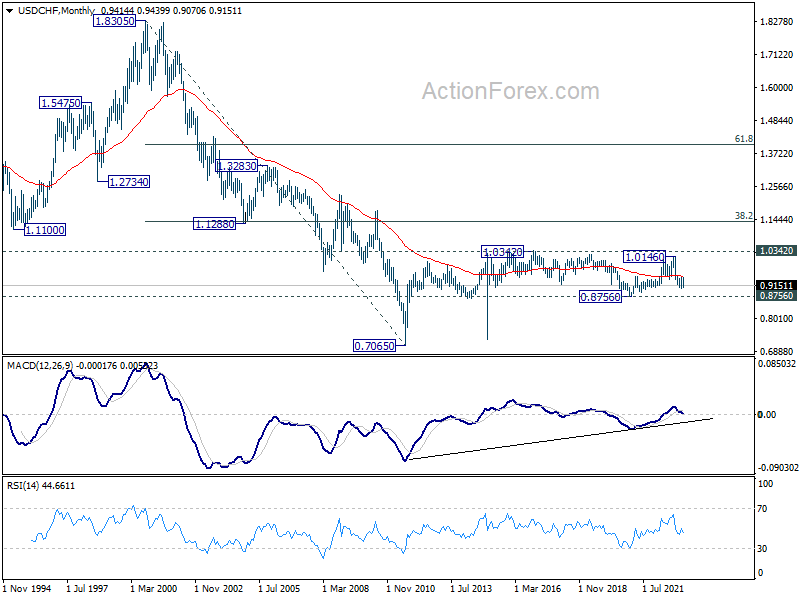
In the bigger picture, fall from 1.1046 (2022 high) should still be in progress with 38.2% retracement of 1.0146 to 0.9058 at 0.9474 intact. Prior rejection by 55 week EMA was a medium term bearish sign. Break of 0.9058 will resume such decline towards 0.8756 support (2021 low). But overall, this fall is still as a leg in the long term range pattern from 1.0342 (2016 high). So, downside should be contained by 0.8756 to bring reversal.
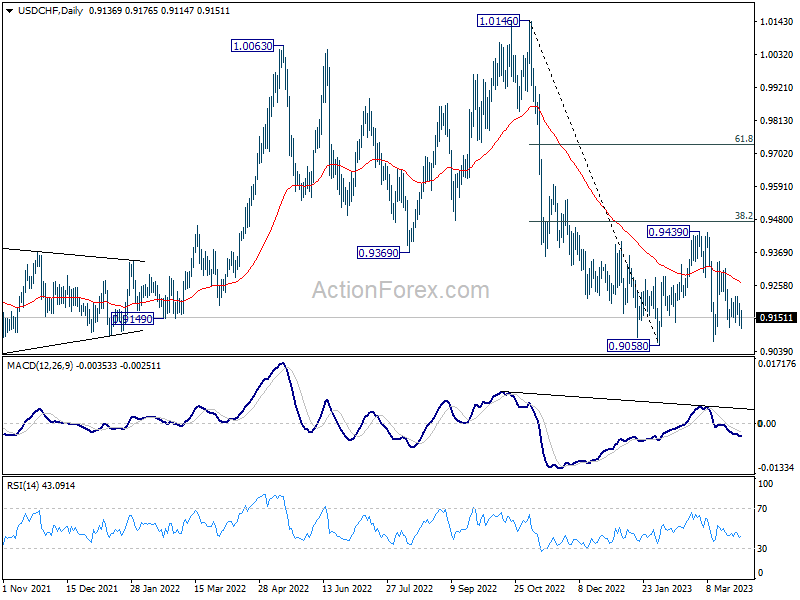
In the long term picture, long term sideway pattern from 1.0342 (2016 high) is extending. Overall, range trading should continue until further development.
AUD/USD Weekly Report
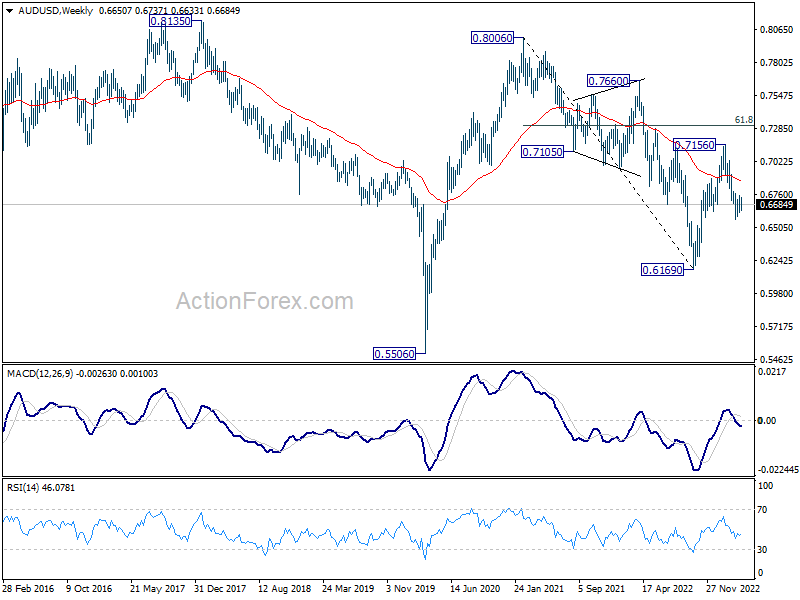
AUD/USD stayed in sideway trading in range of 0.6563 last week and outlook is unchanged. Initial bias remains neutral this week first. On the downside, decisive break of 0.6546 fibonacci level will carry larger bearish implication. On the upside, however, break of 0.6758 resistance will now be a strong signal of bullish reversal and turn bias back to the upside.
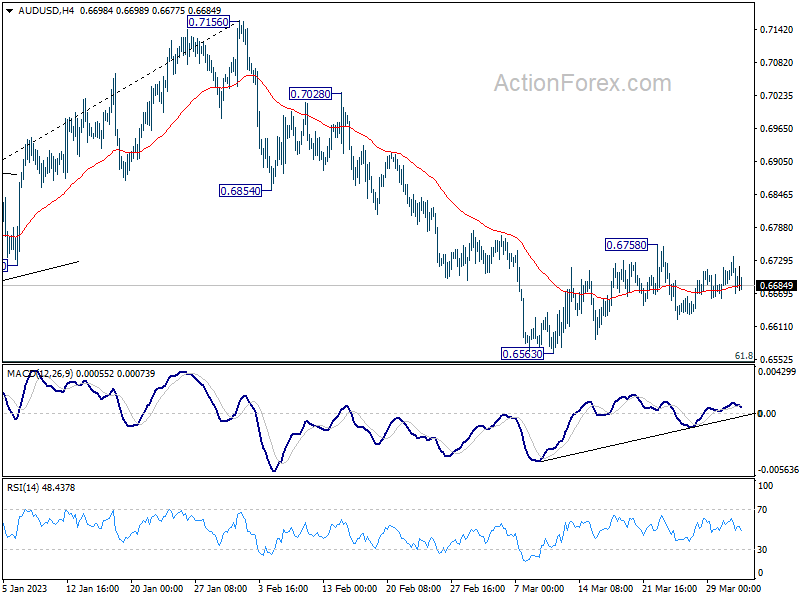
In the bigger picture, as long as 61.8% retracement of 0.6169 to 0.7156 at 0.6546 holds, the decline from 0.7156 is seen as a correction to rally from 0.6169 (2022 low) only. Another rise should still be seen through 0.7156 at a later stage. However, sustained break of 0.6546 will raise the chance of long term down trend resumption through 0.6169 low.
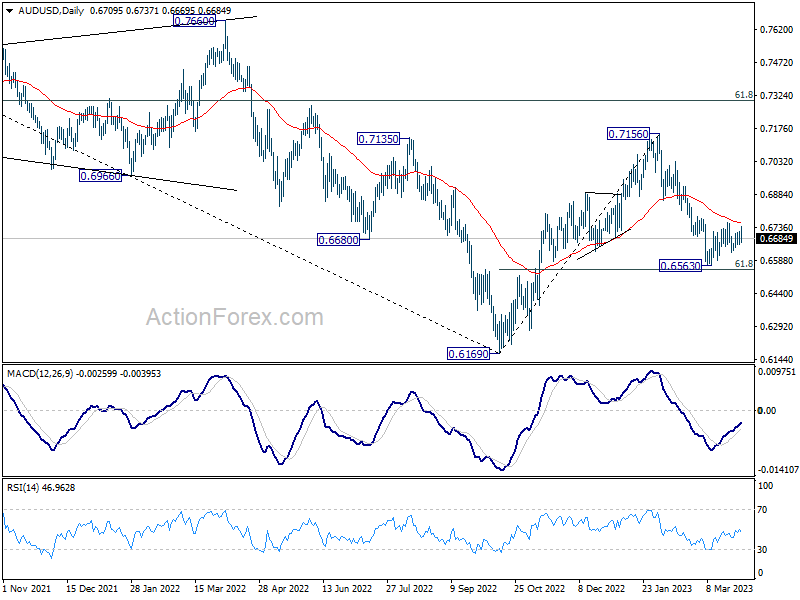
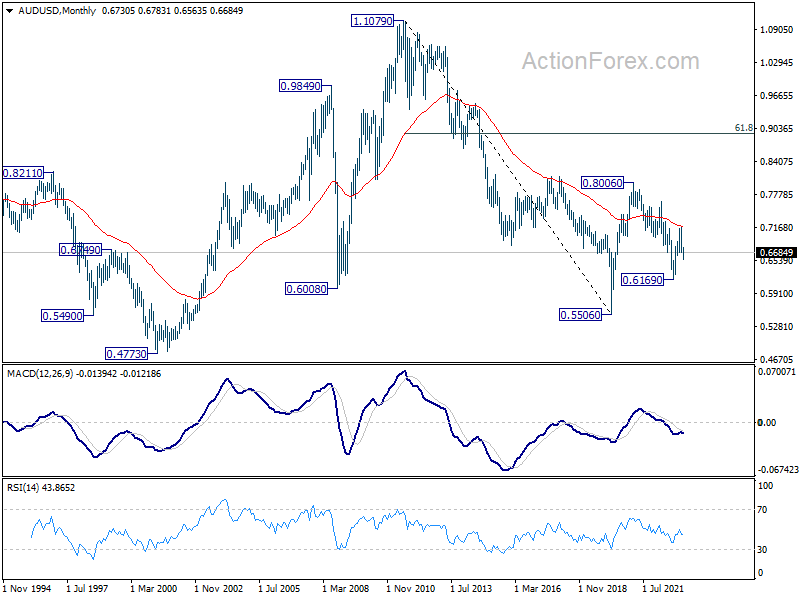
In the long term picture, initial rejection by 55 month EMA (now at 0.7161) retains long term bearishness. That is, down trend from 1.1079 (2011 high) could still resume through 0.5506 (2020 low) on resumption.
USD/CAD Weekly Outlook
USD/CAD's decline from 1.3860 last week suggests that corrective pattern from 1.3976 is extending with another falling leg. Initial bias remains on the downside this week for 1.3224/61 support zone. But strong support should be seen around there to bring rebound. Still, break of 1.3650 support turned is needed to indicate completion of the decline first. Or further fall will remain in favor in case of recovery.
In the bigger picture, the up trend from 1.2005 (2021 low) is still in progress. Break of 1.3976 will confirm resumption and target 61.8% projection of 1.2401 to 1.3976 from 1.3261 at 1.4234. Firm break there will pave the way to long term resistance zone at 1.4667/89 (2016, 2020 highs). On the downside, sustained break of 55 week EMA (now at 1.3282) is needed to confirm medium term topping. Otherwise, outlook will remain bullish even in case of deep pull back.
In the longer term picture, price actions from 1.4689 (2016 high) are seen as a consolidation pattern only, which might have completed at 1.2005. That is, up trend from 0.9506 (2007 low) is expected to resume at a later stage. This will remain the favored case as 55 month EMA (now at 1.3003) holds.
GBP/JPY Weekly Outlook
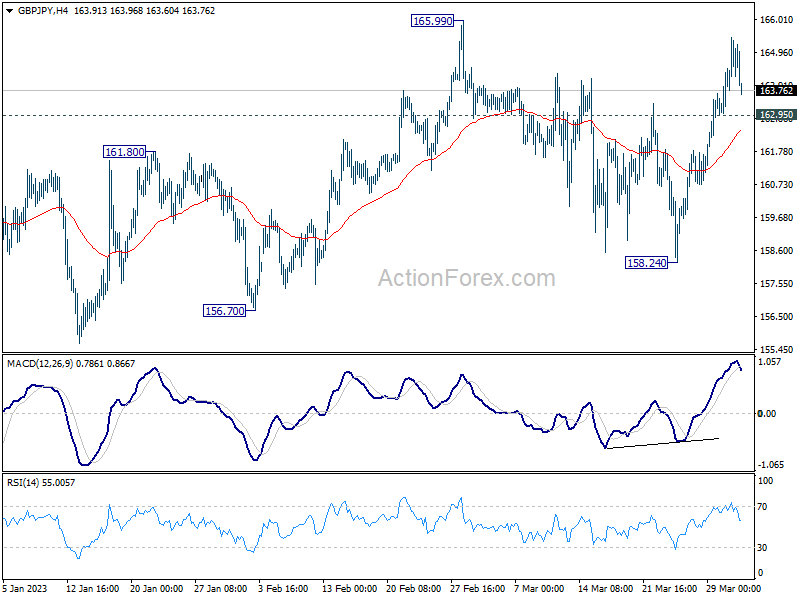
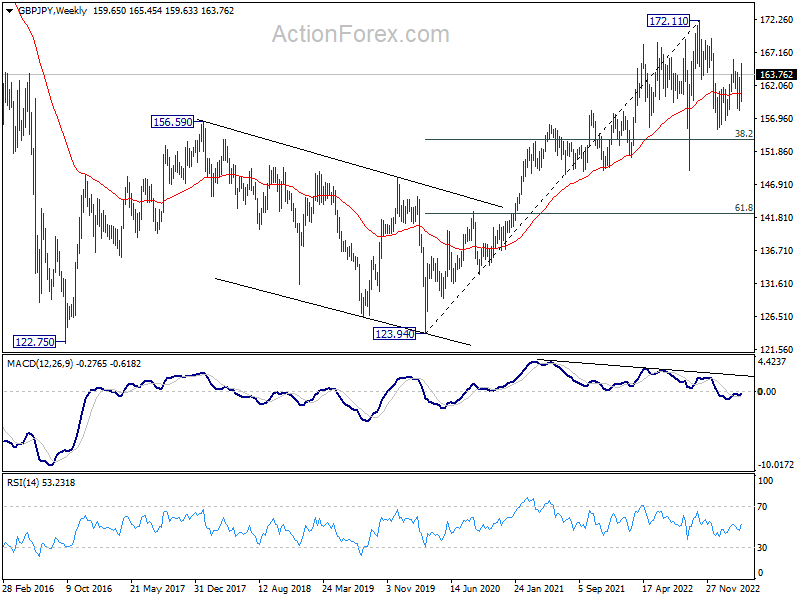
GBP/JPY rebounded strongly last week but failed to break through 165.99 resistance. Initial bias is neutral this week first. On the upside, break there of 165.99 resume the whole rebound from 155.33 to 169.26 resistance next. On the downside, however, break of 162.95 minor support will mix up the outlook and turn intraday bias to the downside for 158.24 support instead.
In the bigger picture, as long as 38.2% retracement of 123.94 (2020 low) to 172.11 (2022 high) at 153.70 holds, medium term bullishness is retained. That is, larger up trend from 123.94 (2020 low) is still in progress. Break of 172.11 high to resume such up trend is expected at a later stage.
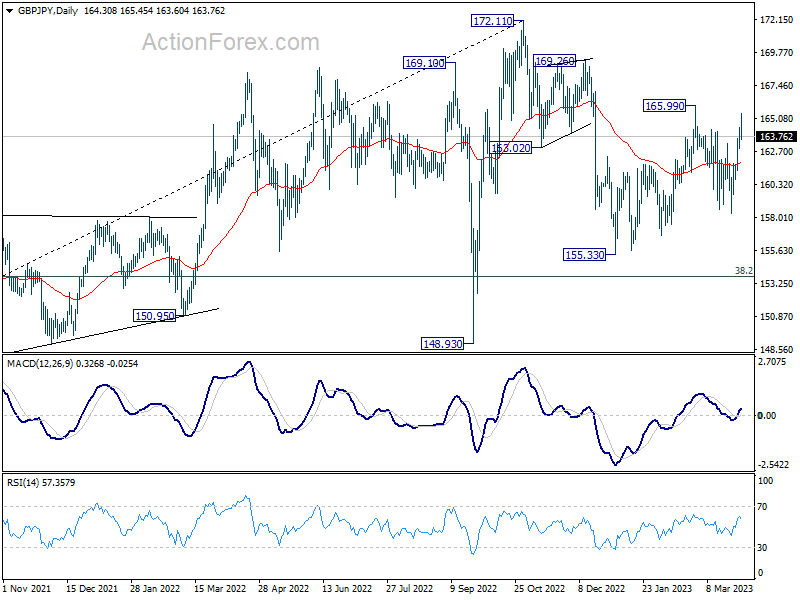
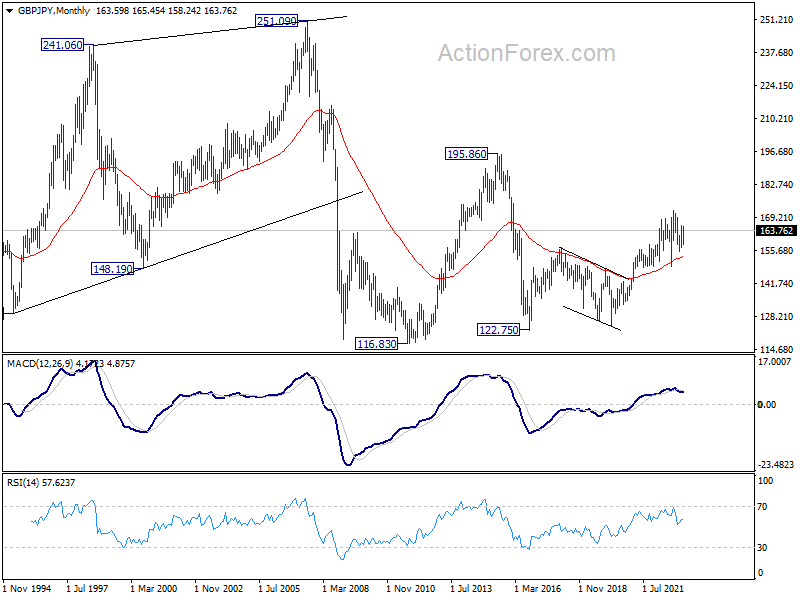
In the longer term picture, as long as 55 month EMA (now at 153.18) holds, rise from 122.75 (2016 low) could still extend higher at a later stage to 195.86 (2015 high).
EUR/JPY Weekly Outlook
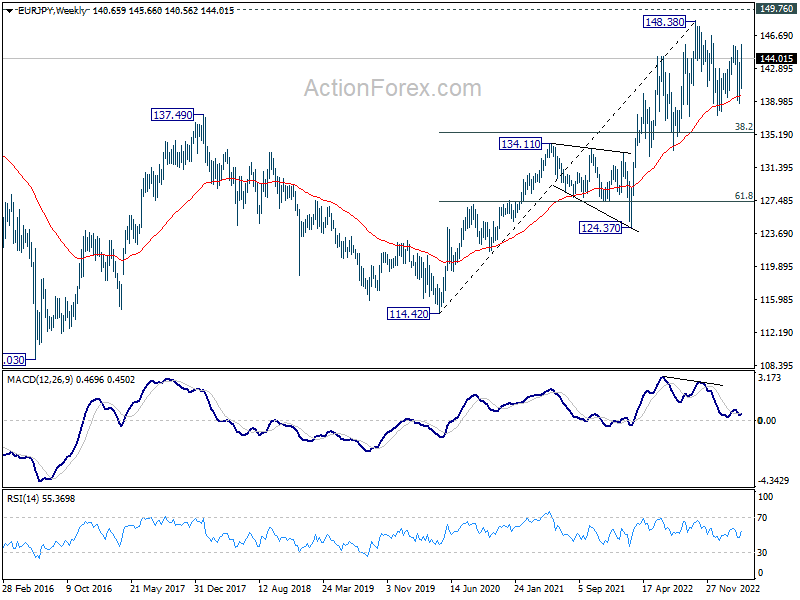
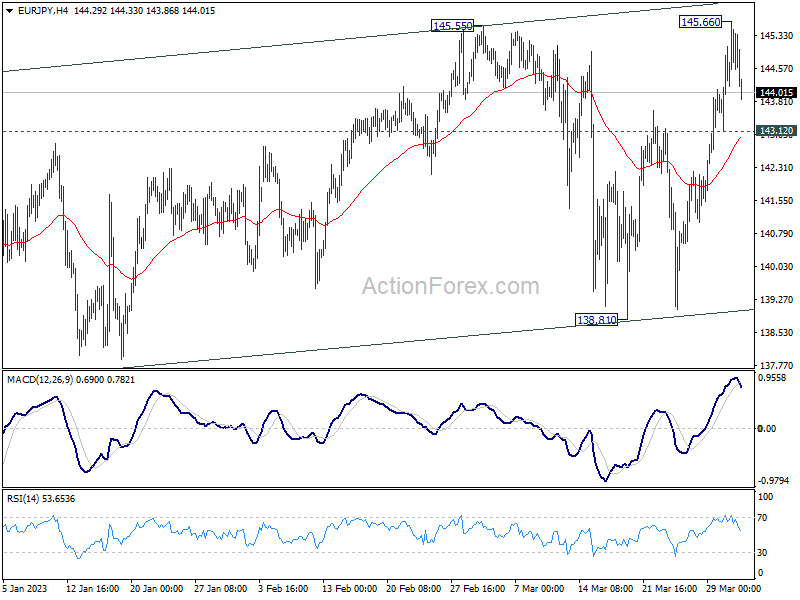
EUR/JPY rose strongly to 145.66 last week but failed to close above 145.55 resistance and treated. Initial bias is turned neutral this week. Current development suggests that rebound from 137.37 is extending. Break of 145.66 will target 148.38 high. However, break of 143.12 minor support will mix up the outlook again and turn bias to the downside for 138.81 support instead.
In the bigger picture, as long as 55 week EMA (now at 139.78) holds, larger up trend from 114.42 (2020 low) is still in progress for 149.76 long term resistance. However, sustained break of 55 week EMA will bring deeper fall to 38.2% retracement of 114.42 to 148.38 at 135.40. Decisive break there will raise the chance of trend reversal, and target 61.8% retracement at 127.39.
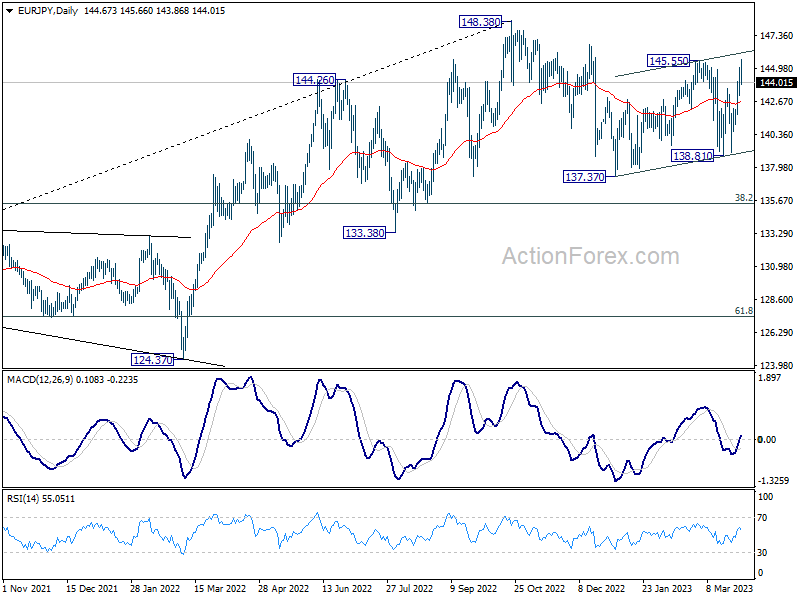
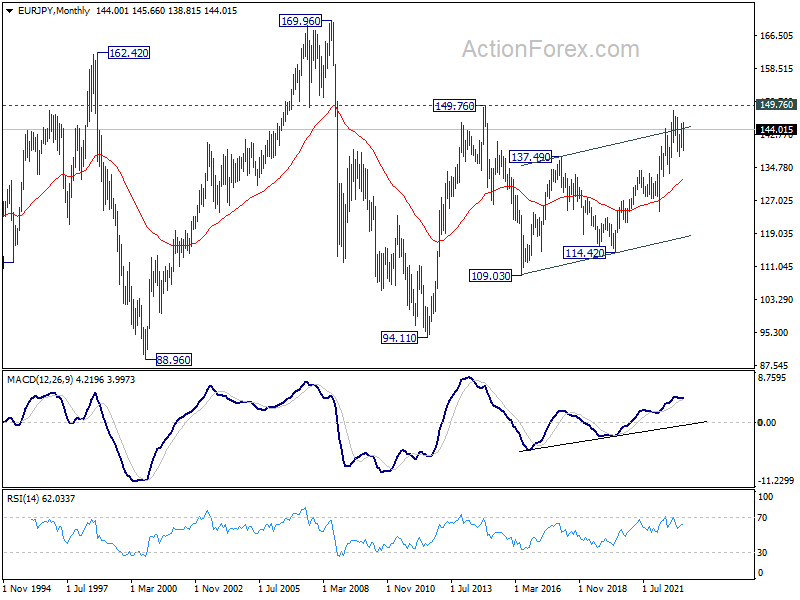
In the long term picture, outlook will stay bullish as long as 134.11 resistance turned support holds (2021 high). Sustained break of 149.76 (2014 high) will open up further rally, as resumption of the rise from 94.11 (2012 low), towards 169.96 (2008 high).