Sample Category Title
Gold Challenges Bullish Pennant Formation
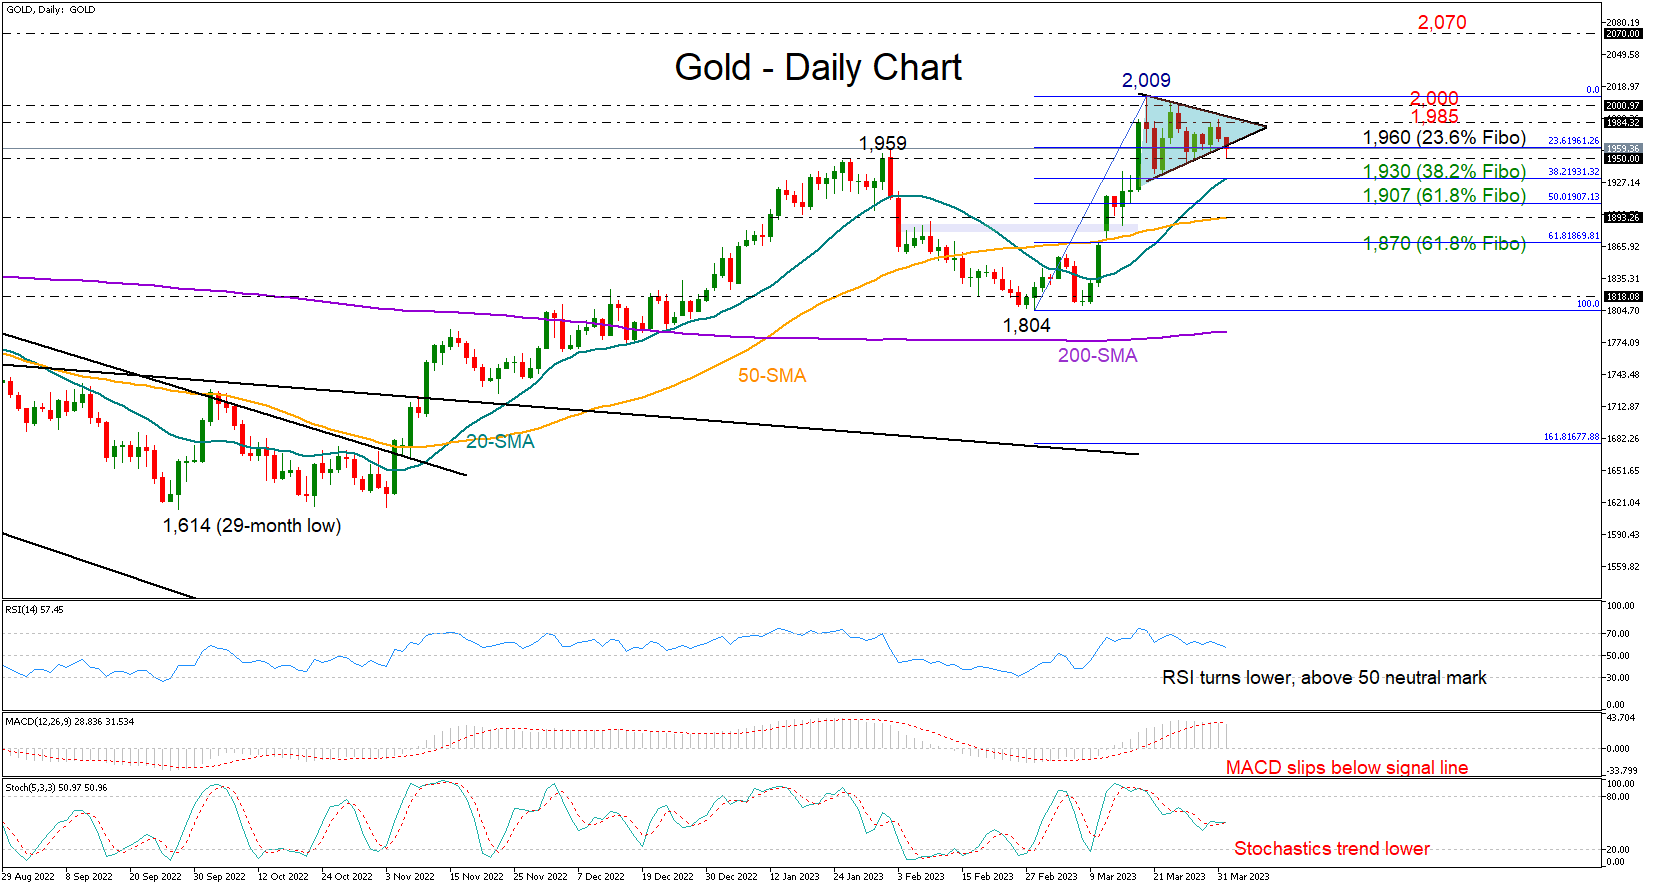
Gold opened on a negative note on Monday, gently easing to last week’s lows registered within the 1,950-1,943 zone.
Technically, the bearish correction is contrasting the three-week-old bullish pennant formation, pushing for a breakout on the wrong side. The downturn in the RSI and the MACD is promoting that scenario too, though the day is not over yet, and the bears will need to close successfully below the triangle’s lower boundary at 1,960 and then extend clearly below 1,943 in order to dampen market sentiment. The 20-day simple moving average (SMA), which is currently sitting at the lower band of the short-term range at 1,932 and near the 38.2% Fibonacci retracement of the latest upleg, could be the last opportunity for a rebound before the price forcefully returns to the 1,900 round level. If downside pressures dominate below the 50-day SMA at 1,893, the 61.8% Fibonacci mark of 1,870 could next come to the rescue.
In the bullish scenario, where the price jumps back above the 1,960 threshold, the spotlight will fall back on the key 1,985 resistance. A decisive move higher would bring confidence back to the bullish pennant, though only a sustainable move above the key region of 2,000 would confirm a positive trend continuation towards the crucial ceiling of 2,070. The 2,100 psychological number could be the next target.
Summing up, despite the weakness in gold’s price, traders may not engage in selling activity unless the price decisively breaks the ongoing range below 1,930.
Eurozone PMI manufacturing finalized at 47.3, remains in troubled waters
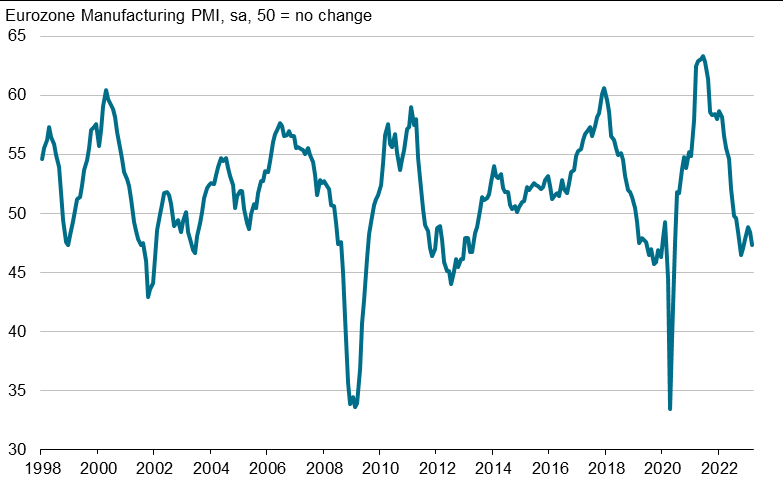
Eurozone PMI Manufacturing was finalized at 47.3 in March, down from February's 48.5, a 4-month low. Looking at some member states, Greece (52.8, 10-month high) and Spain (51.3, 9-month high) improved. Others deteriorated including Italy (51.1, 2-month low), Ireland (49.7, 3-month low), France (47.3, 5-month low), the Netherlands (46.4, 4-month low), Germany (44.7, 34-month low), and Austria (44.7, 34-month low).
Chris Williamson, Chief Business Economist at S&P Global Market Intelligence, highlighted that Eurozone manufacturing "remains in troubled waters" as factories report an eleventh consecutive month of falling demand due to factors such as surging living costs, tighter monetary policy, inventory destocking, and low customer confidence.
He also pointed out that the lack of demand has shifted pricing power from sellers to buyers, and lower energy prices have helped reduce costs. As a result, "prices paid for inputs by factories are now falling sharply on average," and slower increases in selling prices should eventually lead to lower consumer prices for goods.
WTI Oil Outlook: Oil Price Surges on Shock from OPEC+ Decision
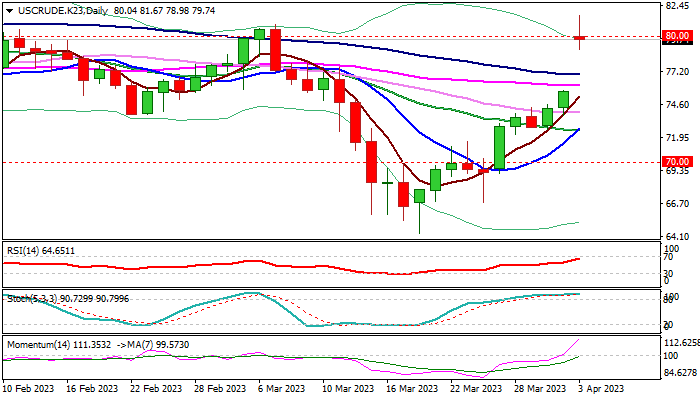
WTI oil opened with nearly 6% gap higher on Monday after the OPEC+ group shook markets by surprise decision to further cut production by 1.6 million barrels per day, over the weekend.
The cartel initially decided to cut output by 2 million barrels per day until December and the latest move signals that Saudi Arabia and its partners want to prevent further sell-off, facing criticism from the US administration, which shows divergence in targets of two countries.
Monday’s jump spiked above psychological $80 level for the first time in almost one month, after the price dipped to the lowest since Aug 2021 during March, contributing to formation of reversal pattern and bear-trap under 200WMA on weekly chart.
Fresh bullish acceleration has fully reversed $80.99/$64.34 bear-leg and pierced pivotal barriers at $80.59/99 (former double-top of Feb 13/Mar 7) break of which would add to bullish signals.
Daily studies turned to full bullish configuration, but overbought conditions suggest that bulls may take a breather for consolidation, before resuming advance.
Dips are expected to offer better opportunities to enter fresh long positions and should find firm ground above $77.06 (broken Fibo 76.4% of $80.99/$64.34 / 100DMA) to keep larger bulls intact.
Close above $80 pivot is seen as initial requirement, with extension and close above $80.99 to confirm bullish stance and expose targets at $82.64 /$84.44 (2023 high of Jan 18) and $84.00 (200DMA).
Res: 80.59; 80.99; 82.64; 84.44.
Sup: 78.98; 77.52; 77.06; 76.11.
GBP/JPY Daily Outlook
Daily Pivots: (S1) 163.09; (P) 164.28; (R1) 164.93; More...
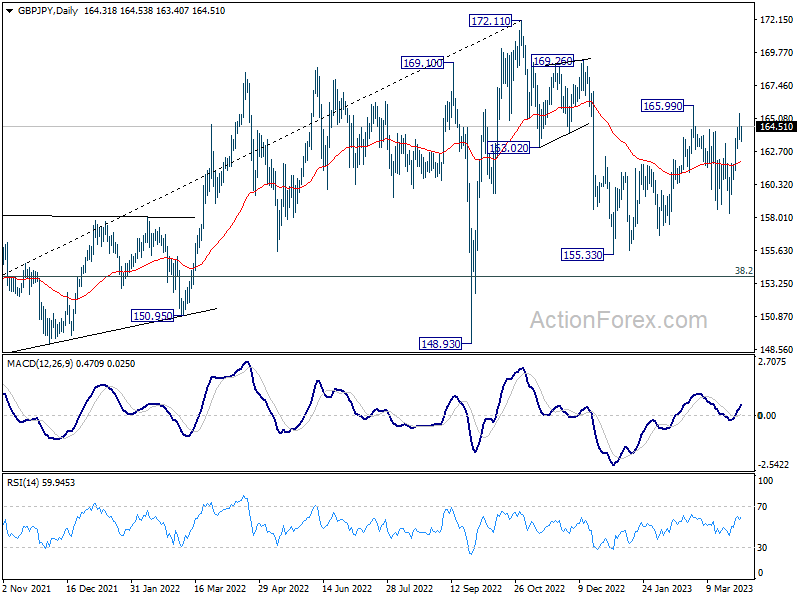
Intraday bias in GBP/JPY remains neutral for the moment. On the upside, break of 165.99 resume the whole rebound from 155.33 to 169.26 resistance next. On the downside, however, break of 162.95 minor support will mix up the outlook and turn intraday bias to the downside for 158.24 support instead.
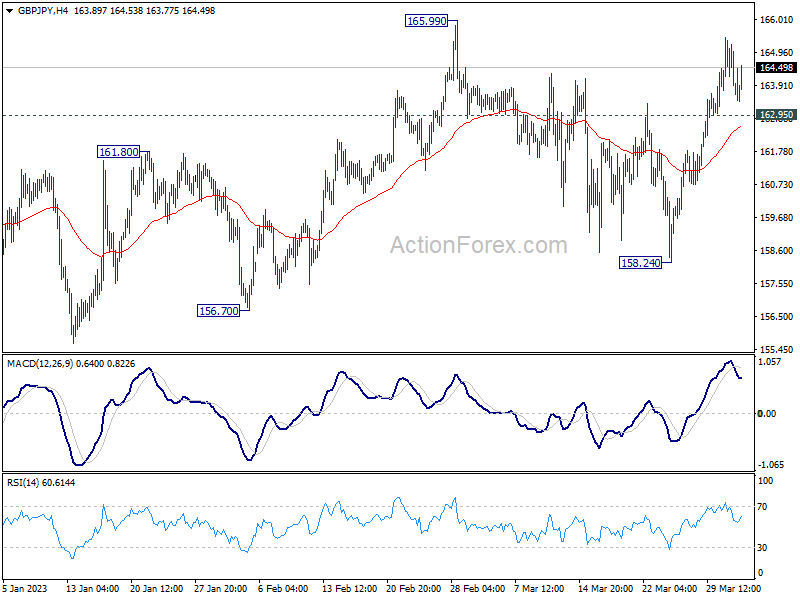
In the bigger picture, as long as 38.2% retracement of 123.94 (2020 low) to 172.11 (2022 high) at 153.70 holds, medium term bullishness is retained. That is, larger up trend from 123.94 (2020 low) is still in progress. Break of 172.11 high to resume such up trend is expected at a later stage.
EUR/JPY Daily Outlook
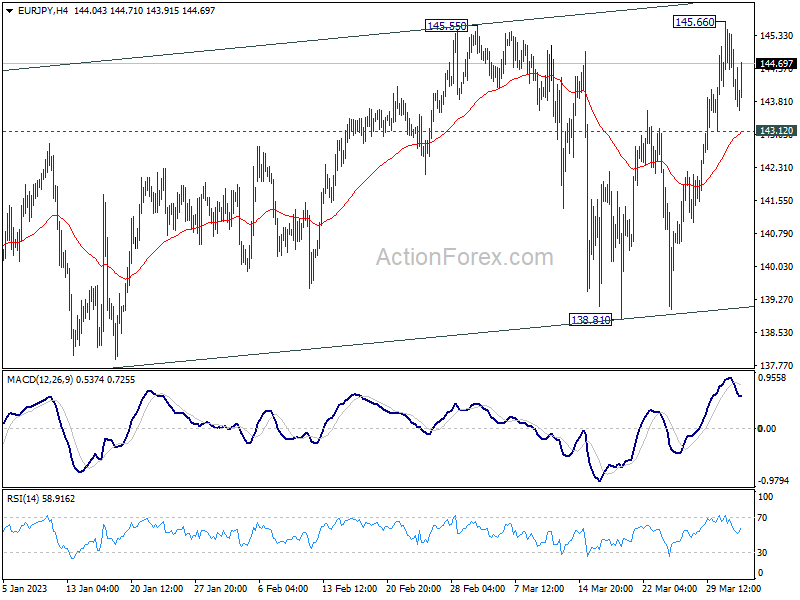
Daily Pivots: (S1) 143.36; (P) 144.52; (R1) 145.15; More....
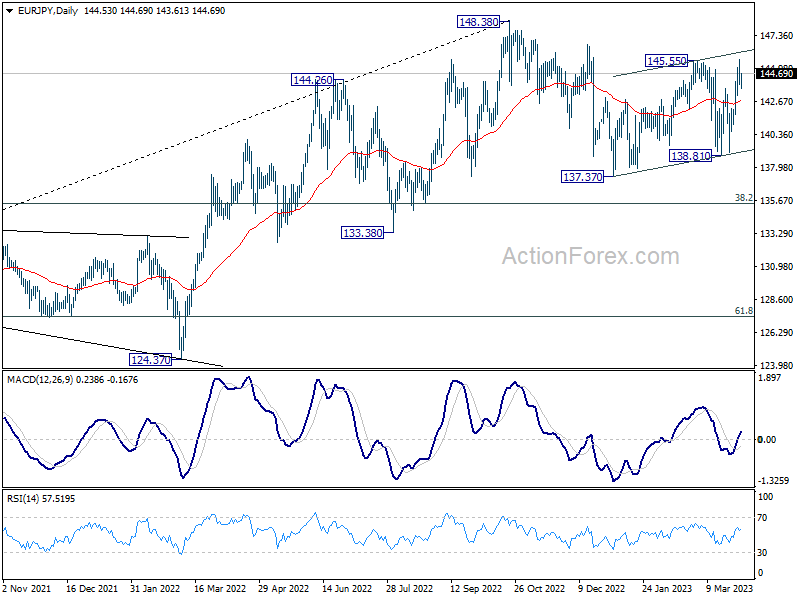
Intraday bias in EUR/JPY remains neutral for the moment. Rebound from 137.37 could be extending. On the upside, break of 145.66 will target 148.38 high. However, break of 143.12 minor support will mix up the outlook again and turn bias to the downside for 138.81 support instead.
In the bigger picture, as long as 55 week EMA (now at 139.78) holds, larger up trend from 114.42 (2020 low) is still in progress for 149.76 long term resistance. However, sustained break of 55 week EMA will bring deeper fall to 38.2% retracement of 114.42 to 148.38 at 135.40. Decisive break there will raise the chance of trend reversal, and target 61.8% retracement at 127.39.
EUR/GBP Daily Outlook
Daily Pivots: (S1) 0.8777; (P) 0.8793; (R1) 0.8808; More...
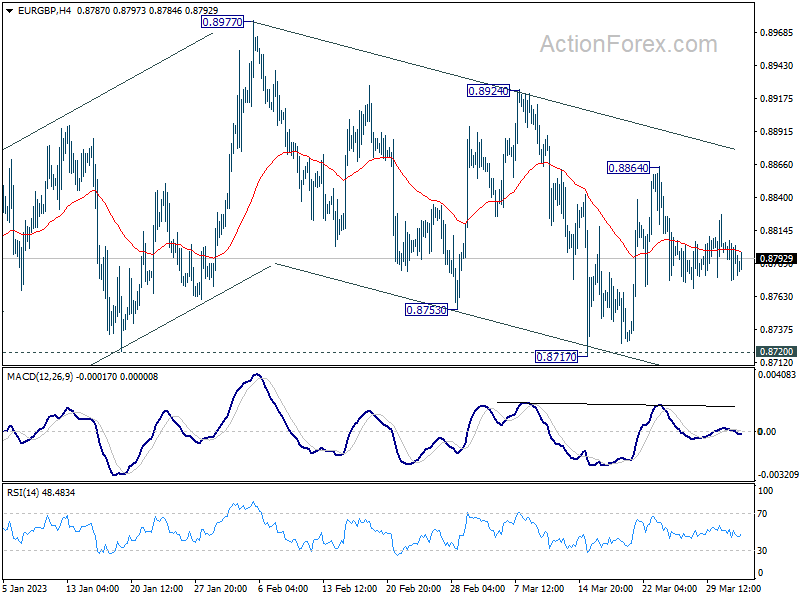
Intraday bias in EUR/GBP remains neutral at this point. On the upside, break of 0.8864 will target 0.8924 resistance first. Firm break there should resume larger rise from 0.8545 through 0.8977 high. However, decisive break of 0.8717 support will resume the decline from 0.8977 instead.
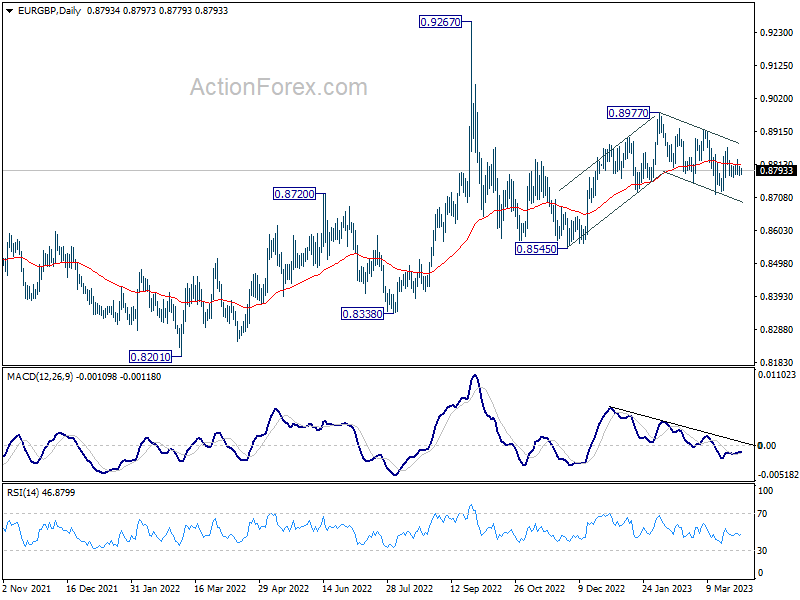
In the bigger picture, outlook remains rather mixed for now, except that price actions from 0.9267 (2022 high) are part of the long term range pattern from 0.9499 (2020 high). With 0.8720 support intact, rise from 0.8545 is in favor to continue through 0.8977. However, firm break of 0.8720 will argue that such rebound has completed, and open up deeper fall through this support level.
EUR/AUD Daily Outlook
Daily Pivots: (S1) 1.6175; (P) 1.6242; (R1) 1.6287; More...
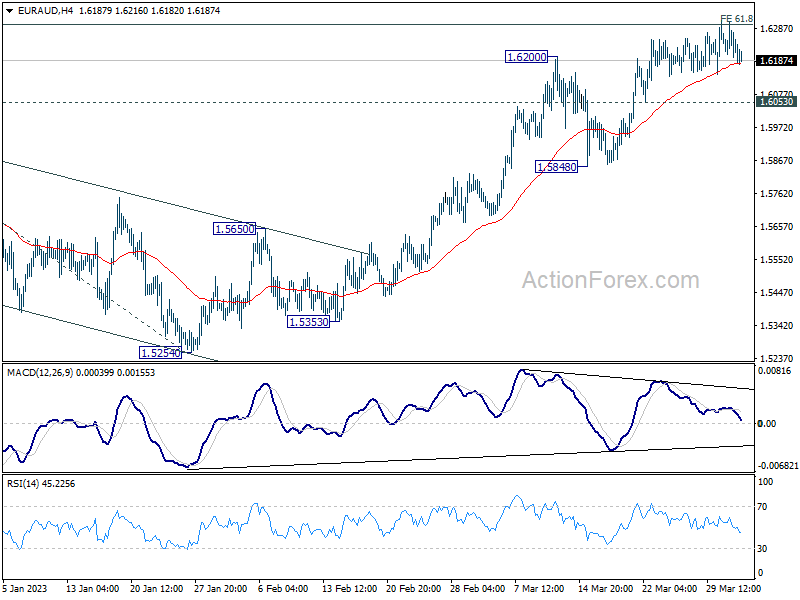
Intraday bias in EUR/AUD remains neutral for the moment. Further rally is expected as long as 1.6053 support holds. Focus is now on 1.6389/6434 cluster resistance zone. Decisive break there will carry larger bullish implications. However, break of 1.6053 will indicate short term topping and turn bias back to the downside for 1.5848 support and possibly below.
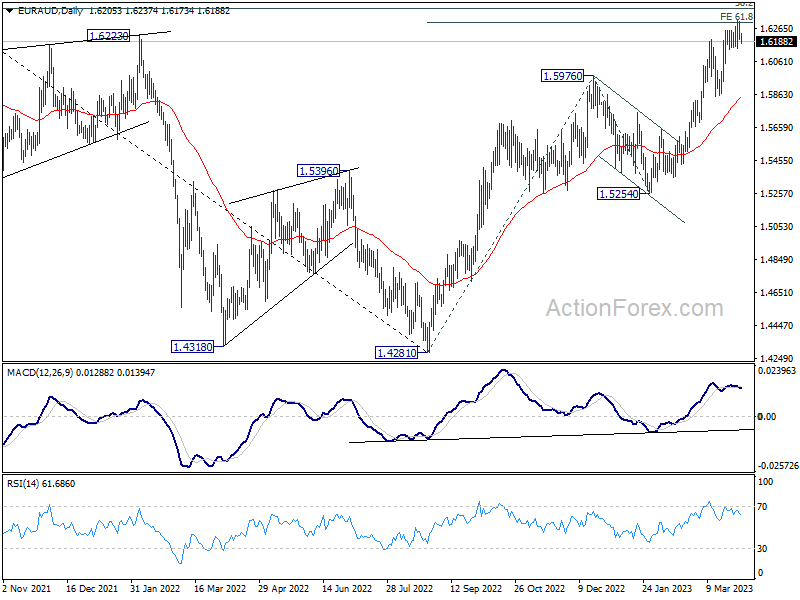
In the bigger picture, focus stays on 1.6389/6434 cluster resistance (38.2% retracement of 1.9799 to 1.4281 at 1.6389). Sustained break there should confirm that whole down trend from 1.9799 (2020 high) has completed. Further rally should then be seen to 61.8% retracement at 1.7691. However, rejection by this cluster resistance will make medium term outlook neutral at best.
EUR/CHF Daily Outlook
Daily Pivots: (S1) 0.9889; (P) 0.9940; (R1) 0.9972; More...
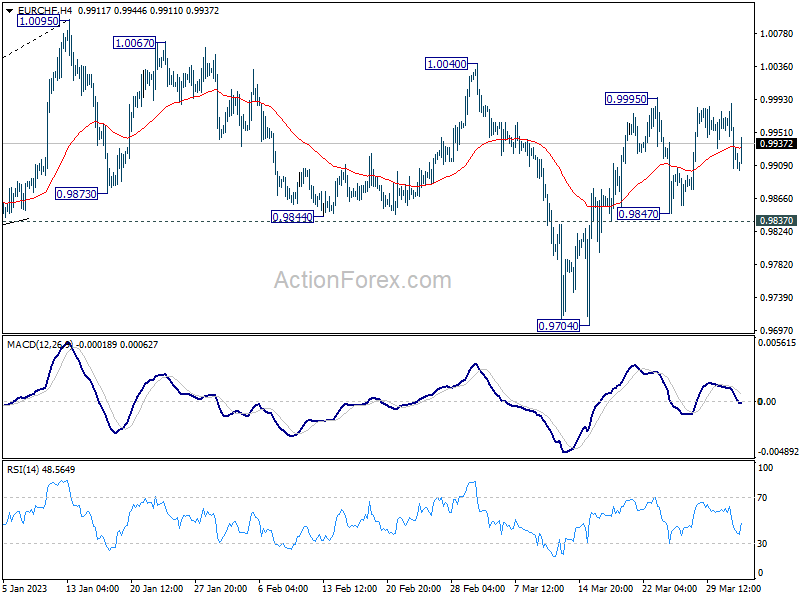
Intraday bias in EUR/CHF remains neutral as range trading continues. Near term outlook stays cautiously bullish with 0.9837 minor support intact. Correction from 1.0095 could have completed at 0.9704 already. Break of 0.9995 will affirm this bullish case and target a retest on 1.0095 high. However, break of 0.9837 will dampen this bullish view and turn bias back to the downside for 0.9704 support instead.
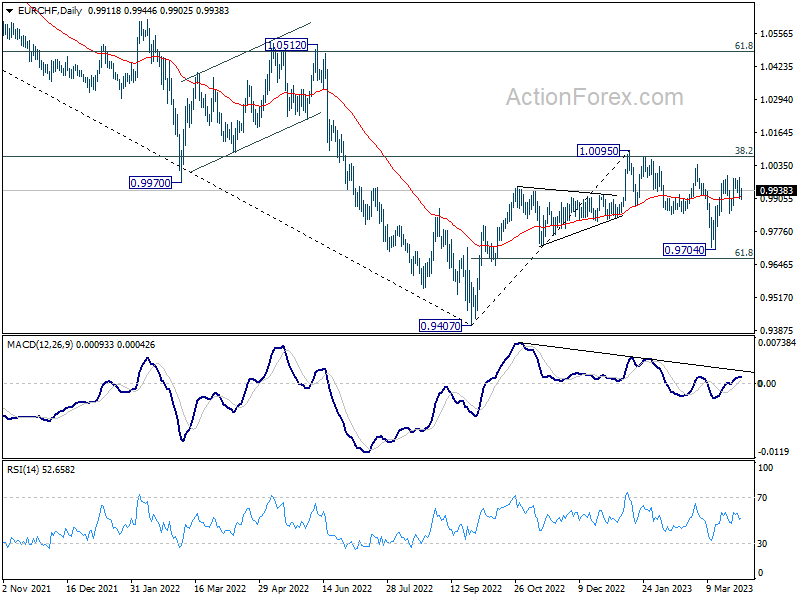
In the bigger picture, prior rejection by 55 week EMA (now at 1.1002) and 38.2% retracement of 1.1149 to 0.9407 at 1.0072 suggests that medium term outlook is staying bearish. That is, down trend from 1.2004 is not completed yet and is in favor to resume through 0.9407 at a later stage. However, decisive break of 1.0095 resistance will raise the chance of bullish trend reversal. Rise from 0.9407 should then target 1.0505 cluster resistance (2020 low at 1.0505, 61.8% retracement of 1.1149 to 0.9407 at 1.1484).
USD/CAD Daily Outlook
Daily Pivots: (S1) 1.3496; (P) 1.3530; (R1) 1.3553; More....
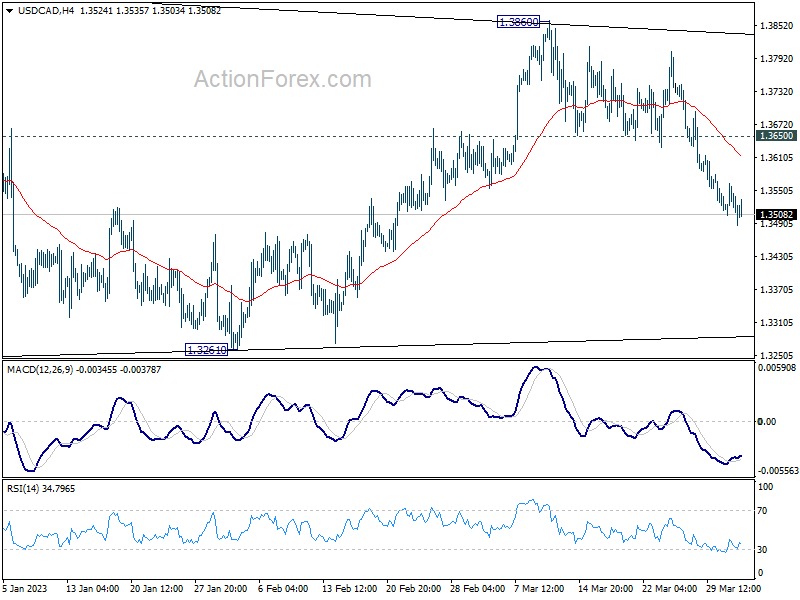
Intraday bias in USD/CAD remains on the downside for the moment. Fall from 1.3860 is seen as the third leg of the corrective pattern from 1.3976. Deeper decline would be seen to 1.3224/61 support zone. But strong support should be seen around there to bring rebound. Still, break of 1.3650 support turned is needed to indicate completion of the decline first. Or further fall will remain in favor in case of recovery.
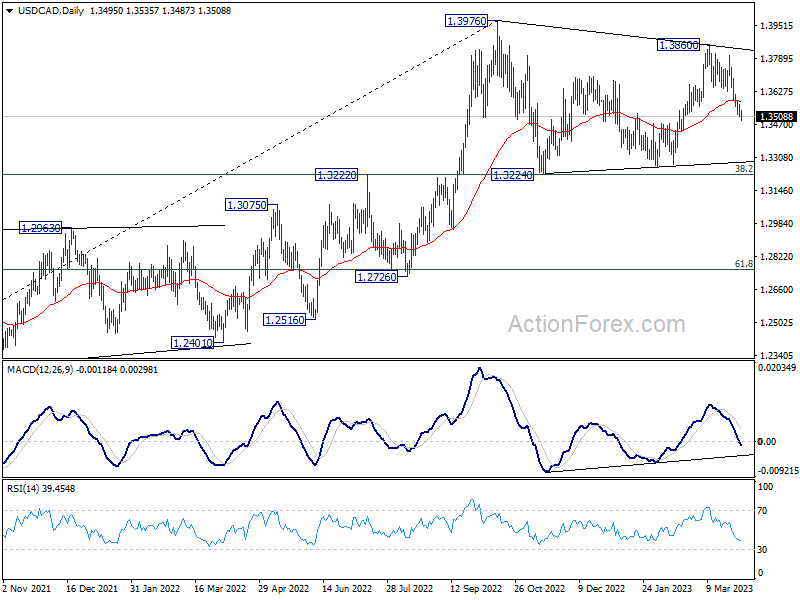
In the bigger picture, the up trend from 1.2005 (2021 low) is still in progress. Break of 1.3976 will confirm resumption and target 61.8% projection of 1.2401 to 1.3976 from 1.3261 at 1.4234. Firm break there will pave the way to long term resistance zone at 1.4667/89 (2016, 2020 highs). On the downside, sustained break of 55 week EMA (now at 1.3282) is needed to confirm medium term topping. Otherwise, outlook will remain bullish even in case of deep pull back.
AUD/USD Daily Report
Daily Pivots: (S1) 0.6657; (P) 0.6698; (R1) 0.6725; More...
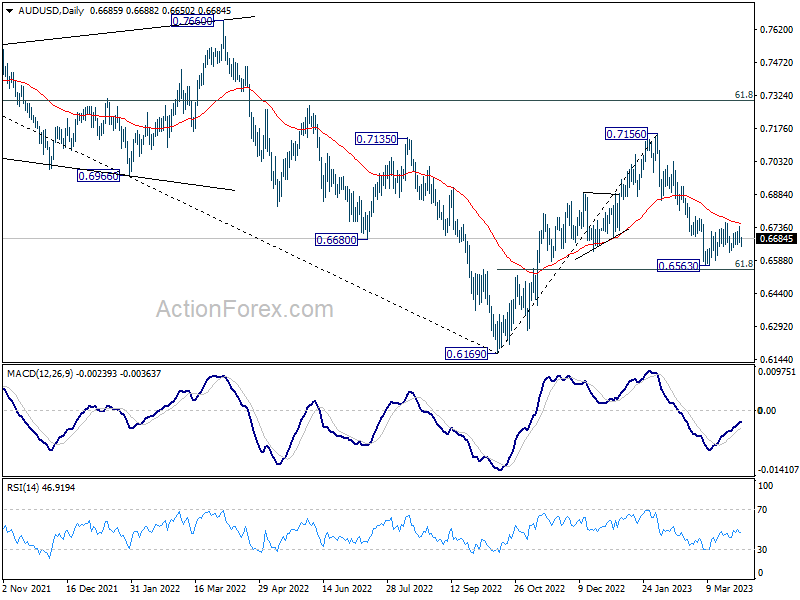
AUD/USD's consolidation from 0.6563 is extending and intraday bias remains neutral. On the downside, decisive break of 0.6546 fibonacci level will carry larger bearish implication. On the upside, however, break of 0.6758 resistance will now be a strong signal of bullish reversal and turn bias back to the upside.
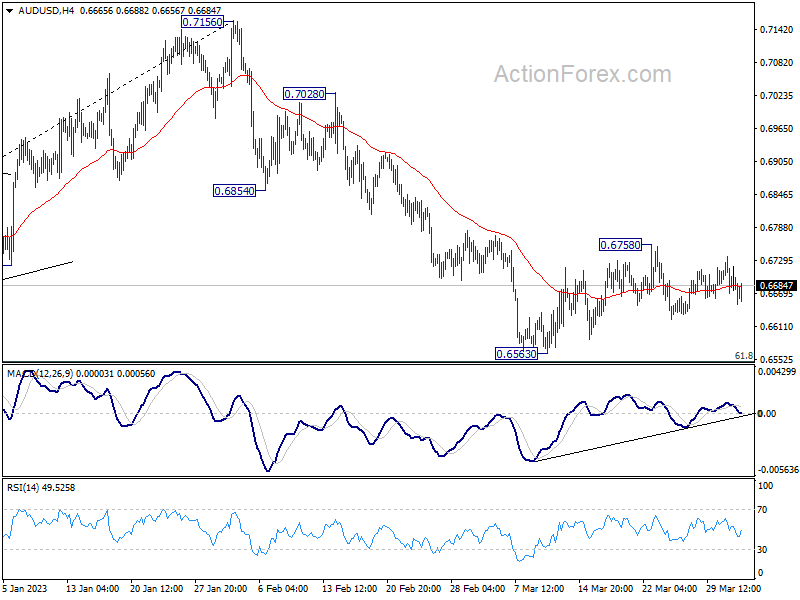
In the bigger picture, as long as 61.8% retracement of 0.6169 to 0.7156 at 0.6546 holds, the decline from 0.7156 is seen as a correction to rally from 0.6169 (2022 low) only. Another rise should still be seen through 0.7156 at a later stage. However, sustained break of 0.6546 will raise the chance of long term down trend resumption through 0.6169 low.