Sample Category Title
Dollar Rallies Amid Inflation Fears as Oil Prices Surge
In today's Asian trading session, Dollar witnessed a remarkable bounce as concerns over inflation reemerged, driven by a sudden upswing in oil prices. WTI crude oil fleetingly broke the 80 level after Saudi Arabia and other OPEC+ oil producers made an unforeseen announcement on Sunday, revealing additional oil output cuts of around 1.16 million barrels per day. Initially, market participants anticipated OPEC+ to maintain the current 2 million bpd cuts through the end of 2023. However, the updated total of 3.66 million bpd cuts, accounting for 3.7% of global demand, caught many by surprise.
In the realm of currency trading, Canadian Dollar is hot on the heels of the greenback, emerging as the second strongest performer for the day so far, followed closely by Australian Dollar. On the flip side, New Zealand Dollar, Yen, and Swiss Franc lag behind as the weakest. As the week unfolds, traders will keep a keen eye on RBA and RBNZ rate decisions, in addition to crucial US economic data, including ISM indexes and non-farm payroll employment figures.
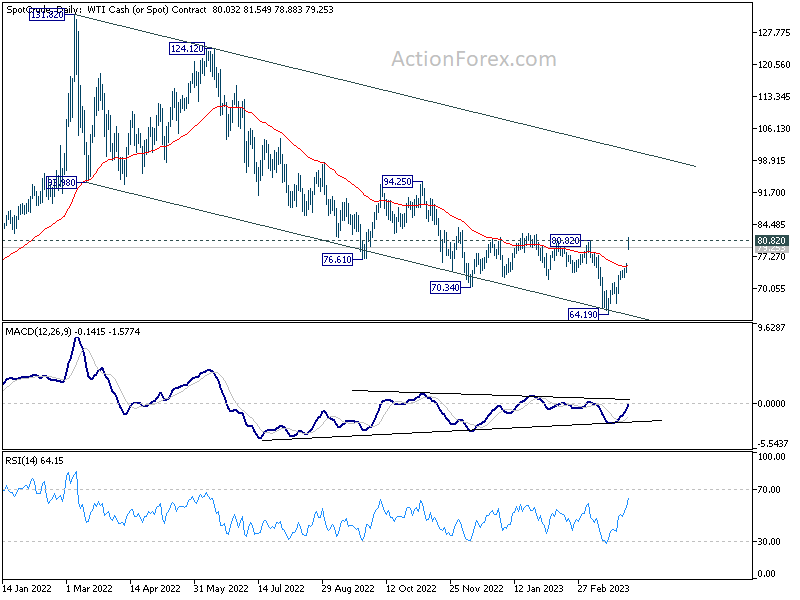
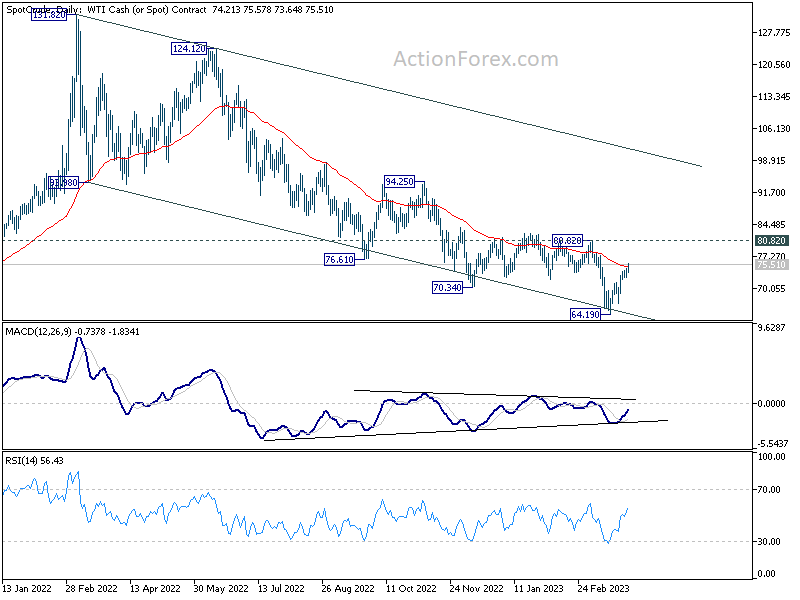
From a technical standpoint, the spotlight now falls on 80.82 resistance level in WTI crude oil. Should this level hold, price actions originating from 64.19 will likely maintain a sideways trajectory. A breach of the 55 Day EMA (now at 75.08) could trigger a more significant decline, revisiting the 64.19 low. However, if 80.82 is sustainably surpassed, it could mark the onset of a more substantial bullish trend reversal, potentially fueling a more vigorous rally toward the subsequent resistance level at 94.25. If this scenario unfolds, it could further rekindle anxieties surrounding inflation.
Japan Tankan: Manufacturing deteriorates while non-manufacturing improves
In Q1, Japan's Tankan large manufacturing index dropped for the fifth consecutive quarter, falling from 7 to 1, below the expected 3, and marking the lowest level since December 2020. The large manufacturing outlook also tumbled from 6 to 3, missing the anticipated 4. This decline was attributed to rising raw material and fuel costs, slowing overseas growth, and slumping chip demand.
Conversely, the non-manufacturing index improved for the fourth straight quarter, ticking up from 19 to 20, in line with expectations. The non-manufacturing outlook rose from 11 to 15, although it fell short of the expected 16.
Despite these mixed results, large Japanese firms plan to increase capital expenditure by 3.2% in the fiscal year that began in April, which is lower than the market's forecast for a 4.9% gain. The Tankan survey also revealed that Japanese firms anticipate inflation to reach a record 2.8% a year from now and remain above the BoJ's target for the next three to five years.
Japan PMI manufacturing finalized at 49.2, signs of improvement at the end of Q1
Japan PMI Manufacturing was finalized at 49.2 in March, up from prior month's 47.7.
Economist Usamah Bhatti from S&P Global Market Intelligence highlighted that the Japanese manufacturing sector showed signs of improvement at the end of Q1 2023, despite marking a fifth consecutive contraction.
Output and new orders experienced their softest declines in five months, but subdued market demand persisted in both domestic and international markets.
The lack of new incoming business led to firms preparing for an eventual rise in demand, with backlogs of work falling sharply for the sixth consecutive month. Additionally, manufacturers were increasingly stockpiling finished goods.
While input cost inflation slowed to its lowest rate since August 2021, selling price inflation remained high and accelerated, as Japanese goods producers partially passed on higher cost burdens to clients.
China Caixin PMI manufacturing dropped to 50, slowdown of recovery
China Caixin PMI Manufacturing dropped from 51.6 to 50.0 in March, below expectation of 51.7. It signalled stable business conditions at the end of the first quarter.
Wang Zhe, Senior Economist at Caixin Insight Group said: "In a nutshell, the economy saw a marginal slowdown of recovery in March as the expansion in both manufacturing supply and demand significantly weakened from the previous month.
"Overseas demand dragged, employment worsened, inventories dropped slightly, prices remained largely stable, logistics was gradually restored to normal, and businesses were still highly confident in the economic outlook."
RBA to pause, RBNZ continues tightening, busy economic calendar with NFP and ISMs
In the holiday shortened week, the calendar is packed with two central bank meetings, plus some important economic data releases including US non-farm payroll employment and ISM indexes.
RBA is widely anticipated to maintain its interest rate at 3.60%. As stated in the minutes from their March meeting, RBA members plan to "reconsider the case for a pause" in the upcoming meeting, allowing for more time to assess the economy's outlook. February's employment data showed a robust labor market, with unemployment rate dropping from 3.67% to 3.54%. However, retail sales only saw a modest 0.2% growth, and monthly CPI decelerated more than expected from 7.4% yoy to 6.8% yoy. These factors provide enough leeway for the central bank to adopt a wait-and-see approach.
For the May meeting, some have called for an additional 25 basis point hike to conclude the tightening cycle, but it remains too early to say. The RBA staff will complete new economic forecasts using fresh quarterly CPI data from Q1, including the underlying inflation measure Trimmed Mean CPI. RBA Governor Philip Lowe is expected to emphasize the importance of a meeting-by-meeting approach to monetary policy.
In contrast, RBNZ is expected to raise the Official Cash Rate by 25bps to 5.00%. In February's Monetary Policy Statement, RBNZ projected that the interest rate would peak at 5.50% this year, equivalent to two more 25 basis point hikes. As such, it is more likely that the RBNZ will signal in its statement that the tightening cycle is not over, and further rate increases are on the horizon.
In addition to the central bank decisions, the economic calendar is filled with important data releases. Most attention will be on US non-farm payroll employment and ISM indexes, but other significant releases include Canada employment, Japan's Tankan survey, and China's Caixin PMIs.
Here are some highlights for the week:
- Monday: Japan Tankan survey, PMI manufacturing final; Australia MI inflation gauge, building approvals, retail sales; China Caixin PMI manufacturing; Swiss CPI, PMI manufacturing; Eurozone PMI manufacturing final; UK PMI manufacturing final; US ISM manufacturing, construction spending.
- Tuesday: Japan monetary base; RBA rate decision; Germany trade balance; Eurozone PPI, Canada building permits; US factory orders.
- Wednesday: RBNZ rate decision; Germany factory orders; France industrial production; Eurozone PMI services final; UK PMI services final; US ADP employment, trade balance, ISM services; Canada trade balance.
- Thursday: Australia trade balance; China Caixin PMI services; Swiss unemployment rate, foreign currency reserves; UK PMI construction; Germany industrial production; Canada employment, Ivey PMI; US jobless claims.
- Friday: Japan average cash earnings, household spending, leading indicators; France trade balance; US non-farm payrolls.
GBP/USD Daily Outlook
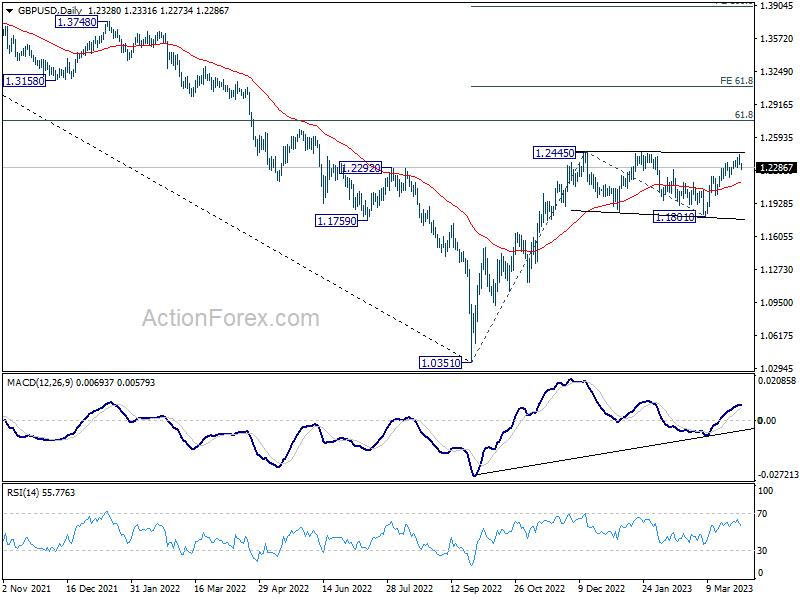
Daily Pivots: (S1) 1.2296; (P) 1.2360; (R1) 1.2394; More...
GBP/USD's retreat from 1.2421 continues today but stays above 1.2203 resistance turned support. Intraday bias remains neutral for the moment and further rally is in favor. On the upside, decisive break of 1.2445/6 resistance zone will resume larger rally from 1.0351, and target 1.2759 fibonacci level. However, break of 1.2203 resistance turned support will extend the corrective pattern from 1.2445 with another falling leg, and turn bias back to the downside.
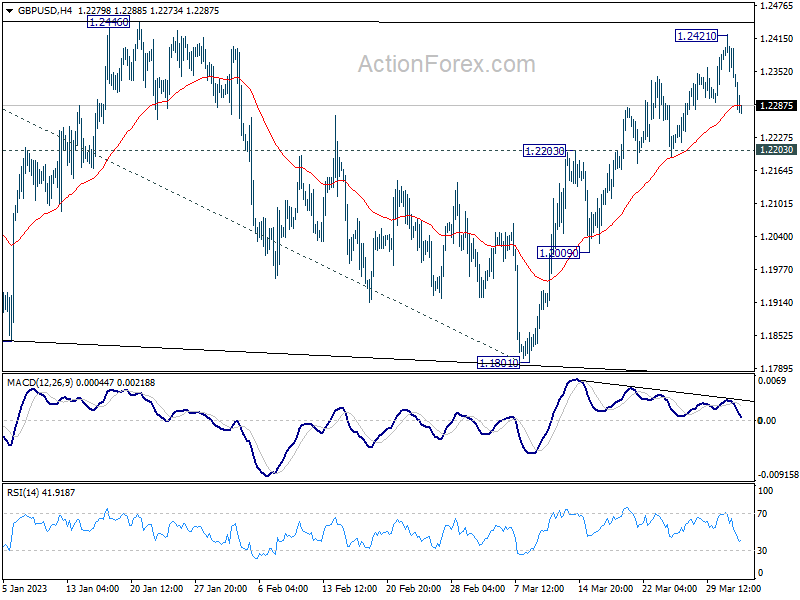
In the bigger picture, the rise from 1.0351 medium term term bottom (2022 low) is in progress for 61.8% retracement of 1.4248 (2021 high) to 1.0351 at 1.2759. Sustained break there will add to the case of long term bullish trend reversal. Further break of 61.8% projection of 1.0351 to 1.2445 from 1.1801 at 1.3095 could prompt upside acceleration to 100% projection at 1.3895. For now, this will remain the favored case as long as 1.1801 support holds, even in case of deep pull back.
Economic Indicators Update
| GMT | Ccy | Events | Actual | Forecast | Previous | Revised |
|---|---|---|---|---|---|---|
| 23:50 | JPY | Tankan Large Manufacturing Outlook Q1 | 3 | 4 | 6 | |
| 23:50 | JPY | Tankan Large Manufacturing Index Q1 | 1 | 3 | 7 | |
| 23:50 | JPY | Tankan Non - Manufacturing Outlook Q1 | 15 | 16 | 11 | |
| 23:50 | JPY | Tankan Non - Manufacturing Index Q1 | 20 | 20 | 19 | |
| 23:50 | JPY | Tankan Large All Industry Capex Q1 | 3.20% | 9.90% | 19.20% | |
| 00:30 | JPY | Manufacturing PMI Mar F | 49.2 | 48.6 | 48.6 | |
| 01:00 | AUD | TD Securities Inflation M/M Mar | 0.30% | 0.40% | ||
| 01:30 | AUD | Building Permits M/M Feb | 4.00% | 10.20% | -27.60% | -27.10% |
| 01:45 | CNY | Caixin Manufacturing PMI Mar | 50.0 | 51.7 | 51.6 | |
| 06:30 | CHF | CPI M/M Mar | 0.40% | 0.70% | ||
| 06:30 | CHF | CPI Y/Y Mar | 3.20% | 3.40% | ||
| 07:30 | CHF | SVME PMI Mar | 48.9 | 48.9 | ||
| 07:45 | EUR | Italy Manufacturing PMI Mar | 51 | 52 | ||
| 07:50 | EUR | France Manufacturing PMI Mar F | 47.7 | 47.7 | ||
| 07:55 | EUR | Germany Manufacturing PMI Mar F | 44.4 | 44.4 | ||
| 08:00 | EUR | Eurozone Manufacturing PMI Mar F | 47.1 | 47.1 | ||
| 08:30 | GBP | Manufacturing PMI Mar F | 48 | 48 | ||
| 13:30 | CAD | Manufacturing PMI Mar | 52.4 | |||
| 13:45 | USD | Manufacturing PMI Mar F | 49.3 | 49.3 | ||
| 14:00 | USD | ISM Manufacturing PMI Mar | 47.5 | 47.7 | ||
| 14:00 | USD | ISM Manufacturing Prices Paid Mar | 50 | 51.3 | ||
| 14:00 | USD | ISM Manufacturing Employment Index Mar | 49.1 | |||
| 14:00 | USD | Construction Spending M/M Feb | 0.00% | -0.10% | ||
| 14:30 | CAD | BoC Business Outlook Survey |
Technical Outlook and Review
DXY:
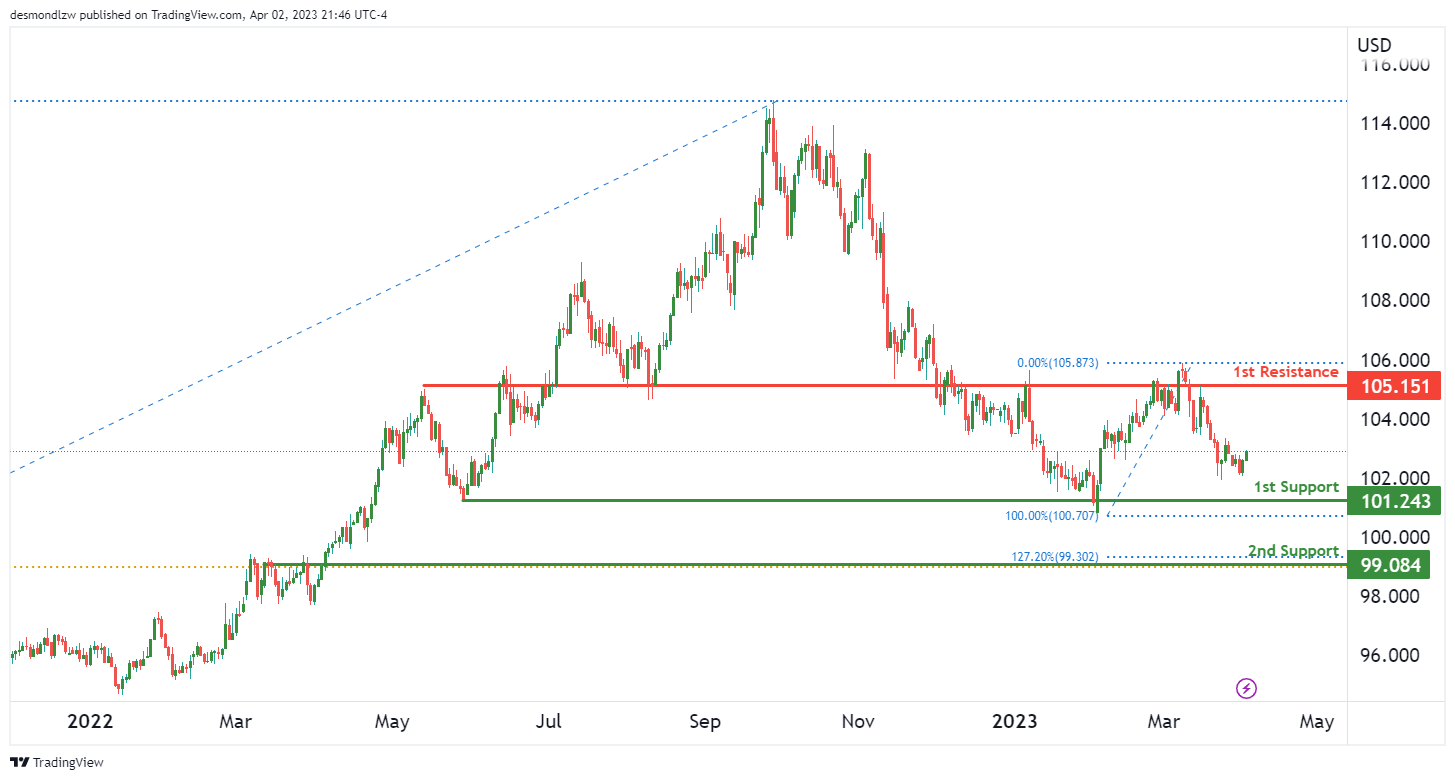
The overall momentum of the DXY chart is neutral, which means there is no clear trend direction. Price is likely to fluctuate between the 1st resistance and 1st support level.
The 1st support level for DXY is at 101.24. This is a multi-swing low support level, which means that price has bounced off this level multiple times in the past. This indicates that there is a strong demand for DXY at this level, and if price were to drop to this level, it could potentially bounce back up.
The 2nd support level for DXY is at 99.08. This is an overlap support level and coincides with the 127.20% Fibonacci extension, which adds additional weight to this level. If price were to drop below the 1st support level, it could potentially drop to this level next.
The 1st resistance level for DXY is at 105.15. This is an overlap resistance level, which means that it has served as a resistance level in the past. If price were to rise from the 1st support level, it could potentially rise to this level next.
It’s worth noting that since there is no clear trend or momentum, any breakouts of these support and resistance levels may not be highly significant.
EUR/USD:
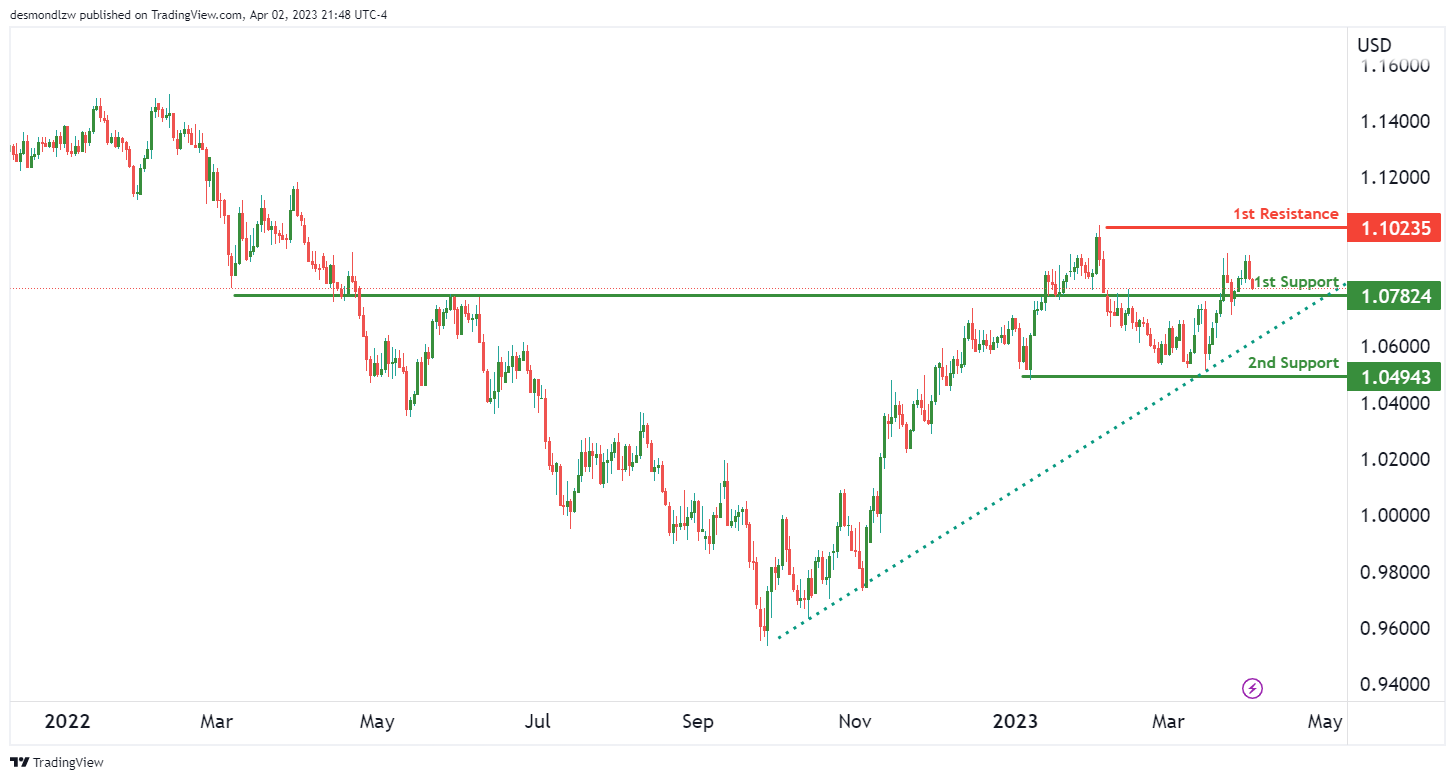
The overall momentum of the EUR/USD chart is bullish, indicating that the price is likely to continue rising. Price could potentially make a bullish continuation towards the 1st resistance level.
The 1st support level for EUR/USD is at 1.0782. This is an overlap support level, which means that it has served as a support level in the past. If the price were to drop to this level, it could potentially bounce back up, as there is a strong demand for EUR/USD at this level.
The 2nd support level for EUR/USD is at 1.0494. This is a multi-swing low support level, which means that price has bounced off this level multiple times in the past. This indicates that there is a strong demand for EUR/USD at this level, and if price were to drop to this level, it could potentially bounce back up.
The 1st resistance level for EUR/USD is at 1.1023. This is a swing high resistance level, which means that it has served as a resistance level in the past. If the price were to continue rising from the current level, it could potentially reach this level next.
It’s worth noting that since the overall momentum of the chart is bullish, any breakouts of these support and resistance levels are likely to be significant.
GBP/USD:
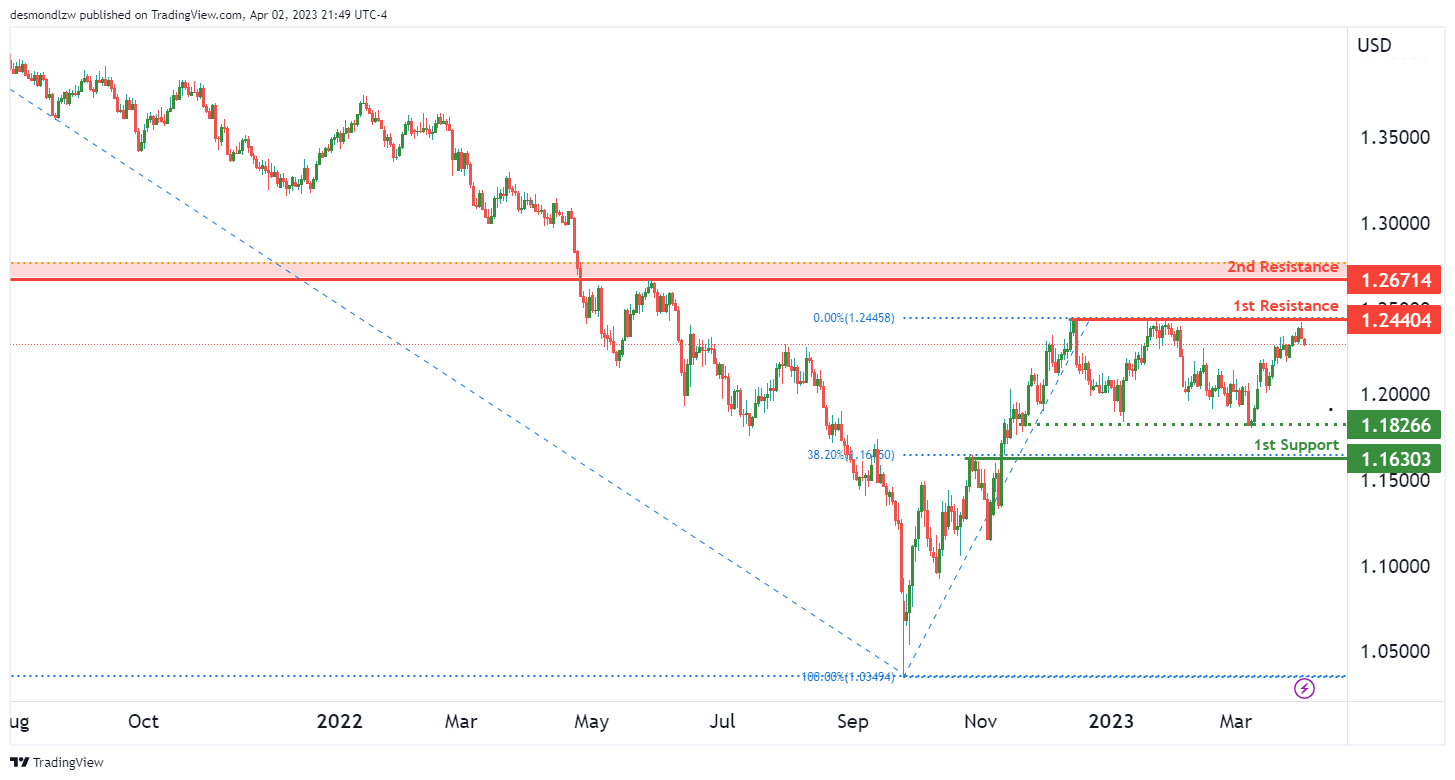
The GBP/USD currency pair. The overall momentum of the chart is bearish, indicating a potential for prices to move lower.
The first support level we have identified is at 1.163. This level is a significant overlap support that has historically been respected by the market. Additionally, it aligns with a 38.20% Fibonacci retracement level, providing further support for its significance.
The intermediate support level we have identified is at 1.1826. This level is a multi-swing low support and provides an additional level of support for the GBP/USD currency pair.
On the resistance side, we have identified the first resistance level at 1.2440. This level is a swing high resistance and has historically been a strong level of resistance for the currency pair.
The second resistance level we have identified is at 1.2671. This level is an overlap resistance that aligns with other technical indicators, providing additional support for its significance as a resistance level.
Overall, the chart’s momentum is bearish, indicating a potential for prices to continue moving lower. If the price were to break below the first support level at 1.163, it could trigger a move down towards the intermediate support level at 1.1826. On the other hand, if prices were to break above the first resistance level at 1.2440, it could trigger a move towards the second resistance level at 1.2671.
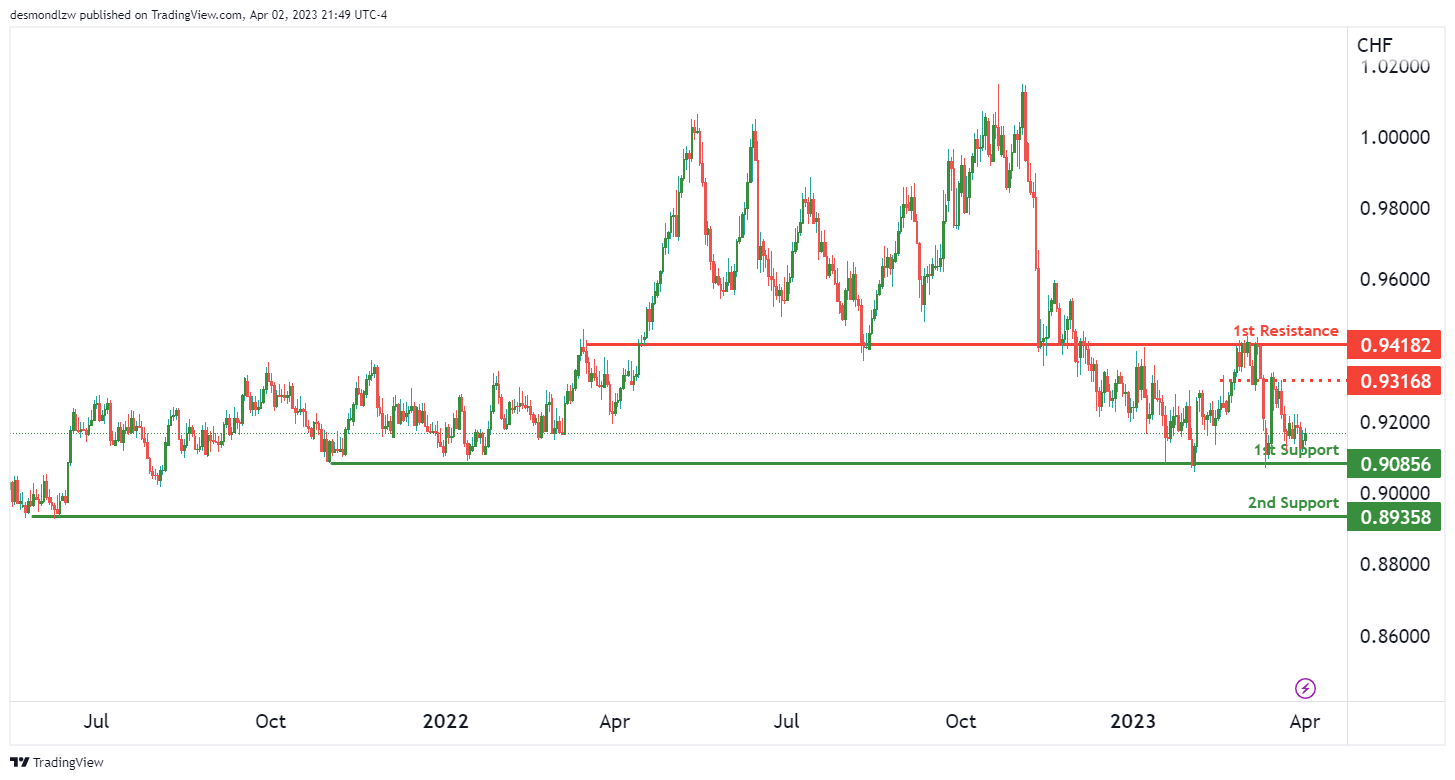
USD/CHF:
The overall momentum of USD/CHF is bullish, indicating a potential for prices to move higher.
The first support level we have identified is at 0.9085. This level is a significant multi-swing low support that has historically been respected by the market. It provides a strong level of support for the currency pair.
The second support level we have identified is at 0.8935. This level is also a multi-swing low support that has historically been respected by the market, providing an additional layer of support for the currency pair.
On the resistance side, we have identified the first resistance level at 0.9418. This level is an overlap resistance and has historically been a strong level of resistance for the currency pair. It aligns with other technical indicators, providing additional support for its significance.
The intermediate resistance level we have identified is at 0.9316. This level is an overlap resistance and has historically been a strong level of resistance for the currency pair.
USD/JPY:
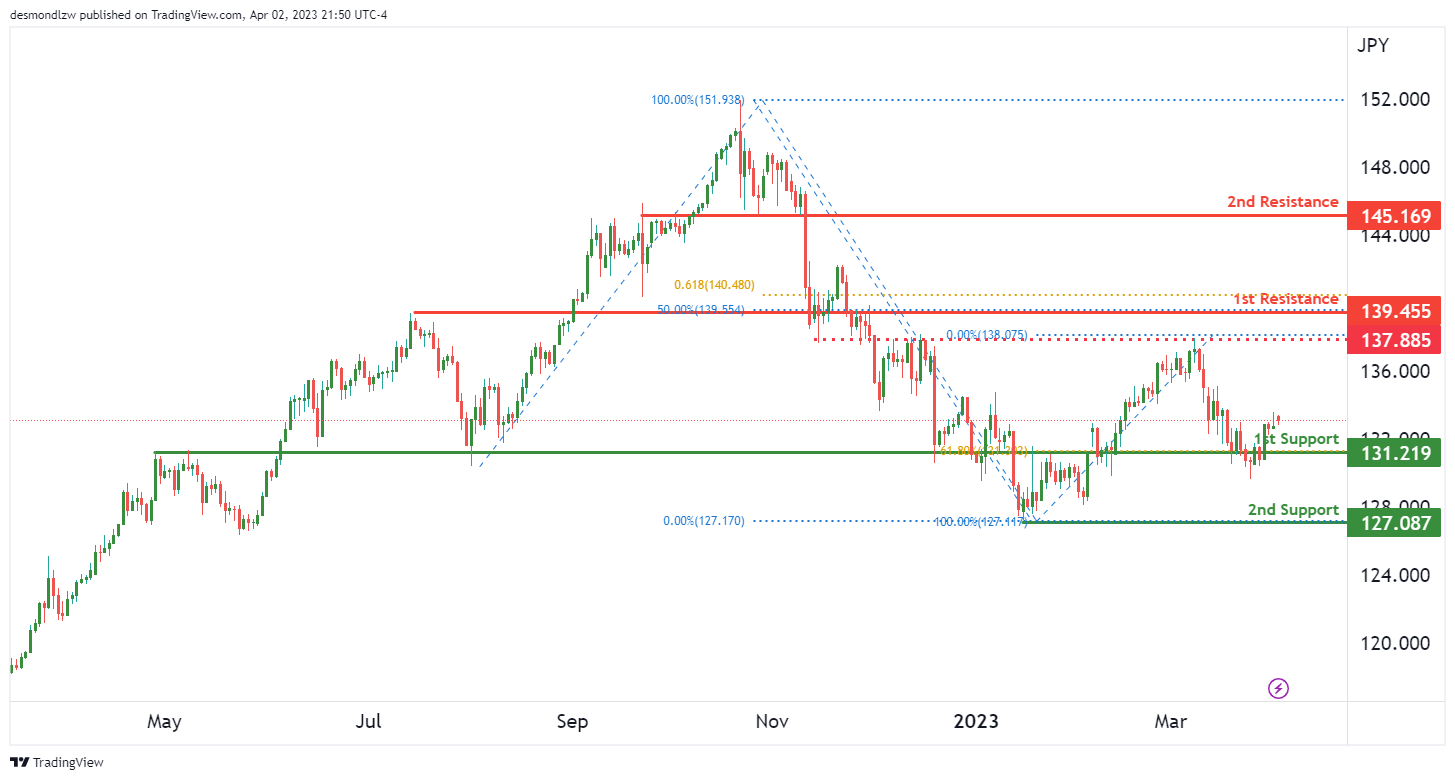
The USD/JPY chart is bullish. The price has the potential to continue its upward movement towards the 1st resistance level of 139.45.
The 1st support level at 131.21 is a good level for the price to potentially bounce off from, as it is an overlap support and is aligned with the 61.80% Fibonacci retracement. The 2nd support level at 127.08 is also a good level, being a swing low support.
On the other hand, the 1st resistance level at 139.45 is a strong overlap resistance, which coincides with the 50% Fibonacci retracement, making it a crucial level to watch out for. The 2nd resistance level at 245.16 is another good resistance level, being an overlap resistance as well.
There is an intermediate resistance level at 137.88, which also acts as a good level of resistance. If the price manages to break this intermediate resistance, it could potentially trigger a stronger bullish acceleration towards the 1st resistance level.
AUD/USD:
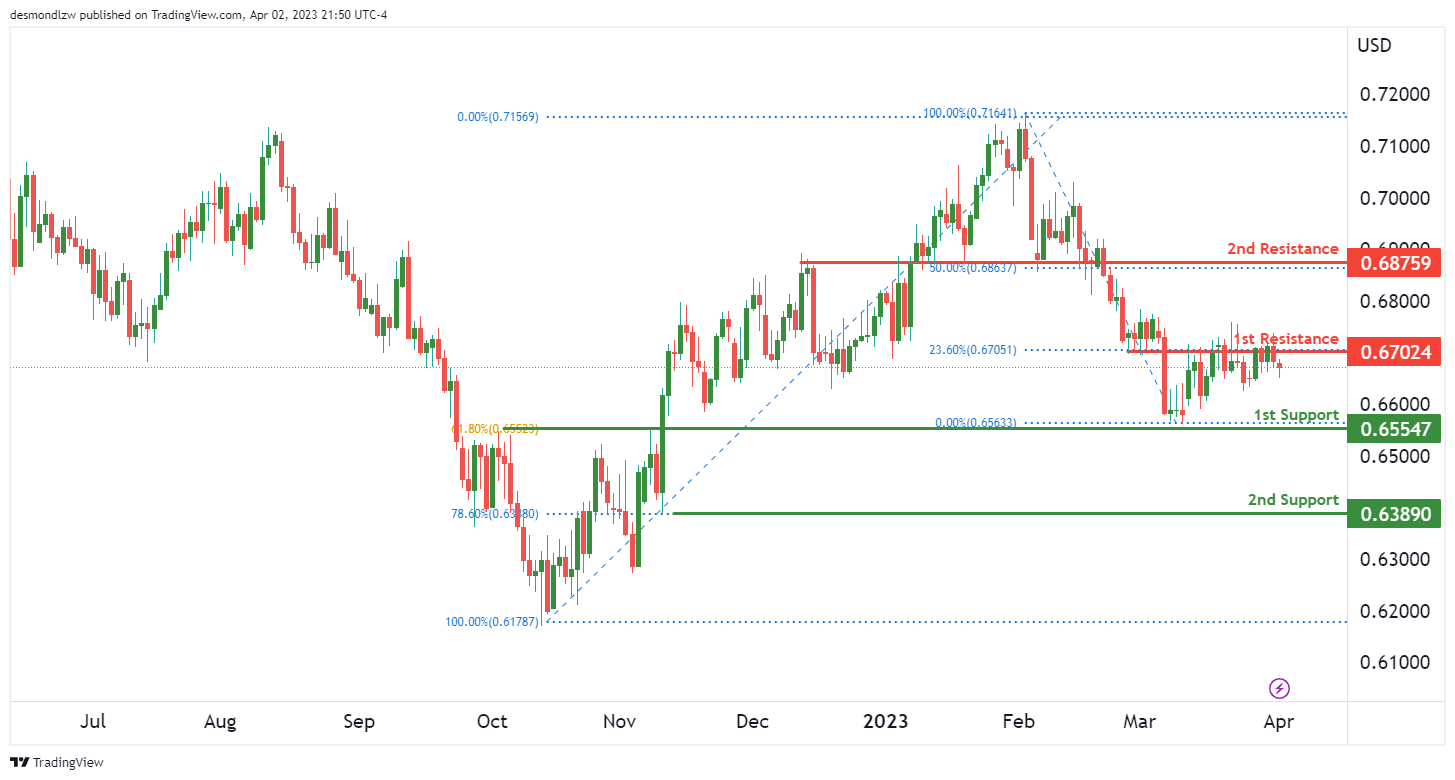
The AUD/USD currency pair remains bearish as it struggles to gain momentum against the US dollar. With an overall momentum of the chart indicating a bearish bias, it is possible that the pair could see a continuation towards the 1st support level.
At present, the 1st support is at 0.6554, which is a good level of support for the AUD/USD pair as it is an overlap support with a 61.80% Fibonacci retracement. The 2nd support at 0.6389 is also a noteworthy support level, as it is an overlap support with a 78.60% Fibonacci retracement.
On the resistance side, the 1st resistance at 0.6702 is an overlap resistance with a 23.60% Fibonacci retracement. The 2nd resistance level at 0.6875 is also an overlap resistance with a 50% Fibonacci retracement. If the price manages to break above these levels, it could potentially signal a bullish reversal. However, the current momentum suggests that the pair may continue its bearish trend.
It is worth noting that the AUD/USD pair is displaying a bearish trend as the overall momentum of the chart is bearish. This suggests that price could potentially make a bearish continuation towards the 1st support level. If the pair does break below the 1st support level, the next level of support could be the 2nd support at 0.6389.
NZD/USD:
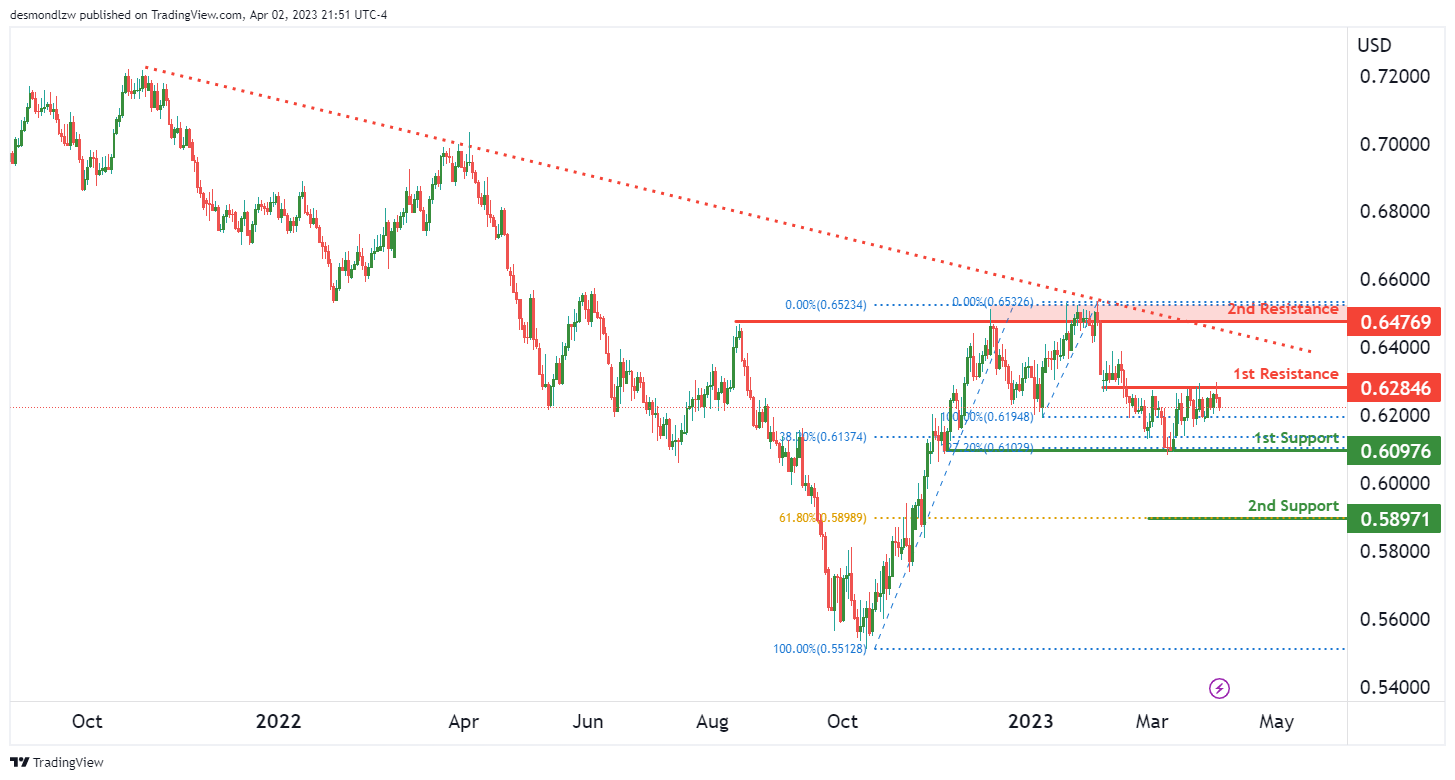
The NZD/USD chart is showing bearish momentum, as the price has potential to continue its downward trend towards the 1st support level. The overall momentum of the chart is bearish, suggesting that the pair could face selling pressure in the near future.
The 1st support level is at 0.6097, which is a multi-swing low support and coincides with a 38.20% Fibonacci retracement. If the price were to break this support level, it could drop towards the 2nd support level at 0.5897, which is a swing low support and coincides with a 61.80% Fibonacci retracement.
On the resistance side, the 1st resistance level is at 0.6284, which is an overlap resistance. If the price were to rise, it could face resistance at the 2nd resistance level of 0.6476, which is a multi-swing high resistance.
USD/CAD:
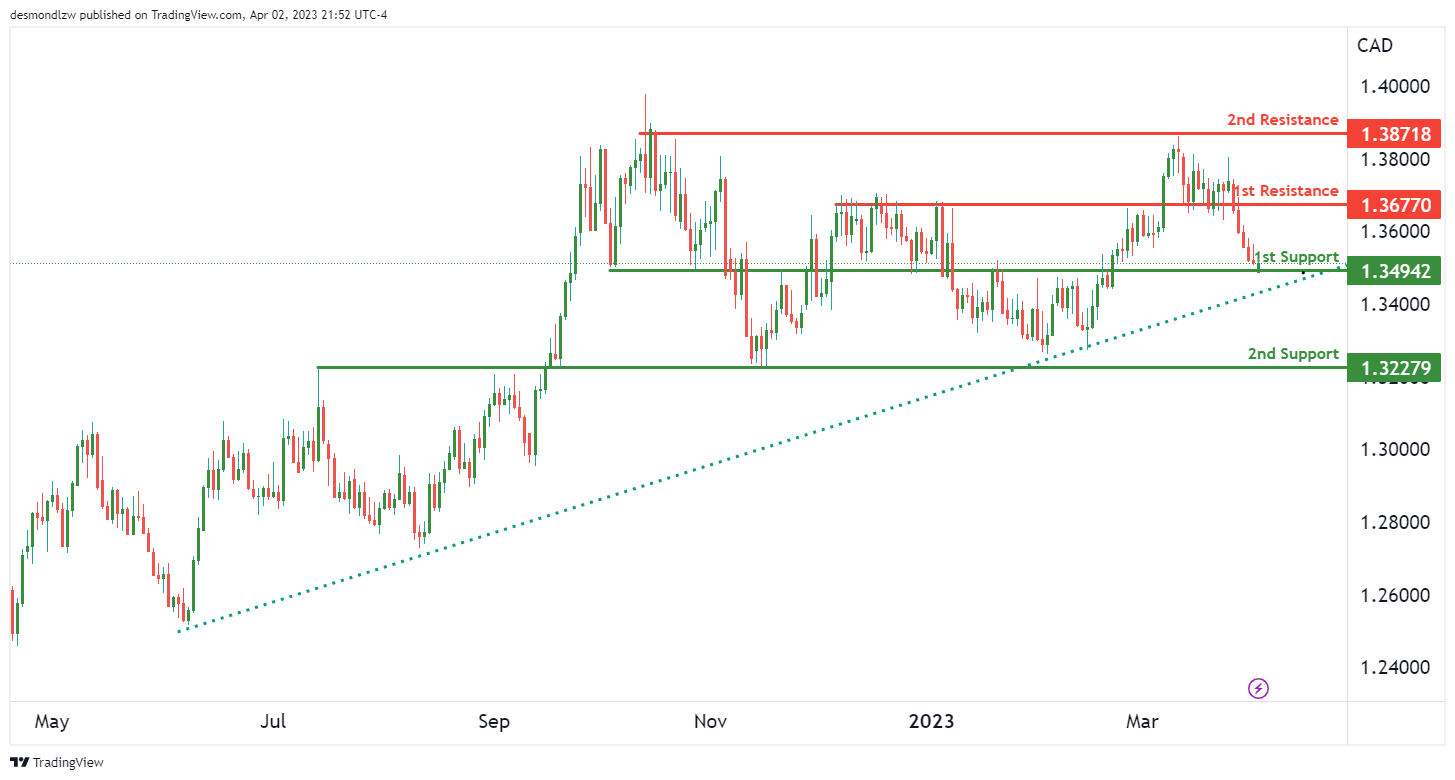
USD/CAD has seen a bullish momentum, driven by a major ascending trend line suggesting further bullish momentum is on the cards.
Looking at the support and resistance levels, the 1st support level is at 1.3494. This level is a strong overlap support that has held the price previously. The 2nd support level is at 1.3227, which is also an overlap support level.
On the other hand, the 1st resistance level is at 1.3677, which is an overlap resistance level. If the price manages to break above this resistance level, it could potentially reach the 2nd resistance level at 1.3871, which is a multi-swing high resistance level.
In case the price bounces off the 1st support level, it could head towards the 1st resistance level. However, if it breaks below the 1st support level, the next support level is at 2nd support level at 1.3227.
DJ30:
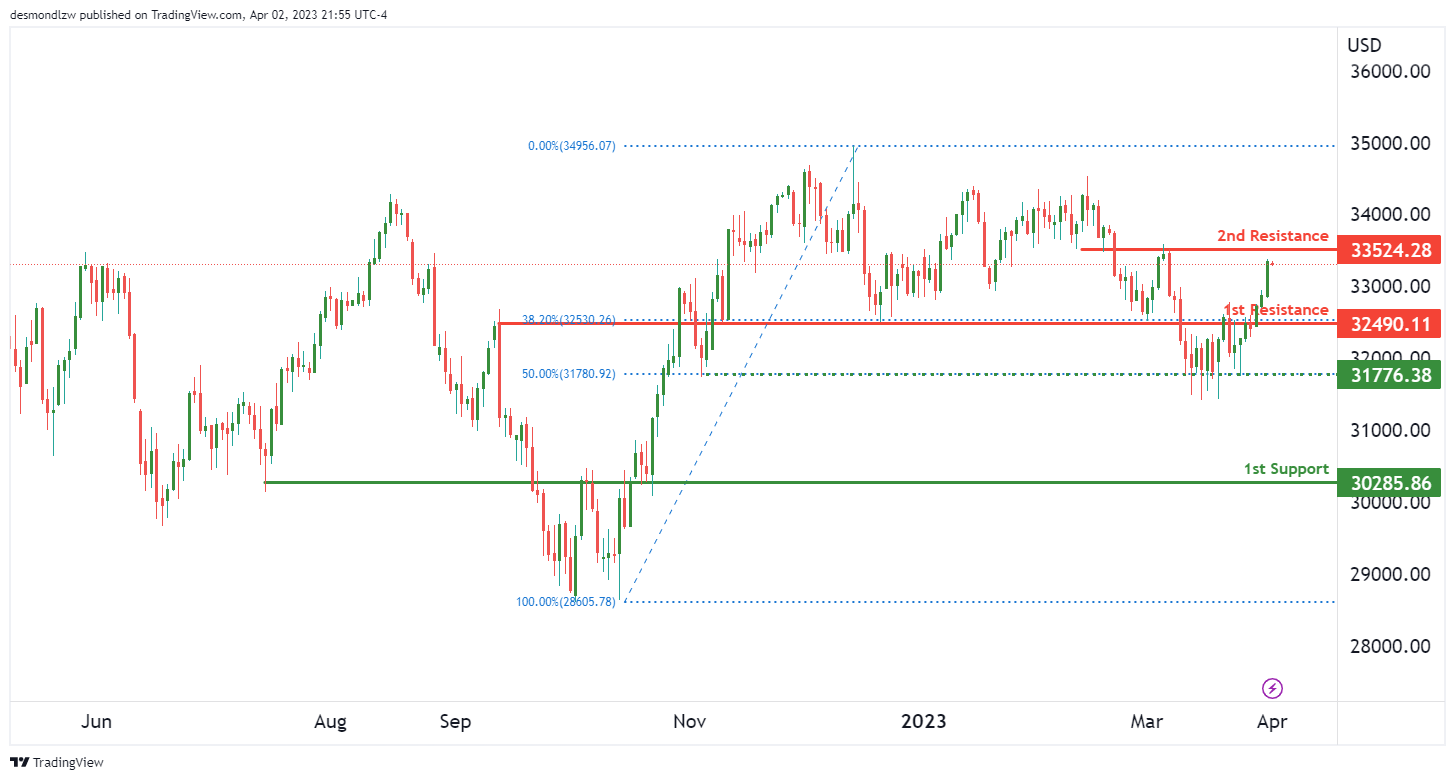
The DJ30 chart is currently showing bullish momentum as it is above a major ascending trend line. In the short term, price could potentially rise towards the 1st resistance before reversing off it and dropping towards the 1st support.
The 1st support level is at 30285.86 and is a strong overlap support. This level could provide a good level for buyers to enter the market. If price were to break below this support, it could head towards the intermediate support level at 31776.38 which also coincides with a 50% Fibonacci retracement level.
On the upside, the 1st resistance level is at 32490.11 and is also an overlap resistance, with a 38.20% Fibonacci retracement lining up with it. If price were to break above this resistance level, it could potentially rise towards the 2nd resistance level at 33524.28 which is also an overlap resistance.
GER30:
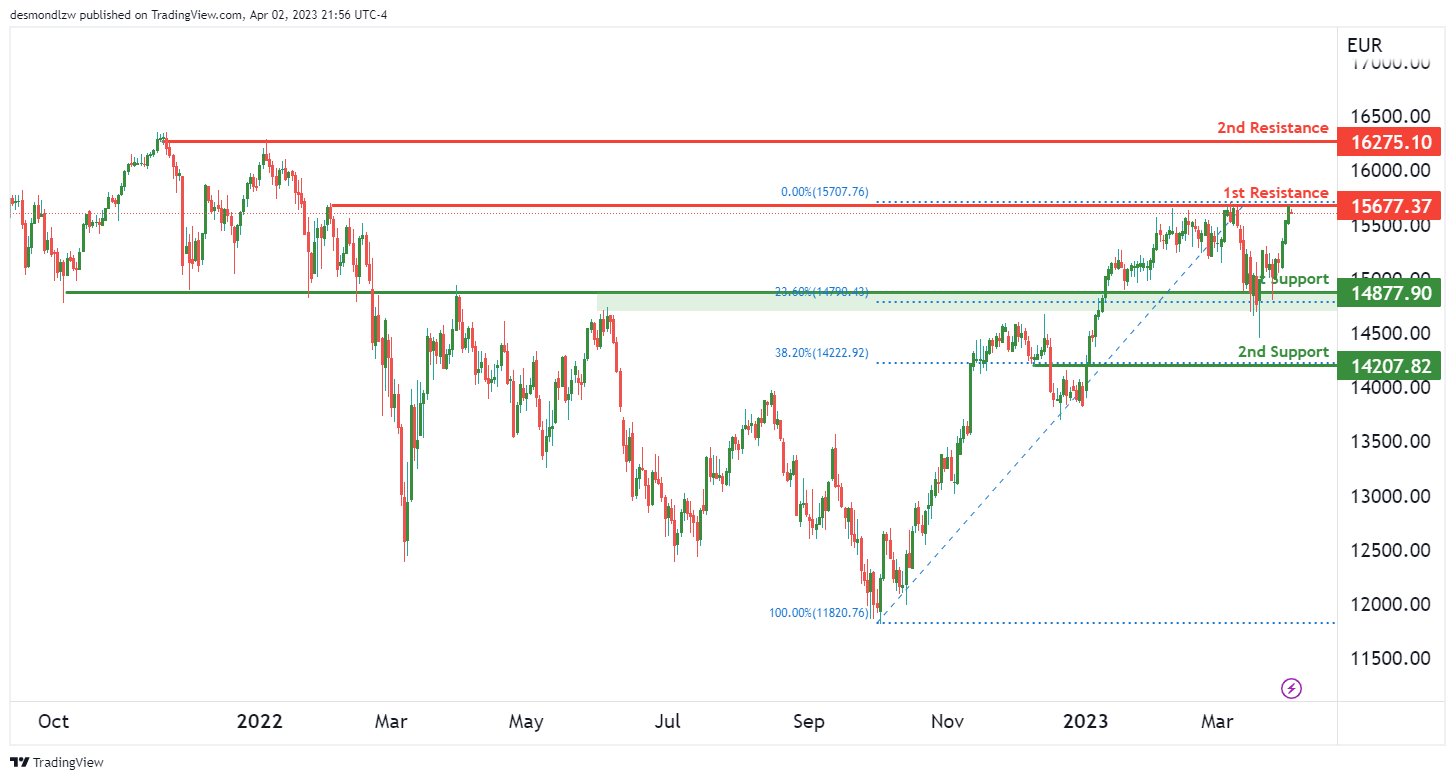
The German DAX 30 index (GER30) is currently showing a bearish momentum, as prices have been trending lower over recent periods. However, there may be some potential for a short-term bullish move before a possible continuation of the downtrend.
Looking at the chart, the price is currently testing the 1st resistance level at 15,677.37, which is a multi-swing high resistance level. If the price reacts bearishly to this resistance, we may see a drop towards the 1st support at 14,877.90, which is an overlap support level and a 23.60% Fibonacci retracement level.
If the price bounces off the 1st support level, it could potentially rise towards the 1st resistance level, before reversing again and continuing the downtrend. The intermediate support at 14,207.82, which is an overlap support level and a 38.20% Fibonacci retracement level, may also act as a support level on the way down.
On the upside, the 2nd resistance level at 16,275.10, which is a multi-swing high resistance level, may act as a strong resistance level in case of a strong bullish move.
BTC/USD:
BTC/USD Shows Bearish Momentum with Potential Drop to Support
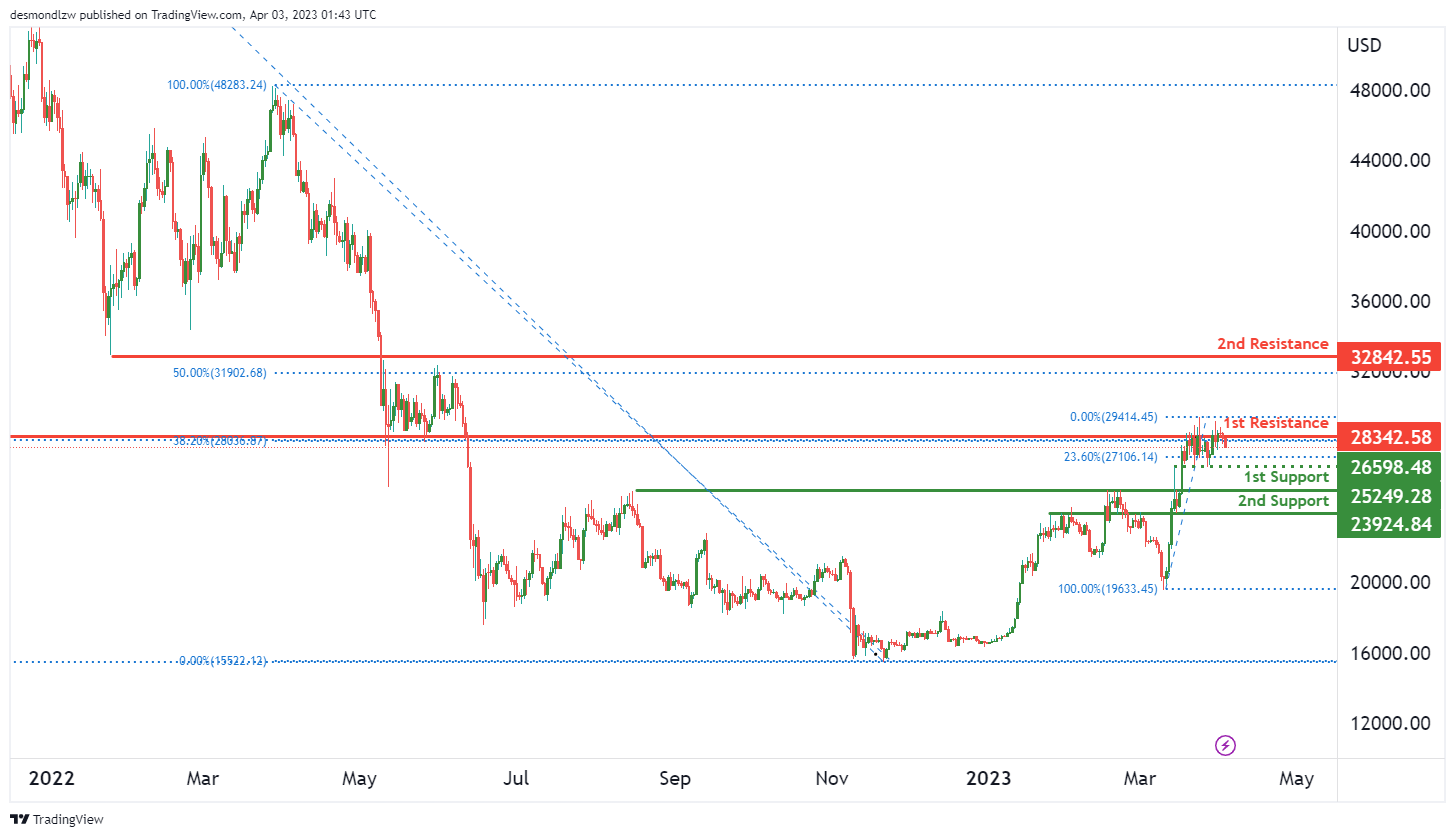
The overall momentum of the BTC/USD chart is bearish, with potential for a bearish continuation towards the 1st support level. The price is currently below the Ichimoku cloud, indicating bearish momentum.
The 1st support level is at 25249.28, which is a strong overlap support level. If the price were to drop from its current level, it could potentially reach this support level. The 2nd support level is at 23924.84 and is another overlap support level.
On the resistance side, the 1st resistance level is at 28342.58, which is a major overlap resistance level and coincides with a 38.20% Fibonacci retracement. The 2nd resistance level is at 32842.55, which is another overlap resistance level and coincides with a 50% Fibonacci retracement.
There is also an intermediate support level at 26598.48, which is an overlap support level and coincides with a 23.60% Fibonacci retracement.
If the price were to break the 1st support level, the next level it could drop to is the 2nd support level. Conversely, if the price were to break the 1st resistance level, it could potentially rise towards the 2nd resistance level.
US500
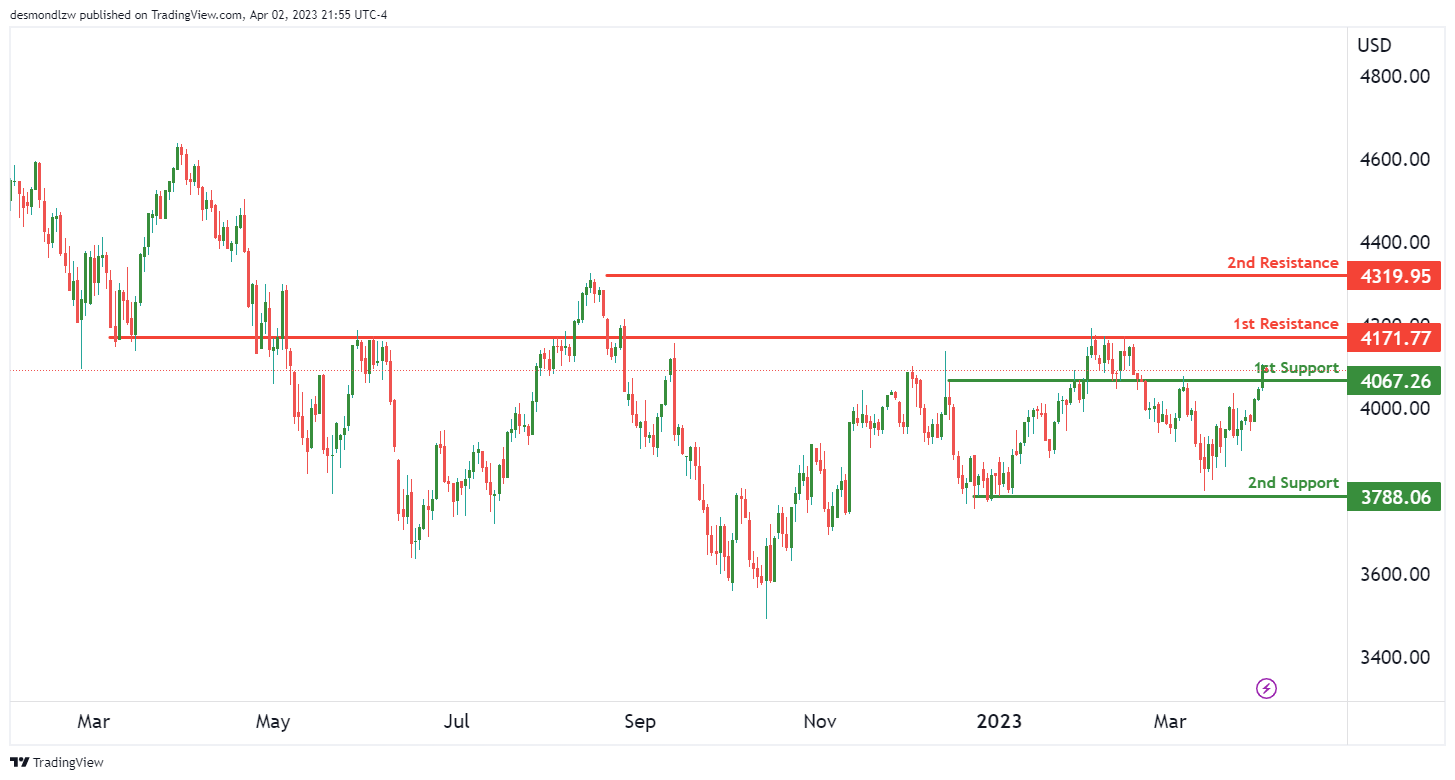
The US500 chart has been showing strong bullish momentum lately, and prices could potentially continue to rise towards the 1st resistance level. This level is at 4171.77 and has been a strong resistance point in the past, making it an ideal target for bulls.
If prices do pull back, the 1st support level at 4067.26 could provide a good opportunity for bulls to enter the market. This level has acted as a strong support level in the past, with multiple touches and bounces. If prices continue to fall, the 2nd support level at 3788.06 is also a good level to watch, as it has been a multi-swing low support level.
On the other hand, if prices break through the 1st resistance level, the 2nd resistance level at 4319.95 could come into play. This level has acted as a swing high resistance in the past and could provide a target for bulls to aim for.
ETH/USD:
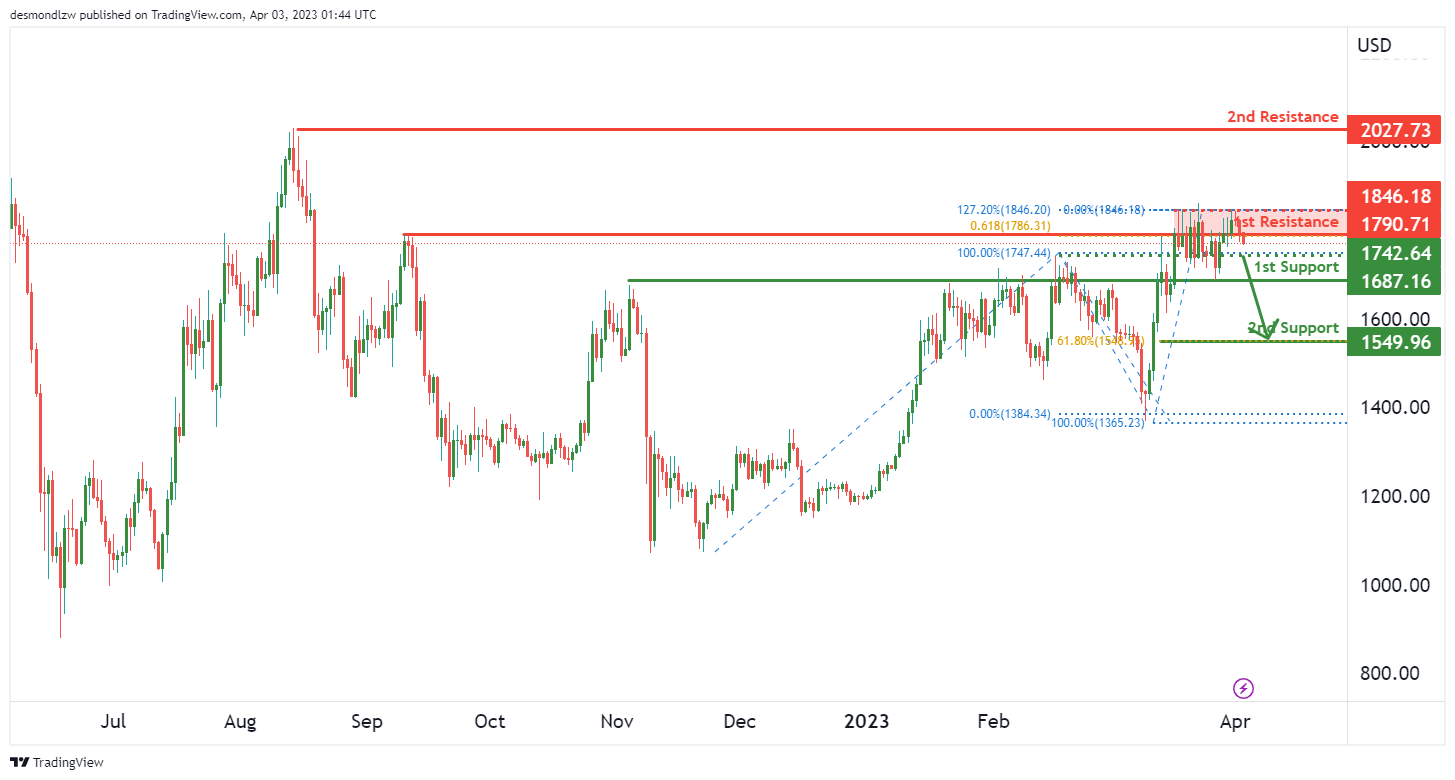
The overall momentum of the ETH/USD chart is bearish, with price potentially making a bearish continuation towards the 1st support. The first support level is at 1687.16, which is a good level due to its overlap support.
If the price breaks the 1st support level, it could potentially drop to the 2nd support level at 1549.96. This level is a swing low support and has a 61.80% Fibonacci retracement lining up with it, making it a good level for potential bounce or reversal.
On the resistance side, the first resistance level is at 1790.71, which is a good level due to its overlap resistance and 127.20% Fibonacci extension. The second resistance level is at 2027.73, which is a swing high resistance.
There is also an intermediate support level at 1742.64, which is a good level due to its overlap support.
WTI/USD:
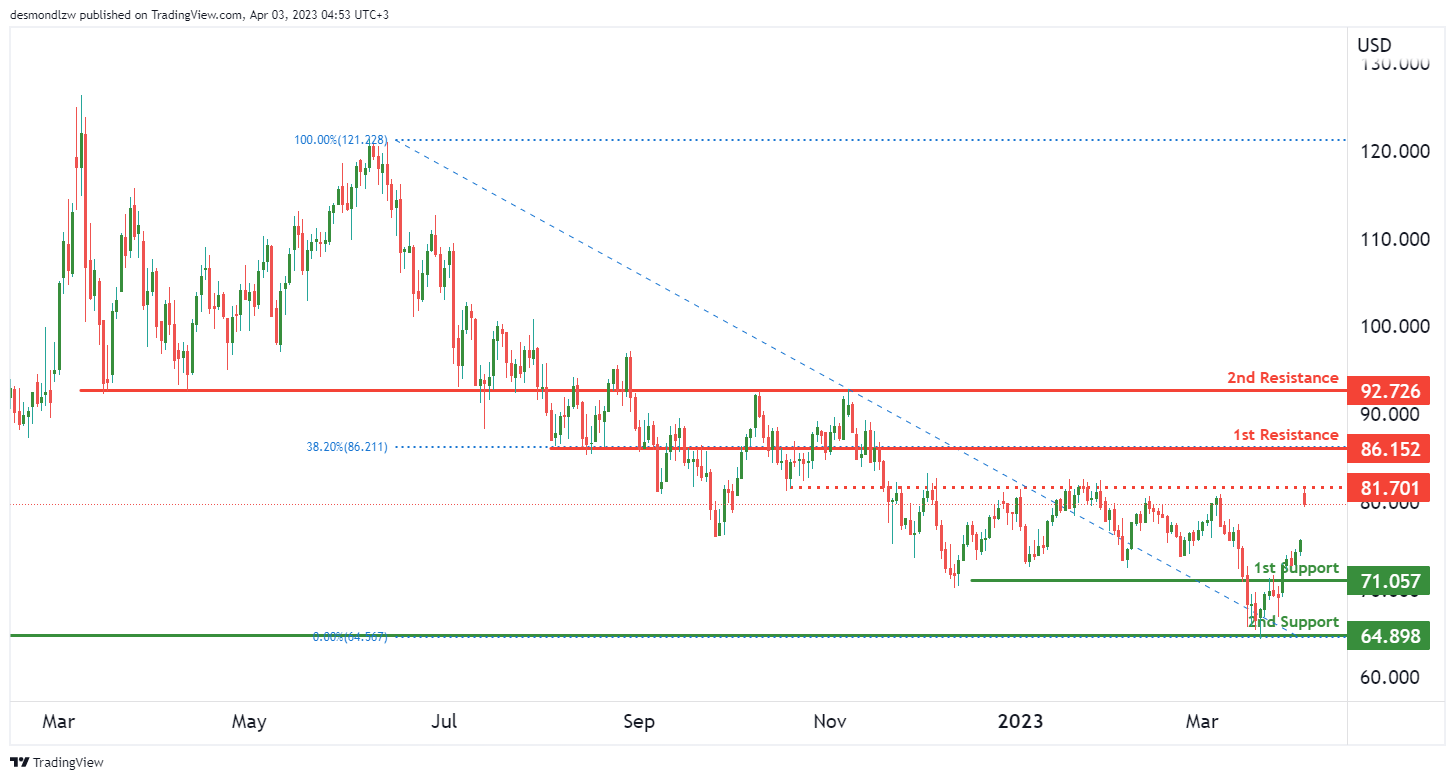
The price of WTI has been experiencing bullish momentum overall, and it is possible that it will continue to rise towards the first resistance level. The first support level for WTI is at 71.05, which is an overlap support level. Additionally, the second support level is at 64.89, which is a swing low support level. On the other hand, the first resistance level is at 86.15, which is an overlap resistance level and is also the 38.20% Fibonacci retracement level. The second resistance level is at 92.72, which is another overlap resistance level. Finally, there is an intermediate resistance level at 81.90, which is also an overlap resistance level. Therefore, if the price continues to rise towards the first resistance level, it may experience some resistance at the intermediate resistance level or at the second resistance level before breaking through to continue on its upward trajectory.
XAU/USD (GOLD):
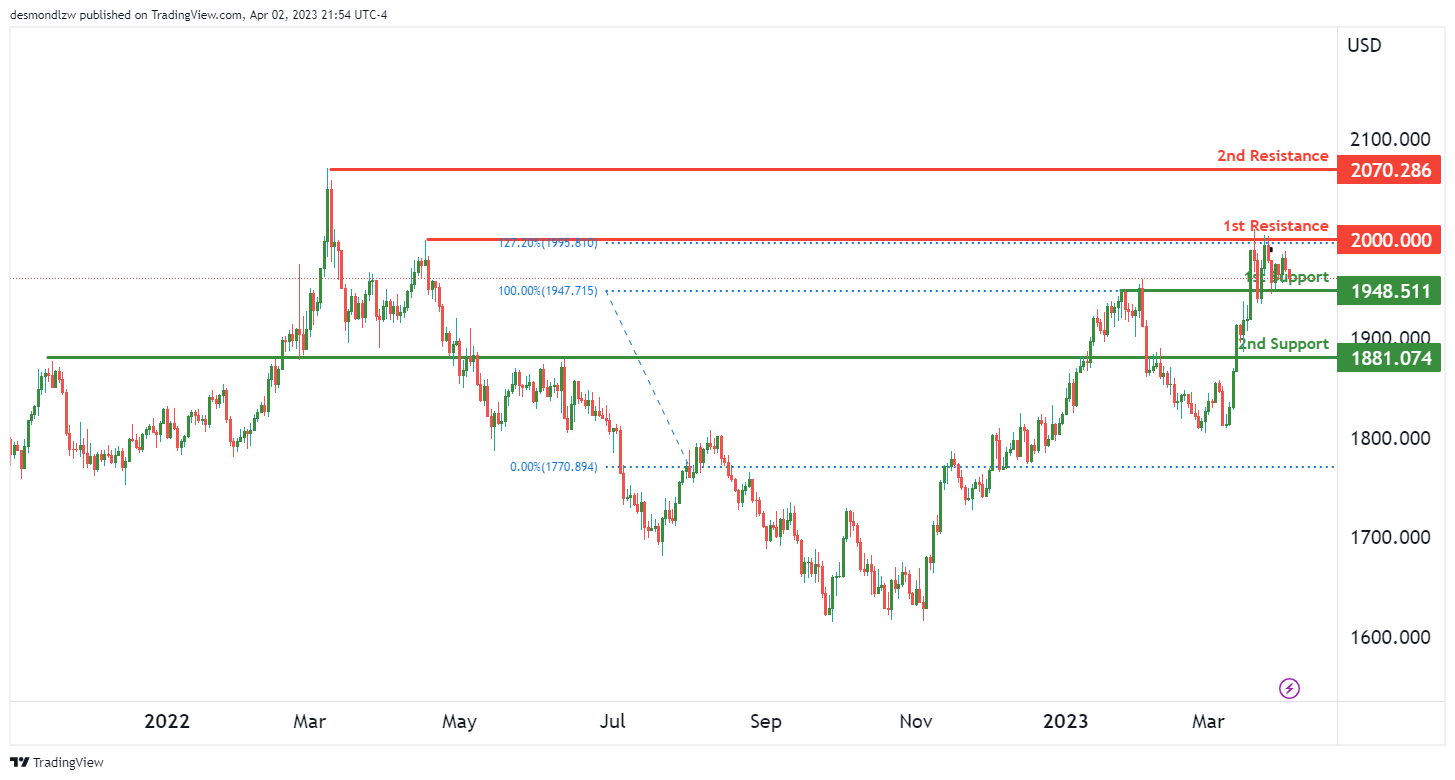
Gold (XAU/USD) has been on a bullish trend, with the overall momentum of the chart being bullish. Looking at the chart, the price could potentially make a bullish bounce off the first support and head towards the first resistance.
The first support level is at 1948.51, which is an overlap support level. This level has been tested multiple times in the past and has held as a support level, making it a good level for a potential bounce.
The second support level is at 1881.07, which is also an overlap support level. This level has been tested several times in the past and has held as a support level, making it another good level for a potential bounce.
On the upside, the first resistance level is at 2000.00. This level is a multi-swing high resistance and has been an important level in the past. Additionally, it is at the 127.20% Fibonacci Extension level, adding further confluence to the level.
The second resistance level is at 2070.00, which is a swing high resistance level. This level has been an important level in the past, making it a good level for traders to watch.
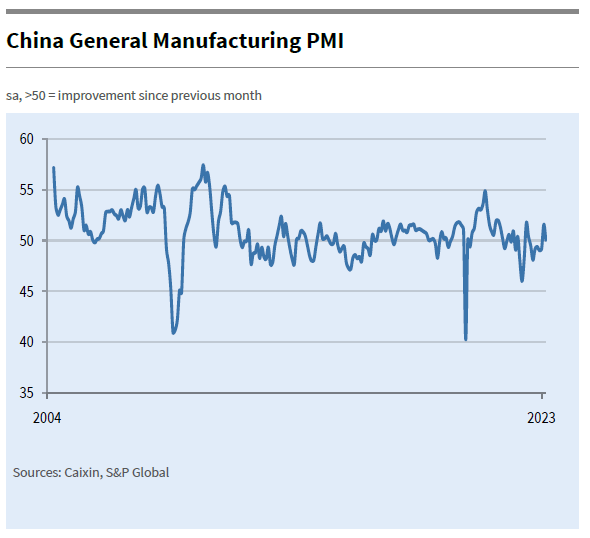
China Caixin PMI manufacturing dropped to 50, slowdown of recovery
China Caixin PMI Manufacturing dropped from 51.6 to 50.0 in March, below expectation of 51.7. It signalled stable business conditions at the end of the first quarter.
Wang Zhe, Senior Economist at Caixin Insight Group said: "In a nutshell, the economy saw a marginal slowdown of recovery in March as the expansion in both manufacturing supply and demand significantly weakened from the previous month.
"Overseas demand dragged, employment worsened, inventories dropped slightly, prices remained largely stable, logistics was gradually restored to normal, and businesses were still highly confident in the economic outlook."
Japan PMI manufacturing finalized at 49.2, signs of improvement at the end of Q1
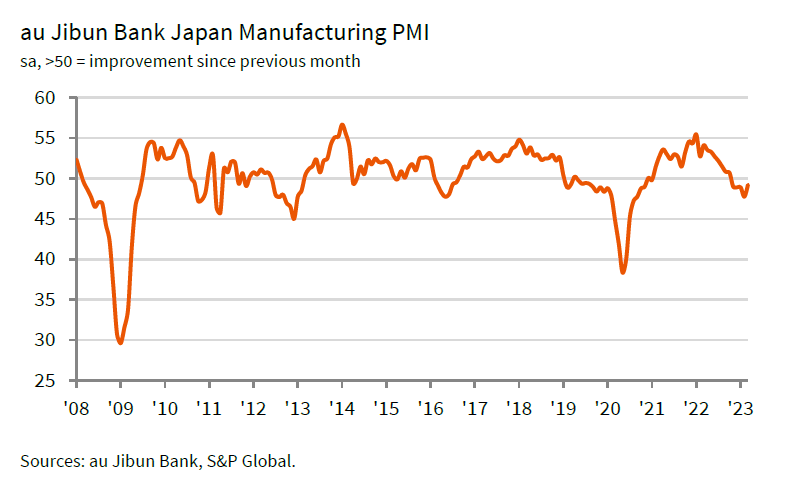
Japan PMI Manufacturing was finalized at 49.2 in March, up from prior month's 47.7.
Economist Usamah Bhatti from S&P Global Market Intelligence highlighted that the Japanese manufacturing sector showed signs of improvement at the end of Q1 2023, despite marking a fifth consecutive contraction.
Output and new orders experienced their softest declines in five months, but subdued market demand persisted in both domestic and international markets.
The lack of new incoming business led to firms preparing for an eventual rise in demand, with backlogs of work falling sharply for the sixth consecutive month. Additionally, manufacturers were increasingly stockpiling finished goods.
While input cost inflation slowed to its lowest rate since August 2021, selling price inflation remained high and accelerated, as Japanese goods producers partially passed on higher cost burdens to clients.
Japan Tankan: Manufacturing deteriorates while non-manufacturing improves
In Q1, Japan's Tankan large manufacturing index dropped for the fifth consecutive quarter, falling from 7 to 1, below the expected 3, and marking the lowest level since December 2020. The large manufacturing outlook also tumbled from 6 to 3, missing the anticipated 4. This decline was attributed to rising raw material and fuel costs, slowing overseas growth, and slumping chip demand.
Conversely, the non-manufacturing index improved for the fourth straight quarter, ticking up from 19 to 20, in line with expectations. The non-manufacturing outlook rose from 11 to 15, although it fell short of the expected 16.
Despite these mixed results, large Japanese firms plan to increase capital expenditure by 3.2% in the fiscal year that began in April, which is lower than the market's forecast for a 4.9% gain. The Tankan survey also revealed that Japanese firms anticipate inflation to reach a record 2.8% a year from now and remain above the BoJ's target for the next three to five years.
GBP/USD And GBP/JPY Aims More Upsides
GBP/USD climbed higher above the 1.2200 resistance zone. GBP/JPY could rise further if there is a clear move above the 165.70 resistance.
Important Takeaways for GBP/USD and GBP/JPY
- The British Pound is moving higher above 1.2300 against the US Dollar.
- There was a break above a major bearish trend line with resistance near 1.2180 on the daily chart of GBP/USD.
- GBP/JPY is showing a lot of bullish signs above the 162.50 support.
- There was a break above a key contracting triangle with resistance near 162.65 on the daily chart.
GBP/USD Technical Analysis
This past week, the British Pound formed a base above the 1.1800 zone against the US Dollar. The GBP/USD pair started a steady increase above the 1.2000 resistance zone.
There was a clear move above the 1.2120 resistance zone and the 50-day simple moving average. The pair even climbed above the 1.2200 resistance. There was a was a break above a major bearish trend line with resistance near 1.2180 on the daily chart of GBP/USD.
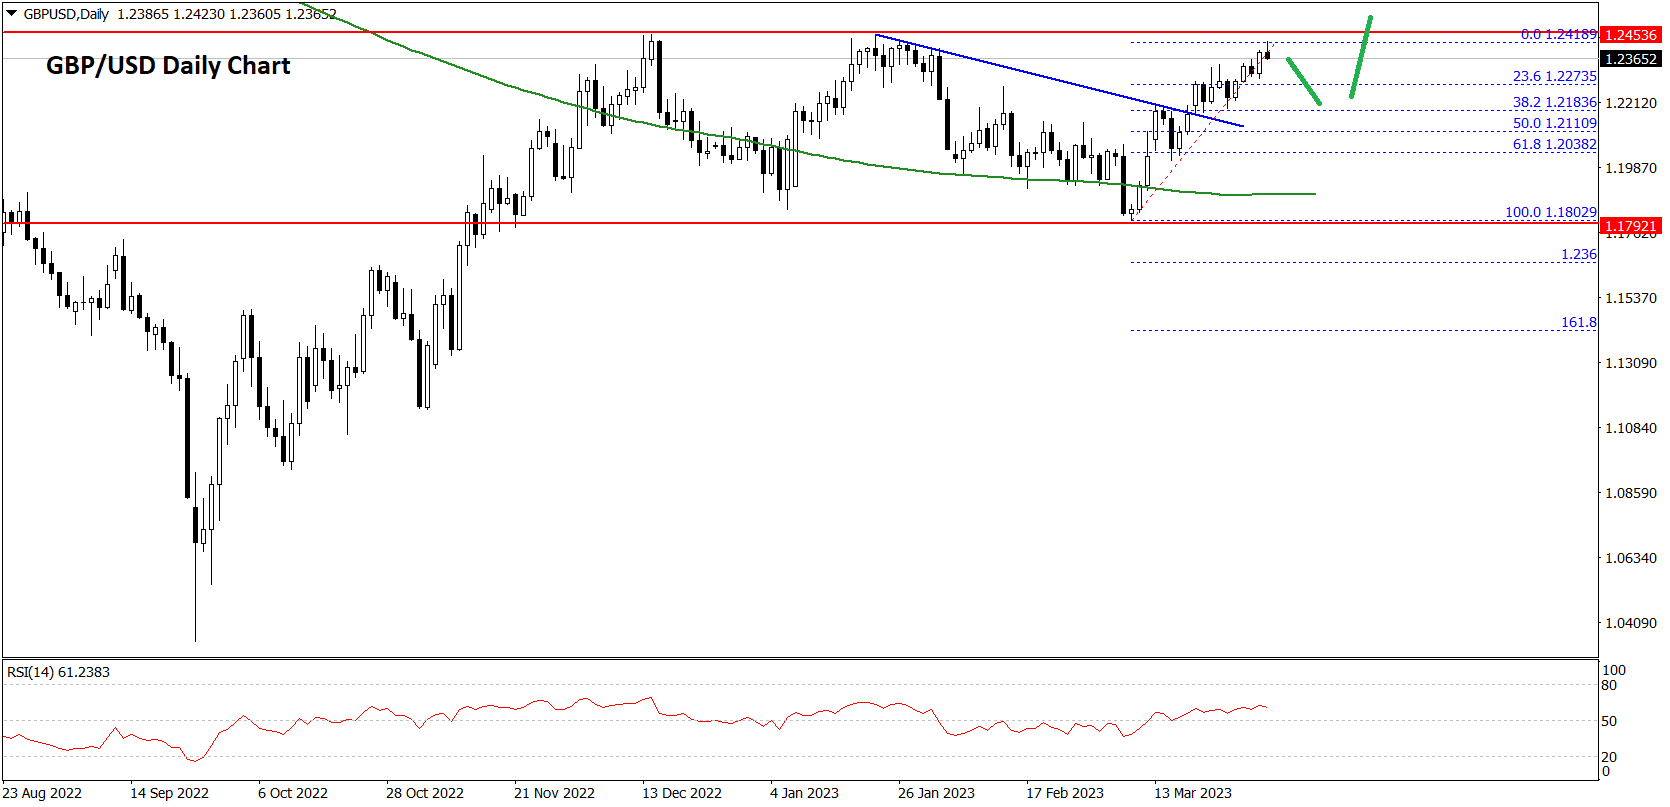
The pair even broke the 1.2350 level. A high is formed near 1.2420 on FXOpen and the pair is now consolidating gains.
An immediate support is near the 1.2180. It is near the 38.2% Fib retracement level of the upward move from the 1.1802 swing low to 1.2418 high. The next major support is near the 1.2120 and 1.2100 levels.
The 50% Fib retracement level of the upward move from the 1.1802 swing low to 1.2418 high is also near the 1.2100 zone. If there is a break below the 1.2100 support, the pair could test the 1.2000 support.
Any more losses might send GBP/USD towards 1.1920. An immediate resistance on the upside is near the 1.2440 level. The next major resistance is near the 1.2500 level, above which the pair could start a steady increase towards 1.2750.
An upside break above 1.2750 might start a fresh increase towards 1.2800. Any more gains might call for a move towards 1.2880 or even 1.2950.
GBP/JPY Technical Analysis
The British Pound started a fresh increase from the 158.50 resistance against the Japanese Yen. The GBP/JPY pair gained pace above the 160.00 resistance zone.
There was a clear move above the 162.20 level and the 50 hourly simple moving average. There was also a break above a key contracting triangle with resistance near 162.65 on the daily chart. There was a move above the 50% Fib retracement level of the downward move from the 172.12 swing high to 155.32 low.
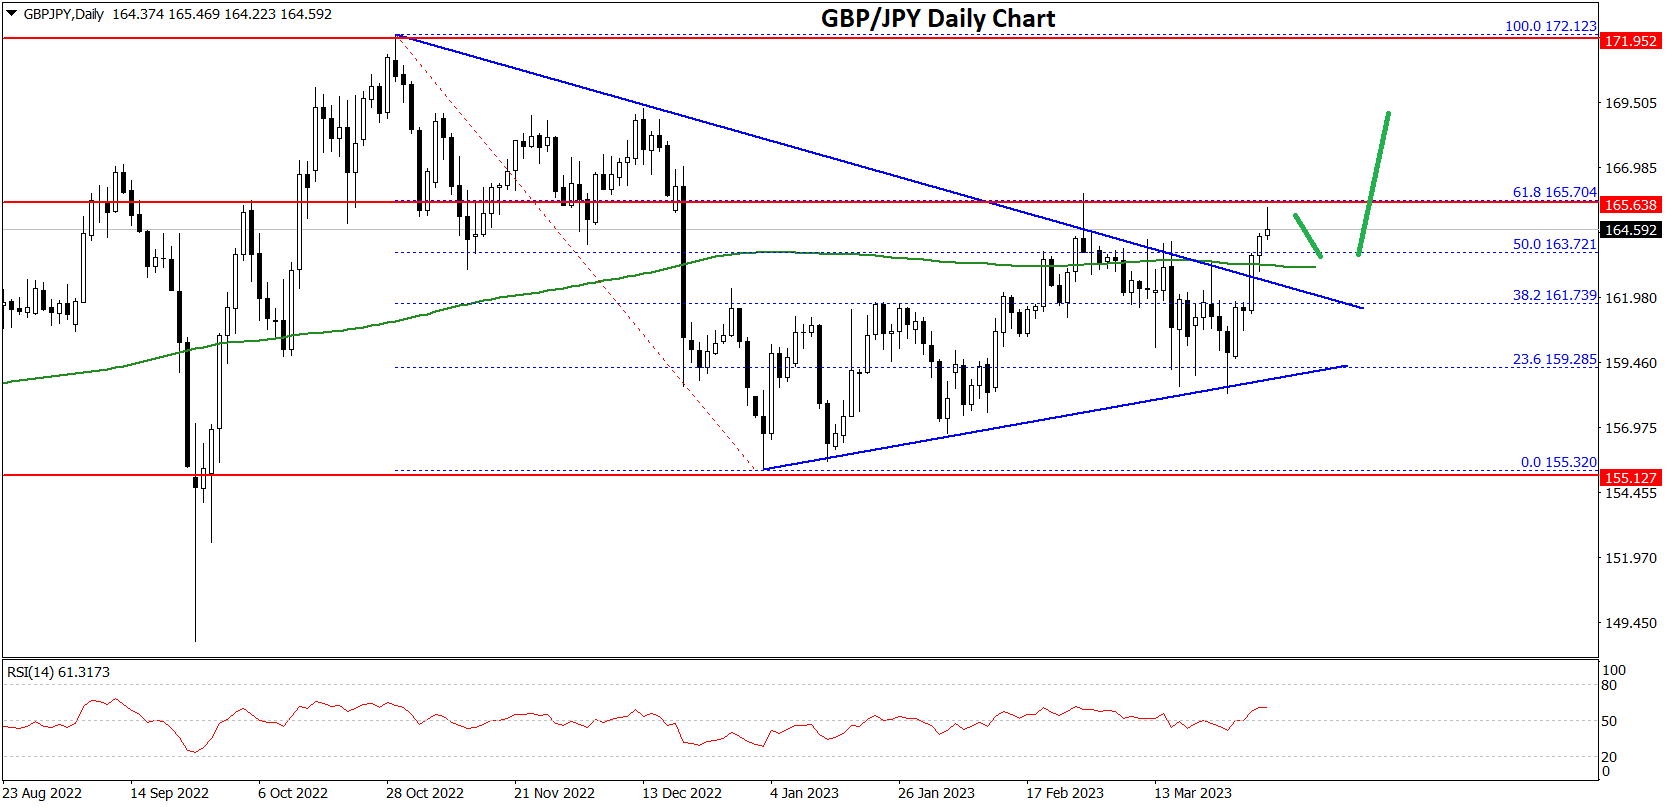
An immediate resistance on the upside is near the 165.70 zone. It is near the 61.8% Fib retracement level of the downward move from the 172.12 swing high to 155.32 low.
The next key resistance could be 167.00. A clear break above the 167.00 resistance could push the pair towards the 168.00 resistance.
If not, the pair might decline below the 163.50 level. On the downside, an initial support is near the 163.20 level. The next major support is near the 162.00. If there is a downside break below the 162.00 support, the pair could decline towards the 160.50 support zone in the coming sessions. Any more losses might call for a test of the 159.20 support zone.
EUR/USD Corrects Lower While Oil Price Extends Rally
Key Highlights
- EUR/USD started a downside correction from the 1.0920 zone.
- It broke a key bullish trend line with support near 1.0850 on the 4-hours chart.
- GBP/USD is also correcting lower below the 1.2300 level.
- The US ISM Manufacturing PMI could decline from 47.7 to 47.5 in March 2023.
EUR/USD Technical Analysis
The Euro gained pace above the 1.0850 resistance zone against the US Dollar. EUR/USD even climbed above 1.0900 before the bears appeared.
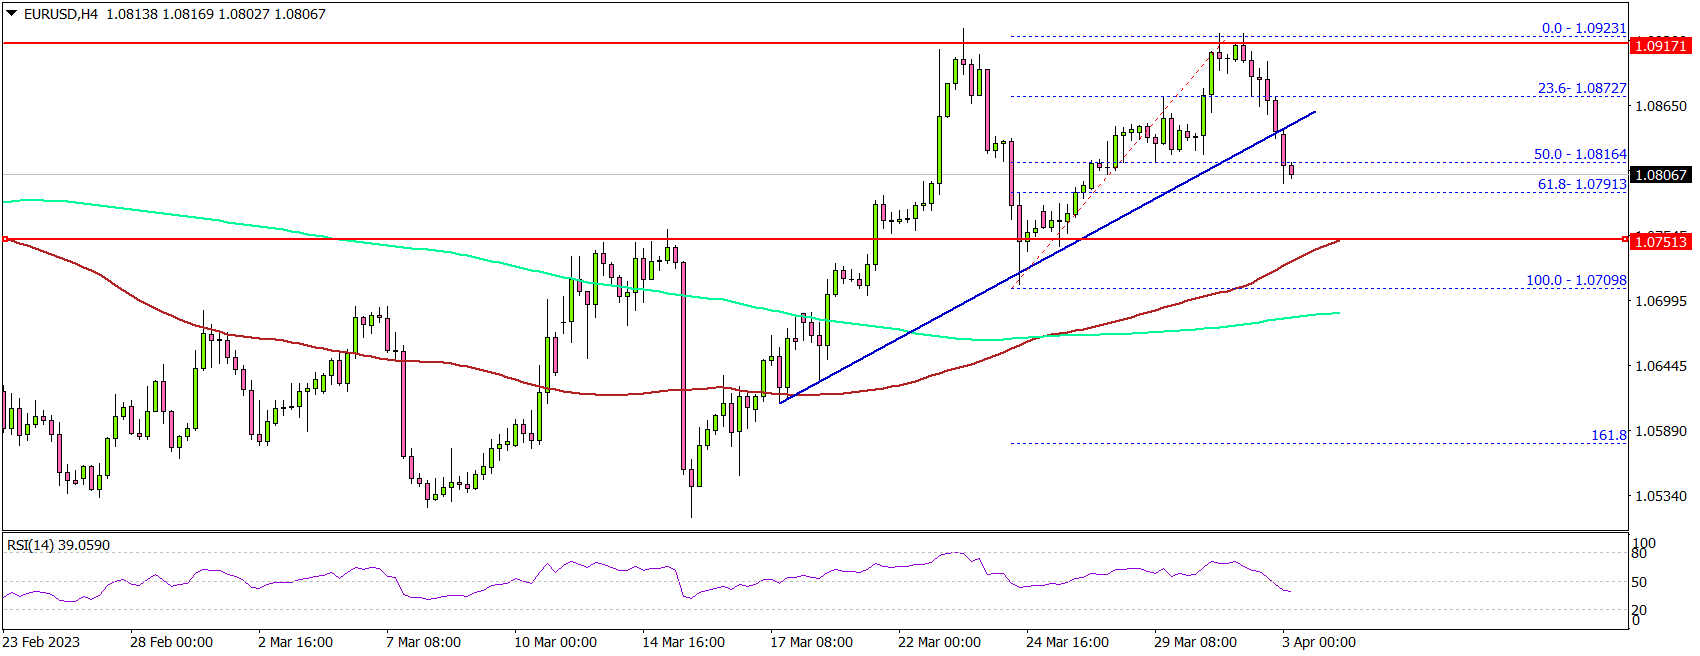
Looking at the 4-hours chart, the pair tested the 1.0920 zone. A high was formed near 1.0922 before the pair started a downside correction. There was a move below the 1.0900 level. Besides, the pair traded below a key bullish trend line with support near 1.0850.
The pair traded below the 50% Fib retracement level of the upward move from the 1.0709 swing low to 1.0923 high. On the downside, an immediate support is near the 1.0780.
The next major support is near the 1.0750 level and the 100 simple moving average (red, 4-hours), below which there is a risk of a move towards the 1.0680 support.
On the upside, the first major resistance is near the 1.0865 level. The next key resistance is near the 1.0900 zone. A clear move above the 1.0900 resistance might send the pair towards the 1.0960 zone. Any more gains might send the pair towards 1.1000.
Looking at oil price, there were more gains above the $80 level and the bulls seem to aim another push towards $85 in the near term.
Economic Releases
- Germany’s Manufacturing PMI for March 2023 - Forecast 44.4, versus 44.4 previous.
- Euro Zone Manufacturing PMI for March 2023 – Forecast 47.1, versus 47.1 previous.
- UK Manufacturing PMI for March 2023 – Forecast 48, versus 48 previous.
- US Manufacturing PMI for March 2023 – Forecast 49.3, versus 49.3 previous.
- US ISM Manufacturing PMI for March 2023 – Forecast 47.5, versus 47.7 previous.
Banking Concerns Subside, Inflation Worries Ease, Dollar Lost Ground
Last week, investors appeared to view the banking crisis as well-contained, pushing it into the rearview mirror. Confidence saw a revival, resulting in significant gains for major global stock indexes. In tandem with the lower-than-anticipated inflation figures from the US, market sentiment underwent a notable shift, paving the way for a fresh start in Q4, with a renewed focus on economic data and interest rate projections..
Yen, Dollar, and Swiss Franc, typically seen as safe-haven currencies, emerged as the weakest performers last week. Their late recoveries on Friday likely indicate month-end adjustments rather than a genuine return to risk aversion. On the other hand, Canadian Dollar was the top performer, benefitting from a surge in oil prices, followed by New Zealand Dollar, British Pound, and Australian Dollar. Euro's performance was mixed but leaned more towards strength.
With no meetings scheduled for Fed or ECB in April at the outset of Q2, the current risk-on trend has room to continue. This ongoing development could further restrain Dollar's rebound. The main question now is whether commodities will switch positions with their European counterparts. It's also important to keep an eye on Bitcoin, Gold, and oil prices, as their movements could confirm trends in stocks and currencies.
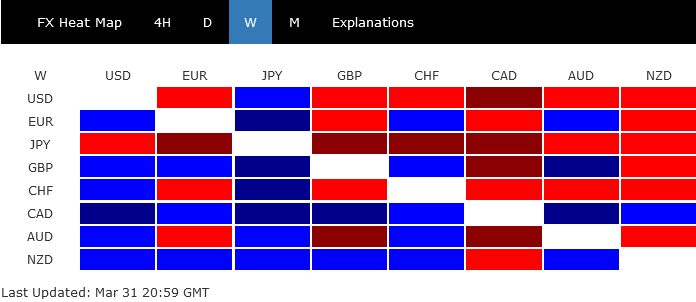
Optimism prevails with banking crisis in rearview mirror
Last week's strong finishes in major global stock indexes signaled an overall positive risk sentiment, as investors appeared to view the recent banking crisis as fully contained. Additionally, a lower-than-expected reading in Fed's preferred inflation gauge confirmed the ongoing disinflation process, suggesting there is less need for the Fed to revert to aggressive rate hikes. Some Fed officials have noted that recent developments could prompt banks to tighten lending standards, which could partially offset the need for additional rate increases.
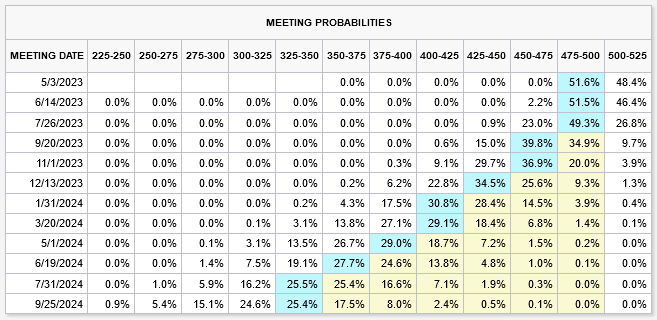
Fed fund futures are pricing in a 50/50 chance of another 25bps hike by Fed in May. But it's crucial to note the changing market expectations for rate path ahead. Currently, there is over a 55% chance of a cut back to 4.50-4.75% in September and over a 63% chance of interest rates returning to 4.25-4.50% by the end of the year.
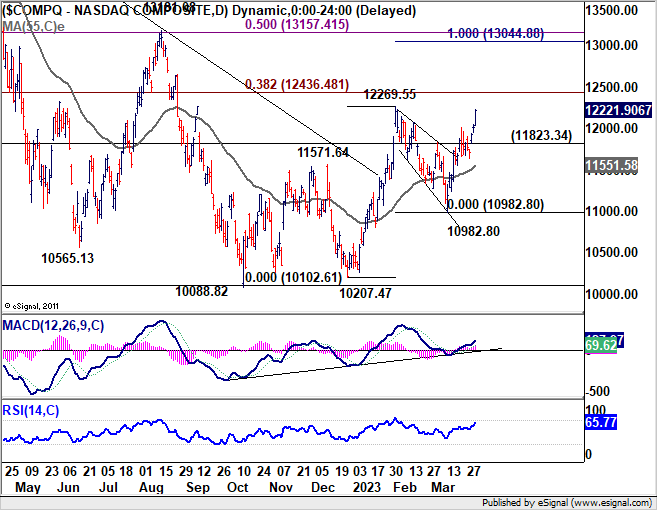
NASDAQ ready for upside breakout, S&P 500 following
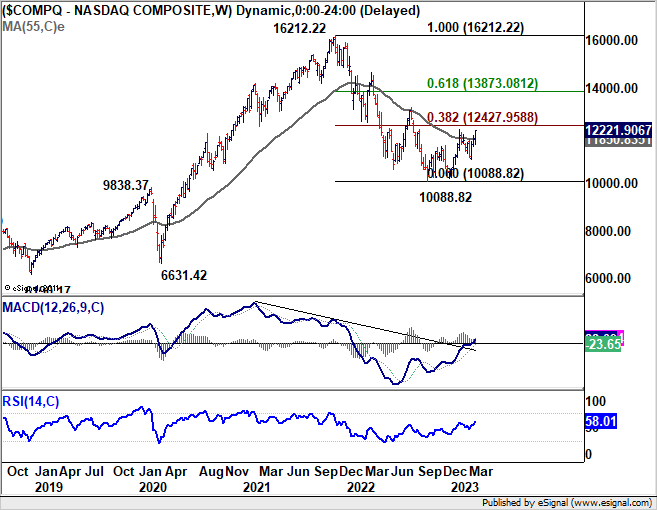
With improved market sentiment, NASDAQ was an outperformer for both March and Q1, up 6.69% and 16.77% respectively. It's indeed the best quarter for the tech-heavy index since 2020. S&P 500 was up 3.51% for the month and 7.03% for the quarter. DOW was a lagger, up only 1.89% for the month and only 0.38% in Q1.
Based on current momentum, NASDAQ should take out 12269.55 resumed very soon to resume the whole rally from 10088.82. 38.2% retracement of 16212.22 to 1088.82 at 12427.95 shouldn't be a big problem for the index. The real test lies in 100% projection of 10207.47 to 12269.55 from 10982.80 at 13044.88. The level is close to 50% retracement at 13157.41. Or to put it simple, around 13k handle. Reaction there would reveal much on whether NASDAQ is reversing whole fall from 16212.22, or it's just in a corrective rebound. But in any case, near term outlook will now stay bullish as long as 11823.34 support holds.
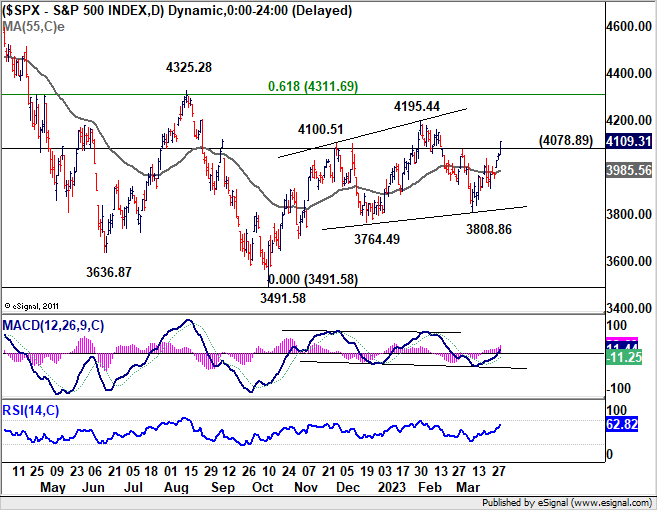
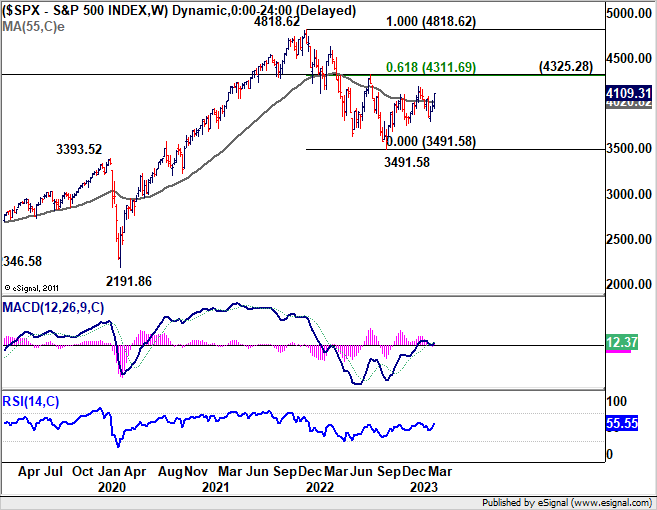
S&P 500's break of 4078.89 resistance last week was also a bullish development. Pull back from 4195.44 should have completed at 3808.86. Further rise is expected as long as 55 day EMA (now at 3985.56) holds. Break of 4195.44 resistance will resume whole rebound from 3491.58 to 61.8% retracement of 4818.62 to 3491.58 at 4311.69, which is close to 4325.58 resistance. Sustained break there will pave the way back to 4818.62 high, even as the second leg of the corrective pattern from there.
DAX reversed all banking crisis losses, Nikkei closed higher in range
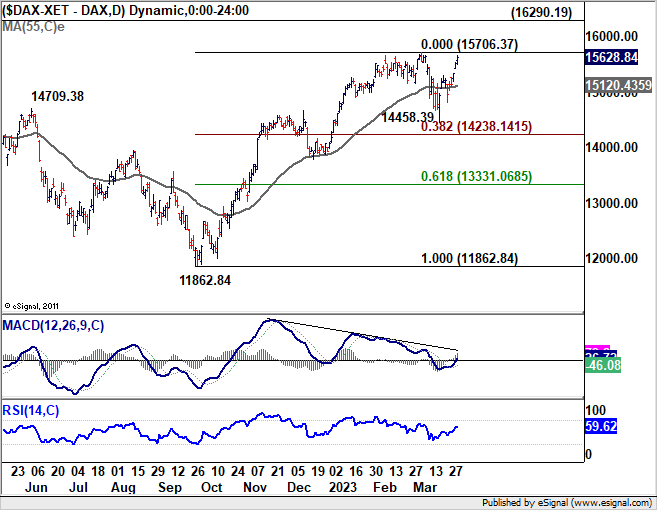
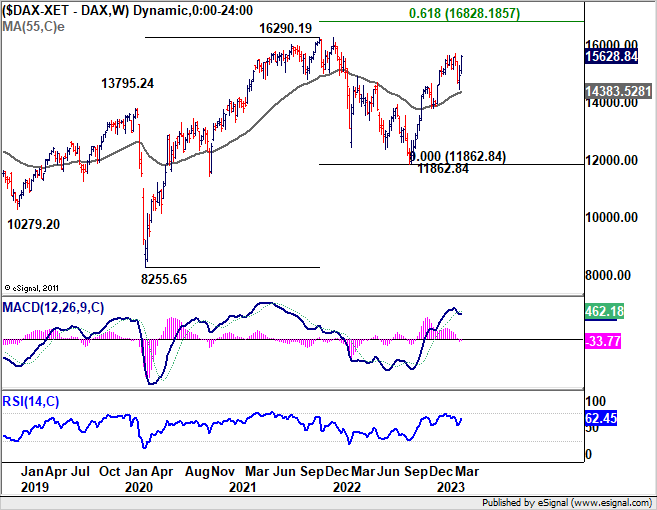
Performance of German DAX was also impressive as it ended the quarter with 12.25% gain with Friday's strong rally. The losses from the banking crisis was totally reversed. Immediate focus is now on 15706.37 resistance in the coming days. Decisive break there will resume the rise from 11862.84 to retest 16290.19 record high.
It should also be noted that the strong support from 55 week EMA (now at 14383.54) was a medium term bullish signal too. The rally might not hit real resistance until meeting 61.8% projection of 8255.65 to 16290.19 form 11862.84 at 16828.18 later in the quarter.
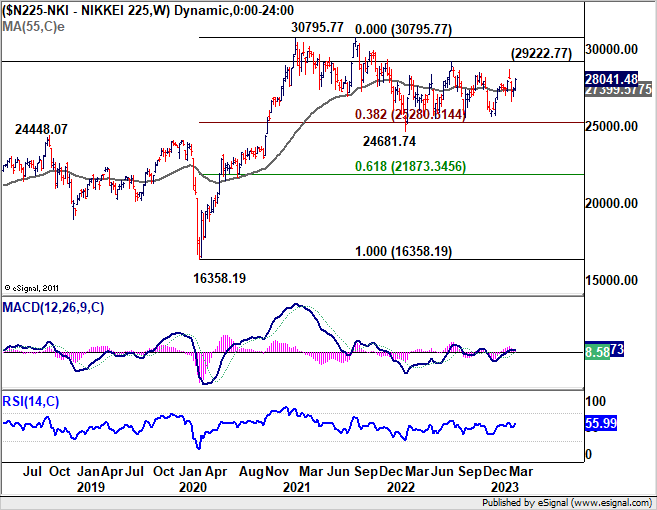
Nikkei's has a strong weekly close, even though it's still stuck in medium term range trading. Overall performance was indeed not bad. With the all market turbulence, it's just extending the sideway pattern that started back in late 2021. Indeed, barring a week of climax selloff to 24681.75, the index managed to defend 38.2% retracement of 16358.19 to 30795.77 at 25280.61 well.
Medium term outlook stays neutral in Nikkei for now, with favor on an upside breakout eventually. Break of 29222.77 could prompt further rise to retest 30795.77 high first.
Dollar index gyrated lower, but range trading is the base case
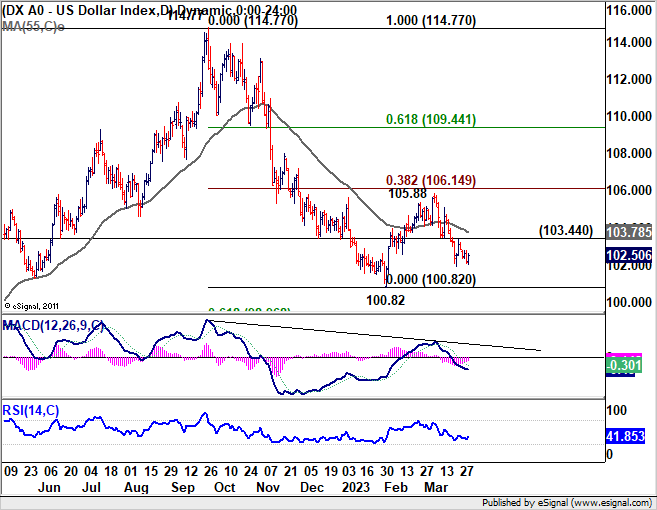
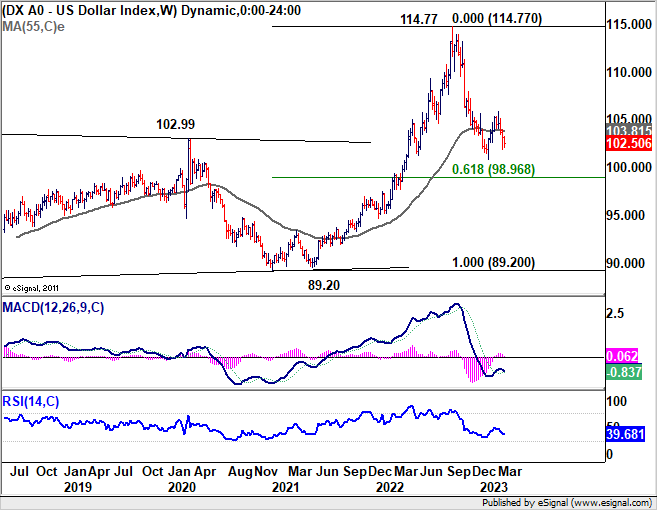
Dollar index gyrated lower last week after failing to break through 103.44 support turned resistance. The question remains on whether price action from 100.82 are developing into a three wave corrective pattern. Hence, even in case of deeper decline in the DXY, attention should be paid on reversal sign is it approaches 100.82 low. On the other hand, break of 103.44 will argue that the third leg of the pattern has started for 38.2% retracement of 114.77 to 100.82 at 106.14. After all, the favored case is for range trading to continue between 100.82 to 106.14 for a while.
Bitcoin, Gold and oil price are worth attention in April
Looking ahead in April, the developments in Bitcoin, Gold and oil prices are worth much attention.
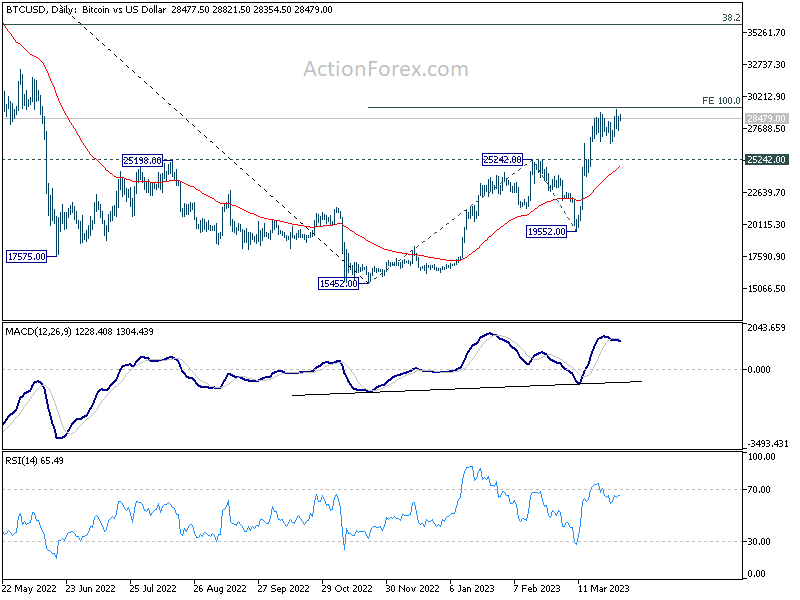
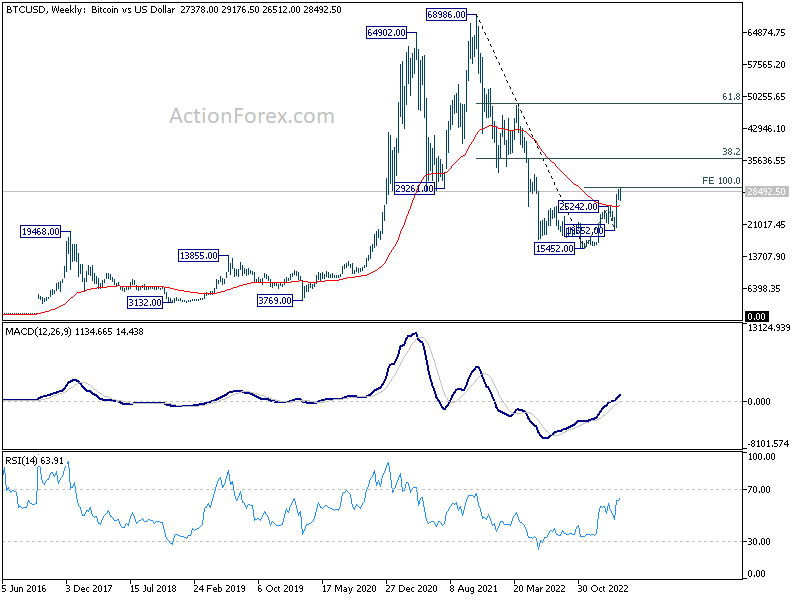
Bitcoin would continued to be seen as a gauge for overall risk sentiment, in particular as a proxy to NASDAQ. Rally from 15452 haled ahead of 100% projection of 15452. to 25242 from 19552 at 29342. Retreat is contained well above 25242 resistance turned support so far, keeping outlook bullish. Firm break of 29342, and probably more importantly the 30k handle, could prompt upside acceleration. That would bring further rise to 38.2% retracement of 68986 to 15452 at 35901 at least. If realized, NASDQ should also march towards 13k handle in tandem.
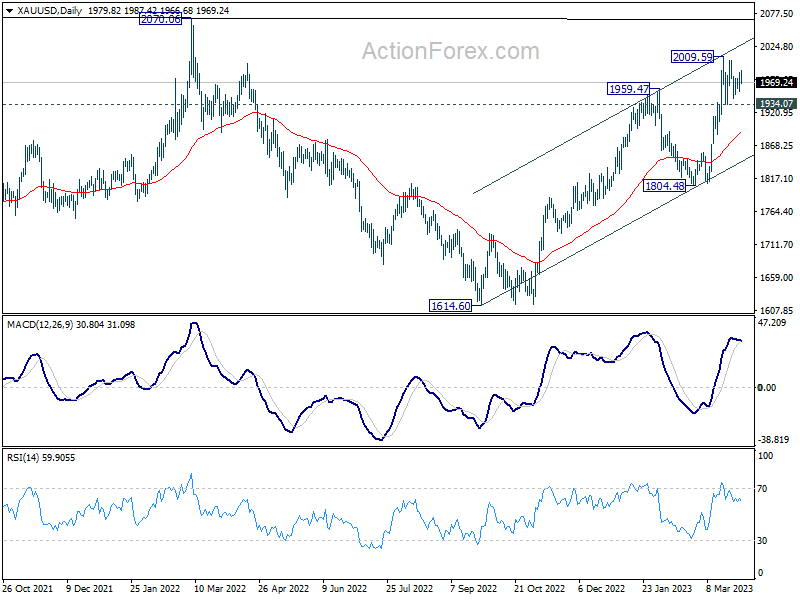
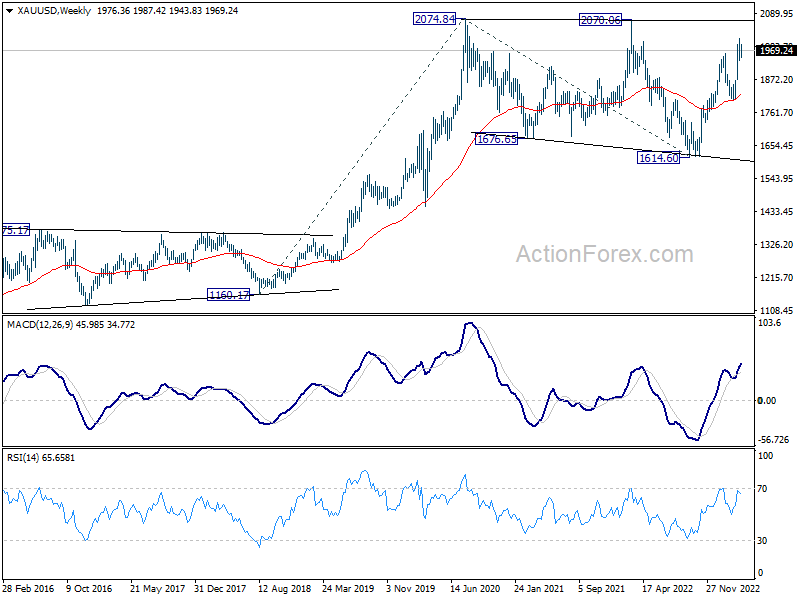
Gold will be used to gauge intensity if Dollar is back in selloff mode. So far, price actions in Gold price 2009.59 are corrective looking, keeping near term outlook bullish. Break of 2009.59 could extend the rise from 1614.60 to retest 2070.06/2074.84 key resistance zone. Rejection by this resistance zone, if happens, should come with DXY bouncing off 100.82 support. Firm break of 2074.84 in Gold could have DXY breaking through 100.82 low together. Meanwhile, break of 1934.07 support in Gold could also have DXY breaking through 103.44 resistance for a stronger rebound.
WTI crude oil extended the rebound from 64.19 last week on tightening supplies, as well as Fed expectations. With bullish convergence condition in daily MACD, there is reason for 64.19 to be a medium term bottom. But it's way too early to call for a bullish trend reversal, with upside capped well below 80.82, even though further rise is in favor towards this resistance level for the near term. So, while the support the Canadian Dollar could continue, it might not last long until 80.82 is cleanly taken out. In that case, traditional stocks in DOW could also undergo a revival too.
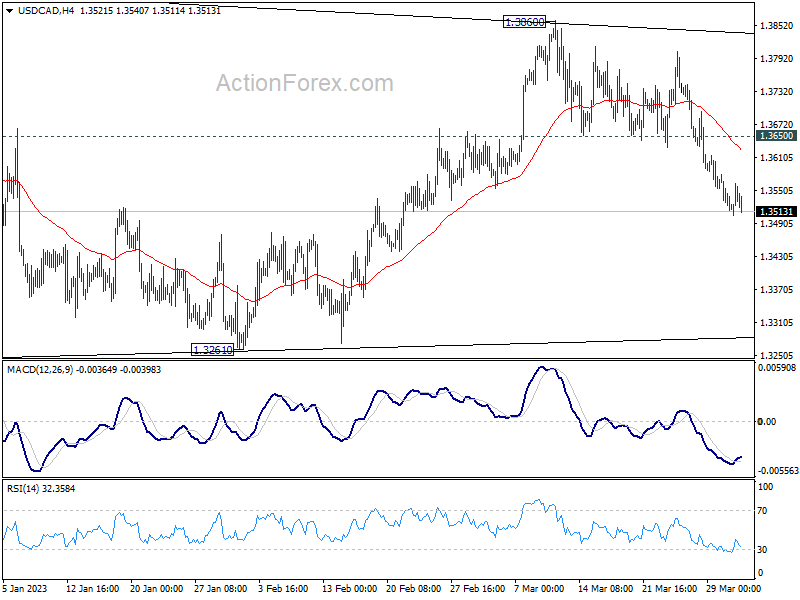
USD/CAD Weekly Outlook
USD/CAD's decline from 1.3860 last week suggests that corrective pattern from 1.3976 is extending with another falling leg. Initial bias remains on the downside this week for 1.3224/61 support zone. But strong support should be seen around there to bring rebound. Still, break of 1.3650 support turned is needed to indicate completion of the decline first. Or further fall will remain in favor in case of recovery.
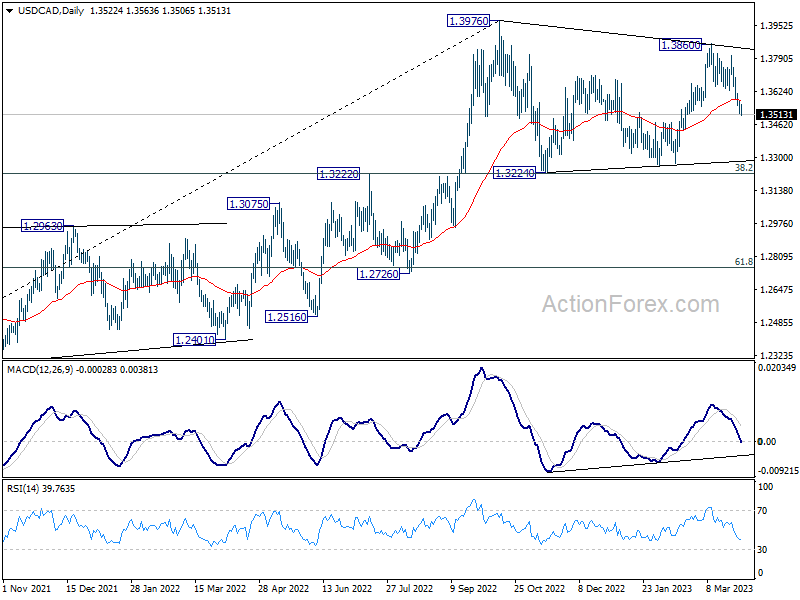
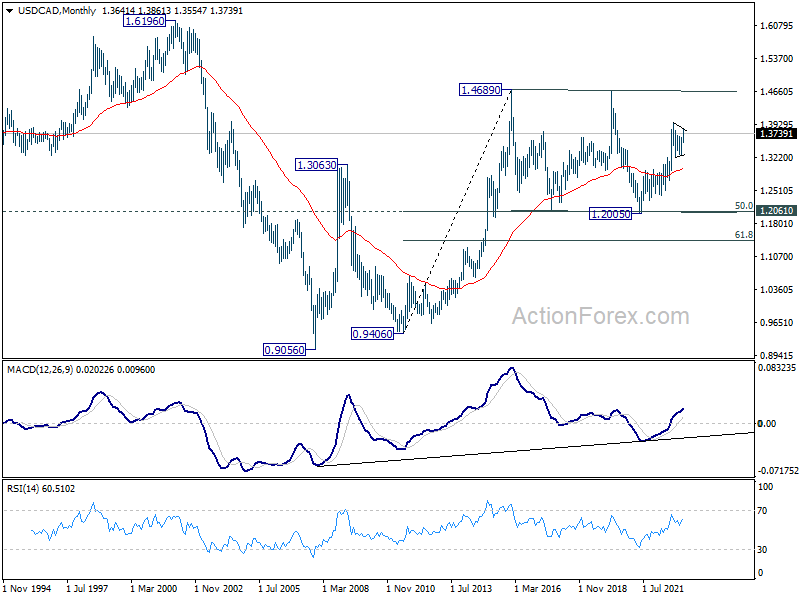
In the bigger picture, the up trend from 1.2005 (2021 low) is still in progress. Break of 1.3976 will confirm resumption and target 61.8% projection of 1.2401 to 1.3976 from 1.3261 at 1.4234. Firm break there will pave the way to long term resistance zone at 1.4667/89 (2016, 2020 highs). On the downside, sustained break of 55 week EMA (now at 1.3282) is needed to confirm medium term topping. Otherwise, outlook will remain bullish even in case of deep pull back.
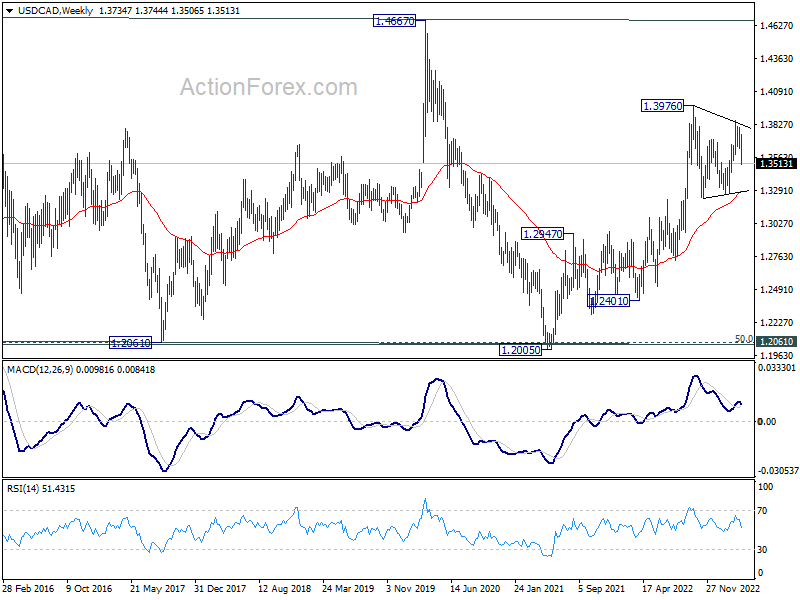
In the longer term picture, price actions from 1.4689 (2016 high) are seen as a consolidation pattern only, which might have completed at 1.2005. That is, up trend from 0.9506 (2007 low) is expected to resume at a later stage. This will remain the favored case as 55 month EMA (now at 1.3003) holds.
EUR/USD Weekly Outlook
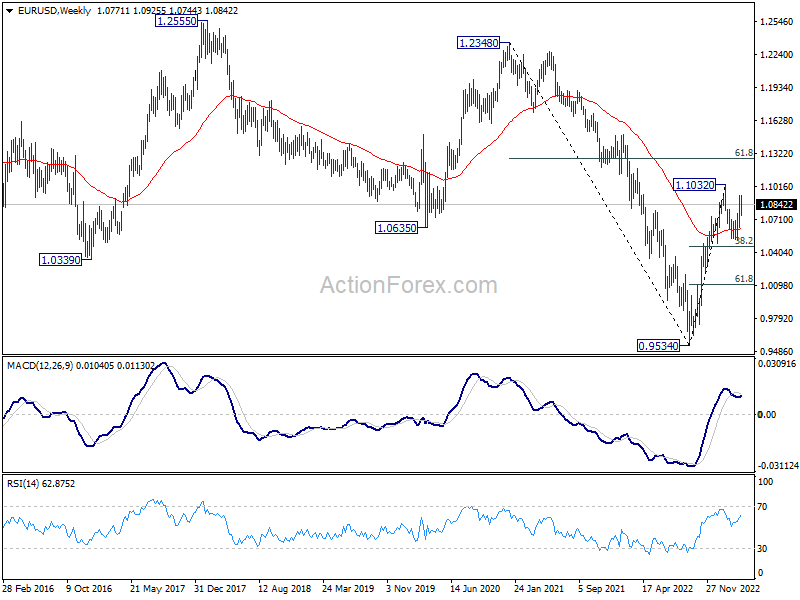
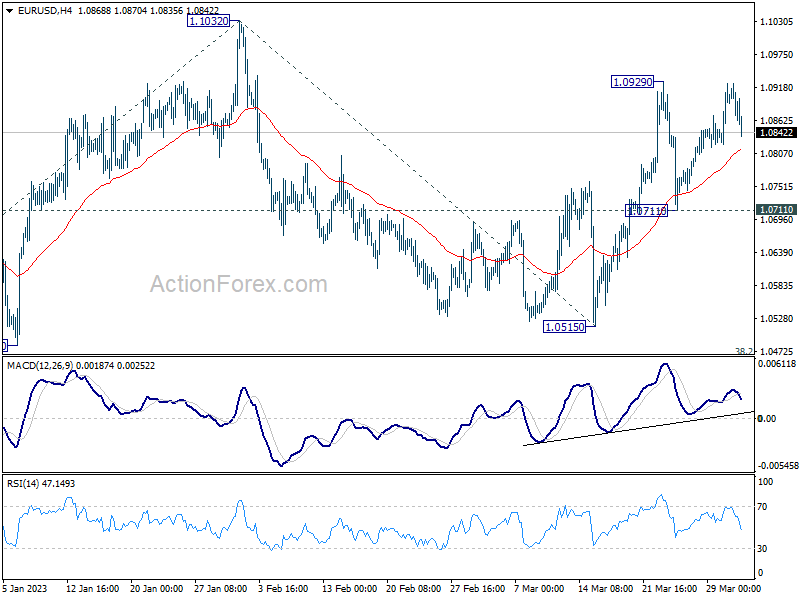
EUR/USD stayed in range below 1.0929 last week despite attempt to break through the resistance. Initial bias is turned neutral this week first. On the upside, break of 1.0929 will resume the rally from 1.0515 to retest 1.1032 high. Decisive break there will resume larger up trend from 0.9534 to 1.1273 fibonacci level next. On the downside, though, break of 1.0711 will turn bias to the downside to extend the corrective pattern from 1.1032 with another decline.
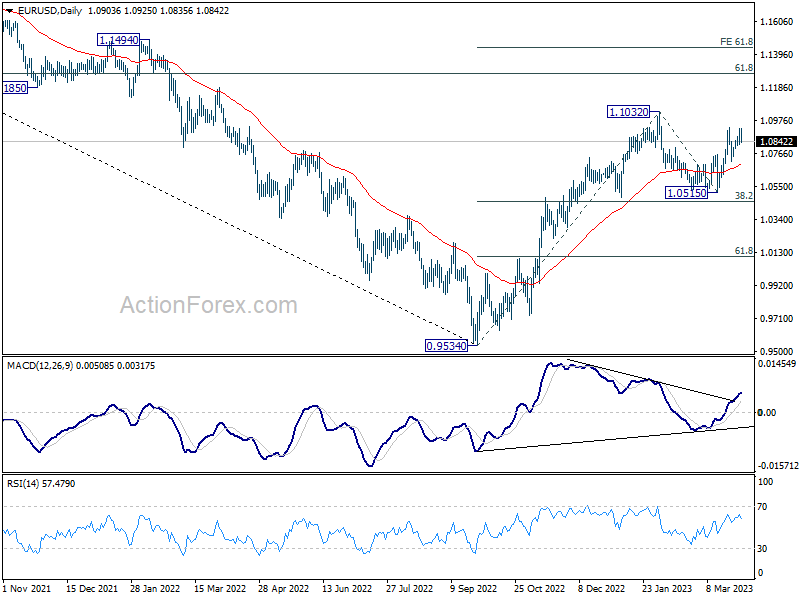
In the bigger picture, rise from 0.9534 (2022 low) is in progress with 38.2% retracement of 0.9534 to 1.1032 at 1.0460 intact. The strong support from 55 week EMA (now at 1.0625) was also a medium term bullish sign. Next target is 61.8% retracement of 1.2348 (2021 high) to 0.9534 at 1.1273. Sustained break there will solidify the case of bullish trend reversal and target 1.2348 resistance next (2021 high).
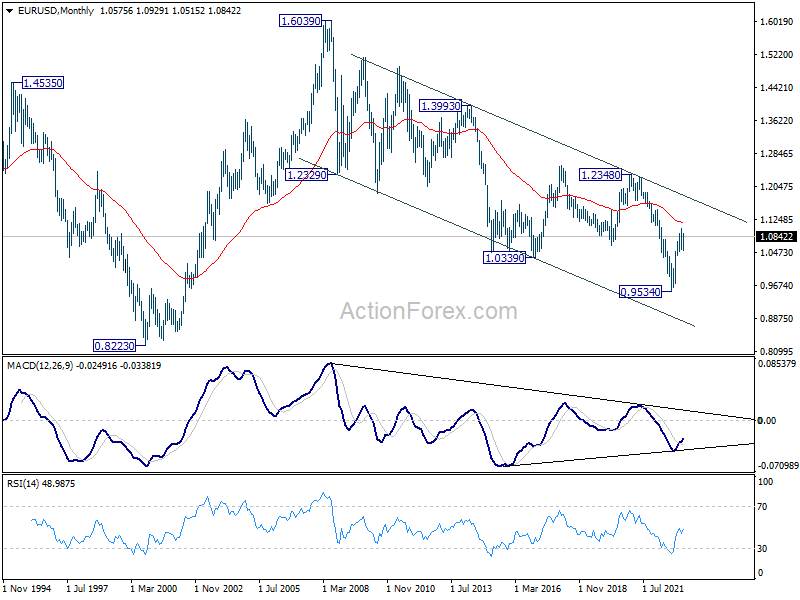
In the long term picture, while it's too early to call for long term trend reversal at this point, the strong break of 1.0635 support turned resistance (2020 low) should at least turn outlook neutral. Focus will turn to 55 month EMA (now at 1.1166). Rejection by this EMA will revive long term bearishness.