Sample Category Title
AUD/USD Mid-Day Report
Daily Pivots: (S1) 0.6657; (P) 0.6698; (R1) 0.6725; More...
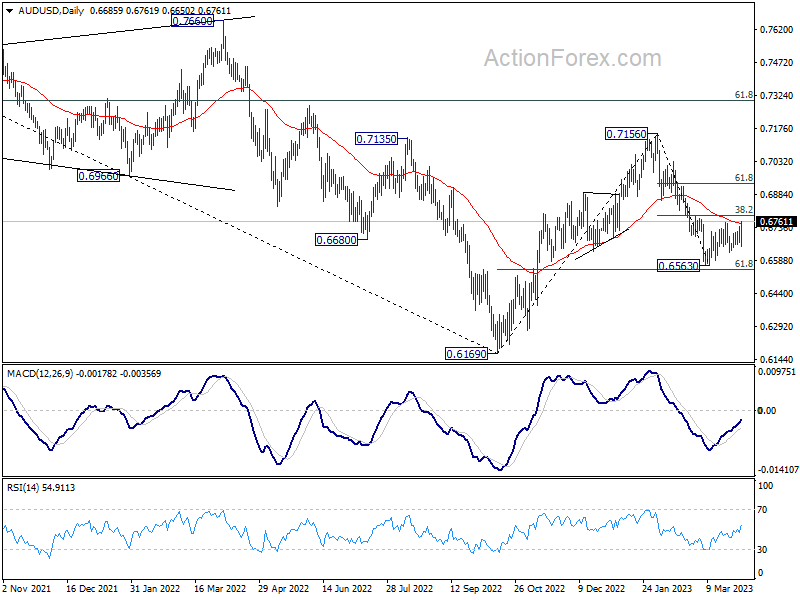
AUD/USD's breach of 0.6758 suggests that rebound from 0.6563 short term bottom is resuming. Intraday bias is back on the upside for 38.2% retracement of 0.7156 to 0.6563 at 0.6790. Break will target 61.8% retracement at 0.6929. However, break of 0.6650 support will turn bias back to the downside for 0.6563 low again.
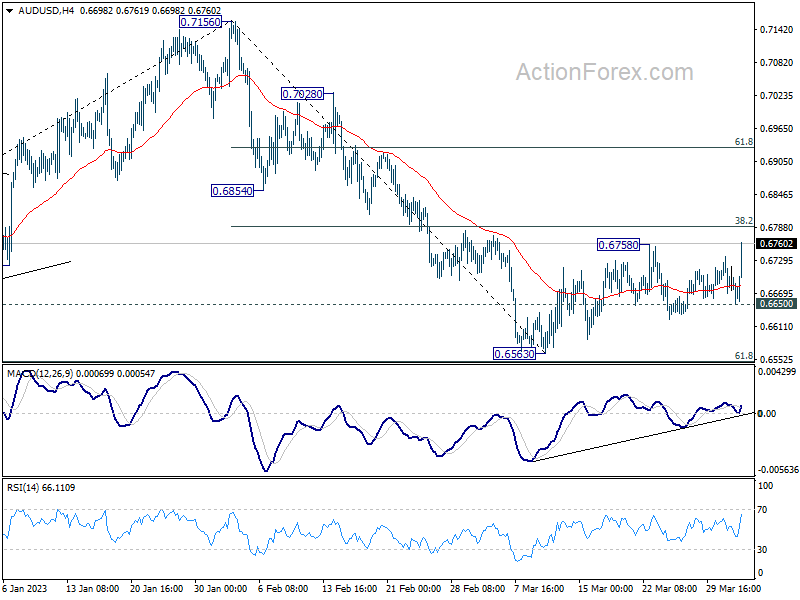
In the bigger picture, as long as 61.8% retracement of 0.6169 to 0.7156 at 0.6546 holds, the decline from 0.7156 is seen as a correction to rally from 0.6169 (2022 low) only. Another rise should still be seen through 0.7156 at a later stage. However, sustained break of 0.6546 will raise the chance of long term down trend resumption through 0.6169 low.
Australian Dollar Rallies Amid RBA Rate Decision Speculations
Australian Dollar surges as markets approach the US session, with investors eyeing RBA rate decision tomorrow. Although it seems reasonable to expect a pause in interest rate hikes, some financial institutions, such as ANZ and NAB, predict a 25bps increase. The Aussie's rally could be driven by speculation of a hawkish surprise, but the situation could reverse quickly if RBA doesn't disappoint.
In the currency markets, Canadian Dollar is performing strongly, while WTI oil continues to flirt with the 80 mark due to OPEC's unexpected extra production cut. Conversely, Dollar, Yen, and Swiss Franc face pressure, and Euro and Sterling are mixed for the time being.
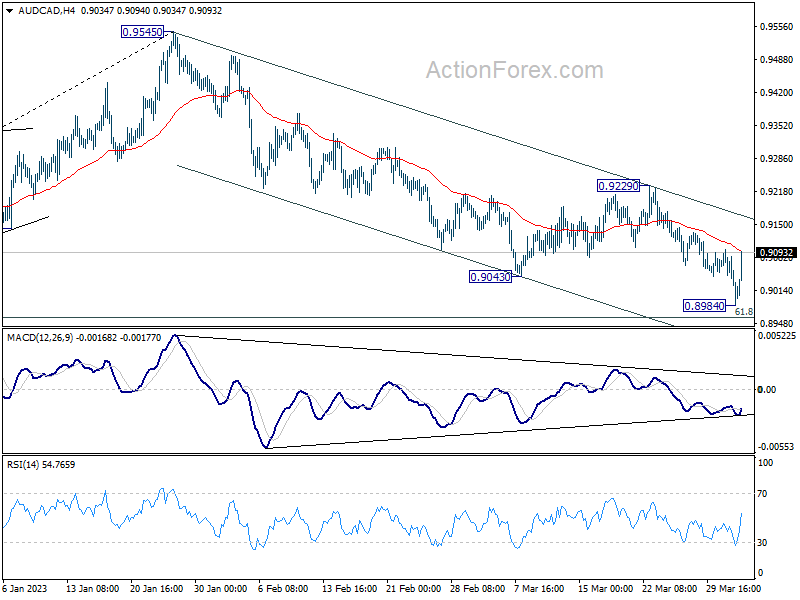
From a technical standpoint, AUD/CAD's robust rebound may signify a short-term bottom at 0.8984, just before the 61.8% retracement of 0.8596 to 0.9545 at 0.8959. In the near term, the rebound is likely to continue. However, a decisive break of the 0.9229 resistance is required to confirm the end of the downtrend from 0.9545 and a bullish reversal. If this fails to occur, a bearish outlook persists for a decline beyond 0.8984 at a later stage.
In Europe, at the time of writing, FTSE is up 0.60%. DAX is down -0.10%. CAC is up 0.36%. Germany 10-year yield is up 0.0277 at 2.321. Earlier in Asia, Nikkei rose 0.52%. Hong Kong HSI rose 0.04%. China Shanghai SSE rose 0.72%. Singapore Strait Times rose 0.68%. Japan 10-year JGB yield rose 0.0409 to 0.371.
UK PMI manufacturing finalized at 47.9, fell back into contraction
UK PMI Manufacturing was finalized at 47.9 in March, down from February's 7-month of 49.3. The index has stayed below the neutral 50 mark for eight successive months.
Rob Dobson, Director at S&P Global Market Intelligence, highlighted that UK manufacturing production "fell back into contraction" at the end of the first quarter due to subdued market conditions. While total new orders saw a slight increase after a nine-month contraction, order book levels remain low. New export order declines continue to impact demand, despite a modest recovery in the domestic market.
However, Dobson pointed to positive developments in pricing and supply during March. Input price inflation reached its lowest level since June 2020, and although selling prices decelerated, they remained higher than input costs, offering some relief for manufacturers' margins. Supply chains continued to recover, with March witnessing the greatest improvement in average vendor lead times in the survey's 31-year history. Dobson noted that this development "should hopefully filter through to further cost reductions and lessen the disruption to production workflows in the coming months."
Eurozone PMI manufacturing finalized at 47.3, remains in troubled waters
Eurozone PMI Manufacturing was finalized at 47.3 in March, down from February's 48.5, a 4-month low. Looking at some member states, Greece (52.8, 10-month high) and Spain (51.3, 9-month high) improved. Others deteriorated including Italy (51.1, 2-month low), Ireland (49.7, 3-month low), France (47.3, 5-month low), the Netherlands (46.4, 4-month low), Germany (44.7, 34-month low), and Austria (44.7, 34-month low).
Chris Williamson, Chief Business Economist at S&P Global Market Intelligence, highlighted that Eurozone manufacturing "remains in troubled waters" as factories report an eleventh consecutive month of falling demand due to factors such as surging living costs, tighter monetary policy, inventory destocking, and low customer confidence.
He also pointed out that the lack of demand has shifted pricing power from sellers to buyers, and lower energy prices have helped reduce costs. As a result, "prices paid for inputs by factories are now falling sharply on average," and slower increases in selling prices should eventually lead to lower consumer prices for goods.
Swiss CPI slowed to 2.9% yoy in Mar, core CPI down to 2.2% yoy
Swiss CPI rose 0.2% mom in March, below expectation of 0.4% mom. Core CPI (excluding fresh and seasonal products, energy and fuel) rose 0.2% mom. Domestic products prices dropped -0.1% mom. Imported products prices rose 0.9% mom.
Compared with the same month of the previous year, CPI slowed from 3.4% yoy to 2.9% yoy, below expectation of 3.2% yoy. Core CPI slowed from 2.4% yoy to 2.2% yoy. Domestic products prices slowed from 2.9% yoy to 2.7% yoy. Imported products prices slowed from 4.9% yoy to 3.8% yoy.
Japan Tankan: Manufacturing deteriorates while non-manufacturing improves
In Q1, Japan's Tankan large manufacturing index dropped for the fifth consecutive quarter, falling from 7 to 1, below the expected 3, and marking the lowest level since December 2020. The large manufacturing outlook also tumbled from 6 to 3, missing the anticipated 4. This decline was attributed to rising raw material and fuel costs, slowing overseas growth, and slumping chip demand.
Conversely, the non-manufacturing index improved for the fourth straight quarter, ticking up from 19 to 20, in line with expectations. The non-manufacturing outlook rose from 11 to 15, although it fell short of the expected 16.
Despite these mixed results, large Japanese firms plan to increase capital expenditure by 3.2% in the fiscal year that began in April, which is lower than the market's forecast for a 4.9% gain. The Tankan survey also revealed that Japanese firms anticipate inflation to reach a record 2.8% a year from now and remain above the BoJ's target for the next three to five years.
Japan PMI manufacturing finalized at 49.2, signs of improvement at the end of Q1
Japan PMI Manufacturing was finalized at 49.2 in March, up from prior month's 47.7.
Economist Usamah Bhatti from S&P Global Market Intelligence highlighted that the Japanese manufacturing sector showed signs of improvement at the end of Q1 2023, despite marking a fifth consecutive contraction.
Output and new orders experienced their softest declines in five months, but subdued market demand persisted in both domestic and international markets.
The lack of new incoming business led to firms preparing for an eventual rise in demand, with backlogs of work falling sharply for the sixth consecutive month. Additionally, manufacturers were increasingly stockpiling finished goods.
While input cost inflation slowed to its lowest rate since August 2021, selling price inflation remained high and accelerated, as Japanese goods producers partially passed on higher cost burdens to clients.
China Caixin PMI manufacturing dropped to 50, slowdown of recovery
China Caixin PMI Manufacturing dropped from 51.6 to 50.0 in March, below expectation of 51.7. It signalled stable business conditions at the end of the first quarter.
Wang Zhe, Senior Economist at Caixin Insight Group said: "In a nutshell, the economy saw a marginal slowdown of recovery in March as the expansion in both manufacturing supply and demand significantly weakened from the previous month.
"Overseas demand dragged, employment worsened, inventories dropped slightly, prices remained largely stable, logistics was gradually restored to normal, and businesses were still highly confident in the economic outlook."
AUD/USD Mid-Day Report
Daily Pivots: (S1) 0.6657; (P) 0.6698; (R1) 0.6725; More...
AUD/USD's breach of 0.6758 suggests that rebound from 0.6563 short term bottom is resuming. Intraday bias is back on the upside for 38.2% retracement of 0.7156 to 0.6563 at 0.6790. Break will target 61.8% retracement at 0.6929. However, break of 0.6650 support will turn bias back to the downside for 0.6563 low again.
In the bigger picture, as long as 61.8% retracement of 0.6169 to 0.7156 at 0.6546 holds, the decline from 0.7156 is seen as a correction to rally from 0.6169 (2022 low) only. Another rise should still be seen through 0.7156 at a later stage. However, sustained break of 0.6546 will raise the chance of long term down trend resumption through 0.6169 low.
Economic Indicators Update
| GMT | Ccy | Events | Actual | Forecast | Previous | Revised |
|---|---|---|---|---|---|---|
| 23:50 | JPY | Tankan Large Manufacturing Outlook Q1 | 3 | 4 | 6 | |
| 23:50 | JPY | Tankan Large Manufacturing Index Q1 | 1 | 3 | 7 | |
| 23:50 | JPY | Tankan Non - Manufacturing Outlook Q1 | 15 | 16 | 11 | |
| 23:50 | JPY | Tankan Non - Manufacturing Index Q1 | 20 | 20 | 19 | |
| 23:50 | JPY | Tankan Large All Industry Capex Q1 | 3.20% | 9.90% | 19.20% | |
| 00:30 | JPY | Manufacturing PMI Mar F | 49.2 | 48.6 | 48.6 | |
| 01:00 | AUD | TD Securities Inflation M/M Mar | 0.30% | 0.40% | ||
| 01:30 | AUD | Building Permits M/M Feb | 4.00% | 10.20% | -27.60% | -27.10% |
| 01:45 | CNY | Caixin Manufacturing PMI Mar | 50 | 51.7 | 51.6 | |
| 06:30 | CHF | CPI M/M Mar | 0.20% | 0.40% | 0.70% | |
| 06:30 | CHF | CPI Y/Y Mar | 2.90% | 3.20% | 3.40% | |
| 07:30 | CHF | SVME PMI Mar | 47 | 48.9 | 48.9 | |
| 07:45 | EUR | Italy Manufacturing PMI Mar | 51.1 | 51 | 52 | |
| 07:50 | EUR | France Manufacturing PMI Mar F | 47.3 | 47.7 | 47.7 | |
| 07:55 | EUR | Germany Manufacturing PMI Mar F | 44.7 | 44.4 | 44.4 | |
| 08:00 | EUR | Eurozone Manufacturing PMI Mar F | 47.3 | 47.1 | 47.1 | |
| 08:30 | GBP | Manufacturing PMI Mar F | 47.9 | 48 | 48 | |
| 13:30 | CAD | Manufacturing PMI Mar | 52.4 | |||
| 13:45 | USD | Manufacturing PMI Mar F | 49.3 | 49.3 | ||
| 14:00 | USD | ISM Manufacturing PMI Mar | 47.5 | 47.7 | ||
| 14:00 | USD | ISM Manufacturing Prices Paid Mar | 50 | 51.3 | ||
| 14:00 | USD | ISM Manufacturing Employment Index Mar | 49.1 | |||
| 14:00 | USD | Construction Spending M/M Feb | 0.00% | -0.10% | ||
| 14:30 | CAD | BoC Business Outlook Survey |
AUD/USD – Aussie on the Move, RBA Expected to Pause Rates
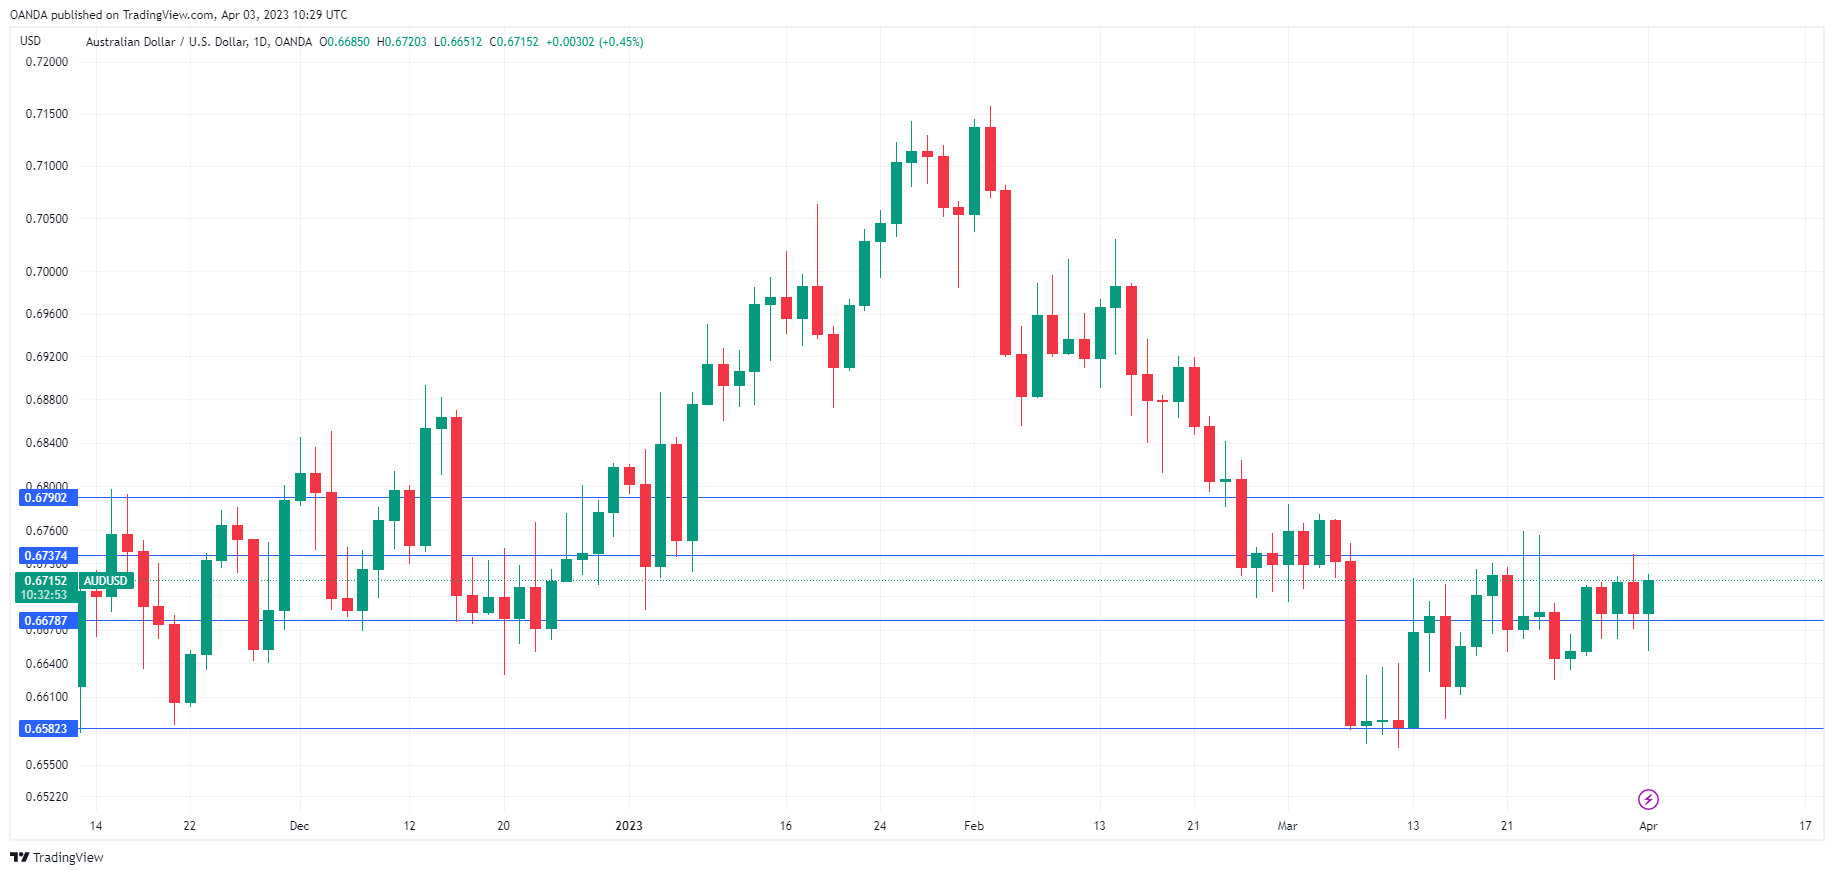
The Australian dollar has edged higher at the start of the week. In the European session, AUD/USD is trading at 0.6715, up 0.45%. The RBA meets on Tuesday (Australia time) and is expected to pause rates. The US releases ISM Manufacturing PMI, which is expected to record another decline.
RBA likely to pause rate hikes
The RBA has aggressively tightened interest rates in the current cycle, raising rates 10 straight times. The fight against inflation continues but there has been some improvement. February CPI fell sharply to 6.8%, vs. 7.4% prior and 7.1% anticipated. Inflation is more than triple the RBA target, but the sharp rise in rates has dampened economic activity and further hikes could jeopardize a soft landing. The RBA is widely expected to stay on the sidelines, with the market pricing in a pause at 86%.
Governor Lowe has said that in addition to inflation, employment and consumer spending data would play a key factor in the RBA’s decision. The labour market remains tight, but retail sales hit the breaks in February and slowed to just 0.2%, down from 1.8% in January and just above the consensus estimate of 0.1%. The weak retail sales data supports the RBA taking a breather.
The banking crisis, which roiled global financial markets, raised fears of a financial meltdown. Although the contagion appears to have been contained, central banks are having to think twice about raising rates in an uncertain economic landscape, and if the RBA does pause, it could use the banking crisis as further ammunition in defending its decision.
US ISM Manufacturing PMI expected to decline
We’re seeing a decline in manufacturing across the globe as demand remains weak. The Russian invasion of Ukraine and China’s Covid-zero policy interrupted supply chains and dampened demand, and manufacturing is yet to recover even though China has made an about-face and relaxed its Covid regulations.
The US is no exception to this disturbing global trend. ISM Manufacturing PMI has been in decline for four straight months, with readings below the 50 threshold, which separates expansion from contraction. The estimate stands at 47.5, a bit lower than the 47.7 reading in January.
AUD/USD Technical
- AUD/USD is putting pressure on resistance at 0.6737. Above, there is resistance at 0.6790
- There is support at 0.6678 and 0.6582
Dollar Index: Dollar’s Recovery Likely to be Limited
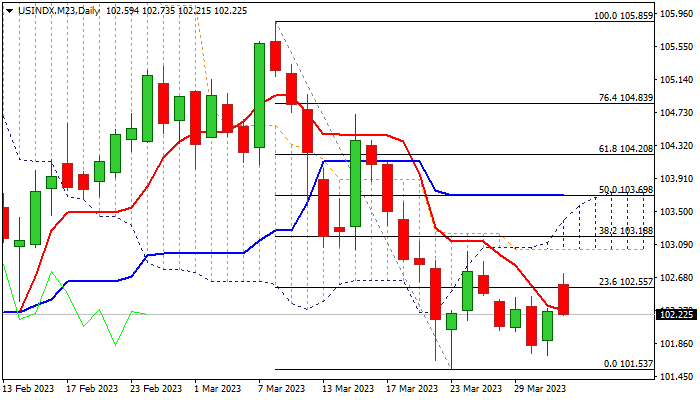
The dollar index lost traction and turned to red in early Monday, after extension of Friday’s recovery quickly ran out of steam, fully reversing initial gains after the index opened with gap-higher on Monday.
Dollar’s performance remains highly dependent on its main counterparts, Euro and British Pound, which turned to bullish mode on renewed risk appetite after tensions in banking sector eased.
Initial signs of recovery stall on attempts through Fibo barrier at 102.55 (23.6% of 105.85/101.53 fall), reflect still negative technical studies on daily chart, as 14-d momentum remains in bearish mode and thickening daily cloud above the price continues to weigh.
The downside is expected to remain at risk as long as price action stays below 102.55 barrier, while pressure is expected to rise on return and close below daily Tenkan-sen (102.27) and risk retest of pivotal supports at 101.71/53 (lows of Mar 31/23 respectively) which guard key support 100.66 (2023 low of Feb 2).
Initial resistance lays at 102.64, ahead of daily cloud base (103.03).
Res: 102.55; 102.73; 103.03; 103.18.
Sup: 102.01; 101.88; 101.71; 101.53.
Gold Price Moved into a Short-Term Bearish Zone Below $1,975
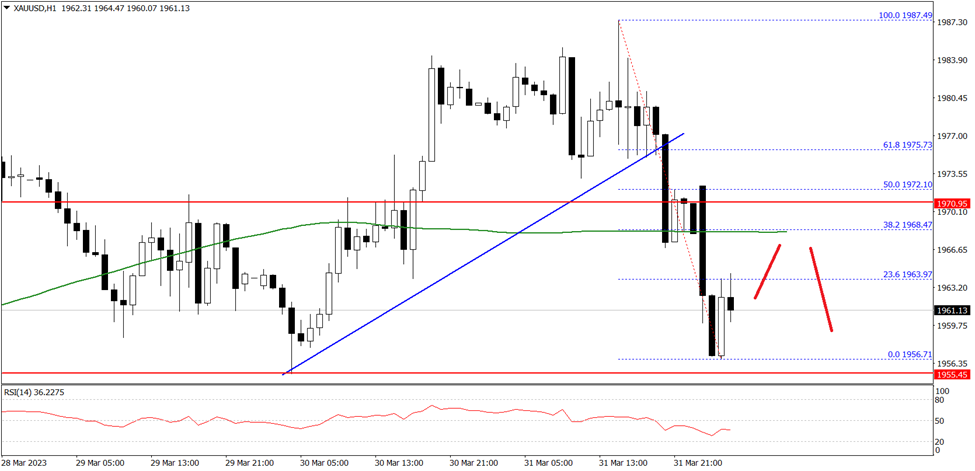
Gold price started a downside correction from the $1,990 zone against the US Dollar. The price declined below the $1,975 level to move into a short-term bearish zone.
There was a clear move below the $1,965 level and the 50 hourly simple moving average. It is now consolidating losses, with an immediate resistance on the upside near the $1,965 level.
The first major resistance is near the $1,970 level. The next main resistance could be near the $1,975 zone, above which the price could extend its rally towards the $1,990 level. Any more gains might send the price towards $2,000 on FXOpen.
On the downside, an immediate support is near the $1,955 level. The next major support is near the $1,950 level, below which the price might decline towards the $1,932 support level in the near term.
Forex and Cryptocurrency Forecast
EUR/USD: Why the Dollar Fell
Last week passed without sharp jumps. The dollar continued to fall in price, and EUR/USD returned by March 30 to where it was traded seven days before. The local maximum was fixed at 1.0925, and the five-day period finished at 1.0842.
The dollar continues to be pressured by the growth of investors' risk appetite: American and European stock indices have been going up since mid-March. Asian markets are not lagging behind: they were supported by statistics on business activity (PMI) in the manufacturing industry in China.
As for US macro statistics, it did not look good. The country's GDP growth for Q4 2022 was 2.6%, which is lower than both the forecast and the previous value (2.7%). But the number of initial applications for unemployment benefits, on the contrary, increased from 191K to 198K against the forecast of 196K. Both of these indicators indicate a slowdown in the US economy.
In addition, it has become obvious to market participants that the crisis, which knocked out American Silvergate Bank, Silicon Valley Bank, Signature Bank and European Credit Suisse, will cool the Fed's hawkish ardor and make it act much more cautiously. This opinion was confirmed on March 30 by the head of the Richmond Fed, Thomas Barkin, who said that the bankruptcy of Credit Suisse ruled out the option of further raising interest rates by 50 basis points (bp).
European macro statistics turned out to be quite diverse. On Thursday, March 30, the value of the Harmonized Consumer Price Index (HICP) in Germany became known, which rose in March by 7.8% y/y. This is less than a month ago (9.3%), but higher than the forecast (7.5%). As a result, looking at these figures, the market decided that the ECB would have to continue actively tightening monetary policy and raising euro rates in order to fight inflation. The yield of German government bonds outperformed the yield of similar US bills, and EUR/USD reached weekly highs. Friday's statistics, on the contrary, reassured bears on the dollar to a certain extent, as Eurostat reported that the Harmonized Consumer Price Index (HICP) fell in March in the euro area from 8.5% in February to 6.9% year-on-year (with a forecast of 7.1%).
The market reaction to this and other statistics on Friday (such as the US Personal Consumption Expenditure Index) was rather sluggish, as this day coincided with the last day of the Q1 2023, when many market participants have already recorded quarterly results in their reports.
Regarding the medium- and long-term prospects for EUR/USD, Bank of America (BoA) economists believe that "the market is again running ahead of the locomotive, incorporating early Fed rate cuts into prices, and reassessing these expectations is likely to put pressure on the pair in the short term." According to the BoA forecast, "the EUR/USD rate will be 1.05 in the first half of the year, it will rise to 1.10 by the end of this year, and to 1.15 by the end of 2024, which is still below the long-term equilibrium value." "We assume that the worst of the recent banking turmoil is behind us, but we remain concerned about two risks for the euro: the ongoing conflict over Ukraine and possible pressure on the Italian market from a hawkish ECB," BoA explained.
If we talk about the outlook for the near term, at the time of writing, the evening of Friday, March 31, 55% of analysts expect further weakening of the dollar, 35% - its strengthening, and the remaining 10% have taken a neutral position. Of the oscillators on D1, 90% are colored green, and another 10% are colored red. Among trend indicators, 80% recommend buying, 20% - selling. The nearest support for the pair is located at 1.0800, then 1.0740-1.0760, 1.0680-1.0710, 1.0620 and 1.0500-1.0530. Bulls will meet resistance in the area of 1.0865, 1.0925, 1.0985-1.1030, 1.1110, 1.1230, 1.1280 and 1.1355-1.1390.
Of the upcoming week's events, the publication on Monday, April 03, of data on business activity (PMI) in the manufacturing sectors of Germany and the USA is of interest. This will be followed by a whole stream of information from the US labor market. This will be statistics on the number of open JOLTS vacancies on Tuesday, April 4, the change in the number of people employed in the non-agricultural sector from ADP on Wednesday, and the number of initial applications for unemployment benefits on Thursday. And on Friday, April 7, we will have data on the unemployment rate and the number of new jobs created outside the US agricultural sector (NFP). It must be borne in mind that April 07 is Good Friday in Europe, the USA and a number of other countries, a day off, so the reaction to these figures will follow next week, on Monday April 10.
GBP/USD: Will the Pair Continue to Grow?
The dollar weakened not only against the euro, but also against the British pound. GBP/USD has risen by more than 600 points since March 08, in just three weeks. Only the key resistance in the area of 1.2425-1.2450 could stop its growth. But does the pound have the strength to climb further?
On March 23, the Bank of England (BoE) raised its key interest rate by 25 bp. to 4.25% (for comparison, the current rate of the US Federal Reserve is 5.00%). At the same time, the situation with inflation in the country is not improving. The United Kingdom remains the only developed economy where inflation has hardly fallen throughout the year and remains at double-digit multi-year highs. The main Consumer Price Index (CPI) in March was 10.4%, and the basic CPI was 6.2%. Therefore, many analysts expect that the increase in interest rates will be one of the main steps taken by the BoE at the upcoming meetings. Moreover, the regulator will have to keep the rate at high values for a long time, even though this will stifle the country's economy. (GDP growth rates are now at near-zero levels. Thus, the data published on March 31 showed GDP growth in Q4 2022 by only 0.1%).
Pressure on the economy makes a number of analysts talk about the pound's limited potential. However, despite this, many strategists believe that a recession will be avoided, and the rate hike will continue to push the pound higher. Thus, ANZ Bank economists expect the pair to rise to 1.26 by the end of the year. The forecast of their colleagues from the French Societe Generale looks even bolder: in their opinion, GBP/USD will follow EUR/GBP and gradually move up to 1.30.
The pair closed last week at 1.2330. At the moment, 45% of experts side with the dollar, the same number (45%) side with the pound, the remaining 10% have taken a wait-and-see attitude. Among the oscillators on D1, the balance of power is as follows: 85% vote in favor of green and 15% have turned neutral gray. Among the trend indicators, the absolute advantage is on the side of the green ones, those are 100%. Support levels and zones for the pair are 1.2270, 1.2200, 1.2145, 1.2075-1.2085, 1.2000-1.2025, 1.1960, 1.1900-1.1920, 1.1800-1.1840. When the pair moves north, it will face resistance at levels 1.2390-1.2425, 1.2450, 1.2510, 1.2575-1.2610, 1.2700, 1.2750 and 1.2940.
Statistics on the UK economy include the publication of the Business Activity Index (PMI) in the country's manufacturing sector on Monday, April 3. The values of PMI in the services sector, as well as the composite value of this Index, will become known on Wednesday. And we remind you that Friday is a day off in the Kingdom.
USD/JPY: Will BoJ Change Course in the Summer?
Unlike its DXY "colleagues", the Japanese currency has shown absolutely the opposite trend against the dollar. While the euro and pound were strengthening their positions last week, the yen was losing them. There are two reasons for this, in our opinion. First, the yen was pressured by the fact that March 31 is not only the end of the quarter, but also the end of the fiscal year in Japan. The second one, which has been said many times already, is the ultra-soft policy of the Bank of Japan (BoJ).
Kazuo Ueda, the new head of the regulator, who takes office on April 09, has repeatedly spoken out in favor of continuing the dovish course of his predecessor Haruhiko Kuroda. And of course, such statements do not contribute to the attractiveness of the national currency.
Since November 2022, concerns about financial instability have led to a surge in purchases of the yen as a safe haven. However, as Societe Generale strategists write, even the "safe harbor" needs change. USD/JPY needs more action from the BoJ to justify its big decline. If the Central Bank does nothing, USD/JPY is likely to rise even more. Societe Generale expects that any moves to change the monetary policy of BoJ will be made in June, which could send the pair to the 125.00 level. A sharp easing of the US Federal Reserve's policy can also help the Japanese currency.
The comments of economists from ANZ Bank look similar. "In the short term, [BoJ] policy change looks unlikely," they write. "If it does change, which we expect to happen after the second quarter of this year, the Japanese yen will rise on more favorable yield differentials. We expect USD/JPY to fall gradually to 124.00 by the end of the year."
Here, however, one must take into account the statement of the Deputy Governor of the Bank of Japan, Shinichi Uchida, made on Wednesday, March 29. According to him, the adjustment of the regulator's monetary policy to control bond yields is possible only if economic conditions and price stability improve, which will justify a gradual reduction in monetary stimulus.
So, the fall of USD/JPY to the zone of 124.00-125.00 is still a big question. It finished the last week at the level of 132.80. And as for the immediate prospects, at the moment, 40% of experts vote for the further movement of the pair to the north, 30% point in the opposite direction, and another 30% have abstained from forecasts. Among the oscillators on D1, 15% point south, 40% look in the opposite direction, and 35% are neutral. For trend indicators, 40% point to the north, the remaining 60% point to the south. The nearest support level is located in the zone 131.25, then there are levels and zones 130.50, 129.70-130.00, 128.00-128.15 and 127.20. Resistance levels and zones are 133.00, 133.60, 134.00-134.35, 135.00-135.35, 135.90-136.00, 137.00, 137.50 and 137.90-138.00.
No important macro data on the Japanese economy is expected to be released this week. The only thing that can be noted in the calendar is Monday, April 03, when the Tankan Major Producers Sentiment Index for Q1 2023 will be published.
CRYPTOCURRENCIES: What Will Happen to Binance?
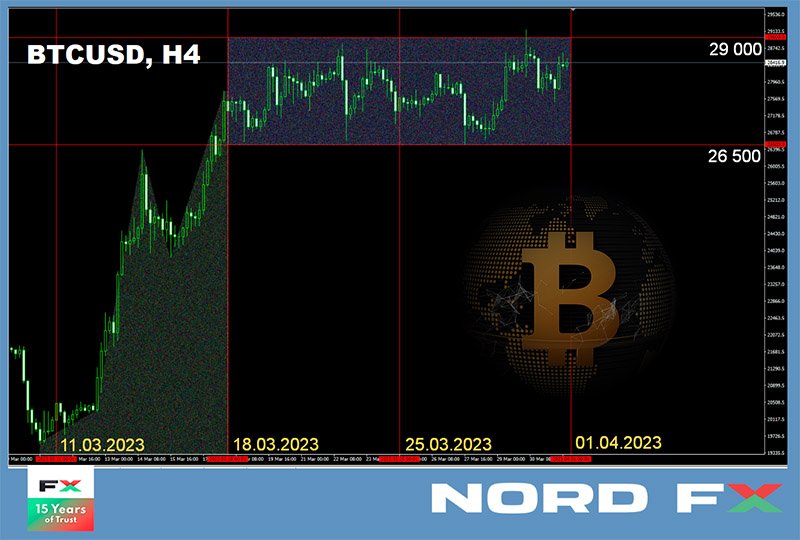
The crisis that crippled Silvergate, Silicon Valley Bank (SVB) and Signature and hit Credit Suisse has certainly helped the crypto market by reminding what decentralized finance was created for. However, investors' fears about a new wave of the banking crisis in the US and Europe are gradually fading away, which is clearly seen on the BTC/USD chart. If during the March 10-17 rally, digital gold gained almost 45% in weight, it has been unsuccessfully trying to storm the important $29,000 resistance for the last two weeks. Bitcoin needs not only to rise, but to sustainably gain a foothold above this horizon. Then, according to a number of experts, starting from this, it will be able to reach the next goal of $35,000. In the meantime, BTC is supported by the $26,500 level.
This support survived even when the CFTC (U.S. Commodity Futures Trading Commission) filed a lawsuit against Binance on Monday, March 27, accusing the crypto exchange of conducting unregistered futures and options transactions, serving US customers bypassing restrictions, illegal operations (in including in favor of Hamas, recognized as a terrorist organization in many countries) and market manipulation.
In relation to the last accusation, analyst Cory Swan has theorized that it was the founder of the Binance Changpeng Zhao (CZ) crypto exchange who was all this time the bear who tried to crash bitcoin to $12,000. "CZ held a large short position against BTC, hoping for $12,000, and paying for his personal big trade with unsecured BUSD and unsecured altcoins," Swann writes.
At the moment, opinions are divided regarding the future of Binance. Some believe that no one needs the funeral of such a giant, as this will be a collapse for the entire crypto industry. Others are confident that the CFTC will seek the most severe punishment for the exchange. Even in the event of a pre-trial settlement, she will face billions in fines and a ban on work in the United States. If the court nevertheless takes place and finds Binance and its management guilty, both many clients and financial counterparties around the world will immediately turn away from them.
According to a CNBC survey of industry influencers, the market remains bullish on the future of the first cryptocurrency at this stage. So Tether CTO Paolo Ardoino believes that bitcoin can "retest" the all-time high of $69,000. And Marshall Beard, strategic director of the Gemini crypto exchange, predicts that the coin may reach $100,000 this year. In his opinion, if the first cryptocurrency manages to overcome the previous maximum, it "would not take much time to rise even higher." However, a new bullish rally requires powerful new triggers, both economic and news. But neither the first nor the second has yet been observed.
Bloomberg strategist Mike McGlone believes that gold and bitcoin will be the most popular instruments for investors in 2023. The precious metal will confirm the status of the safest asset. The cost of a troy ounce of gold will soon exceed $2,000. At the same time, the attractiveness of bitcoin, which is seen as an instrument independent of the traditional banking system, will increase. As the global economy worsens, the number of investors who prefer to keep their capital in BTC, gold, as well as in treasuries, will grow, according to a note prepared by McGlone.
The collapse of the banking sector is reminiscent of the crisis of 1929, so the Fed is tightening monetary policy. After the latest rate hike, investment in bitcoin has increased, although many observers expected its value to fall, Bloomberg strategist emphasized. In his opinion, the BTC rebound can be seen as a positive signal, as more traders continue to buy cryptocurrency even amid global uncertainty.
Place Holder partner and former head of Ark Invest crypto company Chris Burniske, like Mike McGlone, believes now is the time to buy bitcoin and ethereum, as they are created for precisely such crisis moments.
Venture capitalist and billionaire Tim Draper made similar recommendations. Draper wrote in a report aimed at entrepreneurs that companies "can no longer rely" on just one bank or regulator. "For the first time in many years, governments are taking over banks at the risk of becoming insolvent. Bitcoin is a hedge against the financial domino effect and over-control mismanagement."
Draper suggested keeping short-term deposits for no more than six months in two separate accounts, at a local bank and an international bank. In his opinion, organizations should also transfer an amount equal to two salary funds into bitcoin or other digital assets. The billionaire stressed the importance of such a contingency cushion, as management is responsible for meeting payroll deadlines "even in times of crisis."
Of course, as always, the voices of "crypto gravediggers" are heard. Thus, the analyst under the nickname Grinding Poet believes that "a retest of the 2018 lows is inevitable" and "the new target is $3,150." The well-known gold bug and bitcoin critic Peter Schiff continues to stand his ground. Back in 2017, Schiff promised that the coin would soon be completely worthless. Despite the past 6 years, the entrepreneur has not changed his position. And now, in March 2023, he stated that "bitcoin's zero price hike just dragged on a bit."
Steve Hanke, professor of applied economics at Johns Hopkins University, criticized bitcoin again, saying that the fundamental value of the first cryptocurrency is zero. He called BTC a highly speculative asset with no economic value or utility.
Cake Defi CEO Julian Hosp told Hanke that bitcoin is debatable, but it certainly has value. According to Hosp, there are undoubtedly people who need bitcoin, so the claim that the first cryptocurrency has zero value is fundamentally wrong.
We tend to agree with Hosp, because at the time of writing the review, on the evening of Friday, March 31, BTC definitely has value and is expressed in a very specific figure of $28,375 per coin. The total capitalization of the crypto market has grown slightly over the week, from $1.169 trillion to $1.185 trillion. The Crypto Fear & Greed Index also rose from 61 to 63 points in seven days and is still in the Greed zone.
EUR/USD Outlook: Bulls Pause But Remain in Play Above Thickening Daily Cloud
The Euro remains at the back foot at the start of the week and extends Friday’s 0.60% drop, which also formed a bearish engulfing pattern on daily chart.
Last week’s double failure under pivotal barrier at 1.0930 (Mar 23 spike high) and subsequent pullback, suggest that bulls lack strength for break higher, but current easing was so far limited, signaling that larger bulls remain in play.
Early Monday’s dip to 1.0788 was so far short-lived, with subsequent bounce above pivotal supports at 1.0832/27 (Fibo 23.6% of 1.0516/1.0930/rising 10DMA) pointing to still strong bulls and suggesting possible scenario of consolidation preceding fresh push higher.
Near-term bias is expected to remain with bulls while the price action holds above key levels at 1.0771/57 (Fibo 38.2%/top of daily Ichimoku cloud) with thickening cloud offering significant support and underpinning near-term action.
Daily MA’s are in bullish setup and 14-d momentum remains positive, adding to positive signals.
Dip-buying above cloud top remains favored for now, with strong negative signal seen on break and close below cloud base (1.0710).
Res: 1.0871; 1.0930; 1.0951; 1.1000.
Sup: 1.0788; 1.0771; 1.0757; 1.0710.
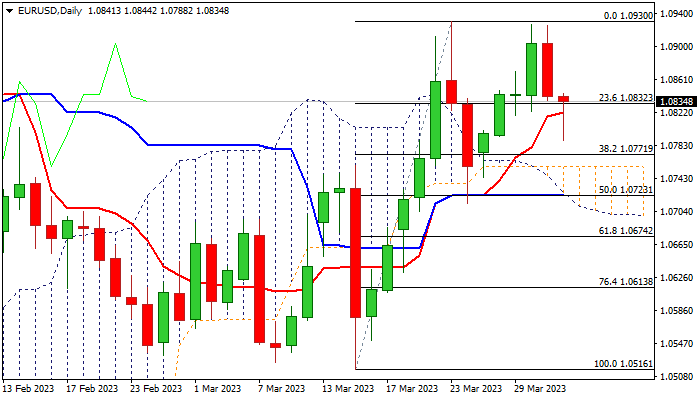
UK PMI manufacturing finalized at 47.9, fell back into contraction
UK PMI Manufacturing was finalized at 47.9 in March, down from February's 7-month of 49.3. The index has stayed below the neutral 50 mark for eight successive months.
Rob Dobson, Director at S&P Global Market Intelligence, highlighted that UK manufacturing production "fell back into contraction" at the end of the first quarter due to subdued market conditions. While total new orders saw a slight increase after a nine-month contraction, order book levels remain low. New export order declines continue to impact demand, despite a modest recovery in the domestic market.
However, Dobson pointed to positive developments in pricing and supply during March. Input price inflation reached its lowest level since June 2020, and although selling prices decelerated, they remained higher than input costs, offering some relief for manufacturers' margins. Supply chains continued to recover, with March witnessing the greatest improvement in average vendor lead times in the survey's 31-year history. Dobson noted that this development "should hopefully filter through to further cost reductions and lessen the disruption to production workflows in the coming months."
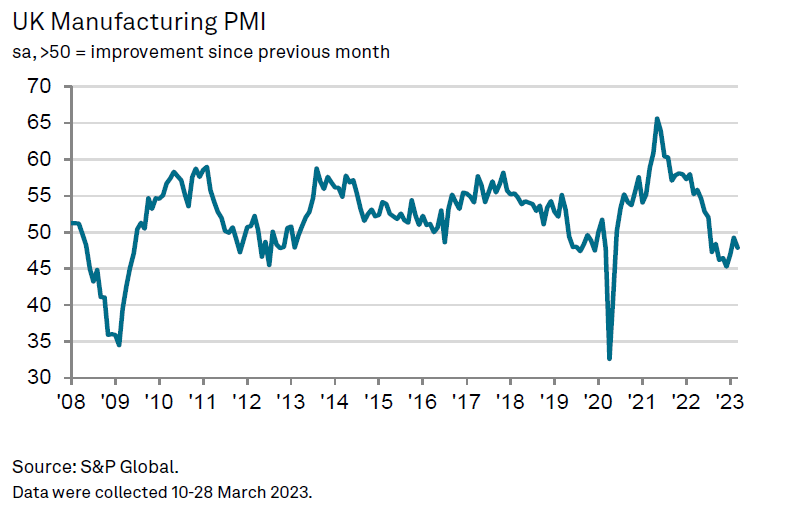
EURUSD Pulls Back After Failing to Surpass Crucial Zone
EURUSD had been steadily gaining ground since finding its feet at the March low of 1.0515. Nevertheless, the pair’s rebound appears to be fading as the 1.0928 barrier has repeatedly rejected any price advances in the past two weeks.
The short-term oscillators currently suggest that bullish forces are waning. Specifically, the MACD histogram is softening but remains above both zero and its red signal line, while the RSI is pointing downwards in the positive territory. Moreover, the price is holding above the Ichimoku cloud, hinting that the near-term bias has not turned bearish yet.
Should selling pressures persist, the pair could test the recent support of 1.0712, which overlaps with the 50-day simple moving average (SMA). Dipping beneath that zone, the price might descend towards the March low of 1.0515 before the 2023 bottom of 1.0480 comes under examination. If that barricade fails, the 1.0290 hurdle could provide downside protection.
On the flipside, bullish actions could propel the price towards the crucial rejection territory of 1.0928, which held strong three times in the past 10 days. A successful break above the fortified territory may open the door for the 11-month peak of 1.1032. Further advances could then cease at the March 2022 high of 1.1184.
In brief, EURUSD experienced a minor downside correction after failing multiple times to cross above the 1.0928 area. Hence, for the bullish scenario to materialize, the pair must initially overcome this strong barrier.
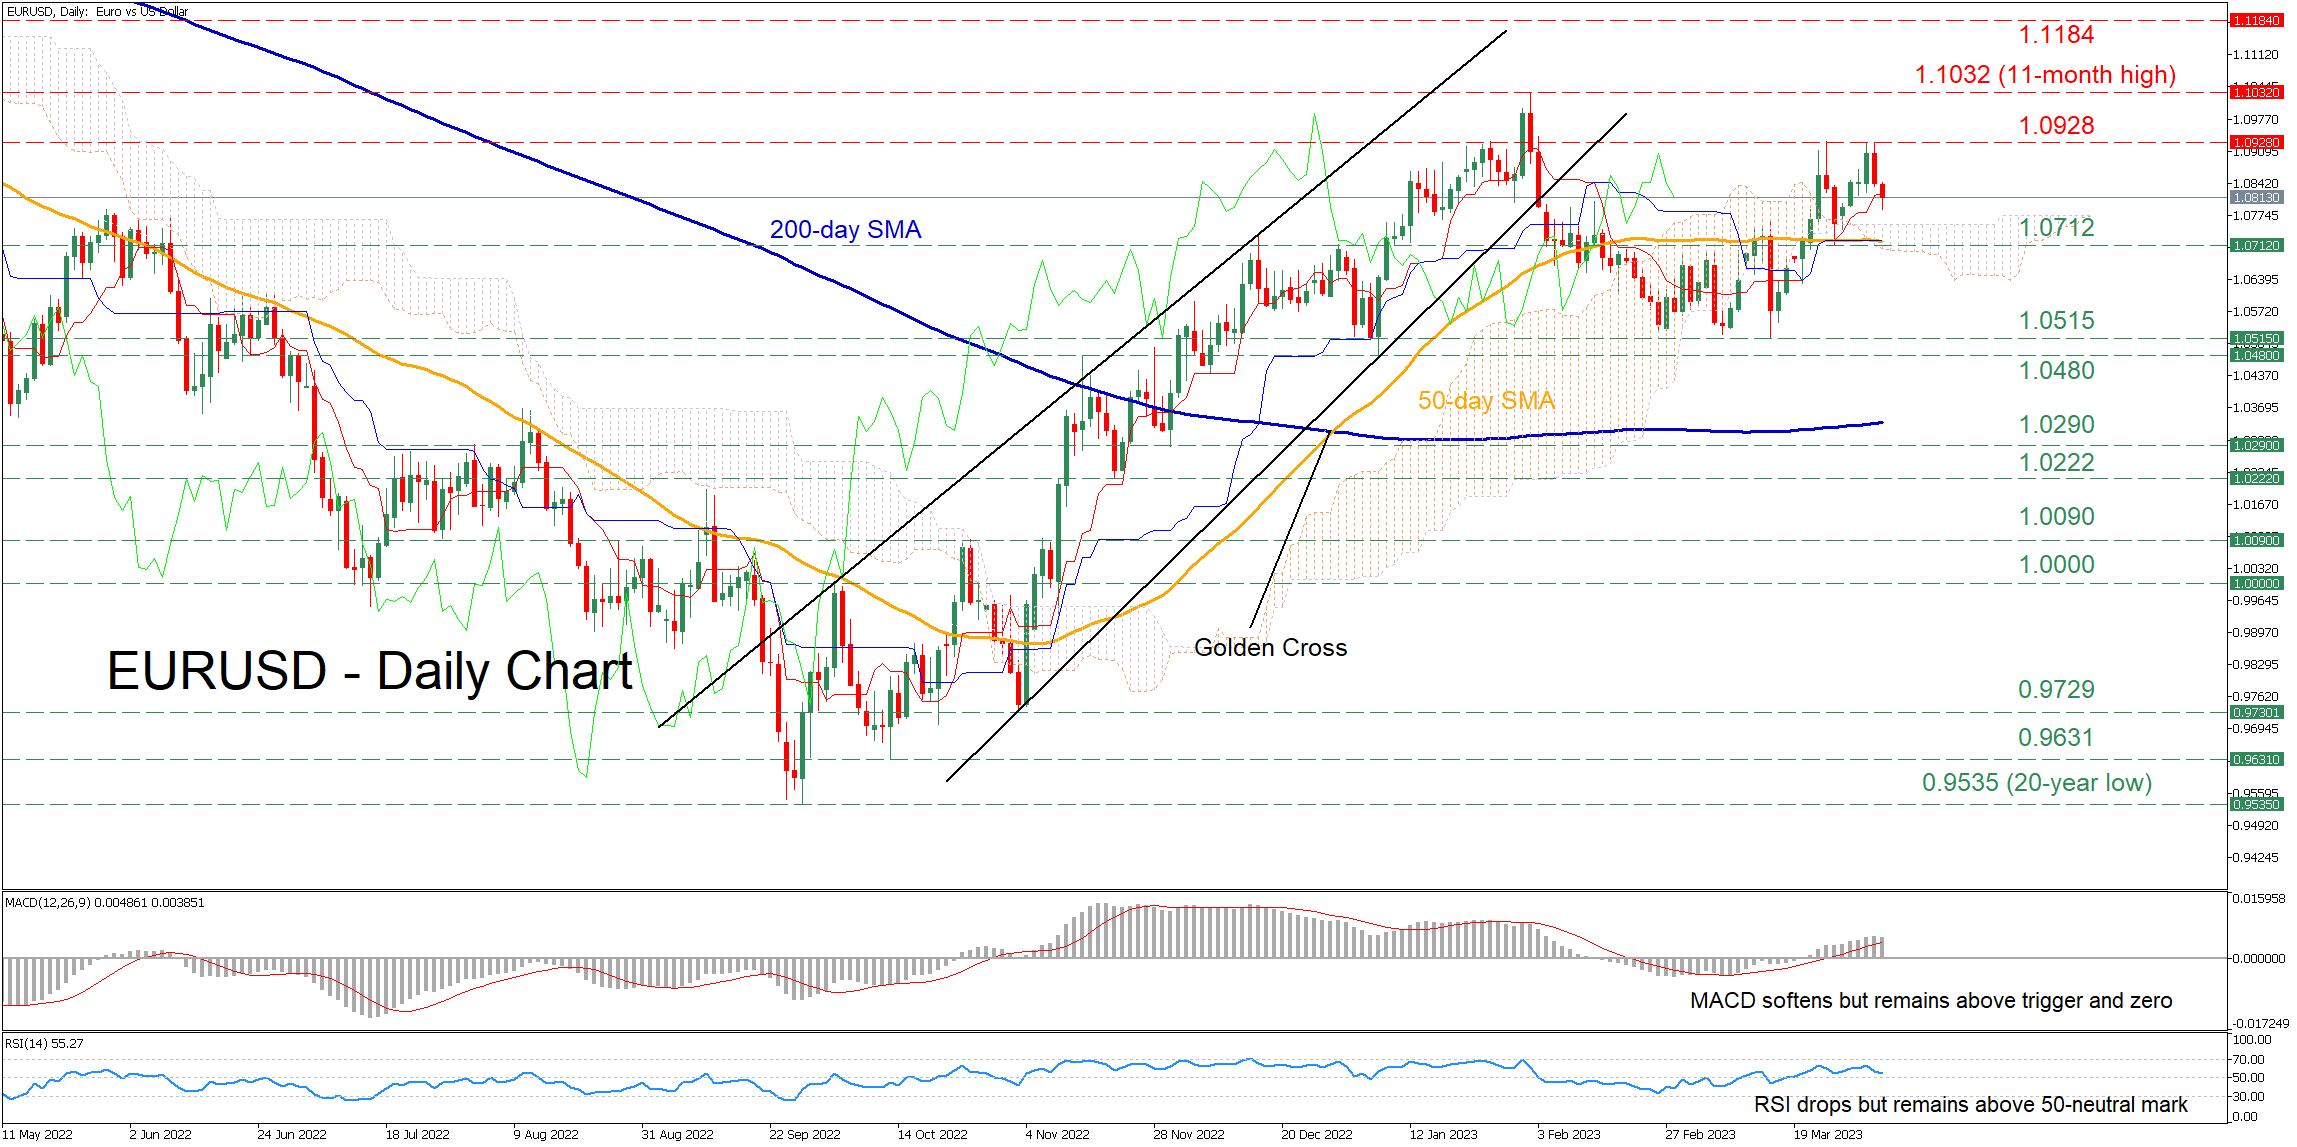
EURCHF Bears Could be in for a Treat
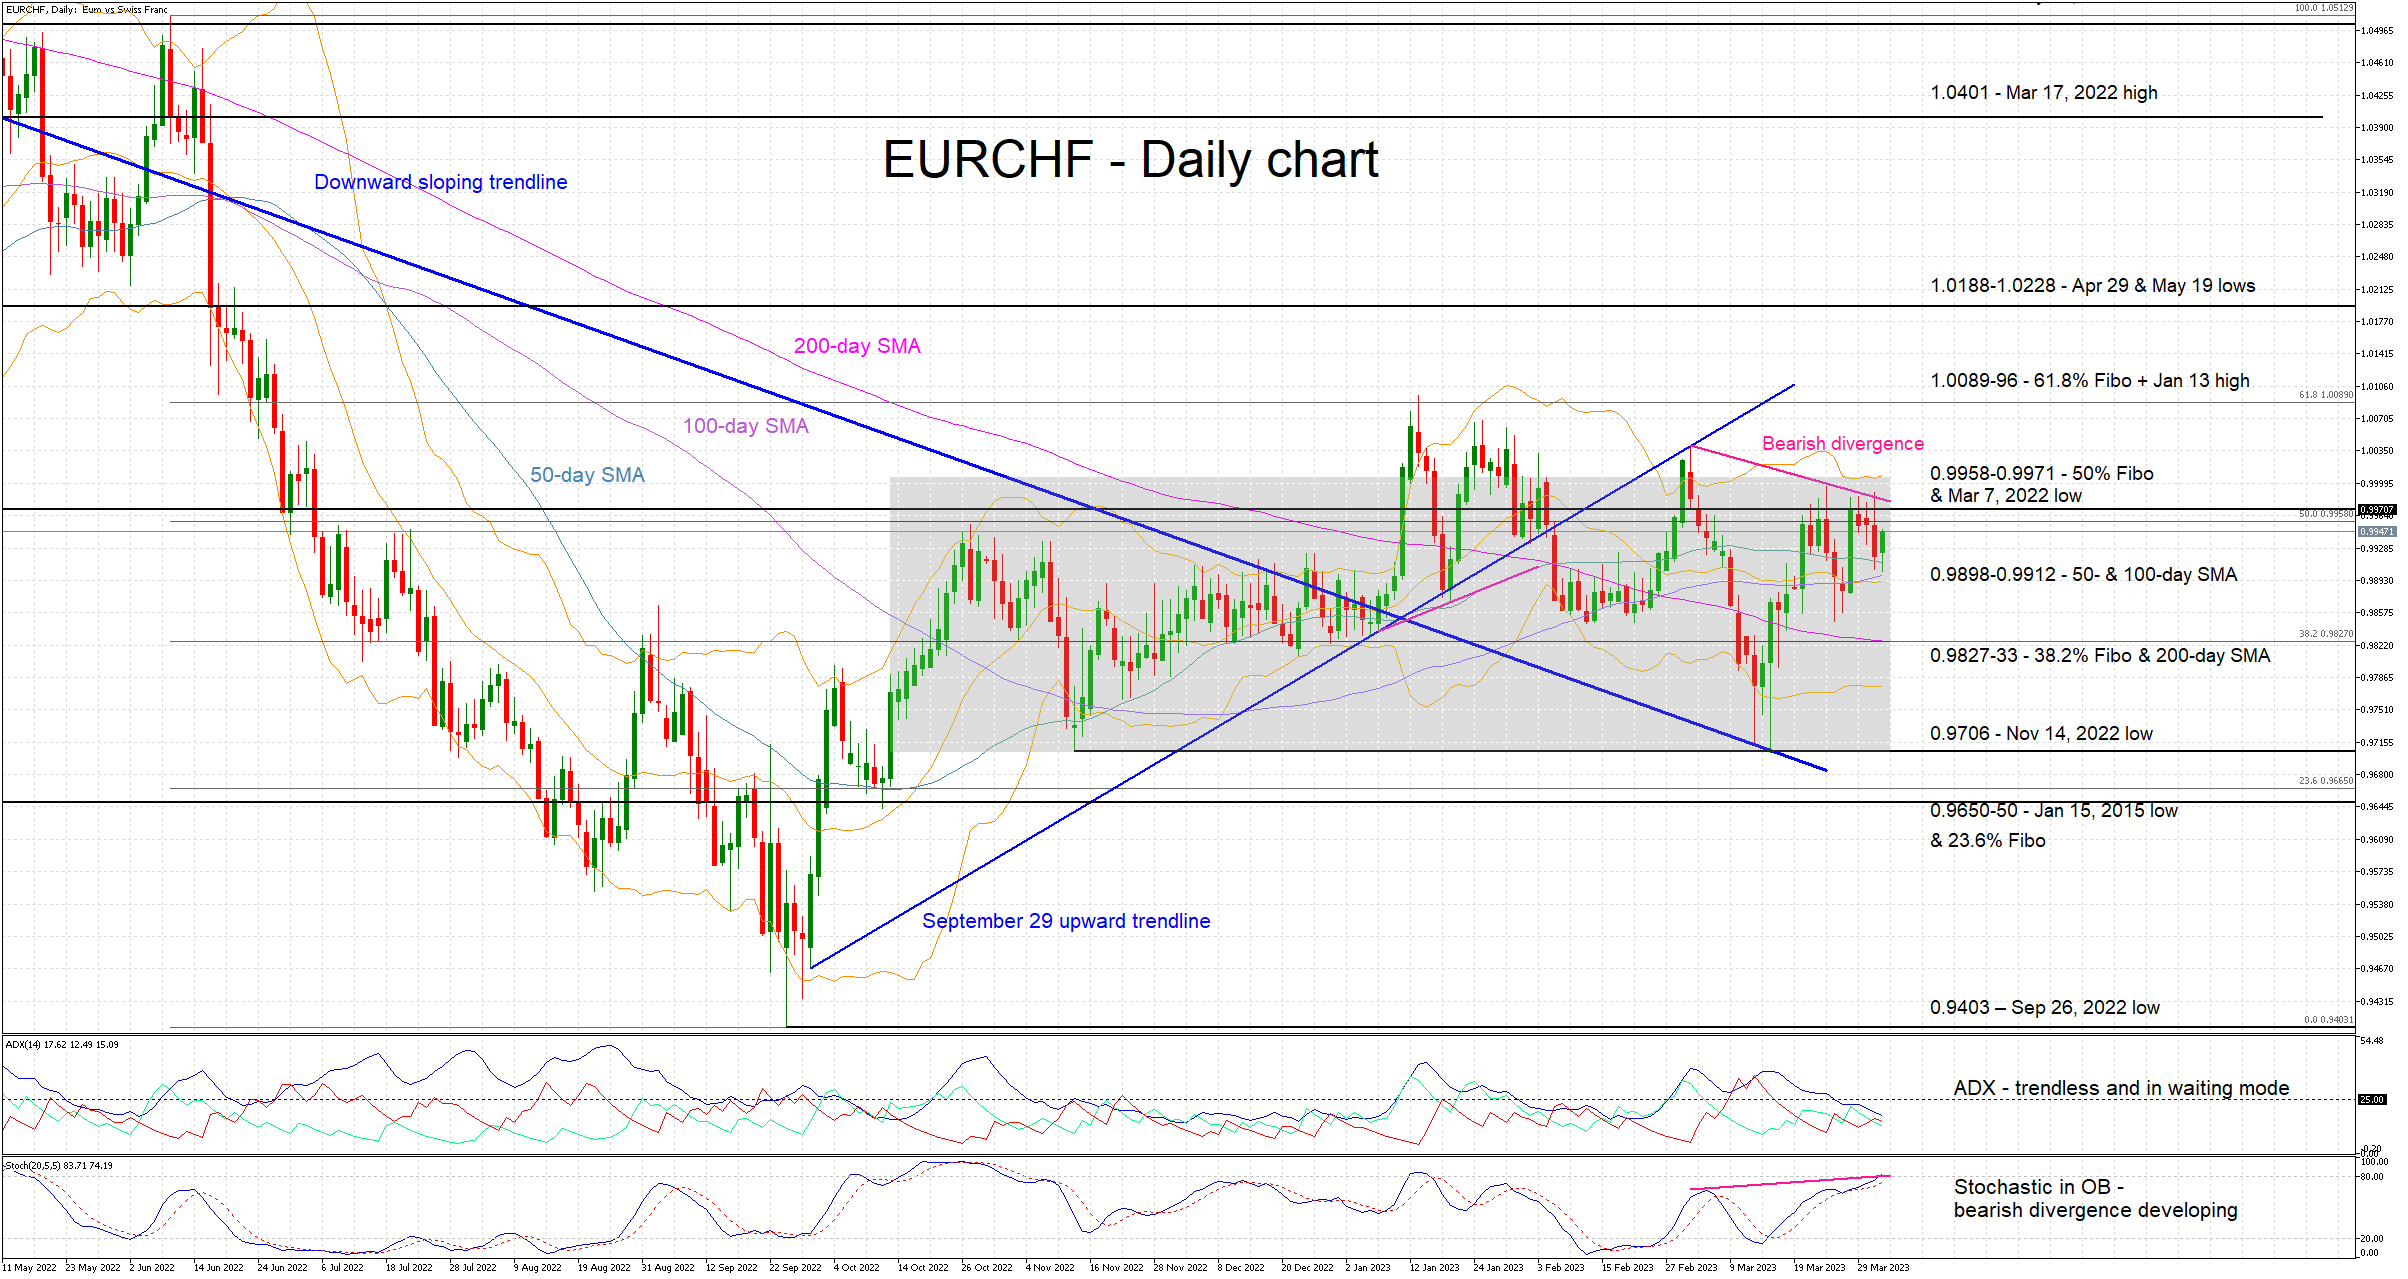
EURCHF is edging higher today, bouncing off the 50-day simple moving average (SMA). The pair continues to trade inside the wide 0.9706-1.0006 rectangle established since October 13, 2022. The recent price action amidst elevated volatility clearly points to a precarious balance in the market, reinforced by the various upside breakouts that proved to be false. This balance is also evident in the Average Directional Movement Index (ADX) that has gradually dived below its 25-threshold and thus is signaling a purely trendless market at this juncture.
Once again, the stochastic oscillator has a more interesting story to tell. It has entered its overbought territory for the first time since the mid-January false breakout. It holds a decent gap from its moving average, potentially pointing to some upside pressure still left in the tank. But more importantly, there is a bearish divergence developing. The higher highs in the stochastic have been matched with lower highs in EURCHF.
Should the bulls decide to take over the market, they would be faced with the busy 0.9958-0.9971 range set by 50% Fibonacci retracement of the June 9 – September 26 downtrend and the March 7, 2022 low. Even higher and assuming that the new upside breakout does not prove to be false again, the 1.0089-96 range defined by the 61.8% Fibonacci retracement and the January 13 high respectively could trouble the bulls.
On the other hand, the bears would have to deal with the 50- and 100-day SMAs at the 0.9898-0.9912 area first. Lower, the 0.9827-33 range could prove tougher to crack as it is defined by the 200-day SMA and the 38.2% Fibonacci retracement respectively. The path would then be unhindered until the 0.9706 level, the lower boundary of the ongoing rectangle.
To sum up, EURCHF bulls are trying to establish some degree of market control, but the overall technical picture looks unfavourable for them. Should the bearish divergence materialize, a drop towards the 0.9827 area could be easier than currently envisaged.