

Sample Category Title
RBA Board Pauses But Retains Tightening Bias
The RBA Board has softened its clear tightening bias but not enough for Westpac to change its view that we can expect one final rate increase at the May Board meeting.
The Reserve Bank Board decided to leave the cash rate unchanged at 3.60% at its April meeting. This decision is in line with Westpac’s forecast although we continue to expect to see one final increase of 0.25ppts at the May Board meeting.
The decision is consistent with the classic approach that policy needs to move swiftly to push rates into the contractionary zone but, once there, a central bank that meets as frequently as the RBA can pause to assess the cumulative impact of the policy.
There was a subtle change in the Governor’s guidance. In March he noted that: “further tightening of monetary policy will be needed”. In April, this was changed to: “further tightening of monetary policy may well be needed”.
This is a softer guideline than we saw in March but still qualifies as a clear tightening bias.
The decision to pause is justified by the need for “more time to assess the state of the economy and the outlook, in an environment of considerable uncertainty.”
The ‘check list’ going forward remains: “the global economy, trends in household spending, and the outlook for inflation and the labour market.”
Of most importance will be the March quarter inflation report, due April 26, which Westpac expects to show a trimmed mean inflation print of 6.6% for the year.
At the May meeting the Board will also receive a refreshed set of economic forecasts from the staff. We do not believe that the revised forecasts will bring forward the timing at which the staff expects to return to the 2-3% target zone – mid 2025!
Along with the economy still operating with a near 50-year low in the unemployment rate and the slow expected progress in achieving the inflation target, we continue to expect that the Board will see the need for one final 0.25ppt increase in the cash rate.
Apart from the key guidance language there were some less significant examples of a more cautious Board although the key themes around high inflation and tight labour markets continued to shine through.
“There is further evidence that the combination of higher interest rates, cost of living pressures and a decline in housing prices is leading to a substantial slowing in household spending.” This indicates that the slowdown that was apparent in the December quarter from the national accounts has extended into the March quarter.
Note that consistent with the slightly more dovish approach is no recognition of the recent stabilization of house prices.
In March the Governor highlighted that “Services price inflation remains high”. In April, there was no reference to services price inflation. Services inflation is accepted as the stickiest component of inflation so excluding a mention of services inflation may indicate less concern.
Recent disruptions to the US banking system are highlighted as “an additional headwind for the global economy” whereas this is contrasted with the strong Australian banking system.
On the other hand, there was an additional qualification to the assertion in March that “wages growth is still consistent with the inflation target” with the April statement noting “wages growth is still consistent with the inflation target, provided productivity holds up”
The final paragraph is also pitched at the likely need for higher rates. The Board retained the assertion “ In assessing when and how much further interest rates need to increase …” It could have qualified that sentence with “ if interest rates need to increase” rather than maintaining “ how much further.”
Conclusion
While the Board’s tightening bias has been softened in parts, in the April decision statement, there is not sufficient evidence for Westpac to change its forecast that the Board will make one last 0.25ppt increase in the cash rate at the May Board meeting.
That decision will be in the context of underlying inflation holding well above the target level, only slowing moderately, in an economy where the unemployment rate remains near 50-year lows and dismal productivity exacerbates the eventual impact of wages growth on inflation.
US Treasuries Rallied With Front End Outperforming
Markets
The unexpected OPEC+ production cut pushed Brent crude prices from $80/b to $85/b, but its impact on other market segments was completely undone by a disappointing US March manufacturing ISM. Instead of the expected stabilization round 47.7, the ISM dropped to 46.3. It’s the weakest reading since May 2020 and highlights the global divergence between loss of momentum in manufacturing and booming business in services activity (to be confirmed in tomorrow’s non-manufacturing ISM). Details showed broad-based fatigue. Production ticked up marginally from 47.3 to 47.8, but new orders (44.3 from 47) and new export orders (47.6 from 49.9) don’t bode well. Employment fell deeper below the 50 boom/bust mark as well (46.9 from 49.1). Companies don’t want to commit themselves too much given receding demand, ending inventory accumulation (47.5 from 50.1). Global supply chain issues are no longer an issue with supplier deliveries reaching the lowest level since 2009 (44.8 from 45.2). Producer prices ticked slightly lower on the month (49.2 from 51.3). Even though the Fed’s focus is currently mainly on the services part of the US economy, markets reacted fiercely to the disappointing outcome. US Treasuries rallied with the front end of the curve outperforming. US yields eventually closed 2 bps (30-yr) to 7.4 bps (5-yr) lower. Filtering out opening gains, shows double digit intraday declines at the front end of the curve. On the German curve, the very long end outperformed with daily yield losses between 1 bp (2-yr) and 5.8 bps (30-yr). The reaction on FX markets was again much more muted with EUR/USD erasing early losses to close around 1.09 without testing 1.0930 resistance. Main US stock indices ended mixed with Nasdaq ceding 0.27% and the Dow Jones gaining around 1%. Fed governor Cook after close said that the disinflationary process is underway but that “we’re not there yet”.
This morning’s Asian session was rather subdued. The Honk Kong Monetary Authority did for the first time since February have to intervene in the FX market to prop up the local dollar after hitting the top end of the pegged trading band at USD/HKD 7.85. Today’s eco calendar is thin with US JOLTS Openings filling the gap between the manufacturing ISM and tomorrow’s ADP employment report and non-manufacturing ISM. After yesterday’s unpleasant surprise, we expect a market preference to err on the dovish side of expectations in the run-up to this week’s remaining releases (also payrolls on Friday). Speeches by central bankers are wildcards.
News and views
The Reserve bank of Australia (RBA) today kept its policy rate unchanged at 3.6%. It follows a cumulative increase in interest rates of 350 bps since May last year. The RBA indicates that policy tightening comes with a lag and that the full effect of the increases in the policy rate still has to be felt. It will now take its time to further assess the impact on data and on the economic outlook. The central bank assumes that Australian inflation has peaked. Goods prices probably will continue to ease, but rents are still increasing at the fastest pace in some years, the vacancy rate stays high and utility rates continue rising quickly. The RBA predicts inflation to ease to 3% in 2025. It also expects growth below trend in the next couple of years. As the labour market remains tight, the RBA continues to keep a close eye at labour costs and wages. In this respect, some further tightening of policy might still be needed. The 2y Australian government yield opened already low before the RBA policy announcement and lost another 5 bps after the decision. (2.91%). The loss in the Aussie dollar remains modest (AUD/USD 0.6765).
South Korean inflation slowed in March to 0.2% M/M to 4.2% Y/Y, from 0.3% M/M and 4.8% Y/Y in February. The 4.2% Y/Y inflation print was the lowest in a year. However, core inflation (excluding oil and agricultural prices) was unchanged at 4.8%, holding within reach of the cycle peak of 5% (in January). The decline in the headline figure was mainly due to lower energy prices. The Bank of Korea after the report indicated that it expects inflation to ease further, but it will stay above the 2% target this year. Core inflation will probably decline at a slower pace. The central bank meets next week. At the February 23 policy meeting, it left its policy rate unchanged at 3.50%. However, at that time, the BoK didn’t formally announce an end to the rate hike cycle yet. After opening stronger, the won this morning eases modestly to USD/KRW 1314.
RBA Holds Fire, Attention Shifts to RBNZ
Unsurprisingly, Monday’s price action was mostly about oil. The barrel of American crude settled around 8% higher than last Friday’s levels after OPEC announced that it will cut production by more than a million barrels per day. WTI closed the session above $80pb.
The latest OPEC decision, of course, boosted speculation that the price of a barrel could extend to $100pb.
Yes, tighter supply from OPEC is a fundamental boost for oil prices; it makes oil scarcer than it already is. Yet a rapid rise in oil prices also puts a brake on global growth, which would then weigh on global demand prospects and limit the potential on the topside.
Therefore, your barrel of oil is certainly not ready to cost $100 tomorrow.
But it will cost more than the previous months. And that’s exactly the boost that the energy stocks needed. BP and Shell jumped more than 4% in London. Eni gained around 4% in Milano, as well, while Total Energies jumped nearly 6% in Paris, Exxon rallied 6% as well in the US, and Marathon Oil really did a nice marathon and jumped nearly 10%.
Thanks to the oil stock rally, the S&P500 eked out a 0.37% gain on Monday, whereas Nasdaq fell around 0.25%.
Note that the rate-sensitive Nasdaq could’ve fallen more - because prospects of higher oil prices mean a certain U-turn in inflation expectations (and inflation), which, in return, means further interest rate hikes from the Federal Reserve (Fed).
But ‘happily’, the rate expectations are not only driven by inflation expectations, but also by recession worries – which increased significantly last month due to the banking crisis.
And yesterday’s ISM manufacturing index, from the US, fell further in the contraction zone in March. The soft data helped tempering the Fed expectations yesterday and kept the Fed hawks at bay.
The US 2-year yield reversed an early increase and slipped below the 4% mark. And that, certainly helped throwing a floor under a broader selloff in equities. Yet gains remain vulnerable to 1. a renewed pressure from Fed hawks on rising inflation expectations due to OPEC cut, and 2. on rising recession odds due to bank stress.
The falling yields weighed on the US dollar. The US dollar index fell, yesterday, letting the EURUSD bounce back above the 1.09 mark.
RBA holds fire, RBNZ is in focus
In Australia, the Reserve Bank of Australia (RBA) decided not to hike the interest rates by 25bp at today’s monetary policy meeting. The latest slowdown in inflation and household spending convinced the Australian policymakers that they could take a breather this month.
Yet, today’s ‘hold’ from the RBA was a hawkish hold, as the RBA didn’t close the door to further rate hikes saying that ‘some further tightening of monetary policy may well be needed to ensure that inflation returns to target’.
Still, it’s the first major central bank to hold fire since the banking crisis.
And with the RBA decision behind us, investors are focused on what the Reserve Bank of New Zealand (RBNZ) will do tomorrow.
Keep in mind that even though the RBA and the RBNZ are nowhere close to the Fed or the European Central Bank in size, they tend to set the tone for the monetary policy cycles. This is especially true for the RBNZ which clearly took a leading role in the actual tightening cycle. Therefore, if the RBNZ announces the end of the tightening tunnel at tomorrow’s meeting, there will be a stronger conviction for the Fed hawks that the US would also follow suit.
For now, activity on Fed funds futures still gives slightly more chance for a 25bp hike at May meeting.
Higher Oil Prices – Lower Yields
Market movers today
The data calendar is light with producer prices in the Euro Area as the potentially most interesting release. PPI inflation should continue its gradual decline driven by energy prices.
Danish FX intervention data for will be published at 17.00 CET, but there is no reason to expect there was any intervention in March.
The 60 second overview
The announcement from OPEC regarding a production cut sending oil prices higher led to several responses from both Federal Reserve members, US Treasury secretary Yellen and several ECB officials - basically it made the job a bit more difficult for the central banks, but more factors than oil determine the inflation path. Furthermore, Yellen stated that the situation around US banks was stabilizing.
10Y US Treasuries ended the day with much lower yields which dropped some 10bp on the back of the weaker than expected ISM data from the US. Late yesterday, another Fed official stated that the disinflationary process has begun but they are not yet there. This morning US Treasuries are more or less unchanged in Asian trading hours.
This morning the Australian Central Bank (RBA) left the monetary policy rate unchanged at 3.60%, in line with consensus expectation and market pricing. The decision to halt rate hikes came on the back of weakening global growth outlook, banking sector uncertainty in the US and Switzerland as well as signs of calming inflation in the February CPI (6.8%; Jan 7.4%).
Equities: Global equities higher yesterday and vol lower. That has been the story for almost 10 days and the reason is still improved confidence in the banking sector. Not because of improved earnings outlook but simply increased certainty that a total meltdown through a systemic bank crisis is avoided. Yesterday the energy sector stood out, increasing more than 4% on the back of the OPEC announcement of output cuts. In the US equities closed mixed with Dow +1.0%, S&P 500 +0.4%, Nasdaq -0.3% and Russell 2000 -0.01%. Asian market are mixed this morning and with tech stocks lower, as it was the case in US yesterday. Futures in Europe are firmer while US futures are a tad lower this morning.
FI: It was a relatively quiet day yesterday until the US ISM number was released which missed estimates and fell to an almost 3y low, which resulted in an initial rally of 5bp in the 10y point in the 10y German to 2.25%, in what was a general curve flattening move. German ASW spreads traded in a tight range yesterday. ECB's most hawkish GC member Holzmann said that a 50bp hike in May is 'still on the cards'. While he is the most hawkish member, he also served as a canary in a coal mine for the size of the policy rate hike during the past year, although markets did not react to his comments.
FX: Yesterday's session was characterised by appreciating currencies related to oil-producing countries on the back of the rising oil price after OPEC+ announced a production cut on Sunday. AUD, CAD and NOK in particular were relative outperformers in the G10 space. Especially the latter significantly outperformed and sent EUR/NOK down to 11.22. The USD initially gained but ended the day broadly weakened sending EUR/USD above 1.09. EUR/CHF ticked higher on yesterday's lower-than-expected Swiss inflation print. Retreating US yields after weak US manufacturing activity sent USD/JPY below 133.
Credit: The credit markets showed less activity yesterday due to a combination of Easter lull kicking in and investors still trying to figure out if the financial crisis is over before it really got started. ITraxx main closed the day marginally wider at +85.6bp and Xover widened by 7bp to +446bp. In the primary markets NP3 Fastigheter demonstrated that the market for commercial real-estate issuance is still alive, printing a SEK500m High Yield green bond.
Nordic macro
This morning, we published our Nordic Outlook with our forecasts for global and Nordic economies. We expect that higher interest rates and a prolonged period of stagnation or low growth will be necessary to bring down core inflation, unless there is a more severe financial crisis which is not the main scenario. Sweden has both the weakest economy and the highest inflation, and we think the priority will be to fight inflation first. In the other Nordic countries, we also expect some economic weakness, moderately higher unemployment and lower house prices, but the economies show quite a lot of resilience. The Danish current account surplus is expected to remain very large, so we do not see a narrowing of the policy rate differential to the Euro Area over the coming years.
Technical Outlook and Review
DXY:
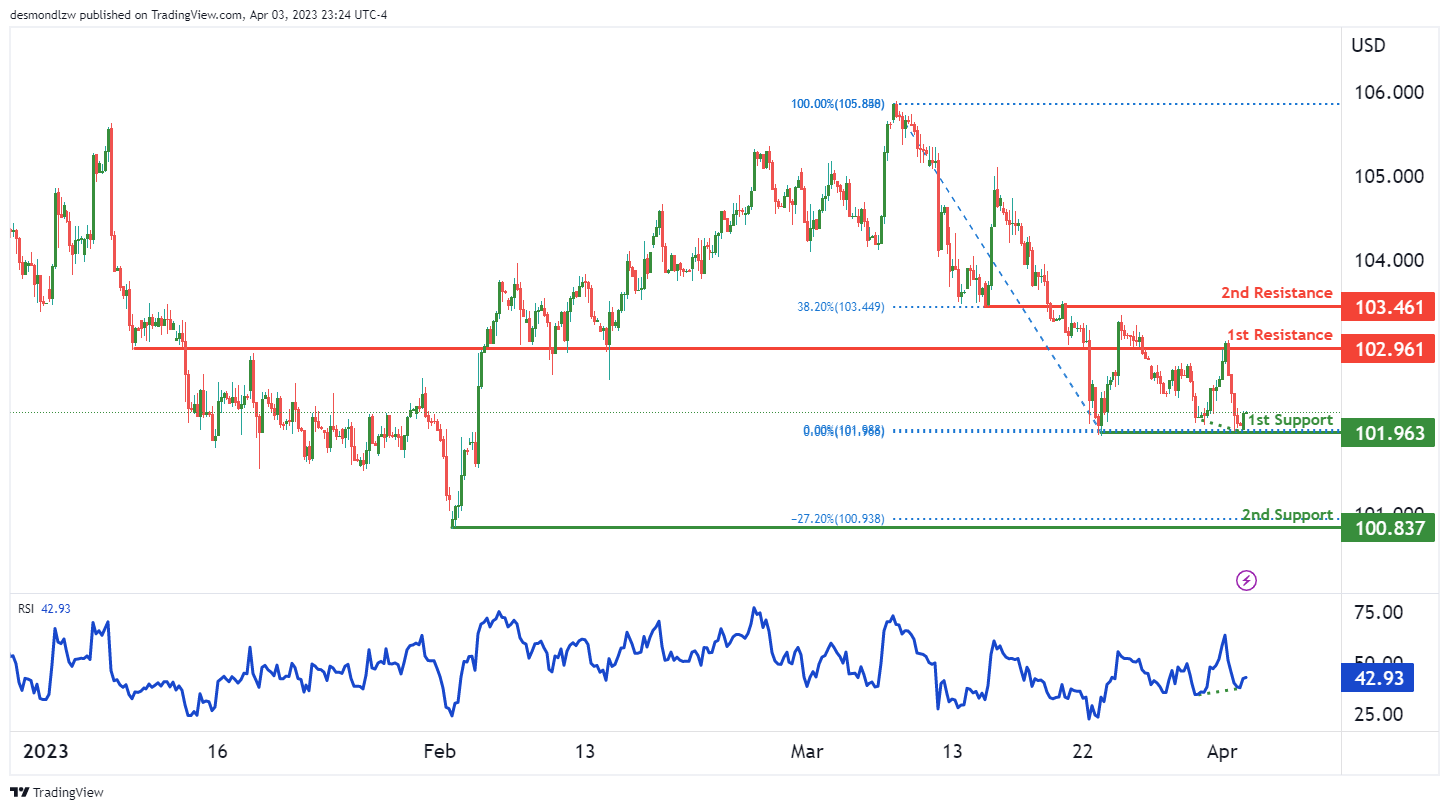
Looking at the DXY chart, the overall momentum is bullish, which suggests that prices may continue to rise. The current price could potentially make a bullish bounce off the first support level of 101.96, which is a multi-swing low support level. If the price bounces off this level, it could head towards the first resistance level at 102.96, which is an overlap resistance level.
In case the price breaks above the first resistance level, it could potentially reach the second resistance level at 103.46, which is also an overlap resistance level. On the other hand, if the price breaks below the first support level, the next support level is at the second support level of 100.83, which is a swing low support level.
It’s worth noting that the RSI is also displaying bullish divergence versus the price, which suggests that a bounce might occur soon.
EUR/USD:
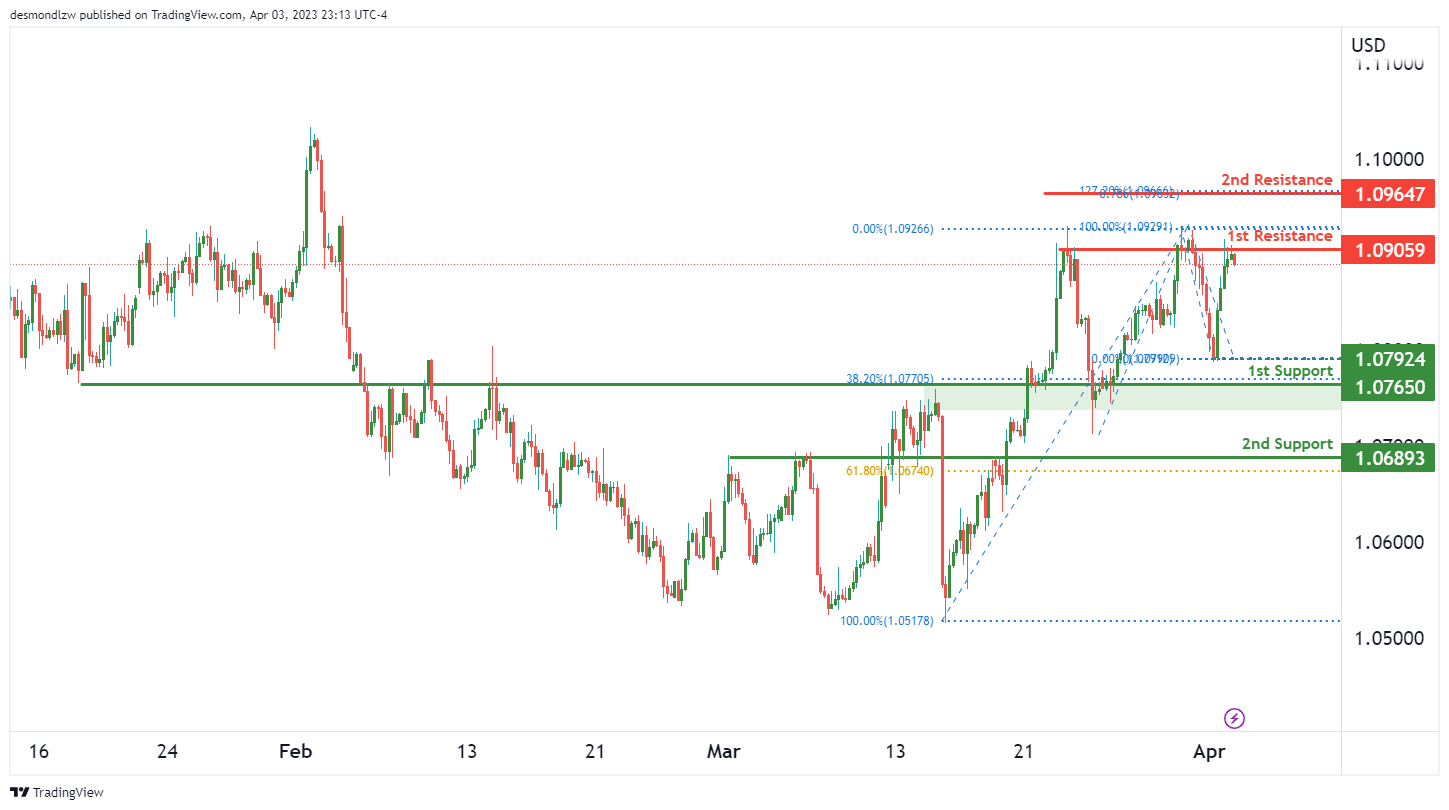
On the EUR/USD chart, the overall momentum is bearish, indicating a potential for a bearish reaction from the 1st resistance level. The 1st resistance level is at 1.0905, which is a multi-swing high resistance level. If price were to drop from this level, it could potentially reach the 1st support level at 1.0765. This level is a strong overlap support that also coincides with a 38.20% Fibonacci retracement.
The 2nd support level is at 1.0689, which is another overlap support level that coincides with a 61.80% Fibonacci retracement.
On the resistance side, the 2nd resistance level is at 1.0964, which is a swing high resistance level that coincides with a 127.20% Fibonacci extension. The 1st support level is at 1.0792, which is a swing low support level.
GBP/USD:
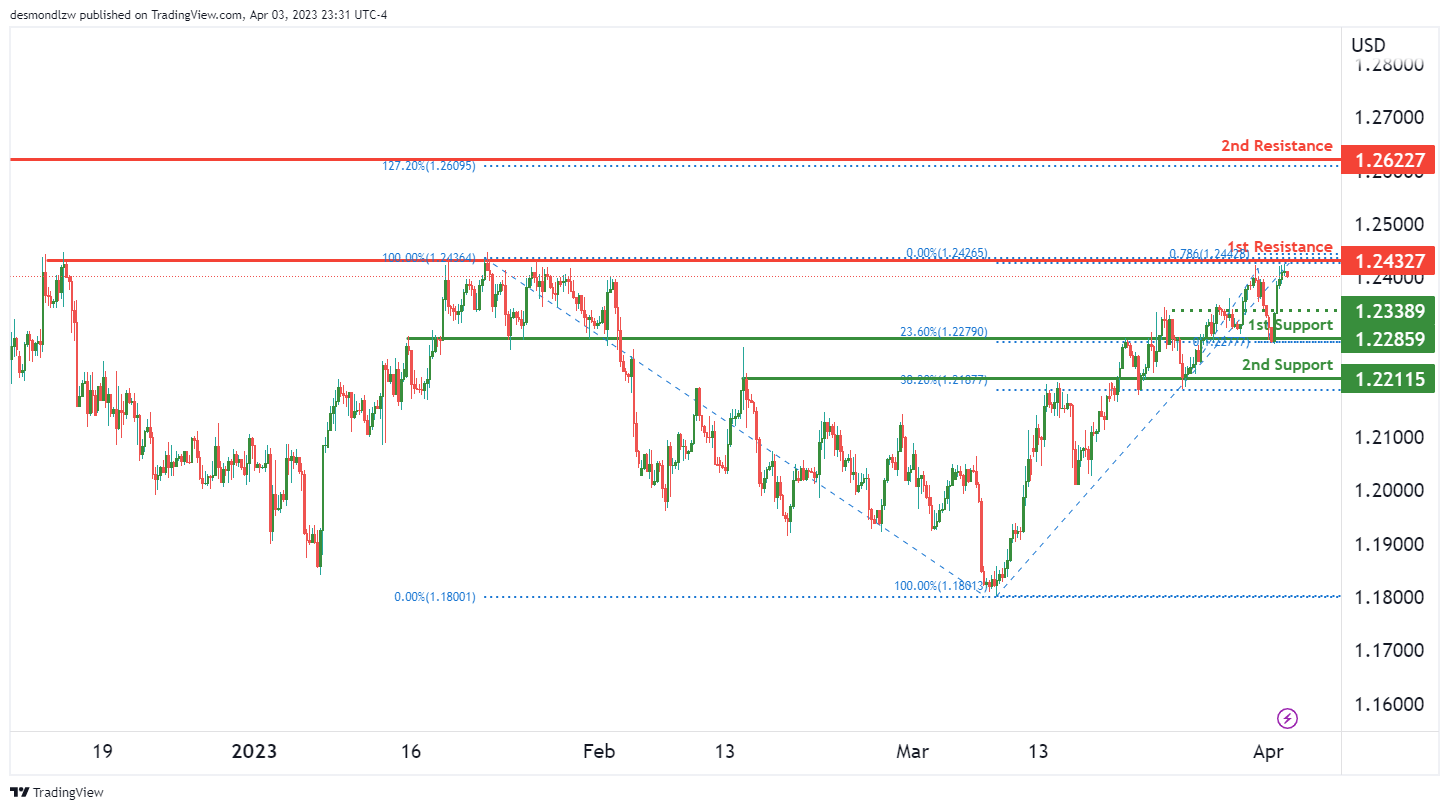
The overall momentum of the GBP/USD chart is bearish. Price could potentially make a bearish reaction off the 1st resistance and drop to the 1st support. The 1st support is at 1.2285, which is an overlap support level and has a 23.60% Fibonacci retracement lining up with it. Additionally, the 2nd support at 1.2211 is another overlap support level with a 38.20% Fibonacci retracement.
On the resistance side, the 1st resistance level is at 1.2432, which is a multi-swing high resistance level. This level coincides with a 78.60% Fibonacci projection. The 2nd resistance level is at 1.2622, which is a swing high resistance level that coincides with a 127.20% Fibonacci extension.
There is also an intermediate support level at 1.2338, which is an overlap support level. If price were to break below the 1st support level, the next level it could drop to is the 2nd support level. Conversely, if price were to break above the 1st resistance level, it could potentially rise towards the 2nd resistance level.
USD/CHF:
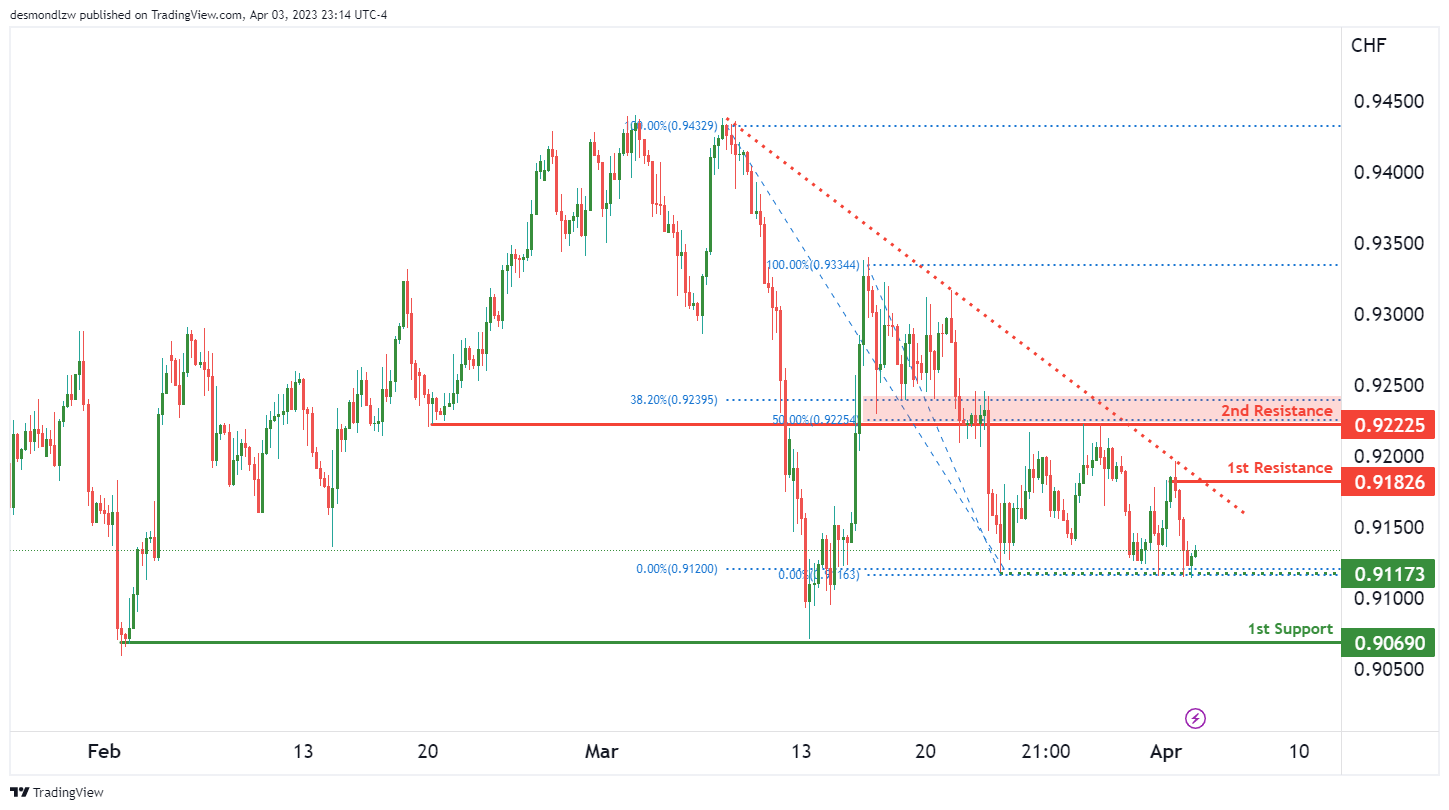
The USD/CHF chart is currently showing a bearish momentum as it is below a major descending trend line. However, there is potential for a bullish bounce off the 1st support level towards the 1st resistance level.
The 1st support level is at 0.9069, which is a swing low support. This level provides a good potential for a bullish bounce if price were to reach this level.
Additionally, there is an intermediate support level at 0.9117, which is a multi-swing low support. This level also adds further confluence to the potential bullish bounce.
On the upside, the 1st resistance level is at 0.9182, which is a swing high resistance. This level could potentially act as a barrier for price to push higher, but if it were to break above this level, price could continue to rise towards the next resistance level.
The 2nd resistance level is at 0.9222, which is an overlap resistance level. This level coincides with the 50% Fibonacci retracement, adding further confluence to this level.
It’s worth noting that there is also an intermediate support level at 1.2338, which is an overlap support level.
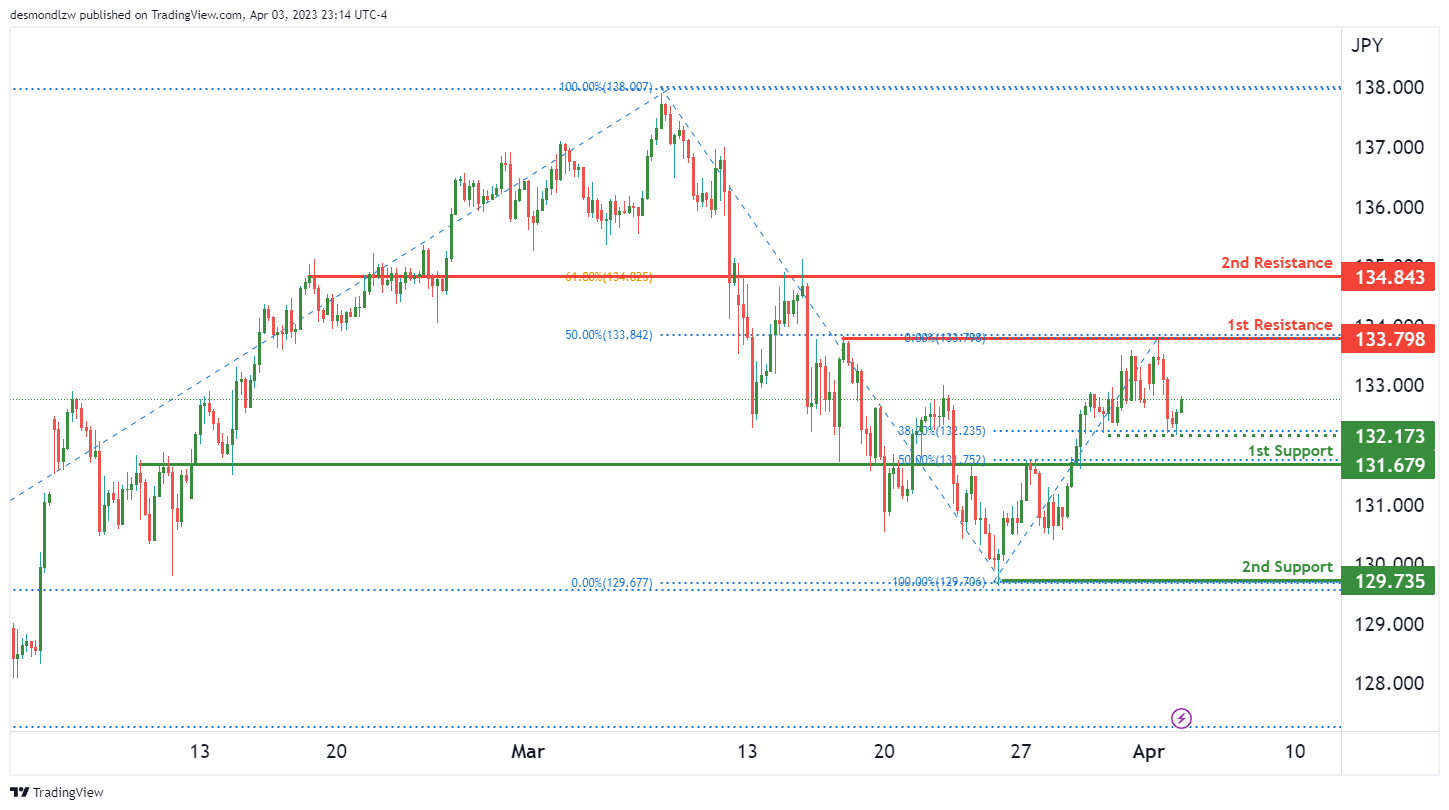
USD/JPY:
The USD/JPY chart, the overall momentum is bullish. There is a potential for a bullish continuation towards the first resistance level. The first support level is at 131.67, which is an overlap support level with a 50% Fibonacci retracement lining up with it. Additionally, the second support level is at 129.73, which is a swing low support level.
On the upside, the first resistance level is at 133.79, which is a multi-swing high resistance and coincides with a 50% Fibonacci retracement. The second resistance level is at 134.84, which is an overlap resistance and has a 61.80% Fibonacci retracement lining up with it.
There is also an intermediate support level at 132.17, which is a multi-swing low support. This level may also provide additional support for the potential bullish continuation.
AUD/USD:
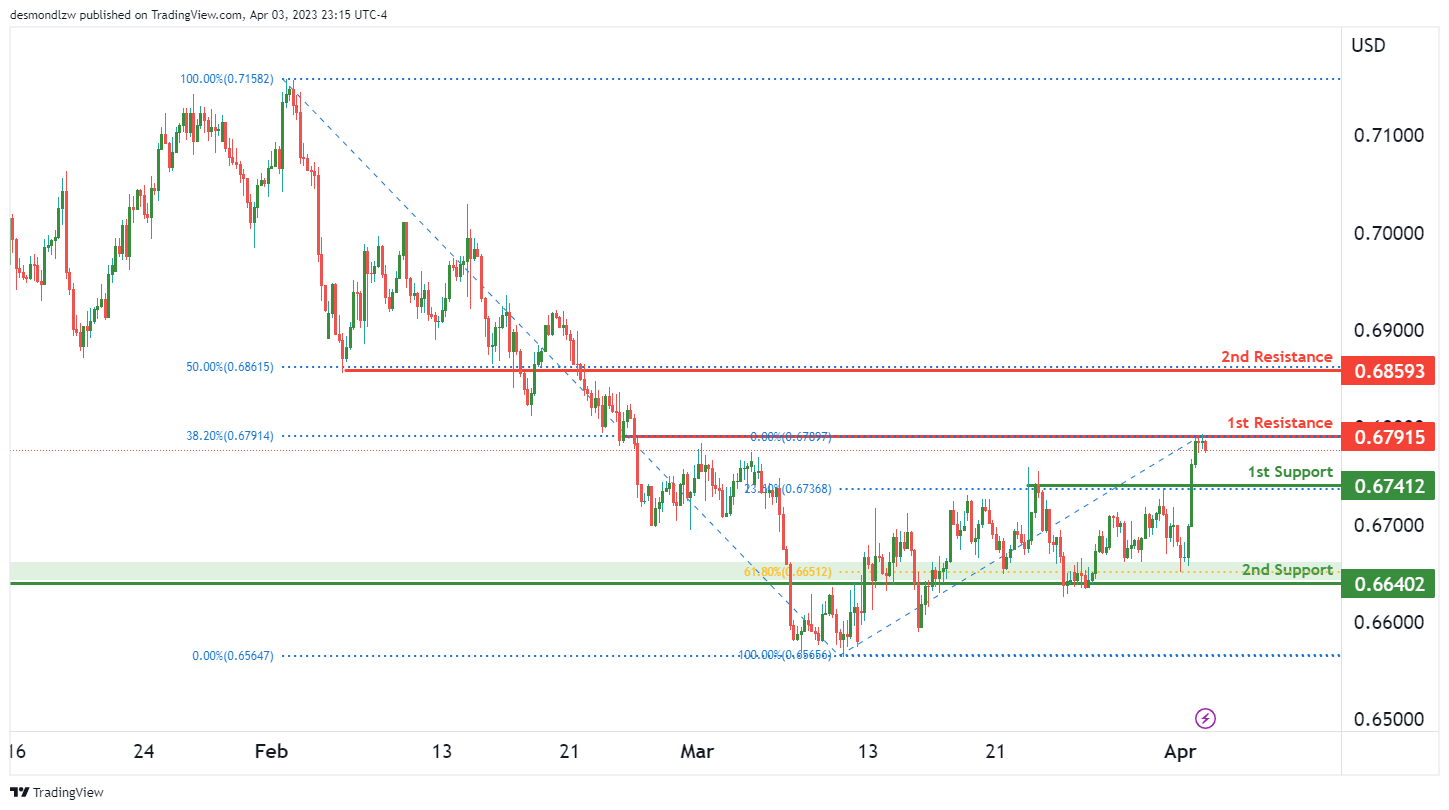
The AUD/USD chart shows a bearish momentum, with price potentially reacting bearishly towards the 1st support after reaching the 1st resistance. The 1st support level is at 0.6741, which is a pullback support level and also has a 23.60% Fibonacci retracement lining up with it. The 2nd support level is at 0.6640, an overlap support level that has a 61.80% Fibonacci retracement.
On the other hand, the 1st resistance level is at 0.6791, which is a multi-swing high resistance level that also has a 38.20% Fibonacci retracement. The 2nd resistance level is at 0.6859, an overlap resistance level with a 50% Fibonacci retracement.
It’s worth noting that the overall momentum of the chart is bearish, which could result in a bearish reaction towards the 1st support level after reaching the 1st resistance level.
NZD/USD:
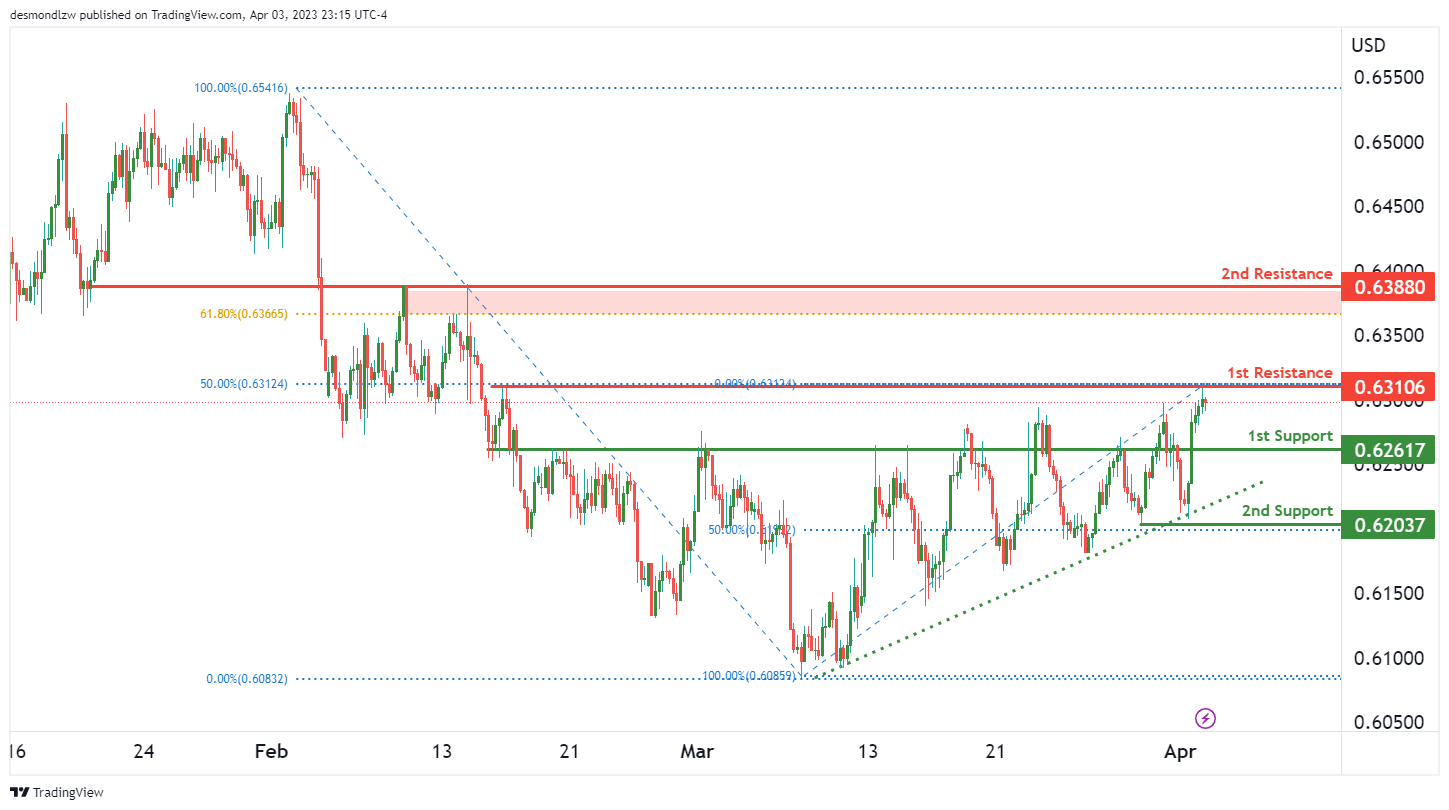
NZD/USD chart shows bullish momentum as it’s above a major ascending trend line, suggesting further bullish potential. However, price could potentially make a bearish reaction off the 1st resistance and drop to the 1st support.
The 1st support is at 0.6261, which is a strong overlap support level. If price were to drop from the 1st resistance, it could head towards this level. The 2nd support is at 0.6203, which is a multi-swing low support level that could provide additional support for price.
On the other hand, the 1st resistance is at 0.6310, which is a multi-swing high resistance level that coincides with the 50% Fibonacci retracement level. If price were to bounce from the 1st support, it could potentially rise towards this level. The 2nd resistance is at 0.6388, which is an overlap resistance level that coincides with the 61.80% Fibonacci retracement level.
It’s important to note that the bullish momentum is supported by the major ascending trend line, but a bearish reaction off the 1st resistance could lead to a drop towards the support levels.
USD/CAD:
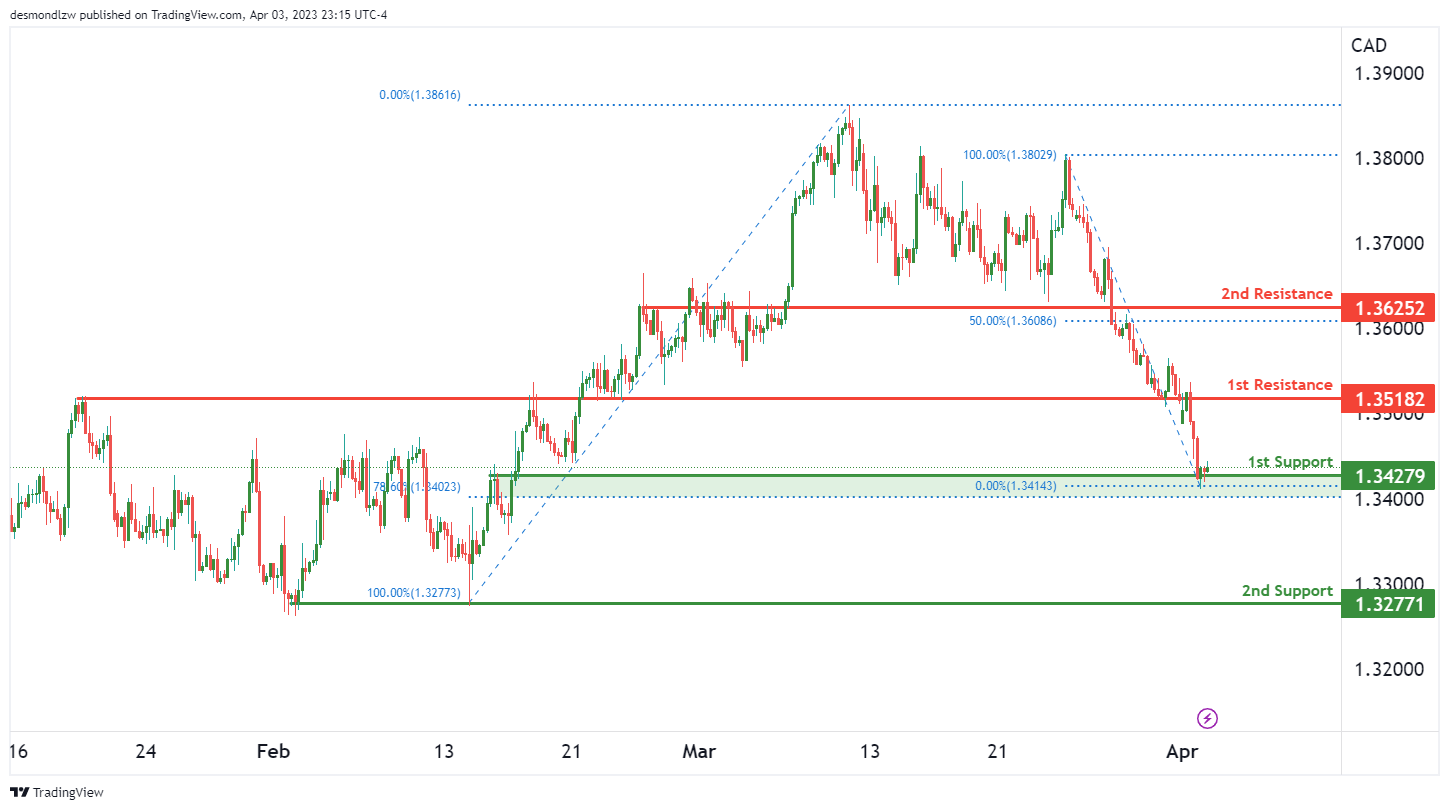
The USD/CAD chart is showing bullish momentum with the price potentially making a bullish bounce off the 1st support level towards the 1st resistance level. The 1st support level is located at 1.3427 and is a strong overlap support level that coincides with a 78.60% Fibonacci retracement. Additionally, there is a 2nd support level located at 1.3277 which is a multi-swing low support level. On the other hand, the 1st resistance level is located at 1.3518 and is another strong overlap resistance level. Furthermore, there is a 2nd resistance level at 1.3625 which is also an overlap resistance level that coincides with a 50% Fibonacci retracement.
It’s worth noting that the overall bias of the chart is bullish, and there is a potential for the price to rise from the 1st support level to the 1st resistance level. However, if the price breaks the 1st support level, the next support level it could drop to is the 2nd support level at 1.3277.
Additionally, it’s important to consider the chart’s momentum. The chart is currently showing bullish momentum and this could support a bullish bounce off the 1st support level.
DJ30:
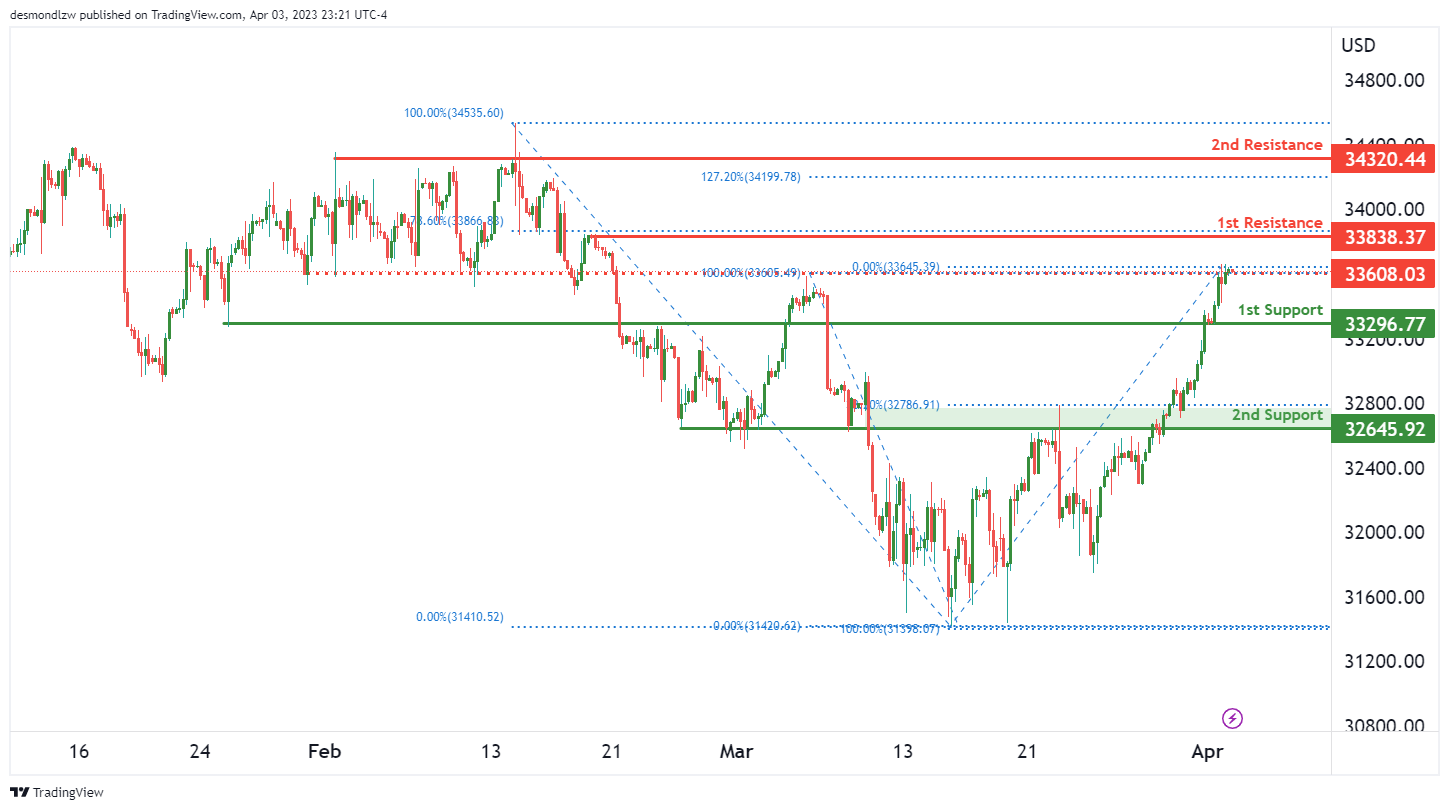
The DJ30 chart is showing bearish momentum with potential for a bearish reaction off the 1st resistance level. The 1st support level at 33296 is a strong overlap support, which could potentially provide a bounce if price were to drop to this level. If the 1st support level is broken, price could potentially drop to the 2nd support level at 32645, which is also an overlap support.
On the resistance side, the 1st resistance level at 33838 is a swing high resistance, and is also supported by a 78.60% Fibonacci retracement level. If price were to break above this level, it could potentially rise towards the 2nd resistance level at 34320, which is a multi-swing high resistance and is also supported by a 127.20% Fibonacci extension level. There is an intermediate resistance level at 33608, which is an overlap resistance and could potentially act as a barrier to price movement towards the 1st resistance level.
GER30:
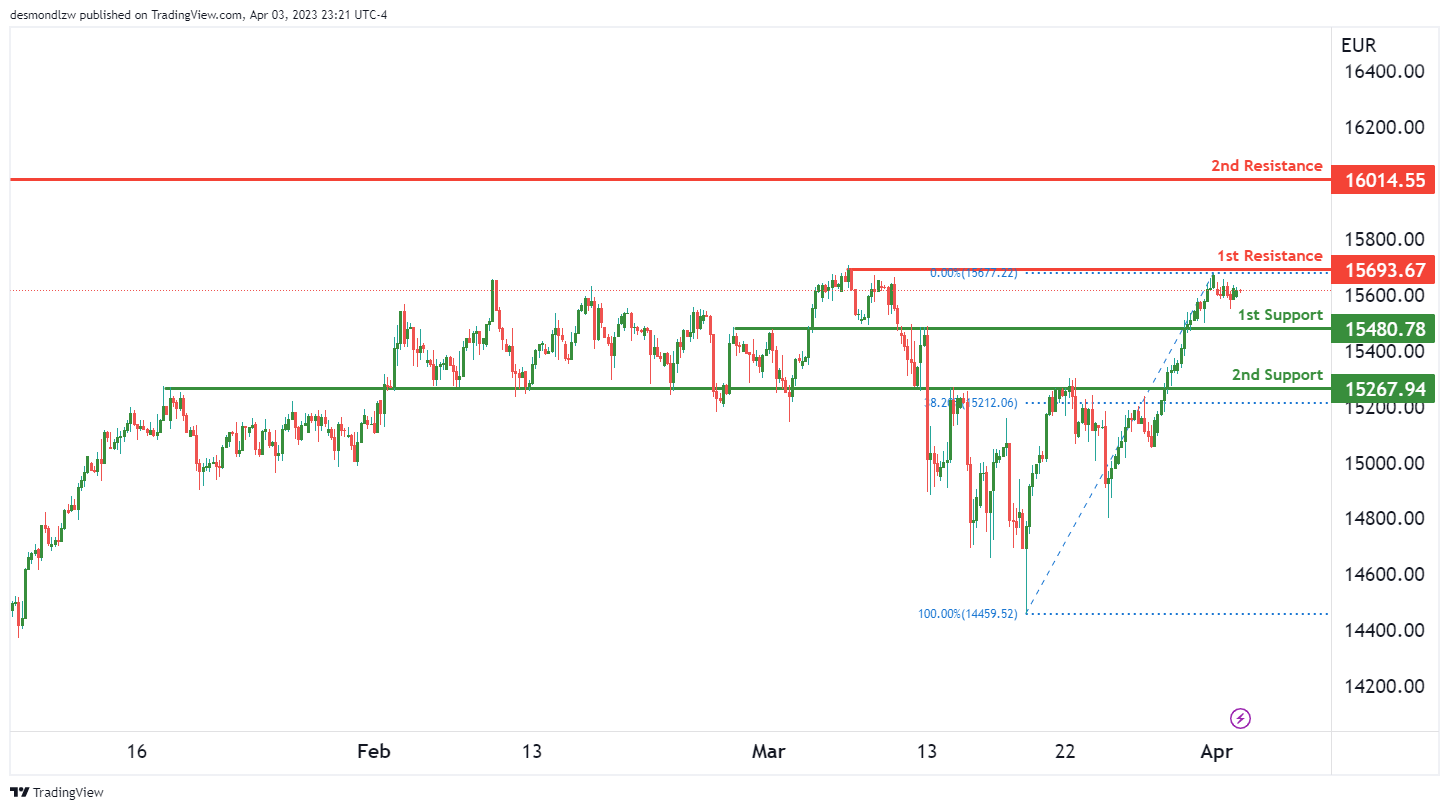
The German DAX 30 index (GER30) has been experiencing a bearish momentum, with prices potentially continuing to fall towards the 1st support level.
Currently, the overall momentum of the chart is bearish, and the price is potentially making a bearish continuation towards the 1st support level at 15480.78. This support level is an overlap support, providing a strong reason to believe it will hold. In addition, there is a 38.20% Fibonacci retracement lining up with the 2nd support level at 15267.94, making it another good support level to watch.
On the resistance side, the 1st resistance level is at 15693.67, which is a multi-swing high resistance level that could prevent price from rising. If the price breaks above this level, the next resistance level is at 16014.55, which is a swing high resistance level.
Based on the current bearish momentum and the strong support levels, it is likely that prices will continue to drop towards the 1st support level. However, if the price breaks above the 1st resistance level, it could potentially rise towards the 2nd resistance level.
BTC/USD:
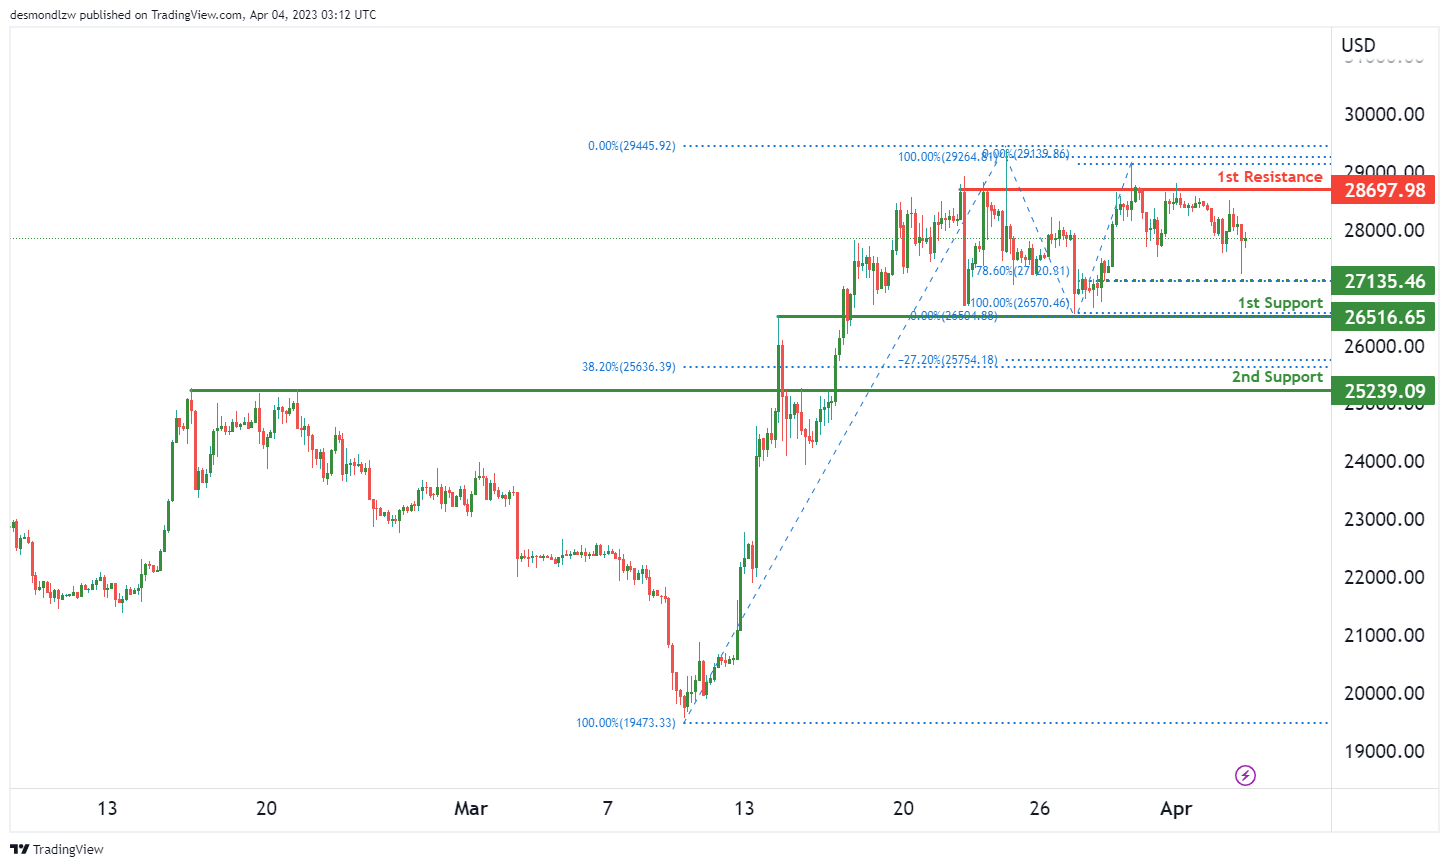
The BTC/USD chart is bearish, which suggests that the cryptocurrency might continue to experience downward pressure in the near term.
Looking at the support and resistance levels, price could potentially make a bearish continuation towards the first support level at 26516.65, which is an overlap support. If price were to break below that level, it could drop further to the second support level at 25239.09, which is also an overlap support and lines up with the 38.20% Fibonacci retracement.
On the other hand, if price were to rebound from the current levels, it may face resistance at the first resistance level of 28697.98, which is a multi-swing high resistance.
It’s worth noting that there is an intermediate support at 27135.46, which is a swing low support. If price were to drop below this level, it could potentially trigger a stronger bearish acceleration towards the support levels mentioned earlier.
US500
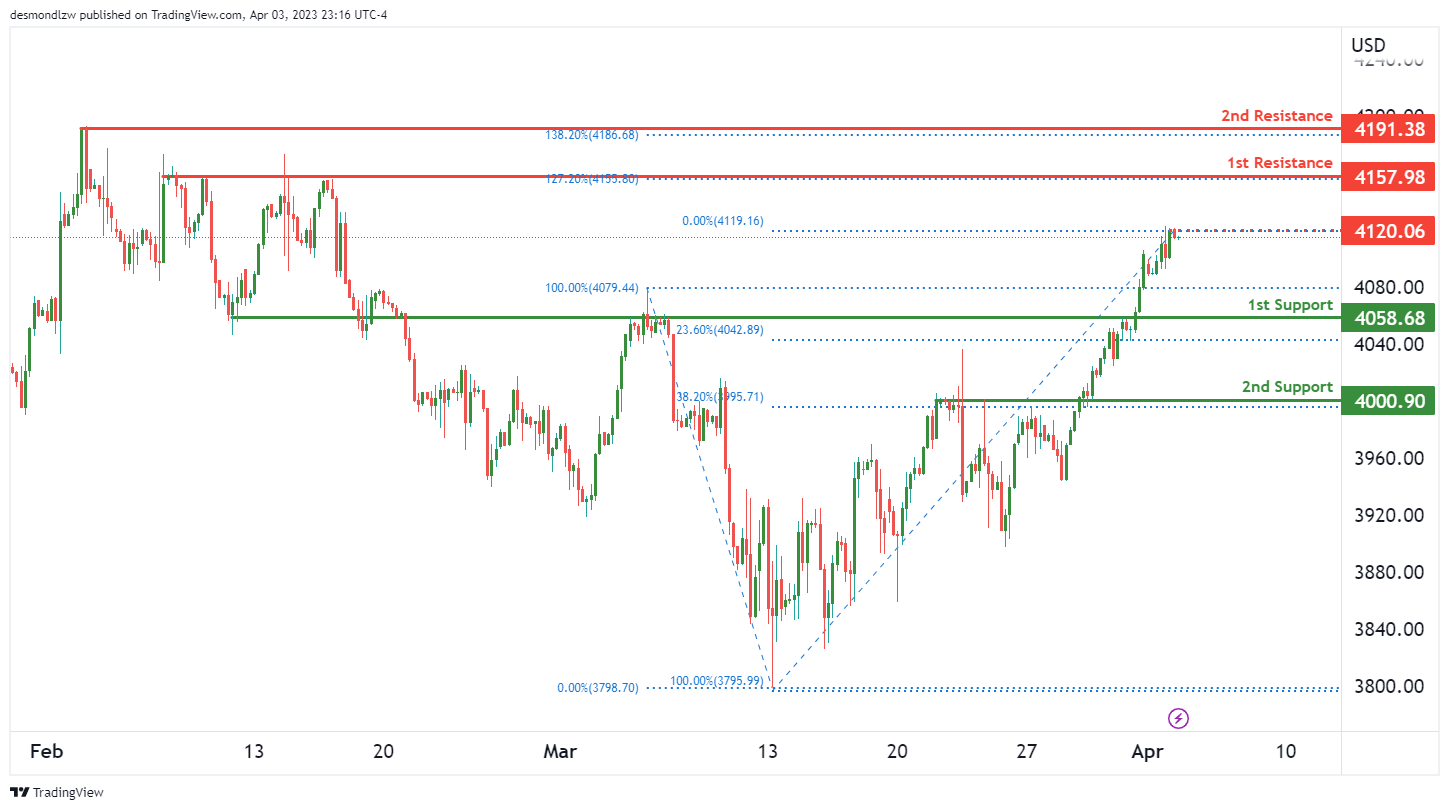
The overall momentum of the US500 chart is bullish. There is potential for the price to continue its bullish momentum towards the 1st resistance level of 4157.98.
The 1st support level at 4058.68 is a good level as it is a pullback support and coincides with the 23.60% Fibonacci retracement. The 2nd support level at 4000.90 is also a good level as it is a pullback support and coincides with the 38.20% Fibonacci retracement.
The 1st resistance level at 4157.98 is a strong multi-swing high resistance and coincides with the 127.20% Fibonacci extension. The 2nd resistance level at 4191.38 is also a good level as it is a swing high resistance and coincides with the 138.20% Fibonacci extension.
In addition, there is an intermediate resistance level at 4120.06, which can act as a potential barrier for the price.
ETH/USD:
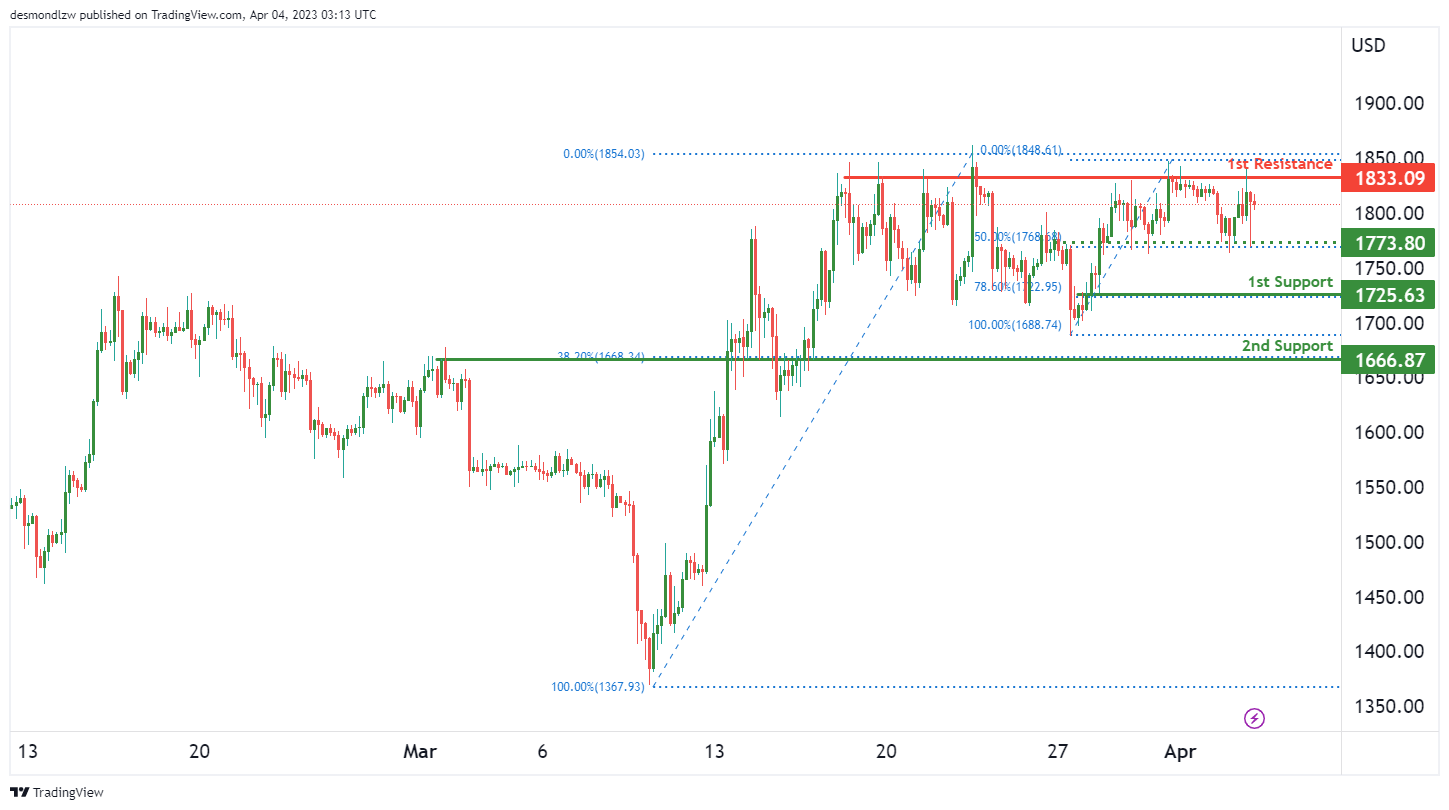
The overall momentum of the ETH/USD chart appears to be bearish at the moment, as the price is showing signs of a potential continuation towards the first support level. Let’s take a closer look at the support and resistance levels to get a better idea of where the price may be headed next.
The first support level is located at 1725.63, which is a strong overlap support level and coincides with a 78.60% Fibonacci retracement. This level could potentially provide a bounce for the price and act as a support level in case of a further downtrend.
If the price were to break below the first support level, the next support level to watch for is at 1666.87, which is another overlap support level and lines up with a 38.20% Fibonacci retracement. This level has acted as a support level multiple times in the past and could potentially do so again in the future.
On the resistance side, the first level to watch for is at 1833.09, which is a multi-swing high resistance level. If the price were to break above this level, it could potentially indicate a bullish reversal and lead to further upside.
An intermediate support level to watch for is at 1773.80, which is another overlap support level and lines up with a 50% Fibonacci retracement. This level could potentially act as a support level in case of a minor pullback.
WTI/USD:
The overall momentum of the WTI chart is currently bearish, suggesting that prices could continue to move lower. Looking at the chart, we can see that the price could potentially make a bearish continuation towards the first support level.
The first support level is at 77.05, which is a swing low support that lines up with a 23.60% Fibonacci retracement. This level could potentially act as a support for the price and prevent it from falling further. The second support level is at 73.88, which is a pullback support.
On the upside, the first resistance level is at 82.35, which is a multi-swing high resistance. If the price were to break above this level, it could potentially rise towards the second resistance level at 86.86, which is a swing high resistance that lines up with a 127.20% Fibonacci extension.
XAU/USD (GOLD):
XAU/USD’s Bearish Momentum Could Push Prices Towards First Support
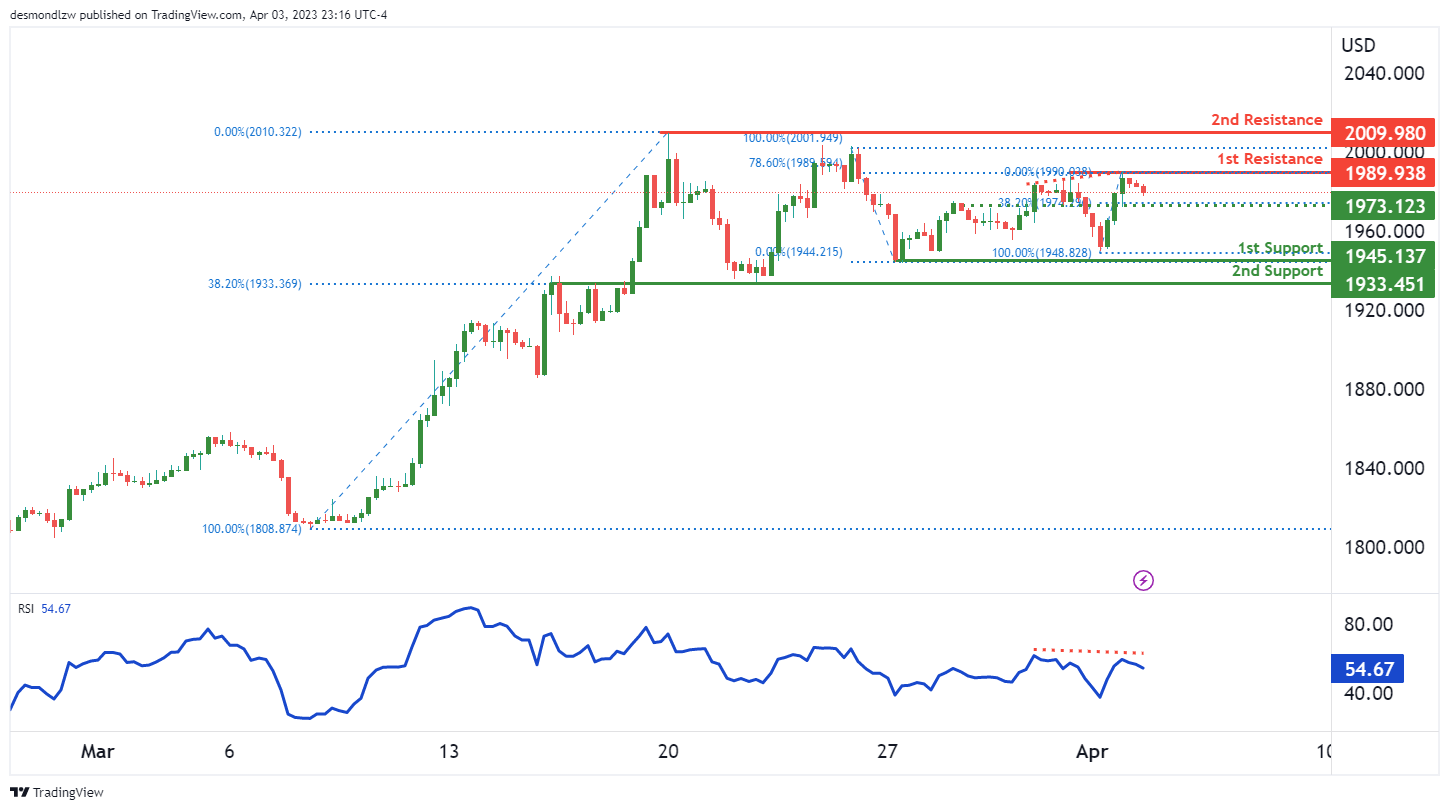
Gold has been facing bearish momentum on the chart against the US Dollar, as reflected by the multi-swing high resistance at 1789.00. The overall bias is bearish, and the precious metal could continue to fall towards the first support at 1945.00.
The first support level is a multi-swing low support, which could provide some strength to the price action. If the price fails to hold this support, it may drop further to the second support at 1933.00. This level is an overlap support and coincides with the 38.20% Fibonacci retracement.
On the upside, the first resistance level is a multi-swing high resistance at 1789.00. A bullish breakout above this level could indicate a trend reversal, but until then, the momentum remains bearish. The second resistance level is a swing high resistance at 2009.00.
An intermediate support level at 1973.00 may offer some relief to the bearish trend. This level is an overlap support and coincides with the 38.20% Fibonacci retracement.
It’s worth noting that the RSI is displaying bearish divergence versus price, which could suggest that a reversal might occur soon.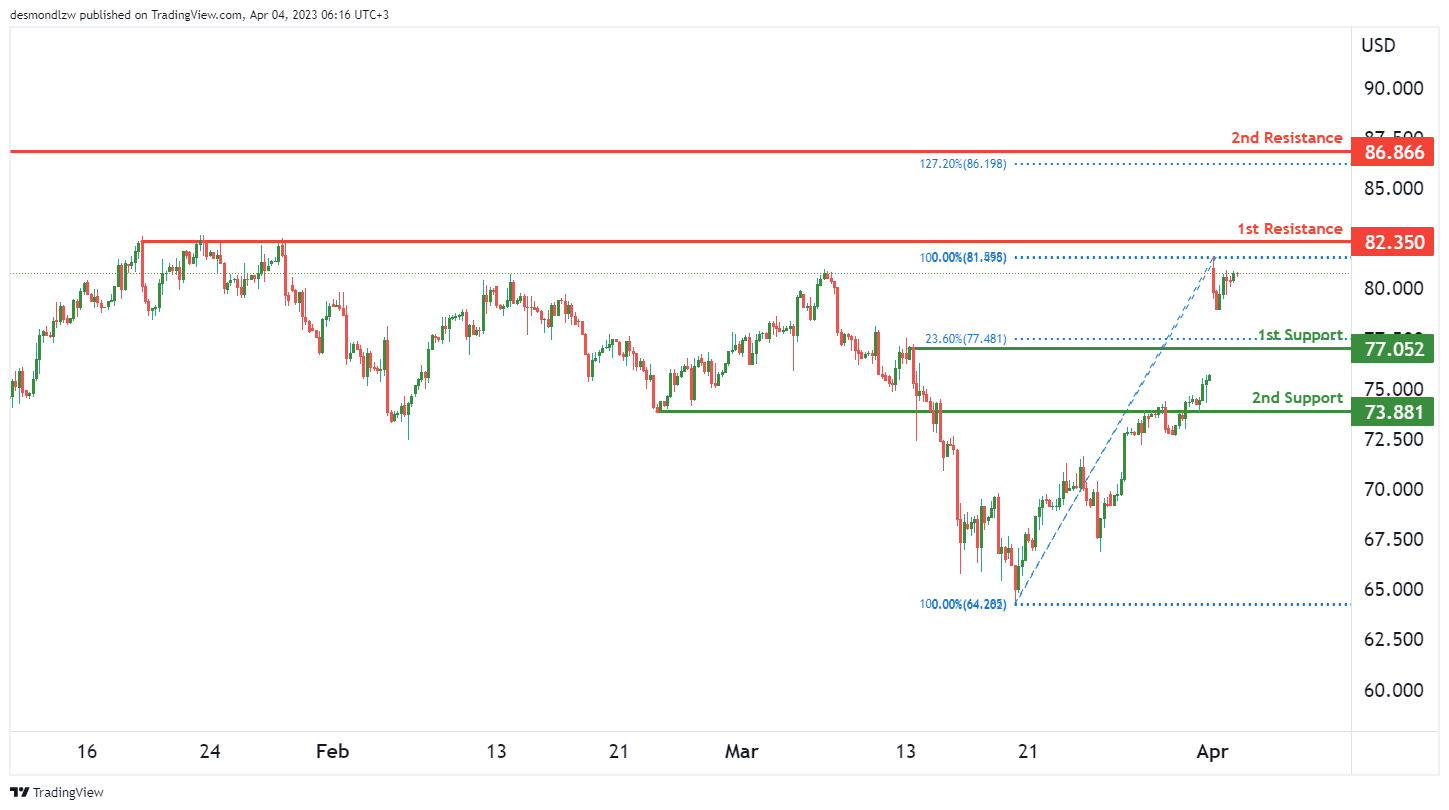
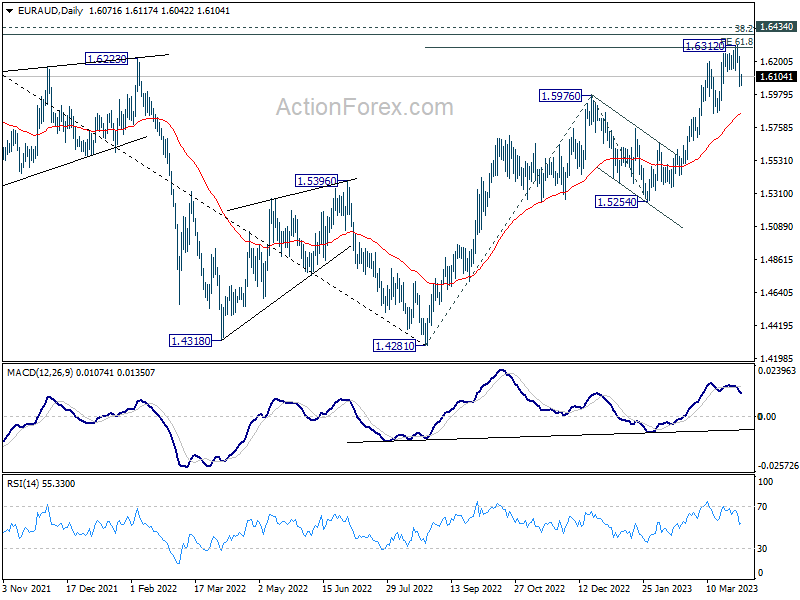
EUR/AUD Daily Outlook
Daily Pivots: (S1) 1.5988; (P) 1.6114; (R1) 1.6192; More...
EUR/AUD recovers after drawing support from 1.6053 and intraday bias remains neutral first. Focus stays on 0.6389/6434 cluster resistance zone. Decisive break there will carry larger bullish implications. However, firm break of 1.6053 will confirm short term topping, after rejection by the mentioned resistance. Intraday bias will be turned back to the downside for 1.5848 support and possibly below.
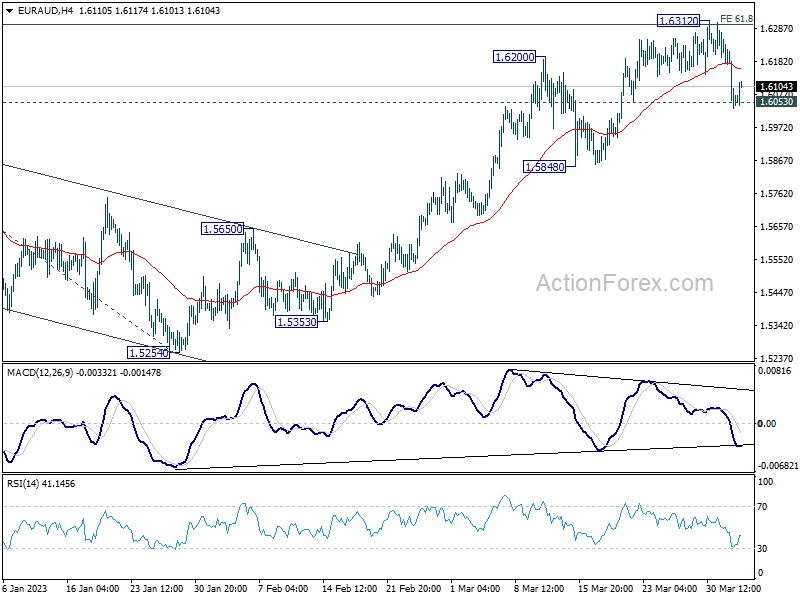
In the bigger picture, focus stays on 1.6389/6434 cluster resistance (38.2% retracement of 1.9799 to 1.4281 at 1.6389). Sustained break there should confirm that whole down trend from 1.9799 (2020 high) has completed. Further rally should then be seen to 61.8% retracement at 1.7691. However, rejection by this cluster resistance will make medium term outlook neutral at best.
Australian Dollar Weakens Post-RBA Decision, Other Commodity Currencies Stay Firm
Australian Dollar finds itself on a broad-based downward trajectory following RBA's decision to maintain interest rates unchanged. Despite maintaining a tightening bias, RBA's announcement fell short of some speculations for a more hawkish outcome. In contrast, fellow commodity currencies, New Zealand Dollar and Canadian Dollar, continue to display strength. Kiwi is bracing for the upcoming RBNZ rate hike tomorrow, while Loonie rides the wave of this week's oil price rally.
Across the currency market, Dollar emerges as the week's weakest performer so far, trailed by Yen and Swiss Franc. Market sentiment appears to be leaning towards a risk-on scenario. Euro and British Pound are mixed but look poised to extend their recent rallies against the US Dollar.
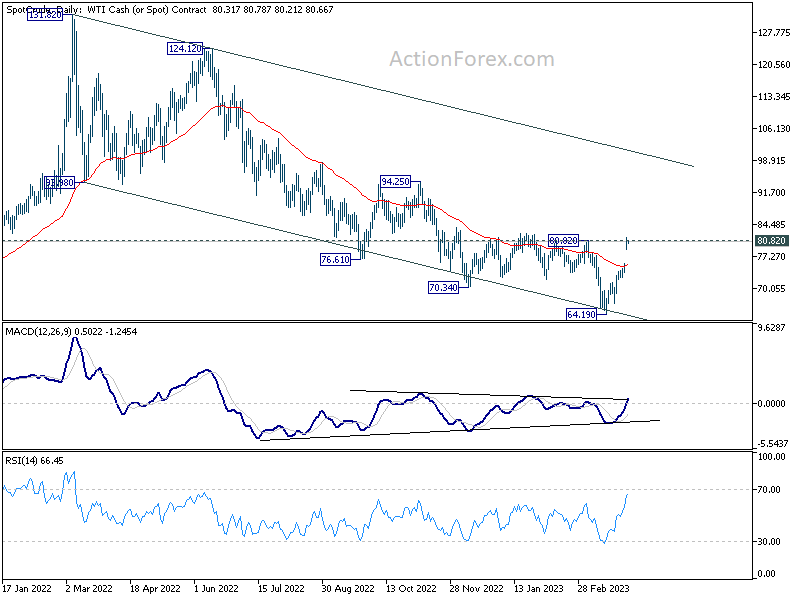
On the technical front, WTI crude oil garners significant attention. While it has yet to firmly break through the 80 mark, its pullback from this week's high of $81.54 remains modest. A sustained break of 80.82 resistance level could signal a bullish trend reversal, potentially pushing prices up to next resistance at 94.25. Murmurs of WTI crude oil climbing back to 100 has also started to circulate. Nevertheless, an extended rally might trigger a complex chain reaction, impacting inflation and interest rate expectations, which could then reverberate through stock and bond markets.
In Asia, at the time of writing, Nikkei is up 0.31%. Hong Kong HSI is down -0.64%. China Shanghai SSE is up 0.24%. Singapore Strait Times is up 0.79%. Japan 10-year JGB yield is up 0.215 at 0.392. Overnight, DOW rose 0.98%. S&P 500 rose 0.37%. NASDAQ dropped -0.27%. 10-year yield dropped -0.064 to 3.430.
RBA holds cash rate steady, maintains tightening bias
RBA has decided to keep the cash rate target unchanged at 3.60% amid ongoing uncertainty, but maintained its tightening bias. The central bank stated that some further tightening might be necessary, depending on developments in the global economy, household spending, inflation, and the labor market outlook.
In the official statement, RBA noted, "The Board expects that some further tightening of monetary policy may well be needed to ensure that inflation returns to target."
RBA's central forecast anticipates inflation to decline over the next couple of years, reaching around 3% by mid-2025. The statement highlighted that "medium-term inflation expectations remain well anchored, and it is important that this remains the case."
Despite the slowing growth in the Australian economy, labor market remains very tight. However, as economic growth slows, RBA expects unemployment to increase. The Board remains alert to the risk of a "price-wages spiral", given the limited spare capacity in the economy and the historically low rate of unemployment.
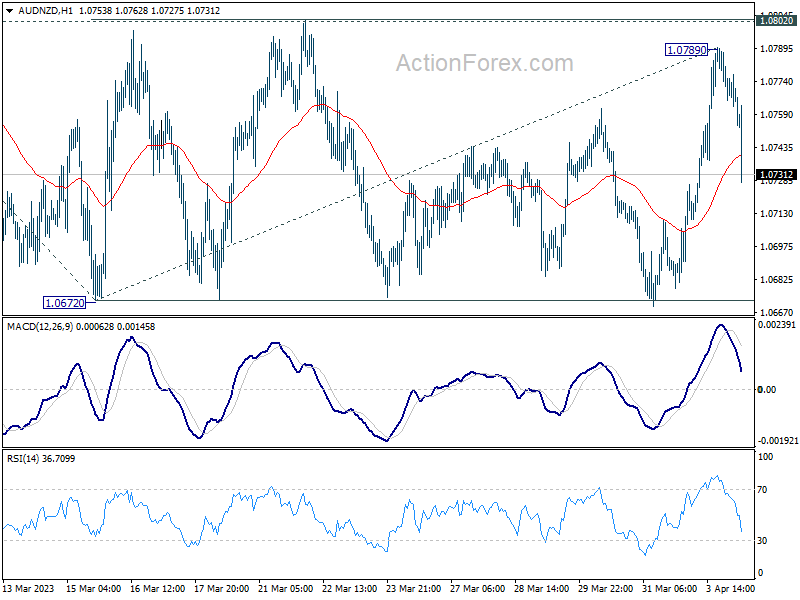
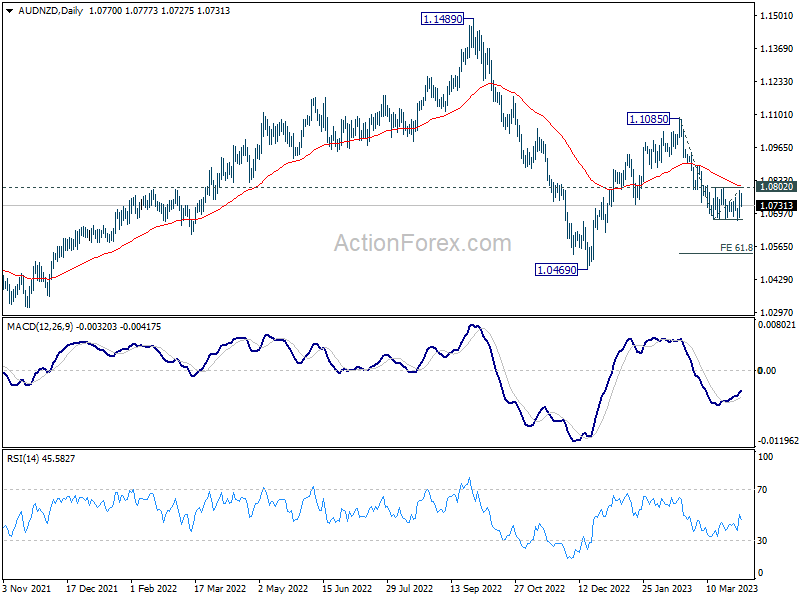
AUD/NZD falling back towards 1.0672 after RBA
AUD/NZD falls notably after RBA announced to leave interest rates unchanged. Yesterday's rebound was primarily driven by speculation of a hawkish surprise from RBA. However, with RBA's decision now public, market focus shifts to RBNZ upcoming rate hike and whether the statement would be hawkish enough to push AUD/NZD below 1.0672 short-term bottom.
From a technical perspective, the near-term outlook for AUD/NZD remains bearish as the 1.0802 resistance level remains intact, further supported by the currency pair's rejection by the 55 day EMA. The decline from 1.1085 is expected to resume sooner rather than later, and a firm break below 1.0672 level would confirm resumption of the fall. This could ultimately lead the currency pair towards 61.8% projection of 1.1085 to 1.0672 from 1.0789 at 1.0534.
Fed Cook weighs economic momentum against headwinds
In a speech yesterday, Fed Governor Lisa Cook discussed her considerations for the future path of monetary policy, weighing the implications of stronger economic momentum against potential headwinds from recent banking developments.
Cook explained, "On the one hand, if tighter financing conditions restrain the economy, the appropriate path of the federal funds rate may be lower than it would be in their absence. On the other hand, if data show continued strength in the economy and slower disinflation, we may have more work to do."
Regarding Fed's strategy on rate hikes, Cook mentioned that FOMC has been raising rates in smaller increments, aiming for a sufficiently restrictive monetary policy to return inflation to 2% over time. She emphasized the benefit of taking smaller steps, as it allows Fed to observe economic and financial conditions and evaluate the cumulative effects of their policy actions.
Cook also touched on FOMC's recent adjustments to its forward guidance on the path of the policy rate in its March statement. The committee shifted from anticipating "ongoing increases" to stating that "some additional policy firming may be appropriate." Cook believes this communication is suitable as Fed seeks to calibrate monetary policy amid uncertainty about the economic outlook.
SNB Schlegel reiterates commitment to price stability and willingness to intervene
SNB Vice Chairman Martin Schlegel emphasized the central bank's commitment to price stability in an interview with Swiss broadcaster SRF yesterday. He stated, "Our mandate is crystal clear, and that is price stability," adding that SNB will do everything possible to bring inflation back to the target range of 0 to 2%.
Although Schlegel refrained from making any forecasts, he noted that SNB's inflation forecasts are higher now than they were in December, adding that the central bank is prepared to "continue to raise interest rates" if necessary.
Schlegel also addressed SNB's willingness to sell foreign currencies in order to strengthen Swiss franc. He said, "We said quite clearly at the last assessment that we are also prepared to sell foreign currencies, to actually strengthen the franc."
He revealed that SNB had already sold CHF 27B worth of foreign currencies in the last quarter, asserting that the bank will continue to monitor the exchange rate and intervene if necessary.
Looking ahead
Germany trade balance and Eurozone PPI will be released in European session. Later in the day, Canada building permits and US factor orders will be featured.
EUR/AUD Daily Outlook
Daily Pivots: (S1) 1.5988; (P) 1.6114; (R1) 1.6192; More...
EUR/AUD recovers after drawing support from 1.6053 and intraday bias remains neutral first. Focus stays on 0.6389/6434 cluster resistance zone. Decisive break there will carry larger bullish implications. However, firm break of 1.6053 will confirm short term topping, after rejection by the mentioned resistance. Intraday bias will be turned back to the downside for 1.5848 support and possibly below.
In the bigger picture, focus stays on 1.6389/6434 cluster resistance (38.2% retracement of 1.9799 to 1.4281 at 1.6389). Sustained break there should confirm that whole down trend from 1.9799 (2020 high) has completed. Further rally should then be seen to 61.8% retracement at 1.7691. However, rejection by this cluster resistance will make medium term outlook neutral at best.
Economic Indicators Update
| GMT | Ccy | Events | Actual | Forecast | Previous | Revised |
|---|---|---|---|---|---|---|
| 22:00 | NZD | NZIER Business Confidence Q1 | -66 | -70 | ||
| 23:50 | JPY | Monetary Base Y/Y Mar | -1.00% | 2.00% | -1.60% | |
| 04:30 | AUD | RBA Interest Rate Decision | 3.60% | 3.60% | 3.60% | |
| 06:00 | EUR | Germany Trade Balance (EUR) Feb | 16.9B | 16.7B | ||
| 09:00 | EUR | Eurozone PPI M/M Feb | -0.30% | -2.80% | ||
| 09:00 | EUR | Eurozone PPI Y/Y Feb | 13.50% | 15.00% | ||
| 12:30 | CAD | Building Permits M/M Feb | 2.20% | -4.00% | ||
| 14:00 | USD | Factory Orders M/M Feb | -0.30% | -1.60% |
AUD/NZD falling back towards 1.0672 after RBA
AUD/NZD falls notably after RBA announced to leave interest rates unchanged. Yesterday's rebound was primarily driven by speculation of a hawkish surprise from RBA. However, with RBA's decision now public, market focus shifts to RBNZ upcoming rate hike and whether the statement would be hawkish enough to push AUD/NZD below 1.0672 short-term bottom.
From a technical perspective, the near-term outlook for AUD/NZD remains bearish as the 1.0802 resistance level remains intact, further supported by the currency pair's rejection by the 55 day EMA. The decline from 1.1085 is expected to resume sooner rather than later, and a firm break below 1.0672 level would confirm resumption of the fall. This could ultimately lead the currency pair towards 61.8% projection of 1.1085 to 1.0672 from 1.0789 at 1.0534.
RBA holds cash rate steady, maintains tightening bias
RBA has decided to keep the cash rate target unchanged at 3.60% amid ongoing uncertainty, but maintained its tightening bias. The central bank stated that some further tightening might be necessary, depending on developments in the global economy, household spending, inflation, and the labor market outlook.
In the official statement, RBA noted, "The Board expects that some further tightening of monetary policy may well be needed to ensure that inflation returns to target."
RBA's central forecast anticipates inflation to decline over the next couple of years, reaching around 3% by mid-2025. The statement highlighted that "medium-term inflation expectations remain well anchored, and it is important that this remains the case."
Despite the slowing growth in the Australian economy, labor market remains very tight. However, as economic growth slows, RBA expects unemployment to increase. The Board remains alert to the risk of a "price-wages spiral", given the limited spare capacity in the economy and the historically low rate of unemployment.
(RBA) Statement by Philip Lowe, Governor: Monetary Policy Decision
At its meeting today, the Board decided to leave the cash rate target unchanged at 3.60 per cent and the interest rate on Exchange Settlement balances unchanged at 3.50 per cent.
This decision follows a cumulative increase in interest rates of 3½ percentage points since May last year. The Board recognises that monetary policy operates with a lag and that the full effect of this substantial increase in interest rates is yet to be felt. The Board took the decision to hold interest rates steady this month to provide additional time to assess the impact of the increase in interest rates to date and the economic outlook.
Global inflation remains very high. In headline terms it is moderating, although services price inflation remains high in many economies. The outlook for the global economy remains subdued, with below-average growth expected this year and next. The recent banking system problems in the United States and Switzerland have resulted in volatility in financial markets and a reassessment of the outlook for global interest rates. These problems are also expected to lead to tighter financial conditions, which would be an additional headwind for the global economy.
The Australian banking system is strong, well capitalised and highly liquid. It is well placed to provide the credit that the economy needs.
A range of information, including the monthly CPI indicator, suggests that inflation has peaked in Australia. Goods price inflation is expected to moderate over the months ahead due to global developments and softer demand in Australia. Meanwhile, rents are increasing at the fastest rate in some years, with vacancy rates low in many parts of the country. The prices of utilities are also rising quickly. The central forecast is for inflation to decline this year and next, to around 3 per cent in mid-2025. Medium-term inflation expectations remain well anchored, and it is important that this remains the case.
Growth in the Australian economy has slowed, with growth over the next couple of years expected to be below trend. There is further evidence that the combination of higher interest rates, cost-of-living pressures and a decline in housing prices is leading to a substantial slowing in household spending. While some households have substantial savings buffers, others are experiencing a painful squeeze on their finances.
The labour market remains very tight. The unemployment rate is at a near 50-year low and underemployment is also low. Many firms continue to experience difficulty hiring workers, although some report an easing in labour shortages and the number of vacancies has declined a little. As economic growth slows, unemployment is expected to increase.
Wages growth is continuing to increase in response to the tight labour market and higher inflation. At the aggregate level, wages growth is still consistent with the inflation target, provided that productivity growth picks up. The Board remains alert to the risk of a prices-wages spiral, given the limited spare capacity in the economy and the historically low rate of unemployment. Accordingly, it will continue to pay close attention to both the evolution of labour costs and the price-setting behaviour of firms.
The Board's priority is to return inflation to target. High inflation makes life difficult for people and damages the functioning of the economy. And if high inflation were to become entrenched in people's expectations, it would be very costly to reduce later, involving even higher interest rates and a larger rise in unemployment. The Board is seeking to return inflation to the 2–3 per cent target range while keeping the economy on an even keel, but the path to achieving a soft landing remains a narrow one.
The Board expects that some further tightening of monetary policy may well be needed to ensure that inflation returns to target. The decision to hold interest rates steady this month provides the Board with more time to assess the state of the economy and the outlook, in an environment of considerable uncertainty. In assessing when and how much further interest rates need to increase, the Board will be paying close attention to developments in the global economy, trends in household spending and the outlook for inflation and the labour market. The Board remains resolute in its determination to return inflation to target and will do what is necessary to achieve that.