Sample Category Title
Is JPY Ready to Reclaim All-Year High?
Between October 2022, and January 2023, the Japanese Yen outperformed several other currency pairs, resulting in over a thousand pips move on pairs like EURJPY, GBPJPY, and 2000-plus pips on USDJPY. Considering that the BOJ has recently experienced a leadership change, and the JPY is at a pivotal zone on most charts, it seems a good time to analyze the charts for trading opportunities.
USDJPY
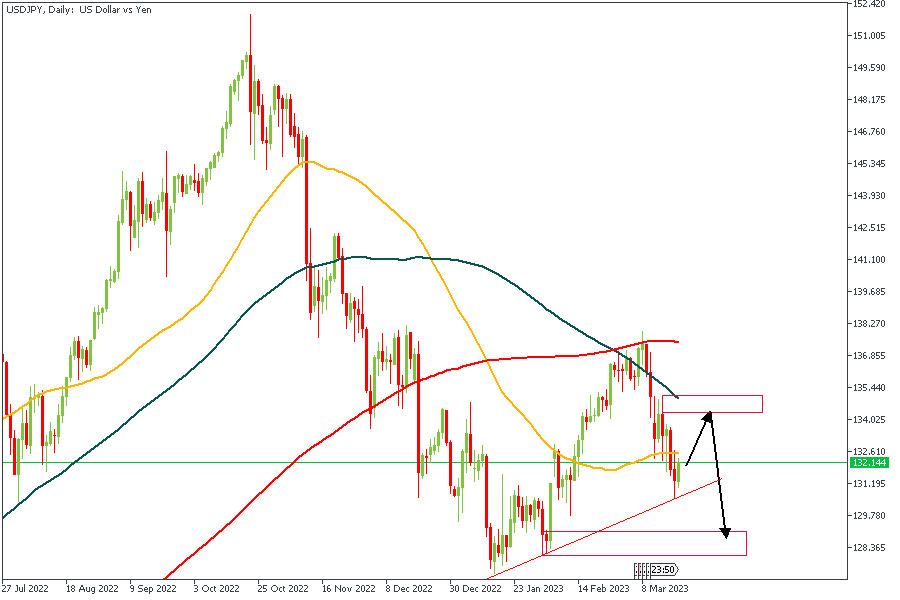
USDJPY seems to be reacting from the trendline support on the daily already. However, as we can see from the chart based on the bearish alignment of the Moving averages, it confirms the possibility of a bearish movement.
Analysts’ Expectations:
- Direction: Bearish
- Target: 129.410
- Invalidation: 135.470
CADJPY
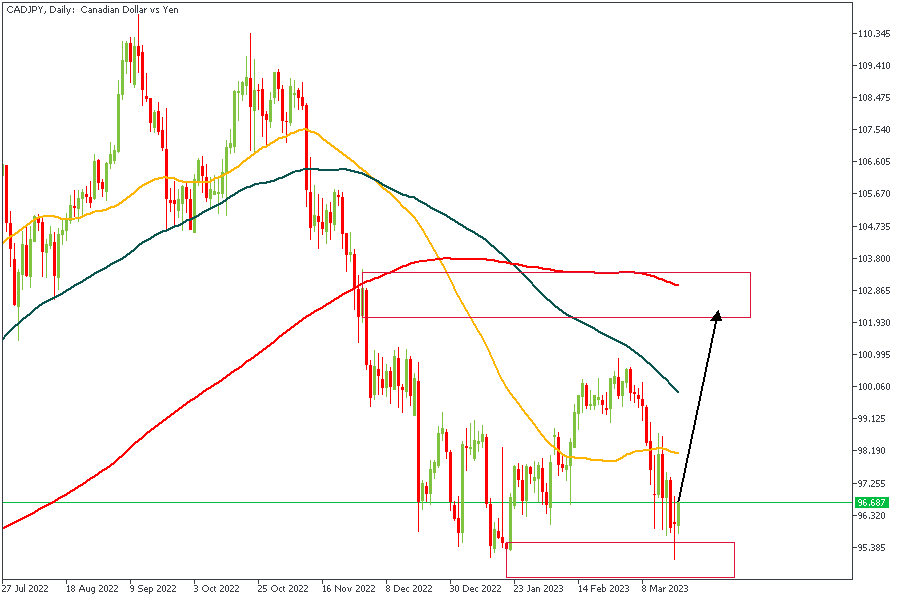
CADJPY initially reacted to a demand zone even though the MAs are inclined in a bearish array. The break of structure, demand zone, and Fibonacci levels point to the possibility of price returning to the supply zone at the 200-Day MA before heading back down.
Analysts’ Expectations:
- Direction: Bullish
- Target: 100.060
- Invalidation: 95.70
EURJPY
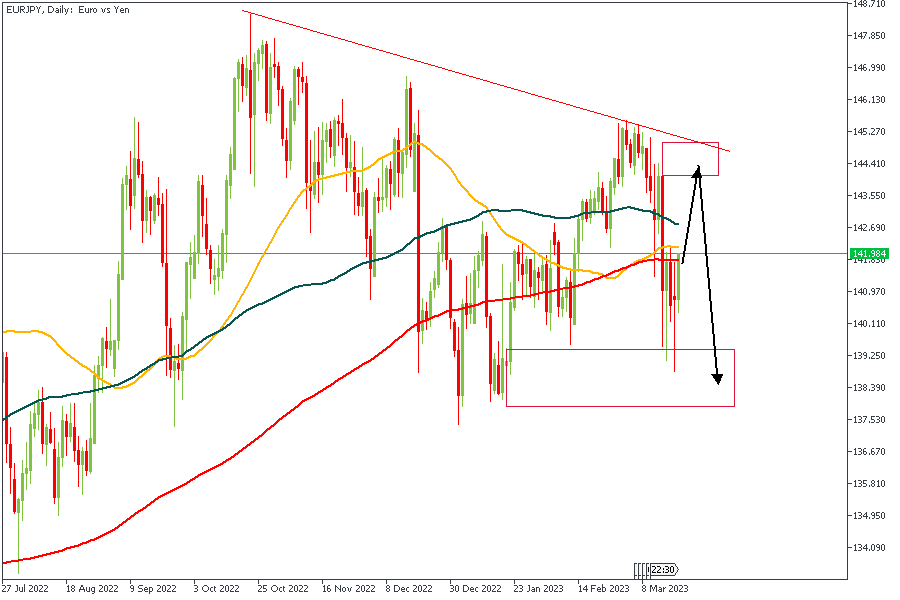
I believe the price intends to react from a trendline resistance on the daily timeframe of EURJPY. The fact that the resistance trendline falls in line with the supply zone and 88% Fibonacci retracement zone gives me a reason to believe it would be a great point of entry for a sell order.
Analysts’ Expectations:
- Direction: Bearish
- Target: 145.430
- Invalidation: 137.30
GBPJPY
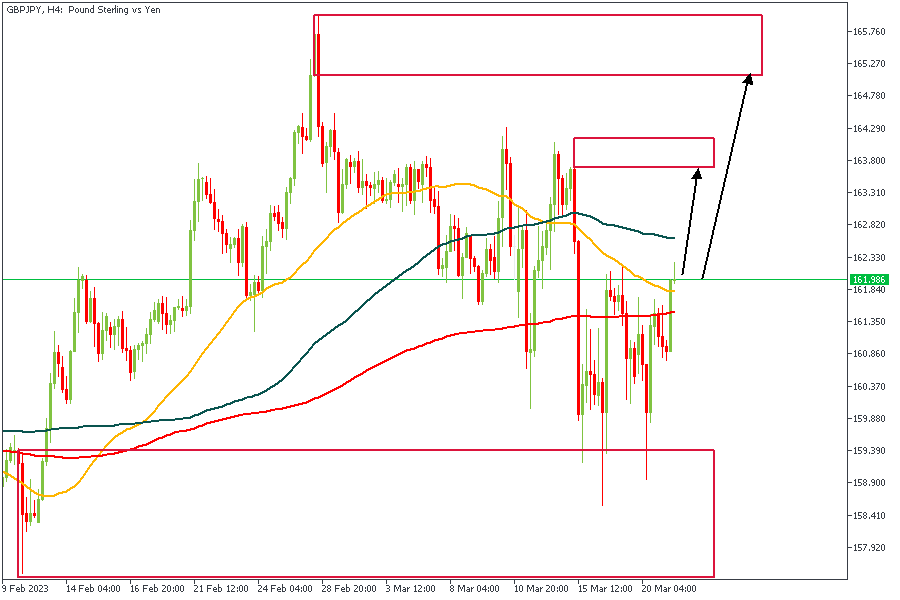
GBPJPY looks very similar to EURJPY. I see the price heading towards and reacting from either of the two zones I have already marked out. Based on the alignment of the MAs, I will be opting for a sell order from either supply zone.
Analysts’ Expectations:
- Direction: Bullish
- Target: 161.000
- Invalidation: 164.520
CONCLUSION
The trading of CFDs comes at a risk. Thus, to succeed, you have to manage risks properly. To avoid costly mistakes while you look to trade these opportunities, be sure to do your due diligence and manage your risk appropriately.
US 500 Index Recovers from Banking Breakdown
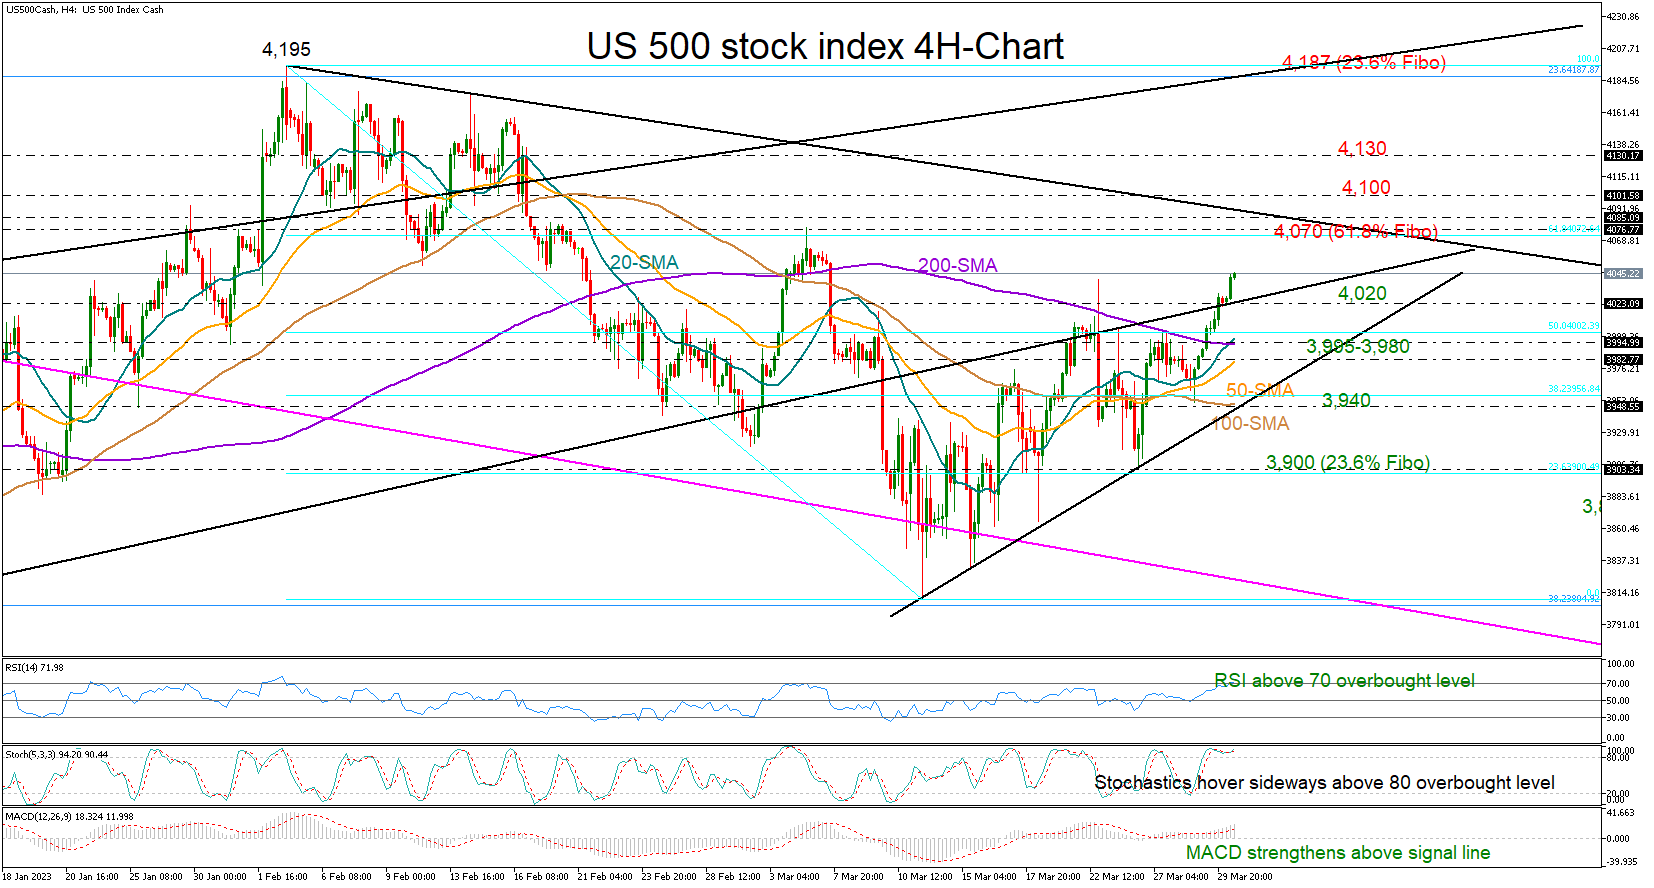
The US 500 stock index (cash) rose back above the 4,000 level yesterday, recouping the bearish breakdown caused by SVB's collapse.
The bulls gained extra positive momentum over the past couple of hours, deviating clearly above the support-turned-resistance trendline from October. Technically, that increases the odds for another extension to 4,070, where the 61.8% Fibonacci retracement of the 4,195-3,809 downtrend is placed. Not far above, the tentative descending trendline at 4,085 could be a make-or-break point. If the bulls breach that wall, the ascent could stretch up to the 4,100 psychological mark and then to the 4,130 barrier.
The technical signals in the four-hour chart are still encouraging. The 20-period simple moving average (SMA) has crossed above the longer-term 200-period SMA, endorsing the upturn in the market. Also, the RSI and the MACD are clearly trending up, though the former is already in the overbought zone, suggesting that upside pressures could soon ease.
Yet, the bulls may not abandon the market unless the price tumbles below the trendline at 4,023. If the simple moving averages (SMAs) let the price slip below 3,980, then the spotlight will immediately fall on the key ascending trendline at 3,940, which has been navigating the market since mid-March. A forceful move lower could see a revisit of the 3,900 round level.
All in all, the US 500 index is still being driven by buyers, with resistance likely developing within the 4,060-4,085 zone.
S&P500 Affirms Positive Outlook
S&P500 futures are currently trading at a 3-week high. Returning to the territory above 4000 and exiting above the previous week’s highs set up optimism. Since March 13, the S&P500 daily candlesticks have been showing an uptrend.
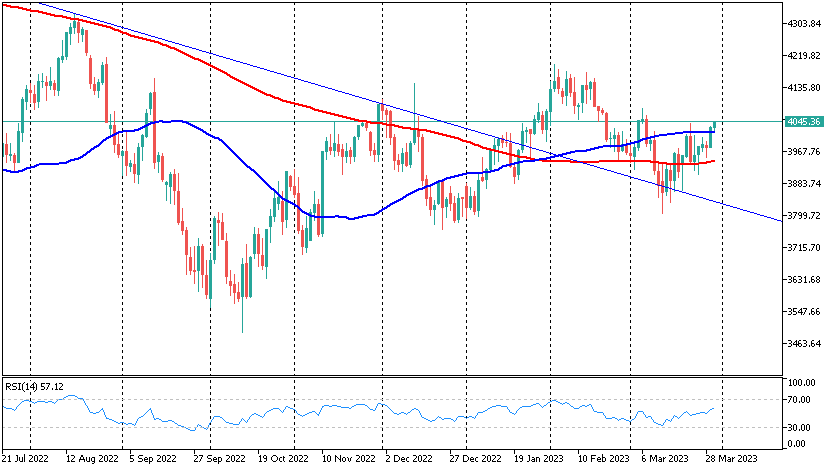
The index is trading above levels reached as a first reaction to the Fed’s comments last Wednesday. The subsequent selloff at the end of last week drew more buyers into the stock.
The positive momentum is supported by the stabilisation of the financial sector (no new bankruptcies) and growing expectations that the Fed has finished raising rates along with solid macroeconomic data.
On the technical side, the bulls managed to keep the S&P500 above the 200-day moving average last week. As a result of trading on Wednesday, the index closed above the 50-day, which failed last Wednesday. Entering territory above this curve triggered relatively deep selloffs in March, so cautious traders may prefer to wait until Thursday or Friday’s close (the last trading day of the month and quarter).
However, we are optimistic this time, as the S&P500 has been actively buying back on dips below the 200-day average earlier this month, and the curve has been upward-looking since last week.
On the weekly timeframes, we note that this year’s rally has pushed the market above the downtrend line that formed last year’s downtrend. The March decline was an attempt to return to this trend, but it did not work out – the S&P500 was redeemed on touching this line.
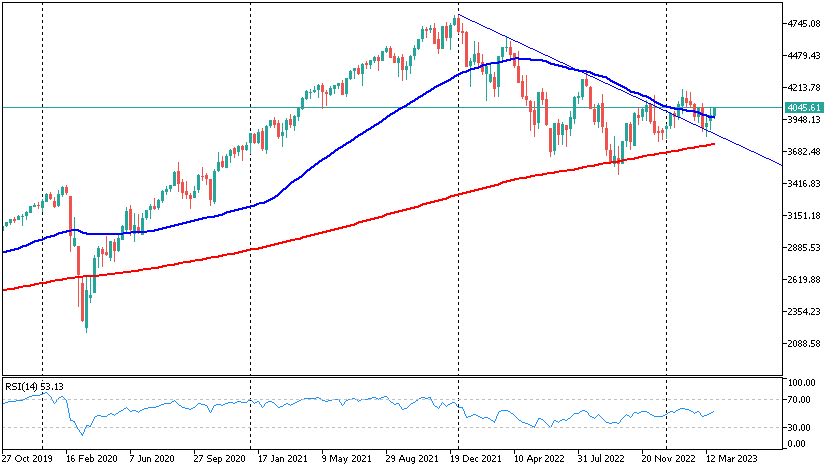
In addition, the bulls managed to stretch out last week, closing it above the 50-week average. To a large extent, the buying strength this week is supported by the confidence of long-term investors that the market has not fallen into a tailspin. We are now in the early stages of a bull market, the low point of which nicely coincided with the touch of the 200-week average and 50% correction from the post-COVID growth.
US initial jobless claims rose to 198k, above expectations
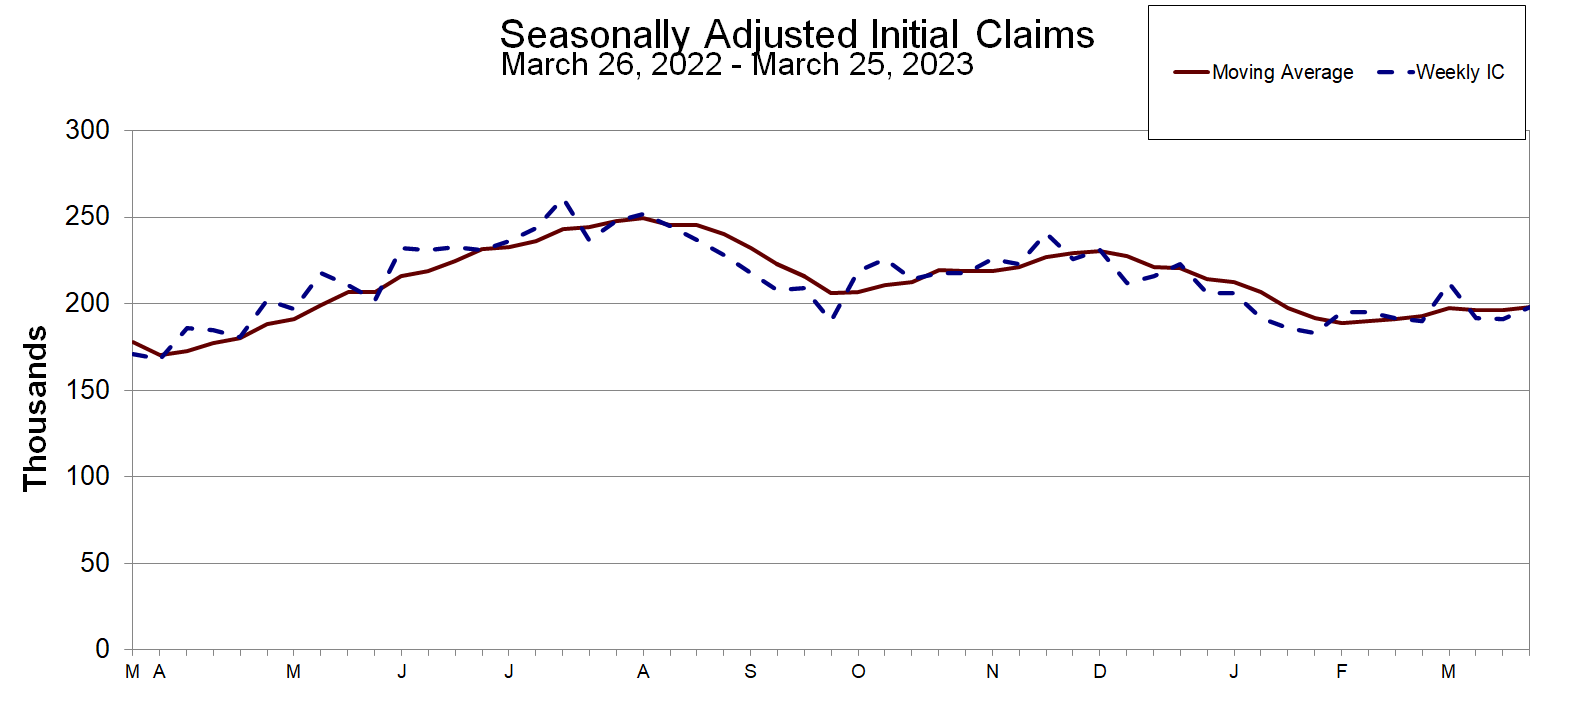
US initial jobless claims rose 7k to 198k in the week ending March 25 above expectation of 195k. Four-week moving average of initial claims rose 2k to 198k.
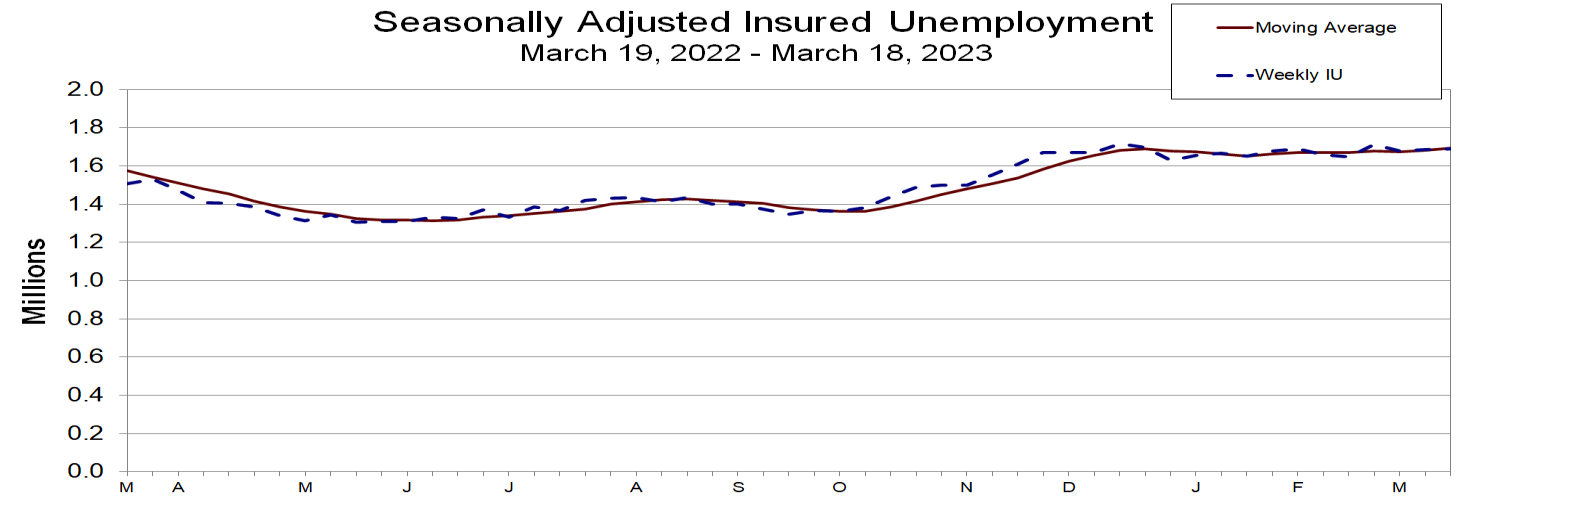
Continuing claims rose 4k to 1689k in the week ending March 18. Four-week moving average of continuing claims rose 10k to 1692k.
GBP/JPY: Rises Further After Wednesday’s 1.3% Advance
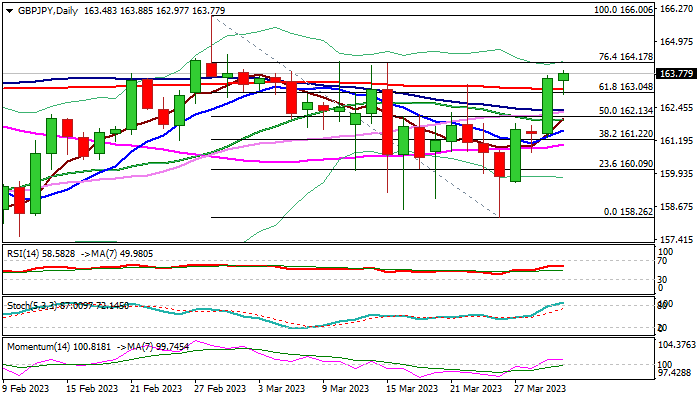
The GBPJPY cross is holding firm bullish tone after Wednesday’s 1.3% rally (the biggest daily gain since Feb 13) as renewed risk appetite on easing bank concerns deflated yen.
Wednesday’s strong bullish acceleration broke through a number of barriers and registered daily close above pivotal 163.04/15 levels (Fibo 61.8% of 166.00/158.26 / 200DMA), generating strong bullish signal.
Early Thursday’s action was a tad slower on thinner markets ahead of month / quarter end, as well as end of Japan’s fiscal year, but bulls so far hold grip and gain traction.
Daily studies turned to full bullish configuration, but stochastic is overbought and 14-d momentum turned sideways, suggesting that bulls may pause for consolidation.
Dips should ideally stay above 200DMA, though deeper pullback cannot be ruled out, with converged 30/100DMA (162.33) expected to contain and keep bullish structure intact.
Bulls eye immediate target at 164.17 (Fibo 76.4% / mid-March tops), break of which would open way towards 166.00 (Feb 28 spike high /2023 top).
Res: 164.17; 164.50; 165.00; 166.00.
Sup: 163.15; 162.97; 162.33; 162.00.
Bitcoin Trying to Break Through the Ceiling
Market picture
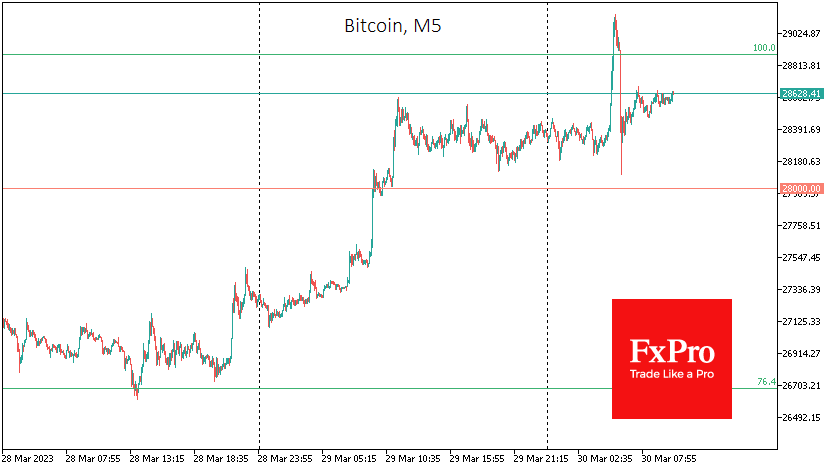
The stock market’s upbeat mood brought the price of bitcoin back to the upper limit of the March trading range. In the low-liquid market early in the morning, Bitcoin picked up a wave of stops moving from $28.5K to $29.1K in minutes. It soon got the reverse traction with the same speed, dropping to $28.0K before entering a smoother intraday uptrend.
The morning breakdown of $29.0K was false, and it is better to wait for a more solid fixation above it to talk about the beginning of a new growth impulse. A potential upside target within the formation is the area near $35K (161.8% of the initial move). However, already near $30K, BTCUSD may face short-term selling pressure.
The XRP token has tested highs since May 2022 above $0.58. So far this week, it has gained more than 20% amid hopes of an optimistic outcome of the Ripple Labs litigation with the SEC and the CFTC calling the leading cryptocurrencies commodities.
News background
Galaxy Digital CEO Mike Novogratz called Bitcoin interesting amid the “build-up of debt-to-GDP” in the US. According to him, the banking crisis in the United States was an “adrenaline rush” for cryptocurrencies and gave the bitcoin community “incredible resilience.”
MEPs approved a limit of 1,000 euros on cryptocurrency transactions for unverified users as part of the fight against money laundering, terrorist financing and sanctions evasion.
According to the Financial Times, Binance hid its connection to China for several years, despite claims from management that the site left the country at the end of 2017.
EUR/USD Outlook: Euro Remains at the Front Foot ahead of German CPI Report
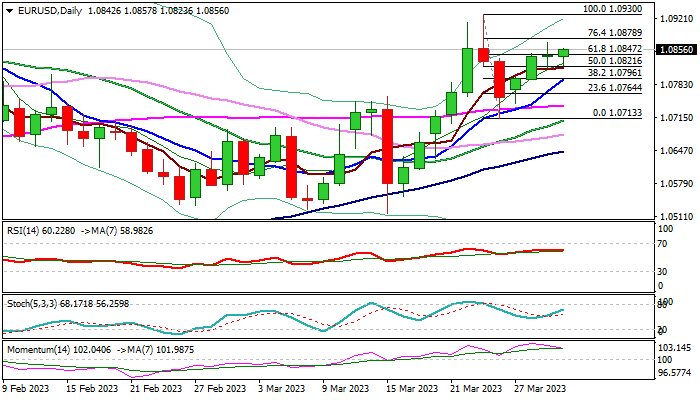
The Euro slows speed of recovery ahead of today’s release of German inflation report for March, which is expected to generate fresh signals.
Wednesday’s Doji candle signaled indecision after recovery in past two days retraced over 61.8% of last week’s pullback.
Near-term structure remains bullish overall, but loss of positive momentum temporarily halted recovery rally, although the action is so far holding above initial support at 1.0821 (broken Fibo 50% retracement, reinforced by 5DMA) and keeping near-term bias with bulls.
Also, daily Ichimoku cloud is thickening after Wednesday’s twist and providing support.
Markets await German CPI data to get more hints about near-term direction, as annualized inflation in EU’s largest economy is expected to significantly drop in March (7.3% f/c vs Feb 8.7%) and CPI harmonized with all EU member states (HICP) is seen dropping to 7.5% in March from 9.3% previous month).
Releases in line with expectations or possibly lower would signal that inflation remains in steep downward trajectory, which would reduce need for further policy tightening by the ECB and make the single currency less attractive.
On the other hand, disappointing numbers would keep the central bank on track for further hikes and offer fresh support to euro.
The latest comments from ECB board member that underlying inflation which excludes volatile components, remains elevated despite recent fall in energy costs and may extend the process of curbing inflation and pushing it towards 2% target, contributing to positive outlook for Euro.
Daily close above cracked Fibo barrier at 1.0847 (61.8% of 1.0930/1.0713) is need to confirm bullish structure for attack at 1.0878 (Fibo 76.4%) and extension towards key near-term barrier at 1.0930 (Mar 23 spike high).
Solid support at 1.0821 should continue to protect the downside and guard lower pivot at 1.0793 (rising 10DMA) loss of which would revive bears.
Res: 1.0878; 1.0912; 1.0930; 1.1000.
Sup: 1.0821; 1.0793; 1.0764; 1.0737.
WTI Oil Futures Limit Monthly Losses; Broad Trend Bearish
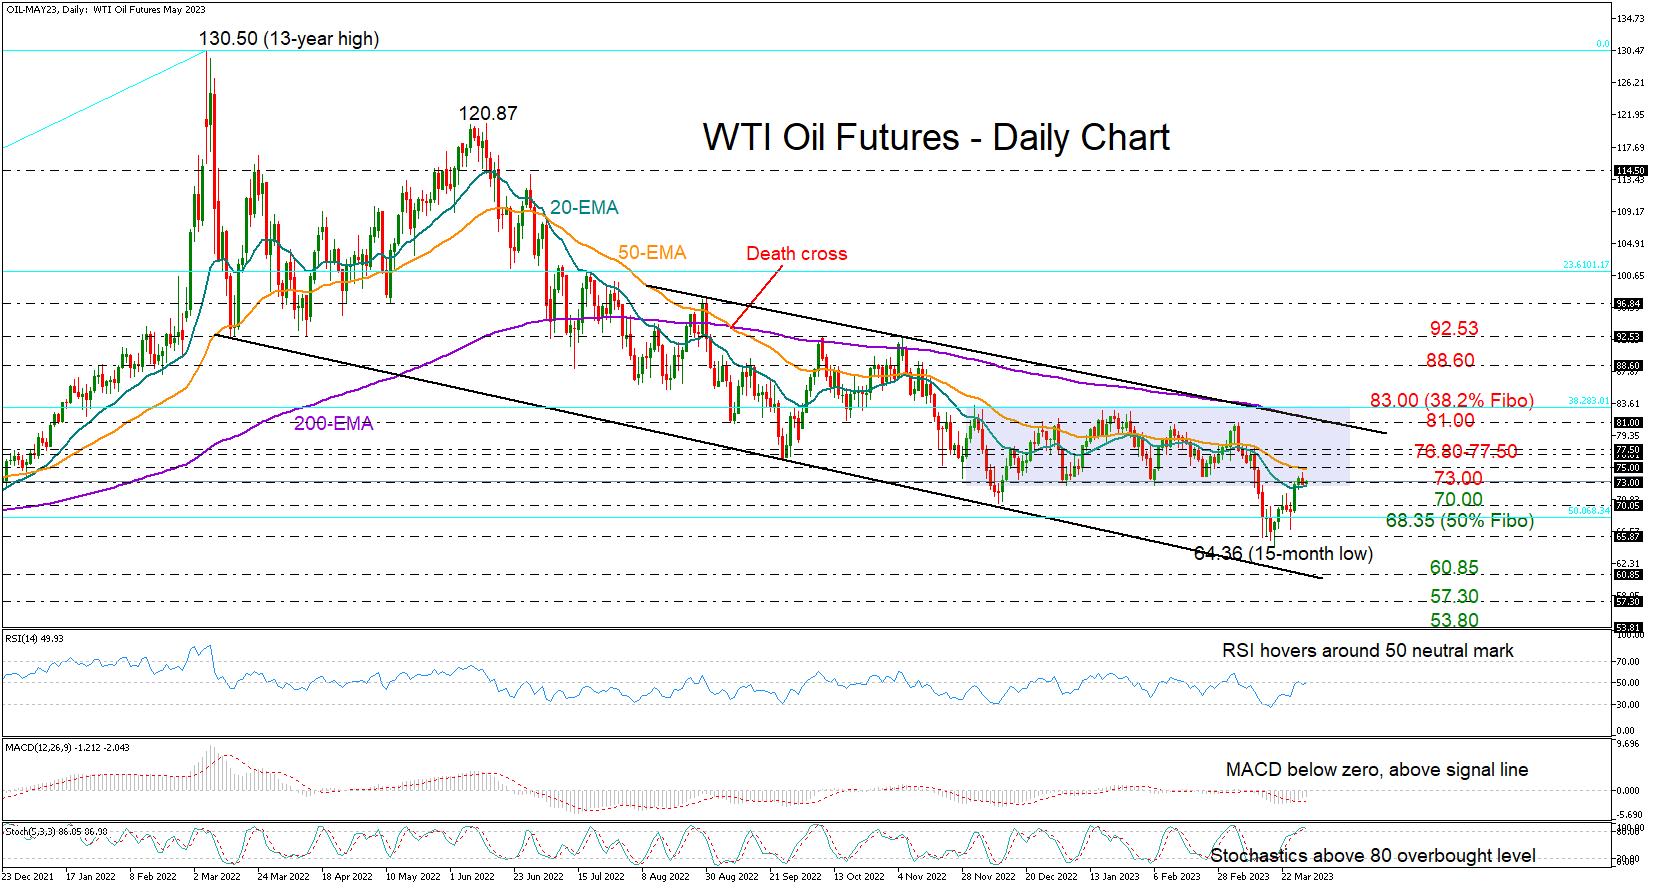
WTI oil futures are rising for the second consecutive week, having retraced almost half of the March downfall to re-enter the previous five-month-old range area above the 73.00 mark.
The 73.00 area will be closely watched in the short-term as the 200-period exponential moving average on the weekly chart is currently capping bullish actions around the same location. If the price crawls higher, the 50-day simple moving average (SMA) could immediately halt the recovery from stretching into the 76.80-77.50 zone. Another success here could prompt a fast rally towards the upper boundary of the bearish channel and the 200-day SMA both seen near 81.00.
From a technical perspective, the above bullish scenario is not the most likely yet. Despite the latest upturn in the price, the RSI has yet to pierce above its 50 neutral mark, while the MACD is still some distance below zero. Meanwhile, the stochastic oscillator has already reached the overbought territory above 80, flagging fading upside pressures.
In the event the price pulls below 73.00 and beneath the 20-day SMA, the spotlight will shift to the 70.00 psychological mark and the 50% Fibonacci level of 68.35. A decisive close lower could press the price straight to the channel’s lower band seen at 60.85, unless the barrier of 65.85 comes to the rescue beforehand. A bearish channel breakout could then bring the March 2021 floor of 57.30 next into view.
In a nutshell, the ongoing bullish wave in WTI oil futures has not convinced buyers yet. Downside risks may keep lingering in the background unless the price breaks above the channel and the 81.00 number.
Dollar Showed No Clear Directional Trend
Markets
Yesterday, markets further left behind last week’s financial stability concerns and returned to the order of the day. However, the eco calendar didn’t provide much high profile data to color the intraday dynamics. Markets basically build on the ‘normalization move’ from earlier this week. US yields maintained recent gains but in the end closed little changed (2 y +2.0 bps; 30-y -1 bp). About further rate hikes Fed Chair Powell, in a meeting with US House representatives, was said to have referred to the dots, penciling in one additional rate hike. A $ 35 bln 7-y US Treasury auction only drew modest investor interest (bid/cover 2.39 VS 2.49 average and 1.1 bps above WI yield). German bunds again slightly underperformed Treasuries with yields rising between 6.2 bps (2-y) and 3.5 bps (30-y). Chief economist Lane also reiterated recent ECB mantra that rates will have to be raised further under the ECB baseline scenario assuming only limited impact from recent financial turmoil. Relative calm on bond markets inspired a further equity rebound. Both US and European indices closed with solid gains (Euro Stoxx 50 + 1.51%, Dow +1.0%, Nasdaq +1.79%). On FX markets, the dollar showed no clear directional trend. DXY closed modestly higher near 102.64. EUR/USD finished the day unchanged at 1.0845. USD/JPY rebounded sharply from a close near 130.9 on Tuesday to 132.86 yesterday evening. Sterling lost a few ticks against the single currency but the EUR/GBP cross rates stayed in well-known territory near the 0.88 big figure.
Asian equity markets this morning show a mixed picture and fail to fully profit from yesterday’s strong momentum on WS. US yields gain marginally. The dollar still shows no clear trend (DXY 102.65, USD/JPY 132.6; EUR/USD 1.084).
Today, markets will receive first important price data after recent financial turmoil with Germany, Spain and Belgium reporting first European March inflation data ahead of tomorrow’s EMU flash estimate. The EC also will published its monthly economic confidence data. (European) inflation data these days are often affected by the impact of domestic measures to support consumers’ purchasing power which might lead to an a-synchronic pattern between countries. However, the expected monthly dynamics (Spain 1.6%, Germany 0.8%), if it materializes, still might confirm recent evidence of stubborn underlying price pressures. This should support the case that the ECB has to continue its anti-inflationary campaign if financial stability concerns ebb further. For the German 10-y yield, 2.393% is next resistance on the charts (neckline ST double bottom). Data cementing the view that the ECB will (have to) continue its hiking cycle, probably well beyond the Fed reaching the peak in its campaign, might put a floor for the euro. EUR/USD 1.0930 remains final intermediate resistance before a return to the 1.1033 YTD top.
News Headlines
The Czech National Bank kept rates unchanged at 7% in a 6-1 vote with the dissenter voting for a 25 bps increase. Despite the risen uncertainty, the CNB is unwilling to ditch the possibility of further hikes. It also said that it considers market expectations regarding the timing of a first cut to be premature. The current policy level according to the CNB is dampening domestic demand with real household consumption falling for a fifth consecutive quarter. Investment growth is hampered by increased energy and commodity costs. On the other hand, Czech unemployment remains low. Inflation decreased to 16.7% in February and will fall further in coming months to hit single digits in 2023H2. It should fall close to the 2% target next year. The CNB Board identifies a series of risks going in both directions, including faster-than-expected wage growth or a weaker consumption and investor demand. The Czech koruna strengthened yesterday from EUR/CZK 23.63 to 23.56 after the CNB in the statement formally pushed back on rate cuts. Czech swap yields advanced up to 9.8 bps at the front end but the upleg already took place in the run-up to the meeting.
The US Federal Deposit Insurance Corp is facing a blow of almost $23bn in costs from the recent bank failures. To shore up the $128bn insurance fund, the agency is considering to pass through a larger-than-usual portion of the burden to the biggest banks, according to people familiar with the matter. The issue is a politically hot item with government officials publicly demanding regulators to spare small banks in the process of rebuilding the FDIC’s coffers.
AUDUSD Could See Further Strength Above 200-day SMA
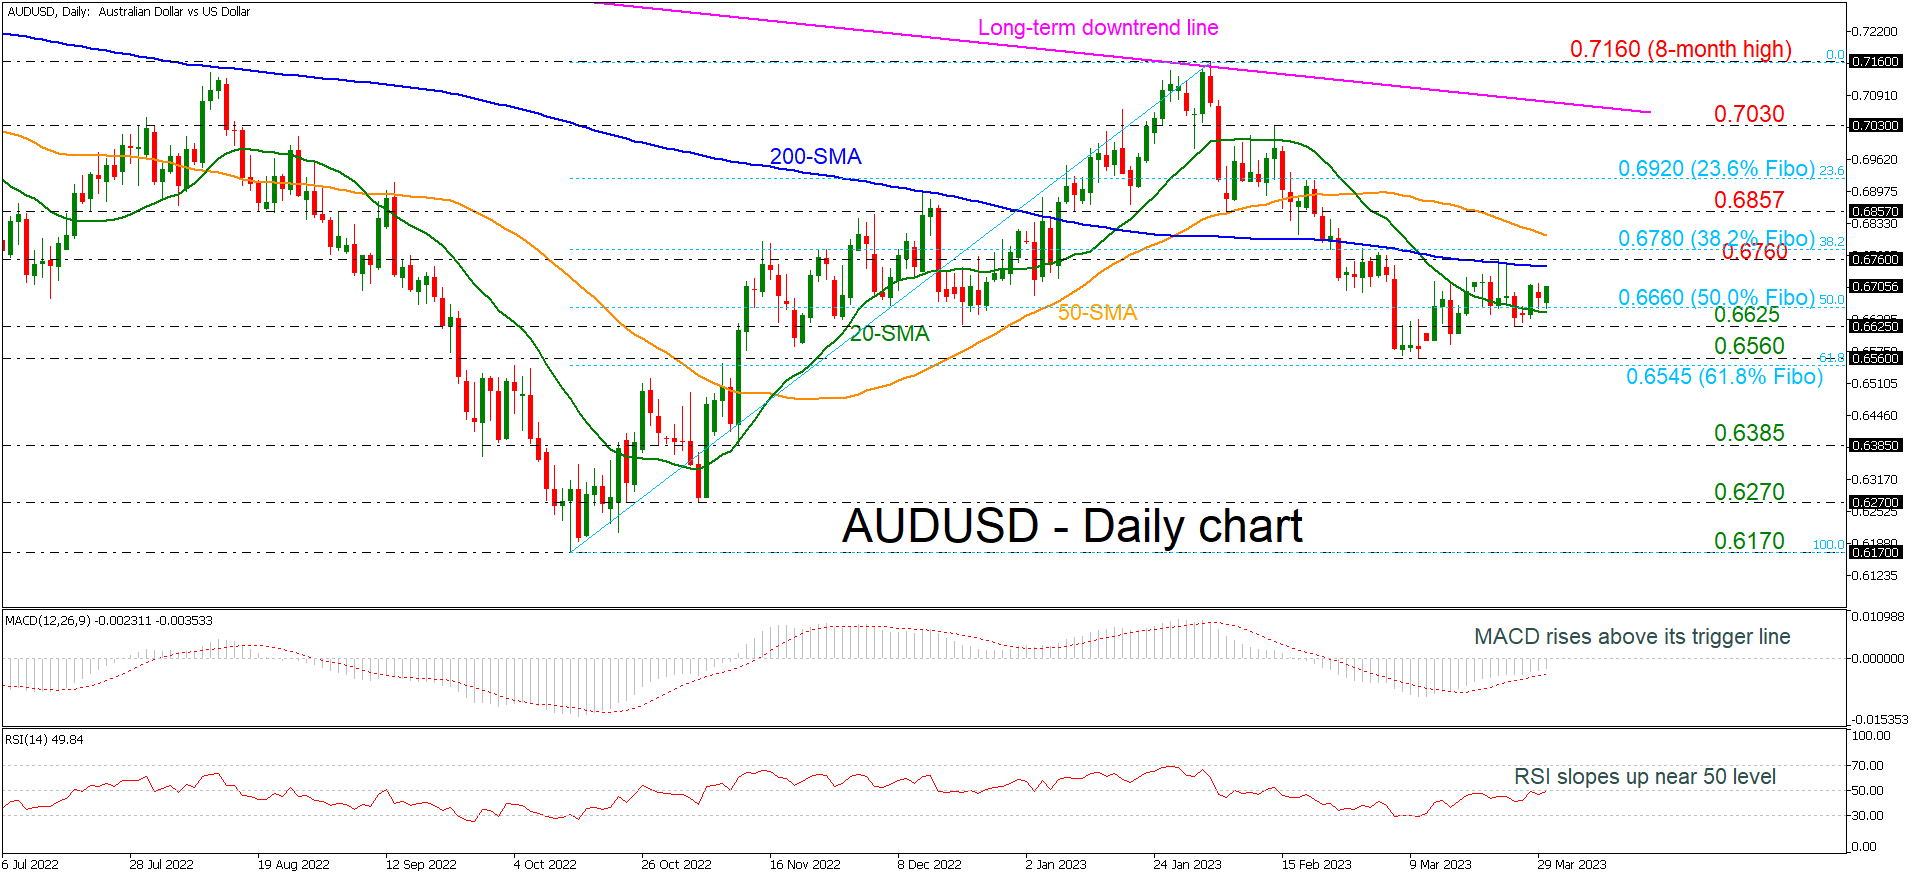
AUDUSD is moving above the 20-day simple moving average (SMA) and the 50.0% Fibonacci retracement level of the upward wave from 0.6170 to 0.7160 at 0.6660; however, the 200-day SMA around the 0.6760 resistance is acting as a crucial resistance level.
The market has been heading sideways over the last couple of weeks, with the technical oscillators suggesting that an upside retracement may be on the cards. The MACD is holding above its trigger line in the negative territory, while the RSI is pointing slightly up near the neutral threshold of 50.
On the upside, the price could attempt to overcome the 0.6760 barrier and retest the 38.2% Fibonacci of 0.6780, which if successfully broken, could open the door for the 50-day SMA at 0.6810. Should traders continue to buy the pair above that level, bringing the short-term uptrend into play, resistance could then run towards the 0.6857 mark and the 23.6% Fibonacci of 0.6920.
A reversal to the downside could find immediate support at the 50.0% Fibo of 0.6660, which overlaps with the 20-day SMA, while slightly lower the 0.6560 barrier and the 61.8% Fibo of 0.6545 could also come into view. If the latter fails to halt bearish movements, the next target could be the 0.6385 support.
Regarding the longer-term trading outlook, the trend has been bearish over the past two months and only a decisive close above the long-term descending trend line could resume the bullish picture.