Sample Category Title
AUDUSD Could See Further Strength Above 200-day SMA
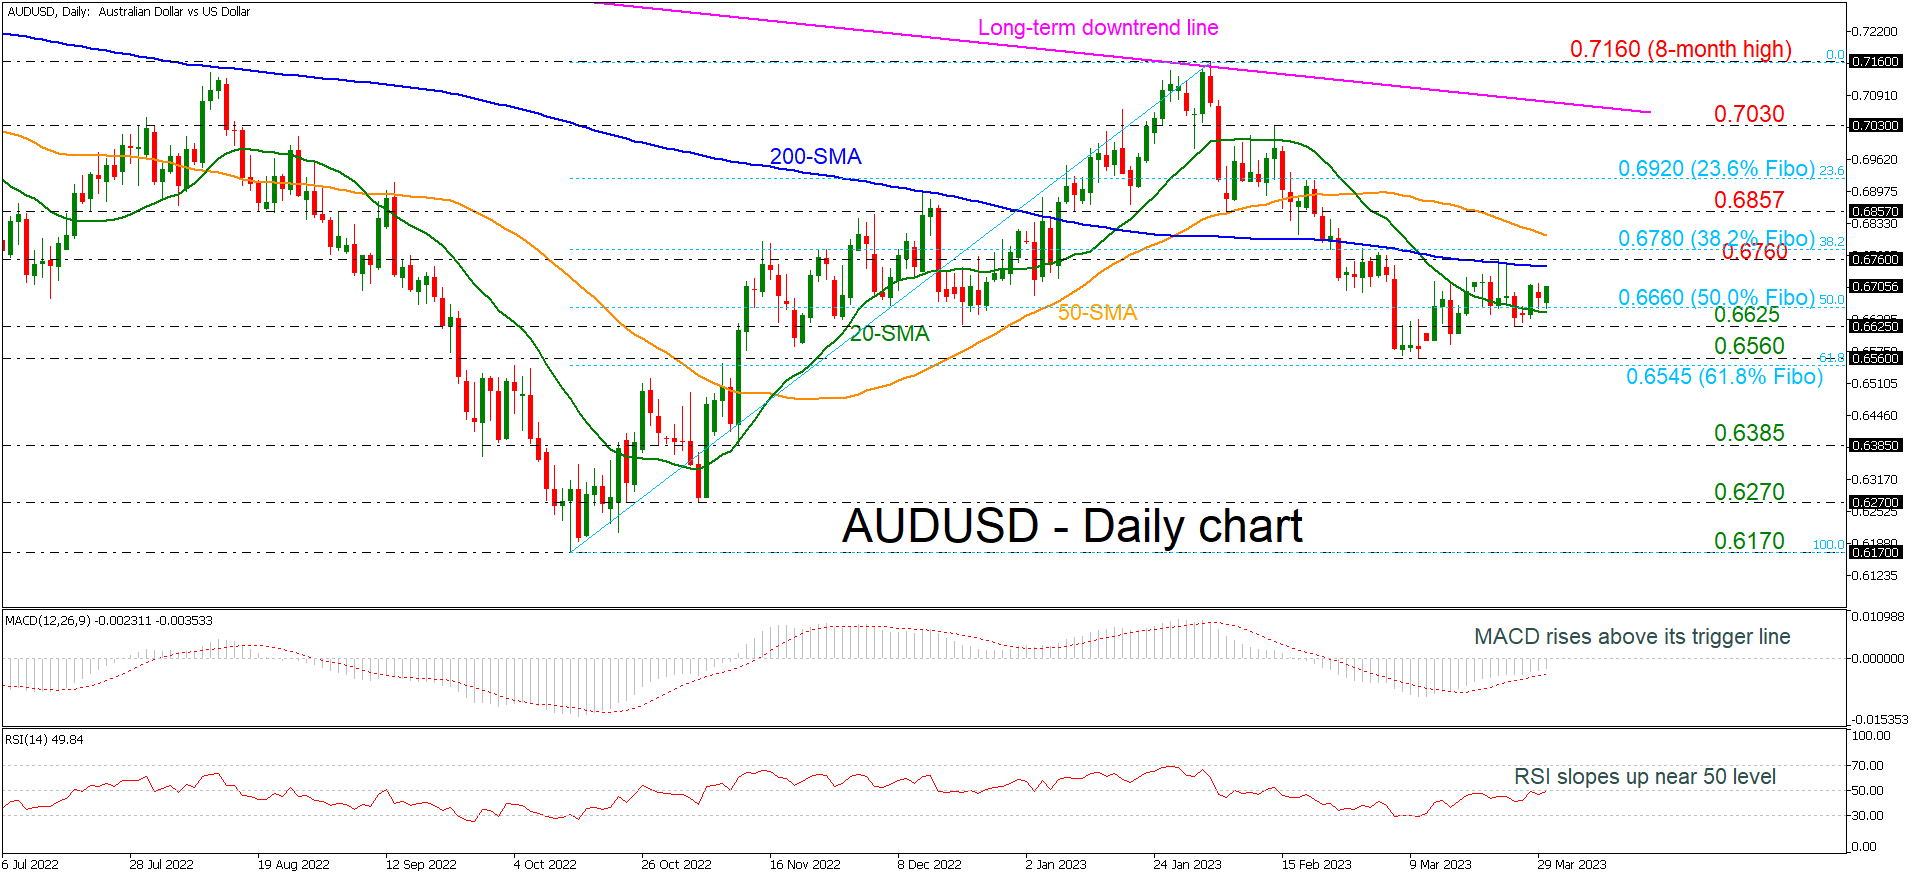
AUDUSD is moving above the 20-day simple moving average (SMA) and the 50.0% Fibonacci retracement level of the upward wave from 0.6170 to 0.7160 at 0.6660; however, the 200-day SMA around the 0.6760 resistance is acting as a crucial resistance level.
The market has been heading sideways over the last couple of weeks, with the technical oscillators suggesting that an upside retracement may be on the cards. The MACD is holding above its trigger line in the negative territory, while the RSI is pointing slightly up near the neutral threshold of 50.
On the upside, the price could attempt to overcome the 0.6760 barrier and retest the 38.2% Fibonacci of 0.6780, which if successfully broken, could open the door for the 50-day SMA at 0.6810. Should traders continue to buy the pair above that level, bringing the short-term uptrend into play, resistance could then run towards the 0.6857 mark and the 23.6% Fibonacci of 0.6920.
A reversal to the downside could find immediate support at the 50.0% Fibo of 0.6660, which overlaps with the 20-day SMA, while slightly lower the 0.6560 barrier and the 61.8% Fibo of 0.6545 could also come into view. If the latter fails to halt bearish movements, the next target could be the 0.6385 support.
Regarding the longer-term trading outlook, the trend has been bearish over the past two months and only a decisive close above the long-term descending trend line could resume the bullish picture.
S&P500 ($SPX) Elliott Wave Forecasting The Path
Hello fellow traders. In this article we’re going to take a quick look at the Elliott Wave charts of S&P 500 ( SPX) published in members area of the website. As our members know SPX is showing incomplete structure in the cycle from the January 2022 peak, calling for potential extension lower. Recently we got a 3 waves bounce that completed right at the extreme zone as we expected. In the further text we are going to explain the Elliott Wave Forecast.
SPX Elliott Wave 1 Hour Chart 03.18.2023
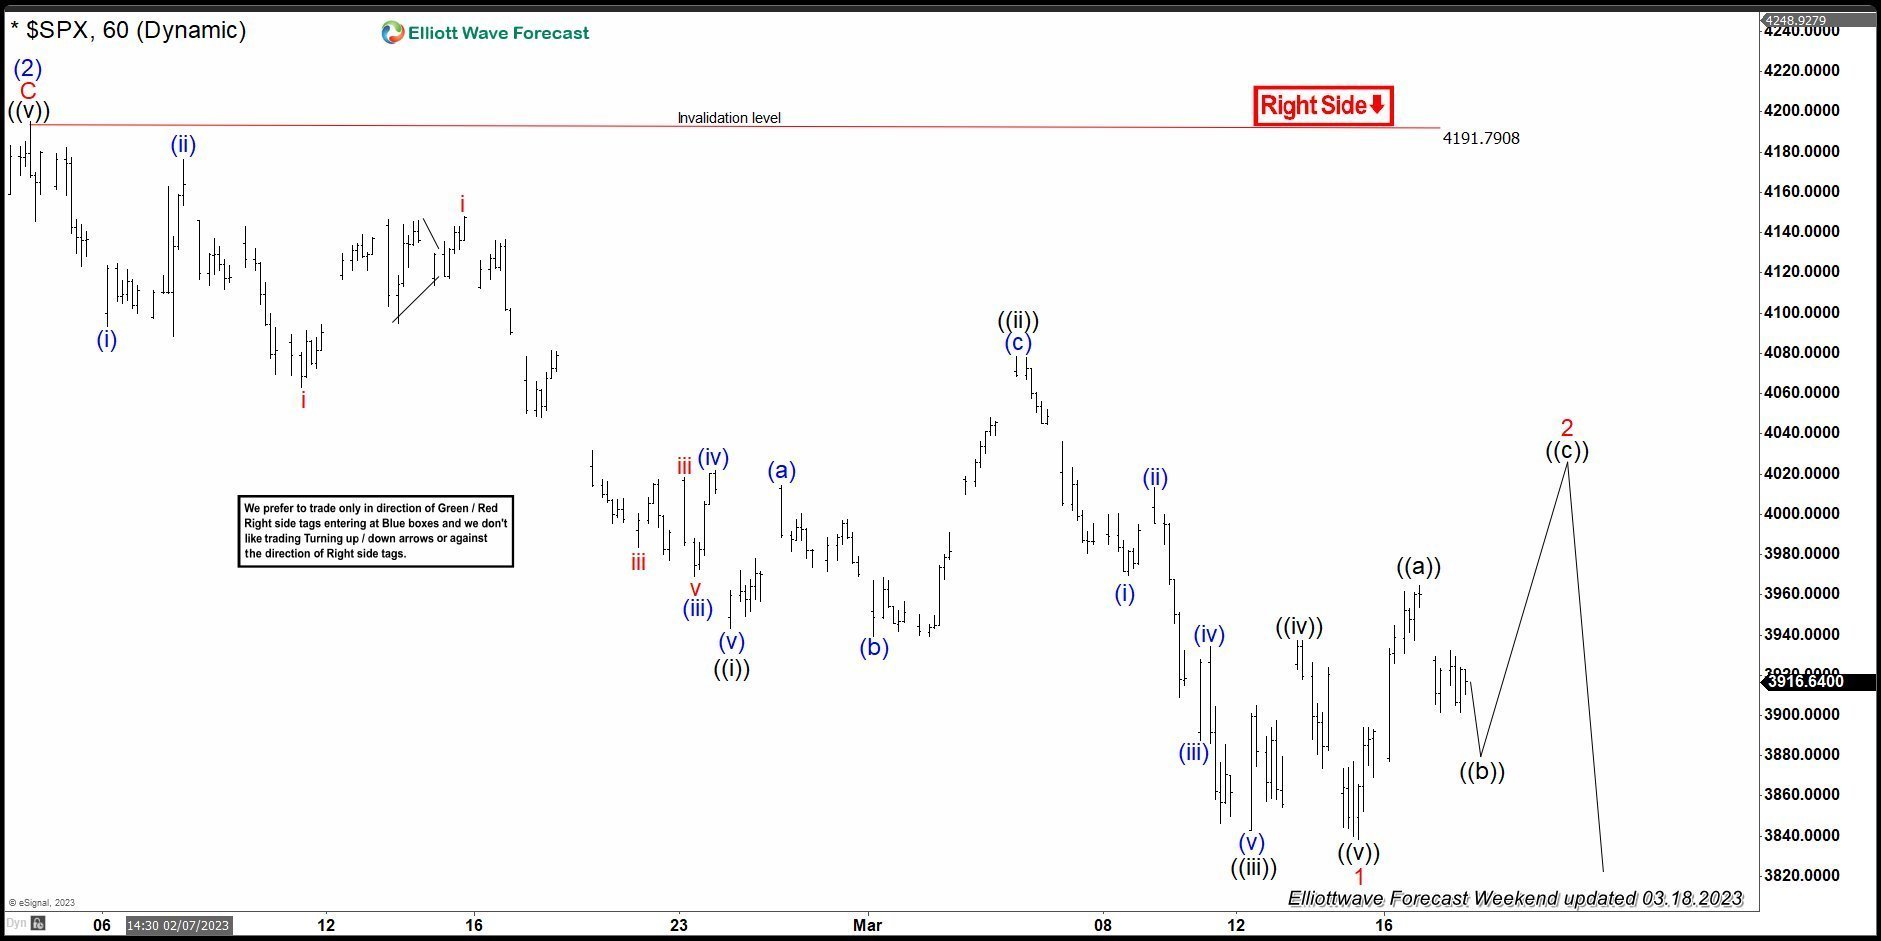
We are calling cycle from the 4191.79 peak completed as 5 waves structure. Currently SPX is doing correction against the mentioned high. For now we can count only 5 waves up from the low, which means recovery is potentially unfolding as Elliott Wave Zig Zag Pattern . We expect to see another push up, before further decline continues. We would like to see break above previous short term high ((a)) black to confirm proposed view.
SPX Elliott Wave 1 Hour Chart 03.22.2023
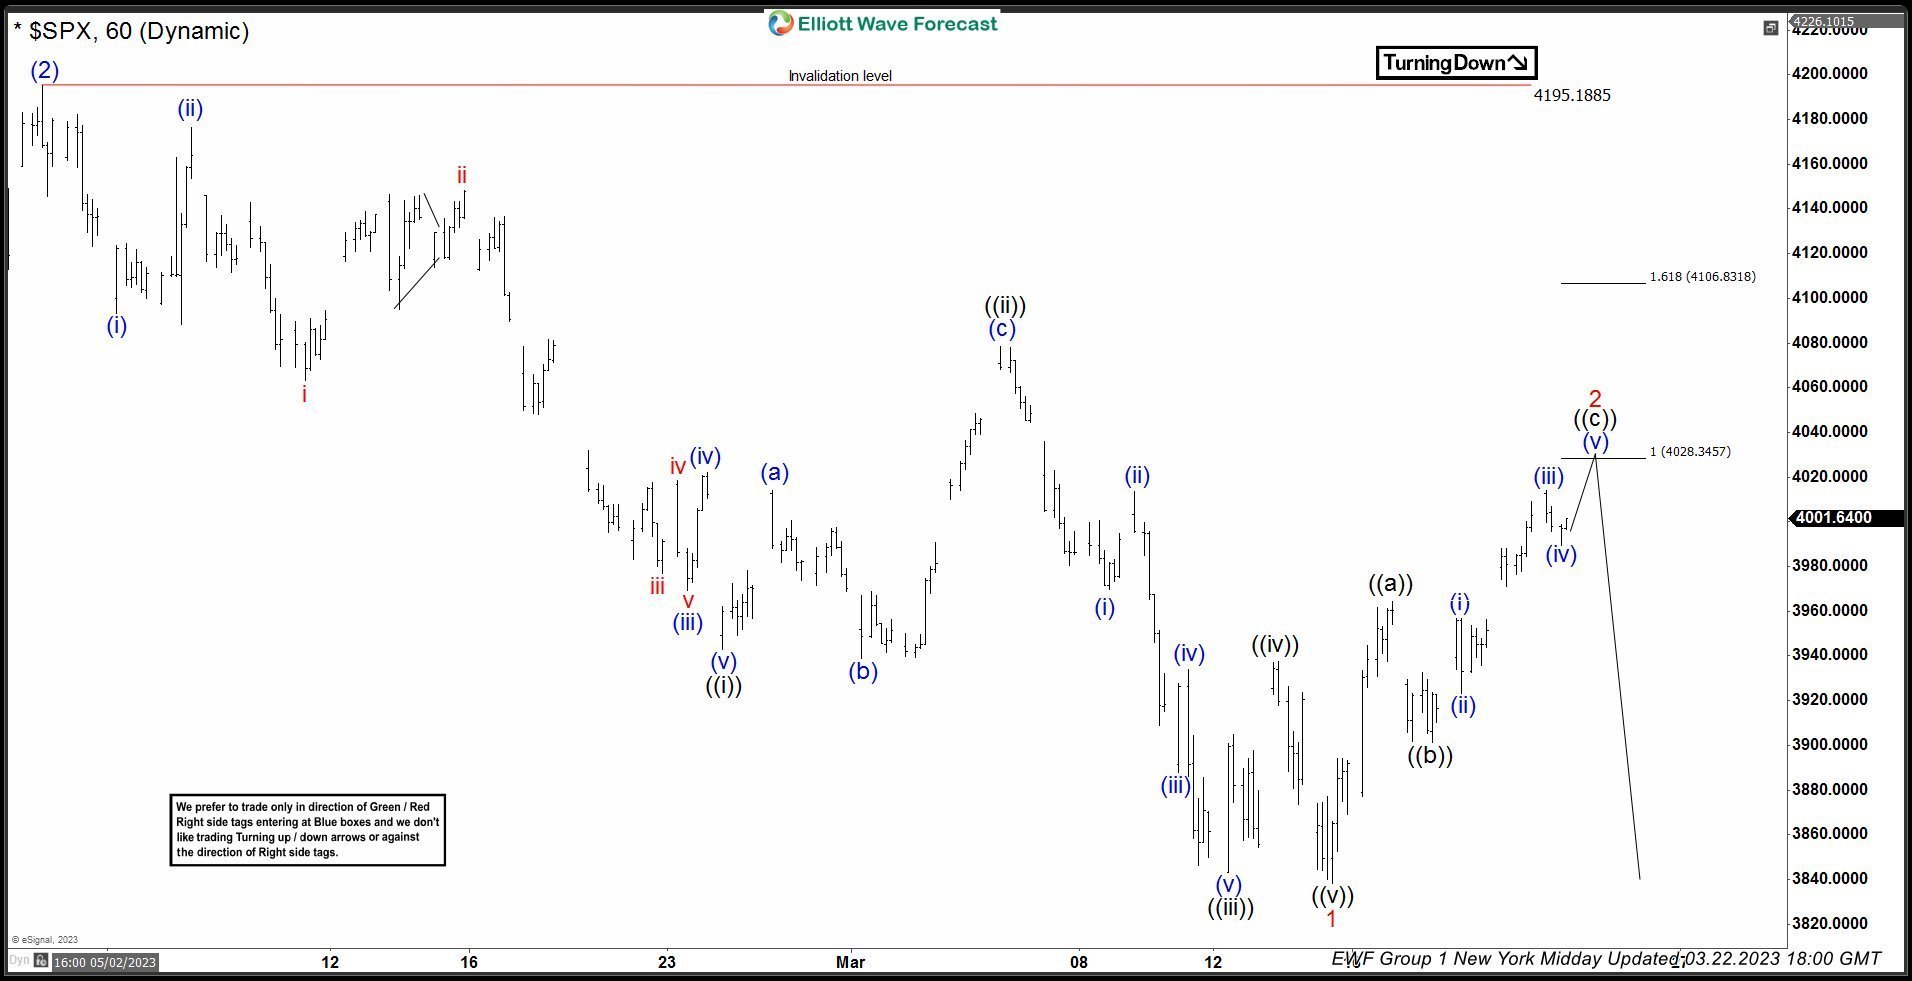
The index break above previous peak ((a)) black and continued trading higher as expected. Now, when we have a connector ((b)) low, we are able to measure potential target for 3 waves recovery. We expect correction to complete at 4028.34-4106.83 area. At that zone we believe buyers will be taking profits and sellers will appear. From there we expect to see either further decline toward new lows, or 3 waves pull back alternatively.
SPX Elliott Wave 1 Hour Chart 03.23.2023
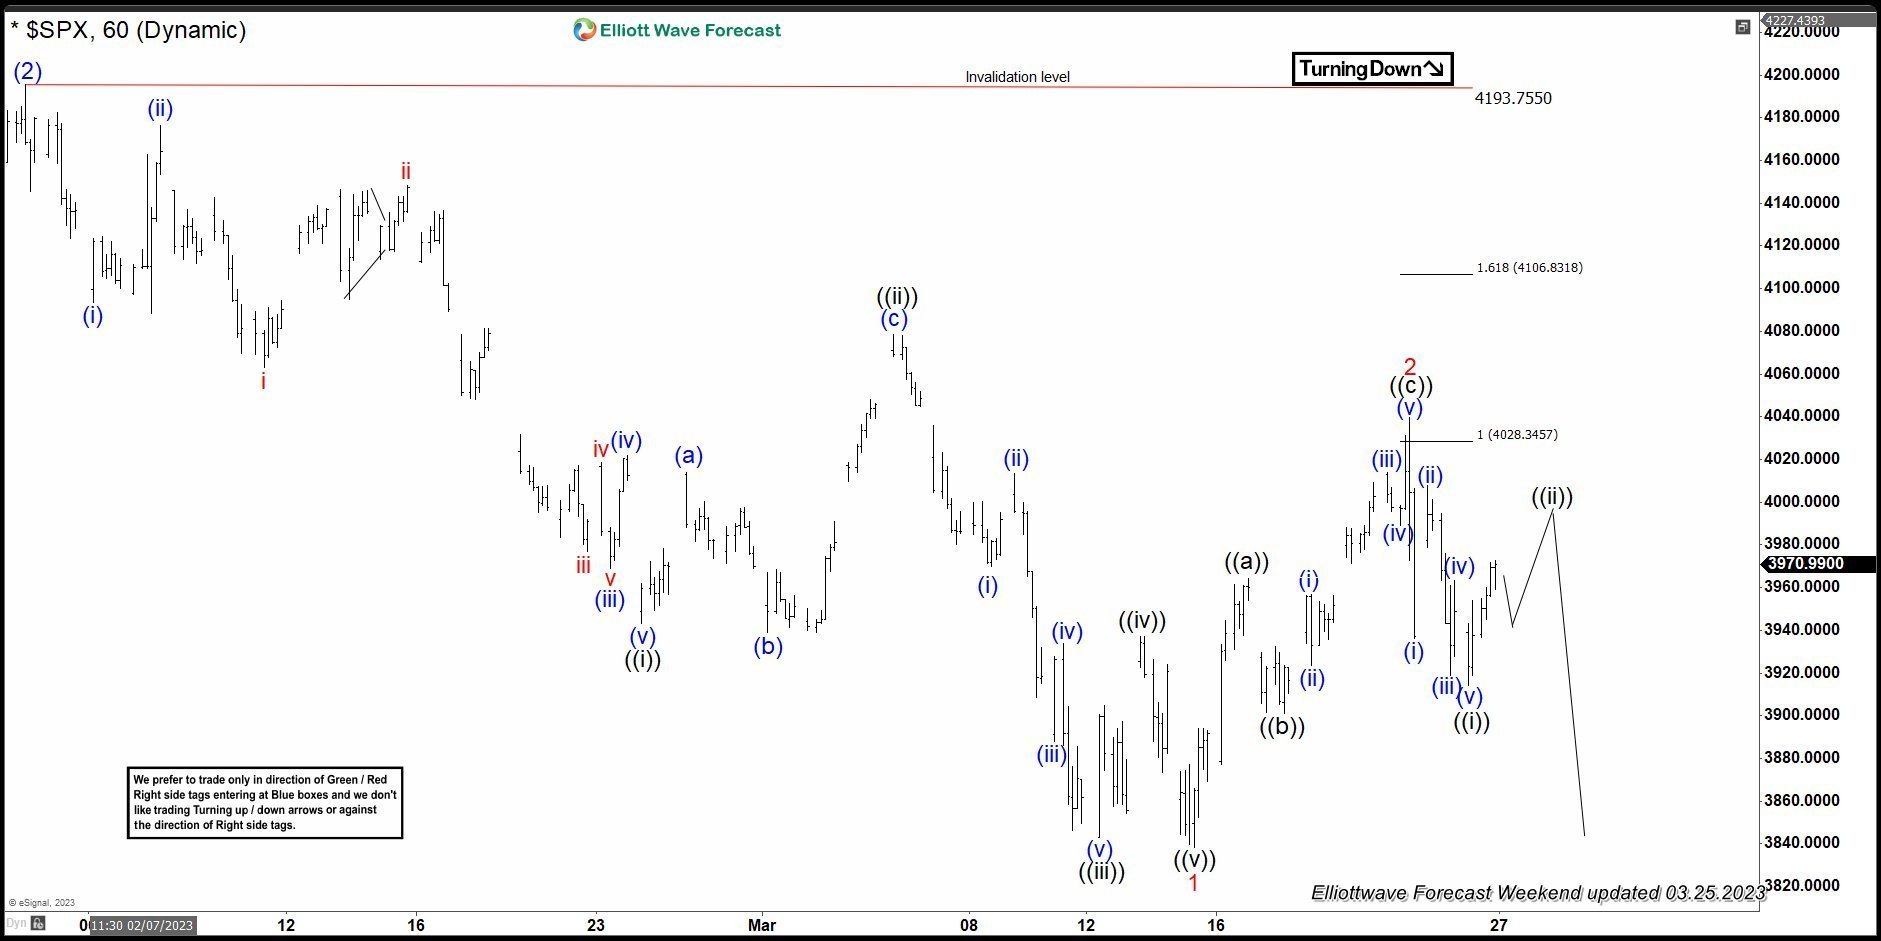
SPX reached our target area 4028.34-4106.83 and found sellers as expected. We got very nice reaction from there. Current view suggests correction can be done at 4039.24 high. That is the key level for proposed short term count. As far as the price stays below that high, continuation lower is favored. Otherwise break above 4039.24 would mean, extension within the short term recovery against the 4193.75 high. In that case SPX could see more upside toward 4132.9+ area.
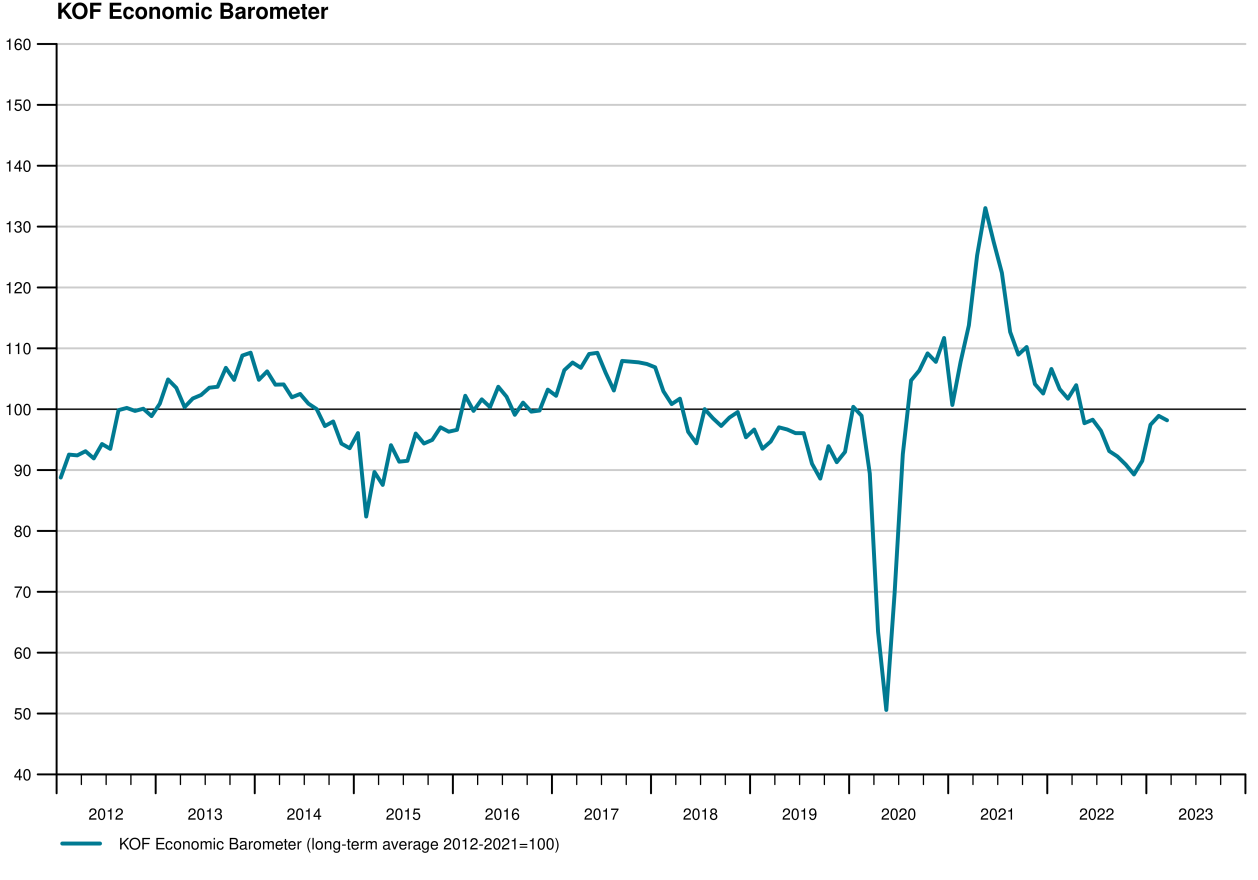
Swiss KOF dipped to 98.2, negative signals from manufacturing, services and construction
Swiss KOF Economic Barometer dropped slightly from 98.9 to 98.2 in March, below expectation of 100.5, staying below average value of 100.
According to KOF, the dip in the overall barometer reading is mainly due to negative signals emerging from the manufacturing, services, and construction sectors. However, these negative developments are partially offset by the positive performance of the Swiss exports indicator bundle. Meanwhile, other indicators incorporated in the barometer exhibit minimal changes.
GBP/JPY Daily Outlook
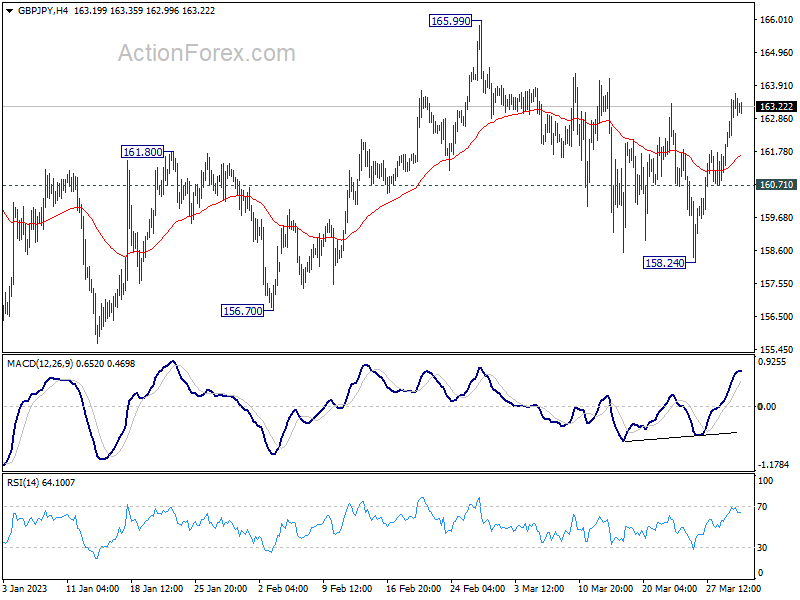
Daily Pivots: (S1) 162.11; (P) 162.90; (R1) 164.43; More...
Intraday bias in GBP/JPY remains on the upside for the moment. Pull back from 165.99 could have completed at 158.24 already. Further rise should be seen to 165.99 first. Break there will resume the whole rebound from 155.33 to 169.26 resistance. On the downside, however, break of 160.71 will mix up the outlook and turn intraday bias neutral.
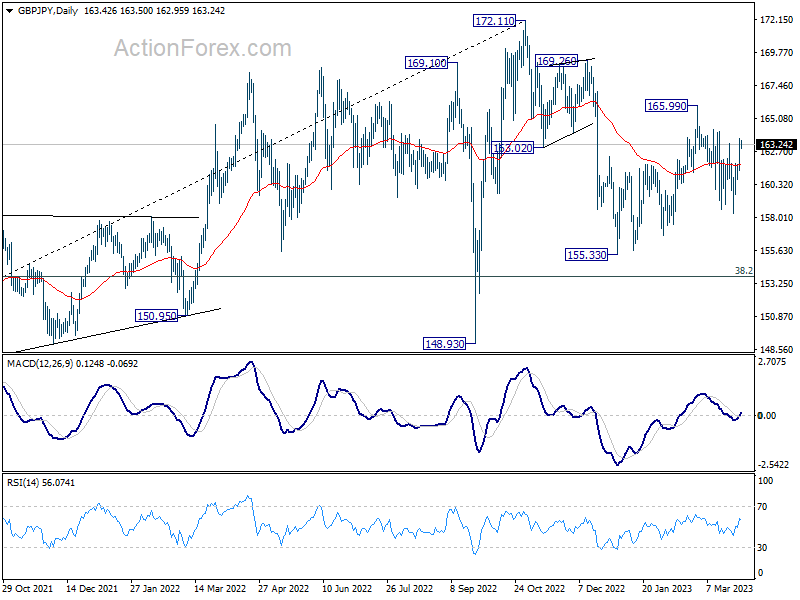
In the bigger picture, as long as 38.2% retracement of 123.94 (2020 low) to 172.11 (2022 high) at 153.70 holds, medium term bullishness is retained. That is, larger up trend from 123.94 (2020 low) is still in progress. Break of 172.11 high to resume such up trend is expected at a later stage.
EUR/JPY Daily Outlook
Daily Pivots: (S1) 142.55; (P) 143.33; (R1) 144.87; More....
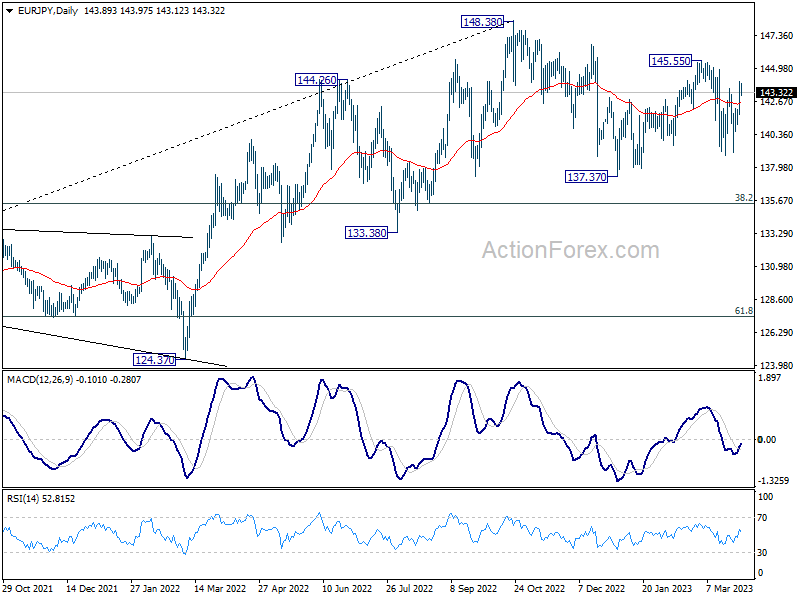
Intraday bias in EUR/JPY remains on the upside for the moment. Pull back from 145.55 could have completed at 138.81 already. Further rise would be seen to 145.55 first. Break there will resume the whole rebound from 137.37 and target a test on 148.38 high. On the downside, though, below 142.21 minor support will mix up the outlook again and turn intraday bias neutral.
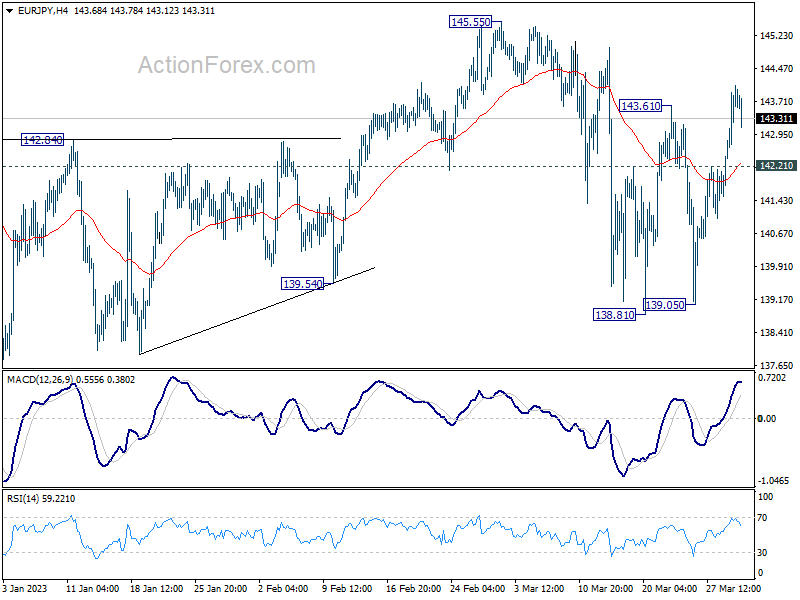
In the bigger picture, as long as 55 week EMA (now at 139.58) holds, larger up trend from 114.42 (2020 low) is still in progress for 149.76 long term resistance. However, sustained break of 55 week EMA will bring deeper fall to 38.2% retracement of 114.42 to 148.38 at 135.40. Decisive break there will raise the chance of trend reversal, and target 61.8% retracement at 127.39.
EUR/GBP Daily Outlook
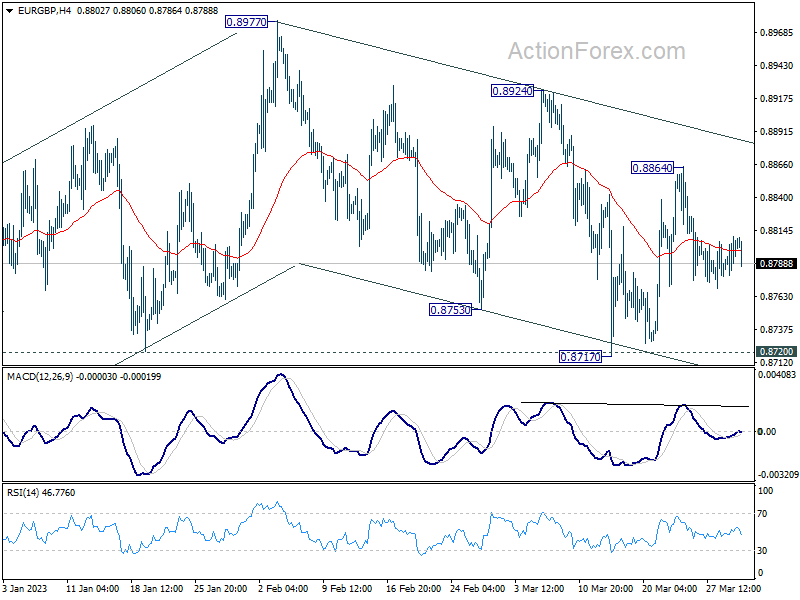
Daily Pivots: (S1) 0.8788; (P) 0.8799; (R1) 0.8818; More...
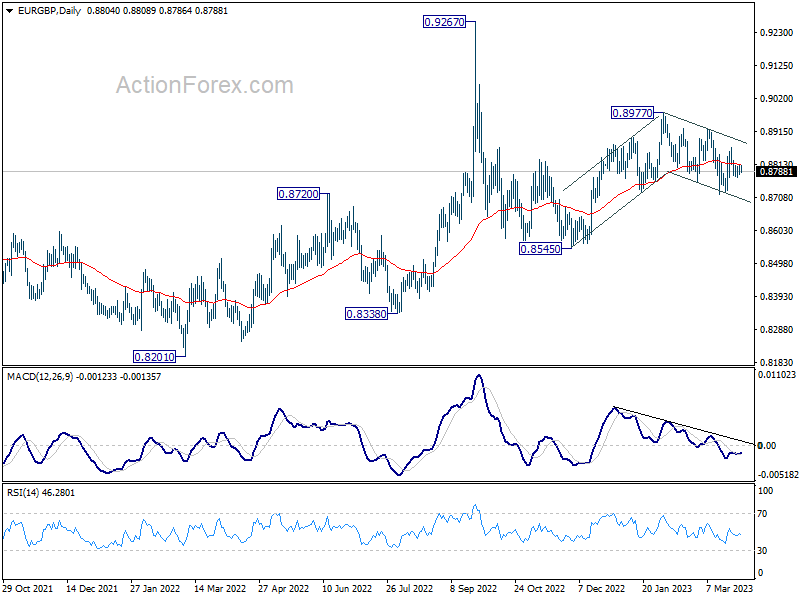
Intraday bias in EUR/GBP stays neutral for the moment, and outlook remains mixed. On the upside, break of 0.8864 will target 0.8924 resistance first. Firm break there should resume larger rise from 0.8545 through 0.8977 high. However, decisive break of 0.8717 support will resume the decline from 0.8977 instead.
In the bigger picture, outlook remains rather mixed for now, except that price actions from 0.9267 (2022 high) are part of the long term range pattern from 0.9499 (2020 high). With 0.8720 support intact, rise from 0.8545 is in favor to continue through 0.8977. However, firm break of 0.8720 will argue that such rebound has completed, and open up deeper fall through this support level.
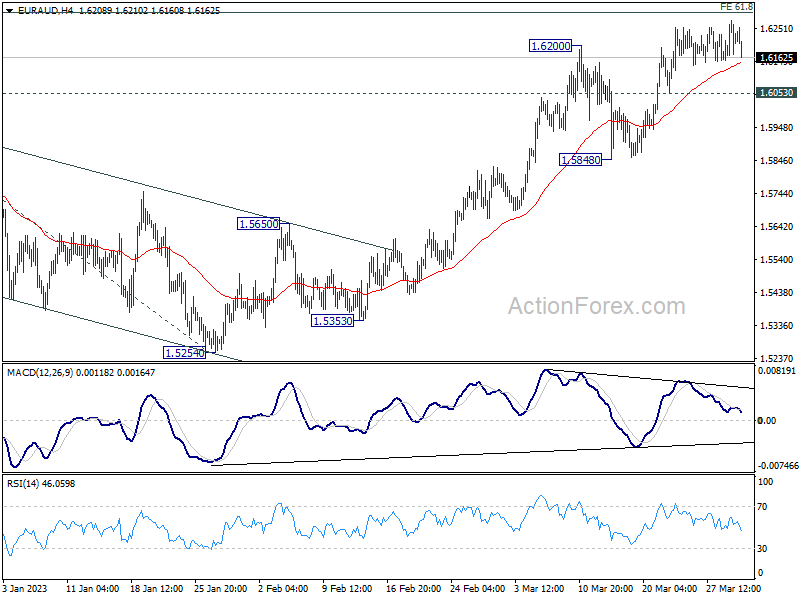
EUR/AUD Daily Outlook
Daily Pivots: (S1) 1.6162; (P) 1.6219; (R1) 1.6282; More...
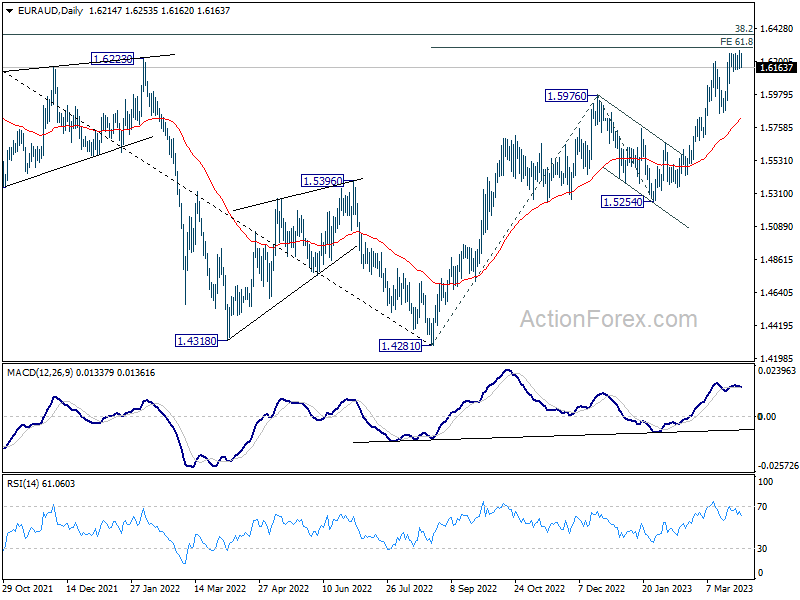
Intraday bias in EUR/AUD remains neutral at this point. Further rally is expected as long as 1.6053 support holds. Decisive break of 61.8% projection of 1.4281 to 1.5976 from 1.5254 at 1.6302 will resume larger rally from 1.4281 to 1.6389 fibonacci level and then 1.6434 resistance. However, firm break of 1.6053 will indicate rejection by 1.6302 and turn bias back to the downside for 1.5848 support.
In the bigger picture, the strong support from 55 week EMA (now at 1.5404) is raising the chance of bullish trend reversal. Focus is now on 1.6434 cluster resistance (38.2% retracement of 1.9799 to 1.4281 at 1.6389). Sustained break there should confirm that whole down trend from 1.9799 (2020 high) has completed. Further rally should then be seen to 61.8% retracement at 1.7691. However, rejection by this cluster resistance will make medium term outlook neutral at best.
EUR/CHF Daily Outlook
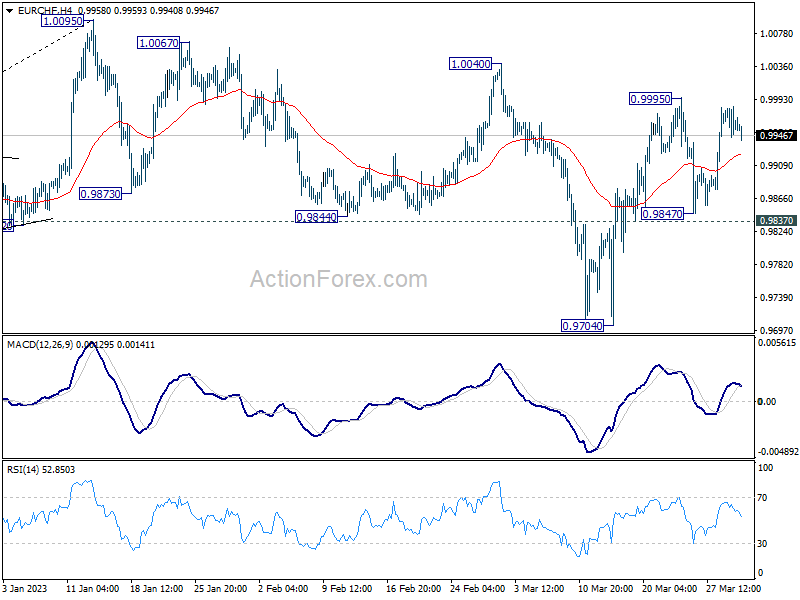
Daily Pivots: (S1) 0.9943; (P) 0.9964; (R1) 0.9982; More...
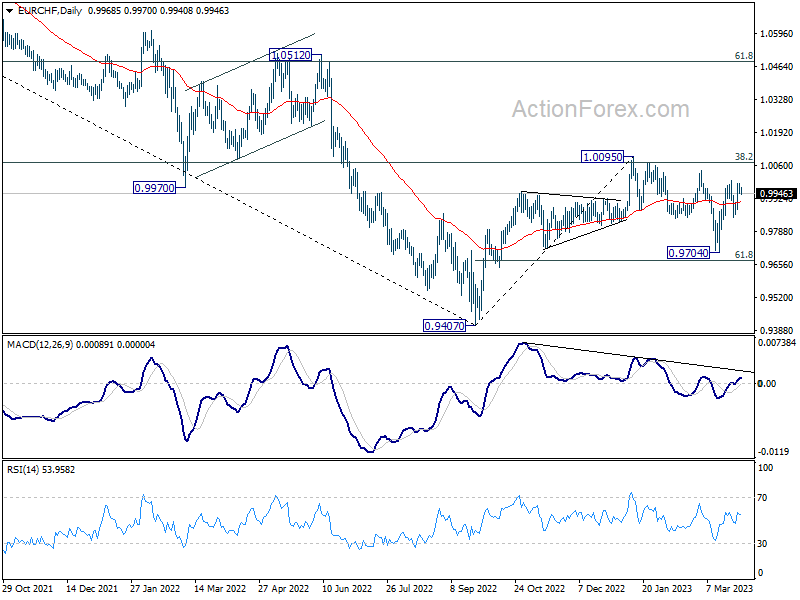
Range trading continues in EUR/CHF and intraday bias remains neutral. Further rally is expected with 0.9837 support intact. On the upside, break of 0.9995 will affirm the case that correction from 1.0095 has completed at 0.9704. Further rally should be seen through 1.0040 to retest 1.0095 high. However, firm break of 0.9837 will dampen this bullish view and turn bias back to the downside for 0.9704 support instead.
In the bigger picture, prior rejection by 55 week EMA (now at 1.1002) and 38.2% retracement of 1.1149 to 0.9407 at 1.0072 suggests that medium term outlook is staying bearish. That is, down trend from 1.2004 is not completed yet and is in favor to resume through 0.9407 at a later stage. However, decisive break of 1.0095 resistance will raise the chance of bullish trend reversal. Rise from 0.9407 should then target 1.0505 cluster resistance (2020 low at 1.0505, 61.8% retracement of 1.1149 to 0.9407 at 1.1484).
EUR/USD Daily Outlook
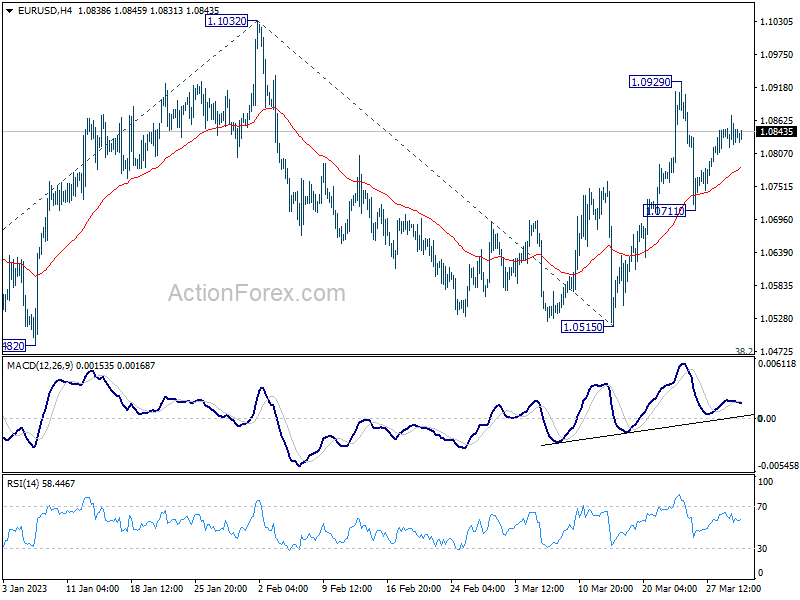
Daily Pivots: (S1) 1.0818; (P) 1.0845; (R1) 1.0872; More...
Intraday bias in EUR/USD remains neutral for the moment as range trading continues. Further rally is in favor and break of 1.0929 will extend the rise from 1.0515 to retest 1.1032 high. Firm break there will resume larger up trend from 0.9534 to 1.1273 fibonacci level next. However, break of 1.0711 will turn bias to the downside to extend the corrective pattern from 1.1032 with another decline.
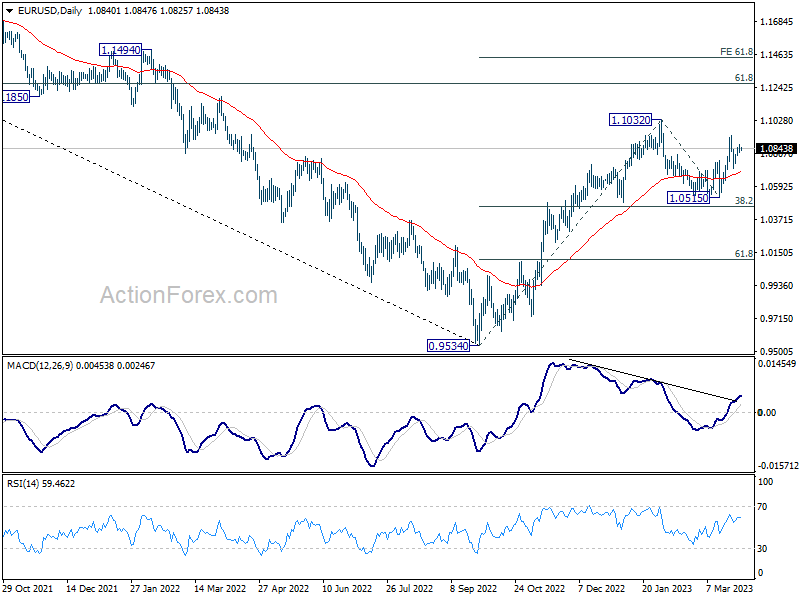
In the bigger picture, rise from 0.9534 (2022 low) is in progress with 38.2% retracement of 0.9534 to 1.1032 at 1.0460 intact. The strong support from 55 week EMA (now at 1.0623) was also a medium term bullish sign. Next target is 61.8% retracement of 1.2348 (2021 high) to 0.9534 at 1.1273. Sustained break there will solidity the case of bullish trend reversal and target 1.2348 resistance next (2021 high).
GBP/USD Daily Outlook
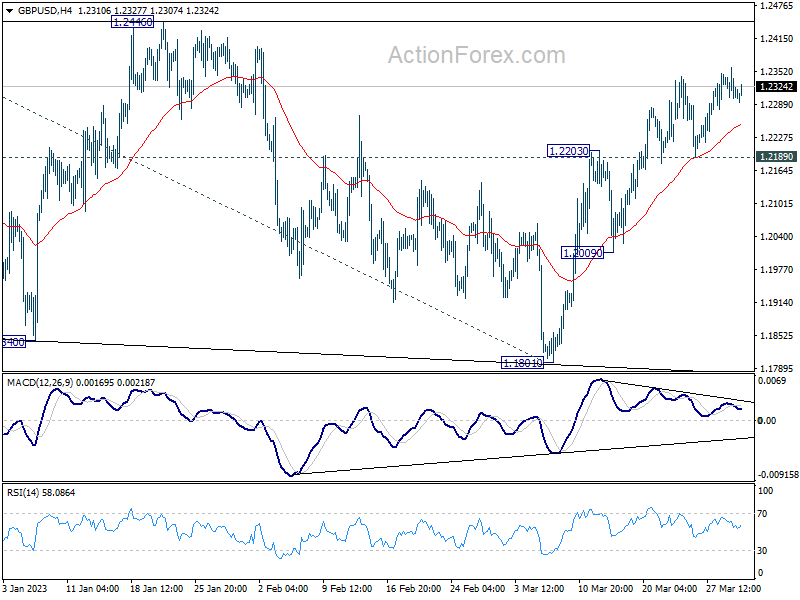
Daily Pivots: (S1) 1.2292; (P) 1.2327; (R1) 1.2351; More...
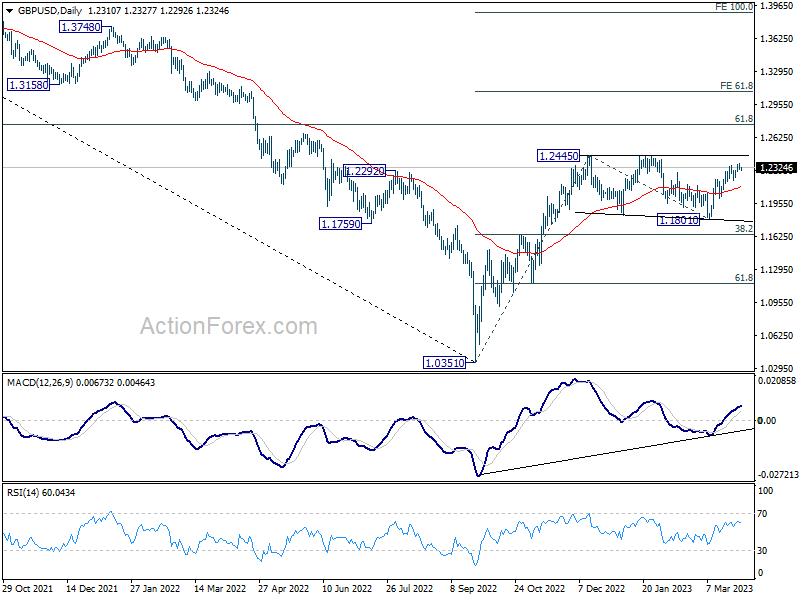
GBP/USD is losing some upside momentum as seen in 4 hour MACD. But further rally is expected as long as 1.2189 support holds, to 1.2445/6 resistance zone. Firm break there will resume larger rally from 1.0351, and target 1.2759 fibonacci level. However, break of 1.2189 will turn bias to the downside to extend the corrective pattern from 1.2445 with another falling leg.
In the bigger picture, price action from 1.2445 are seen as a corrective pattern to rise from 1.0351 medium term bottom (2022 low). Resumption of the rally from 1.0351 is expected and break of 1.2446 will target 61.8% retracement of 1.4248 (2021 high) to 1.0351 at 1.2759. This will remain the favored case as long as 38.2% retracement of 1.0351 to 1.2445 at 1.1645 holds.