

Sample Category Title
USD/CHF Daily Outlook
Daily Pivots: (S1) 0.9159; (P) 0.9191; (R1) 0.9216; More...
No change in USD/CHF's outlook as range trading continues. Intraday bias remains neutral. Corrective pattern from 0.9058 low is extending. Another rise cannot be ruled out, but upside should be limited by 0.9474 fibonacci level. On the downside, firm break of 0.9058 will resume larger down trend from 1.1046.
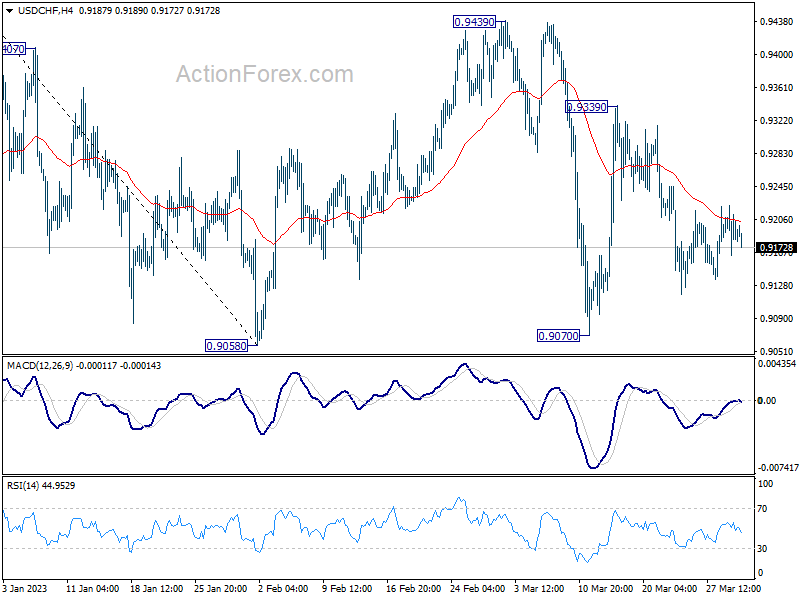
In the bigger picture, fall from 1.1046 (2022 high) should still be in progress with 38.2% retracement of 1.0146 to 0.9058 at 0.9474 intact. Prior rejection by 55 week EMA was a medium term bearish sign. Break of 0.9058 will resume such decline towards 0.8756 support (2021 low). But overall, this fall is still as a leg in the long term range pattern from 1.0342 (2016 high). So, downside should be contained by 0.8756 to bring reversal.
USD/JPY Daily Outlook
Daily Pivots: (S1) 131.46; (P) 132.17; (R1) 133.59; More...
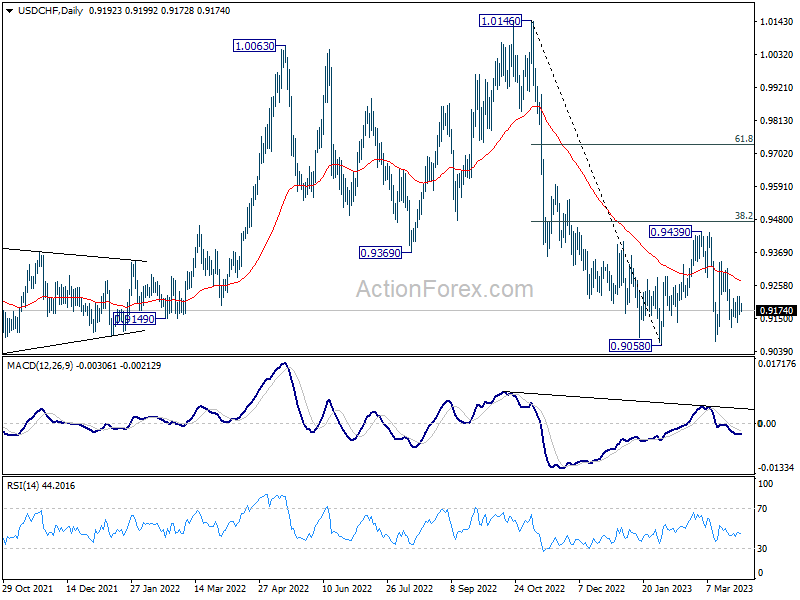
Intraday bias in USD/JPY remains neutral and with 132.99 resistance intact, outlook stays bearish. On the downside, break of 129.62 will target a test on 127.20 low. Decisive break there will resume larger decline from 151.93. However, firm break of 132.99 will argue that fall from 137.90 has completed, and turn bias back to the upside for 137.90.
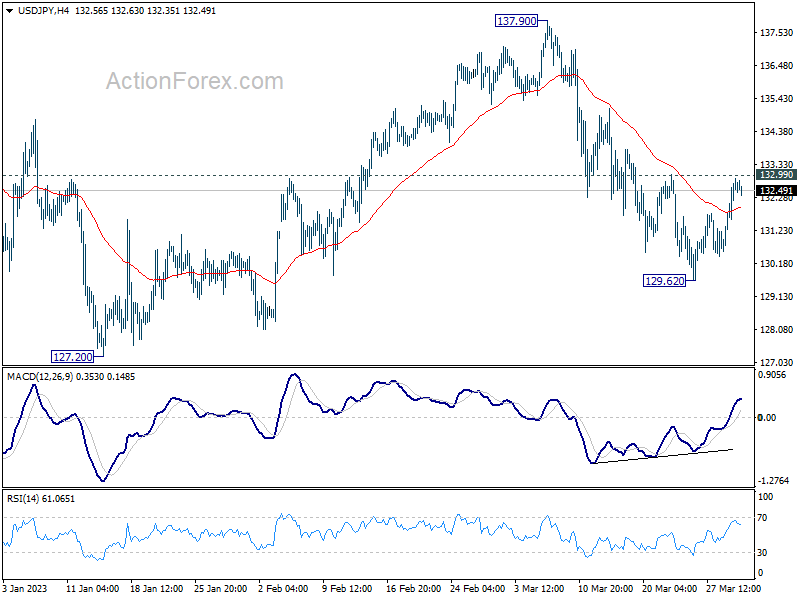
In the bigger picture, rebound from 127.20 should have completed at 137.90 as a corrective move. The down trend from 151.93 (2022 high) is still in progress. Break of 127.20 will resume this down trend and target 61.8% projection of 151.93 to 127.20 from 137.90 at 122.61. This will now be the favored case as long as 137.90 resistance holds.
AUD/USD Daily Report
Daily Pivots: (S1) 0.6660; (P) 0.6686; (R1) 0.6711; More...
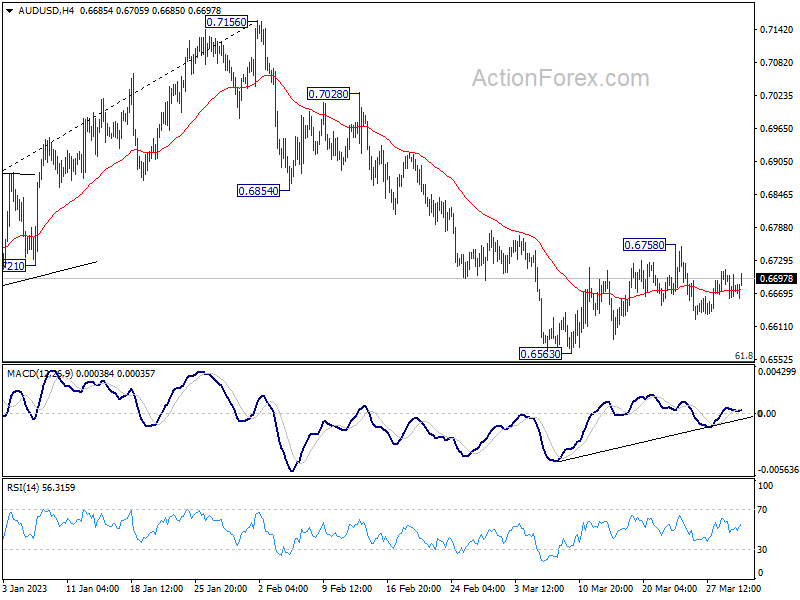
Range trading continues in AUD/USD and intraday bias stays neutral. Deeper decline is in favor as long as 0.6758 resistance holds. On the downside, decisive break of 0.6546 fibonacci level will carry larger bearish implication. On the upside, however, break of 0.6758 resistance will now be a strong signal of bullish reversal and turn bias back to the upside.
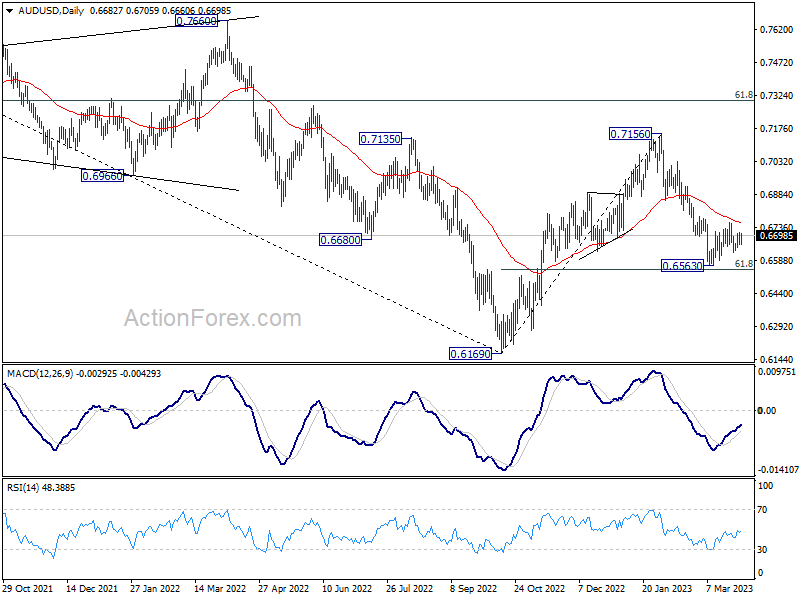
In the bigger picture, as long as 61.8% retracement of 0.6169 to 0.7156 at 0.6546 holds, the decline from 0.7156 is seen as a correction to rally from 0.6169 (2022 low) only. Another rise should still be seen through 0.7156 at a later stage. However, sustained break of 0.6546 will raise the chance of long term down trend resumption through 0.6169 low.
Elliott Wave Suggests Bitcoin (BTCUSD) Should Continue Impulsive Rally Higher
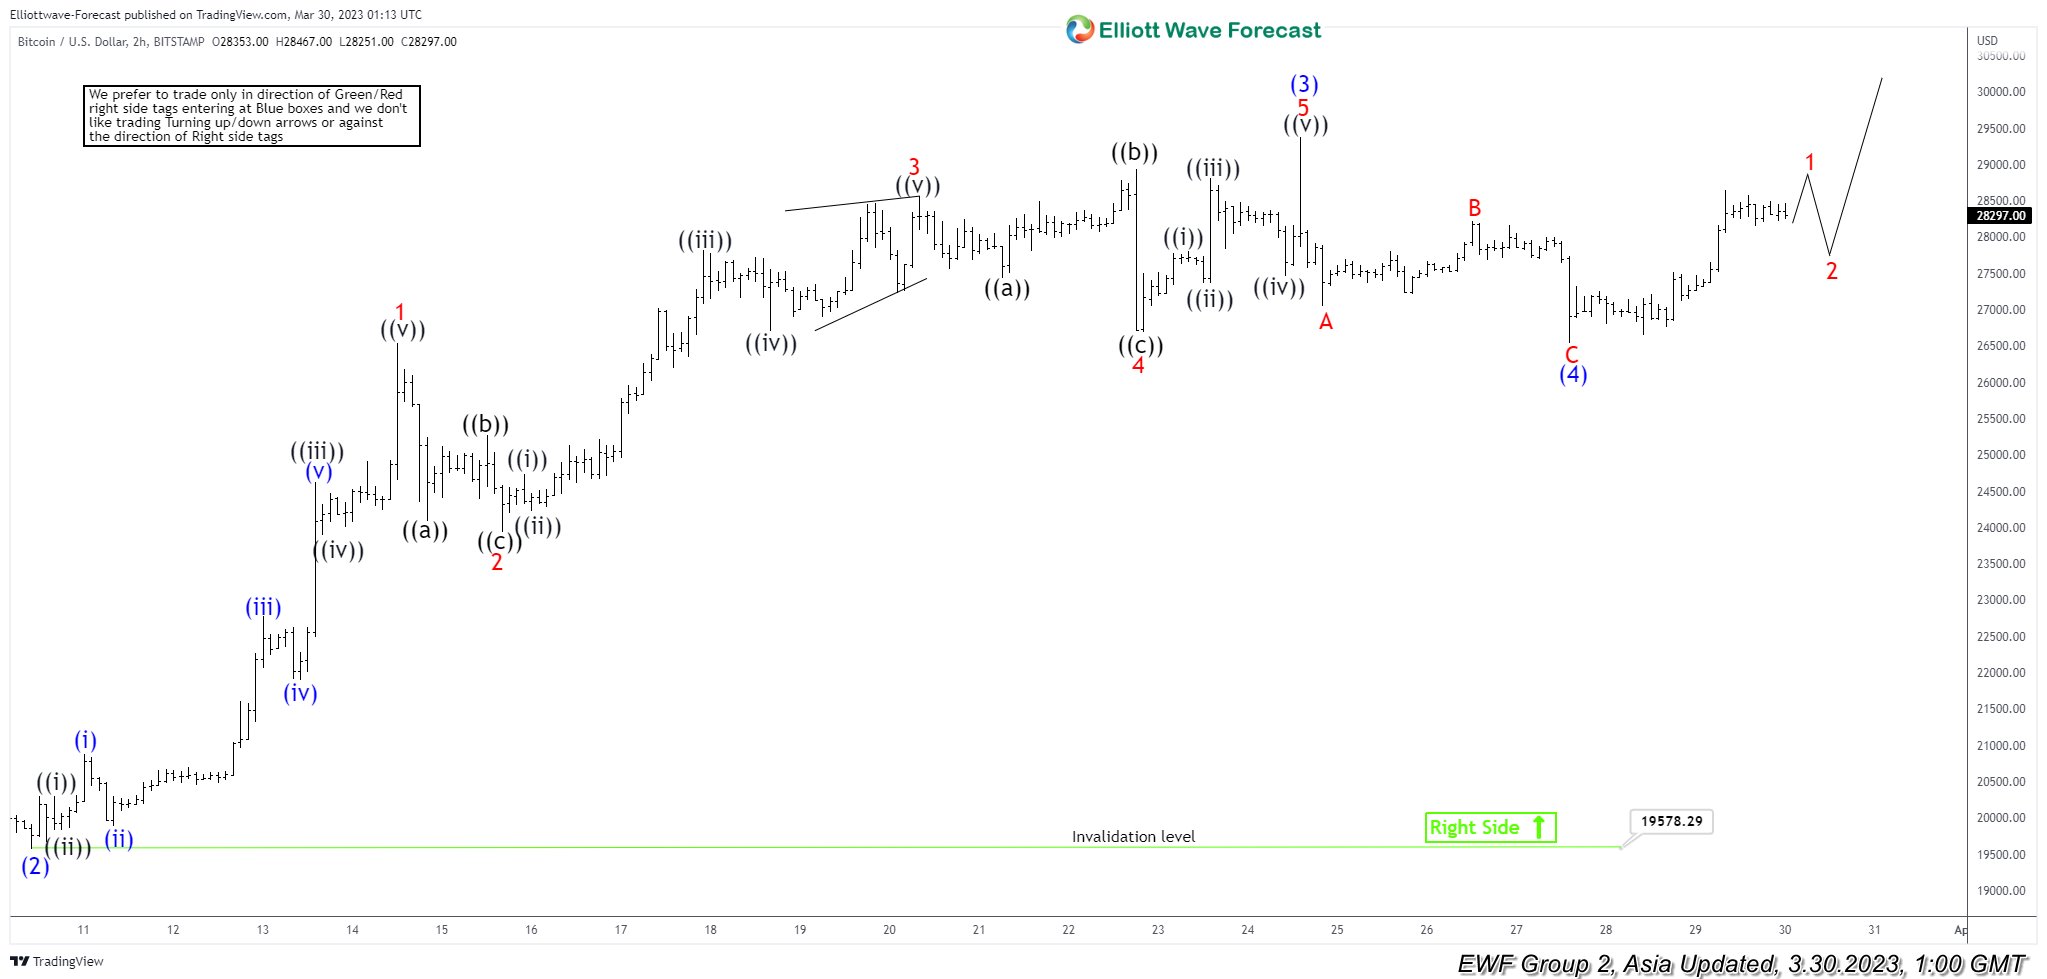
Rally from 11.21.2022 low is in progress as a 5 waves impulse Elliott Wave structure. Up from 11.21.2022 low, wave (1) ended at 25250 and pullback in wave (2) ended at 19578. The crypto-currency extends higher again in wave (3) towards 29380 with internal subdivision as another 5 waves in lesser degree. Up from wave (2), wave 1 ended at 26533 and dips in wave 2 ended at 23940. Bitcoin extends higher again in wave 3 towards 28567 and pullback in wave 4 ended at 26688. Final leg wave 5 ended at 29380 which also completed wave (3) in higher degree.
Bitcoin then pullback in wave (4) with internal subdivision as a zigzag structure. Down from wave (3), wave A ended at 27043 and rally in wave B ended at 28217. Final leg wave C ended at 26541 which completed wave (4). Wave (5) higher is currently ongoing with internal subdivision as a 5 waves impulse. Wave 1 of (5) is expected to end soon, then it should pullback in wave 2. Afterwards, it should extend higher again in wave 3, pullback in wave 4, and make final move wave 5 of (5). Near term, while dips stay above wave (4) at 26541, but more importantly above wave (2) at 19578, expect the crypto-currency to extend higher again.
BTCUSD 2 Hour Elliott Wave Chart
Bitcoin (BTCUSD) Elliott Wave Video
https://www.youtube.com/watch?v=yEaDSAIMfQ0
Eyes on US GDP and Eurozone CPI Data
Treasuries were flat to cautiously sold on the short-end and capital flew into riskier assets as bank stress further waned on Wednesday.
The US 2-year yield consolidated above the 4% mark, gold retreated to $1955 per ounce this morning, whereas the S&P500 rallied 1.42%, pulled out the 50-DMA offers and closed above the 4000 mark. Nasdaq 100 rallied nearly 2% and entered bull market.
If you look at the equity markets today, you could hardly guess that there is still a bank stress going on underneath, which threatens credit availability and calls for a potential recession.
The falling yields, and more importantly the waning volatility on bonds help keeping the bulls in charge.
But it’s important to remember that sentiment remains fragile after such a shaky month for banks; commercial bank deposits are trending lower, as higher-yielding savings alternatives like treasury bills and money market funds amass decent inflows. That’s not only messing with the broad-based market pricing, but also blurs the central bank expectations.
And more importantly, if attention could finally shift to economic data, and economic data is not ideal, we could see the winds change rapidly direction in sovereign bonds pricing.
And when I talk about unideal economic data, I really think of a sticky inflation – which would require further rate hikes from the Federal Reserve (Fed), and other central banks.
US GDP and EZ CPI in focus
Due today, the US will reveal its latest GDP update. The expectation is that the US economy grew 2.7% in Q4 with a stable GDP price index at around 3.9%.
While higher-than-expected inflation indicator is bad, resilient growth could see a positive market reaction on thinking that… we are almost done with Fed rate hikes, and the economy is at a significantly better place compared to where we thought it would be by now.
If that’s the case, the sovereign yields could continue to trend higher, without necessarily weighing on equity appetite.
A soft data, on the other hand, could further push the Fed hawks away, and boost equity appetite on softening Fed expectations.
But building long positions expecting recession is not the best strategy in the medium run.
In the Eurozone, March CPI data that will be coming in from this morning till Friday. And what makes the March numbers so special is that, from March, consumer prices of today will be compared only to the war months.
The latter is expected to have a significant cooling effect on the inflation data.
The EZ inflation is expected to ease from 8.5% to 7.1% in March. BUT core inflation, which filters out energy and food prices, is expected to trend higher. The latter would keep the European Central Bank (ECB) hawks ready for a further rise toward 1.10 against the greenback.
In energy, tensions in Kurdish region of Iraq which leads to a 500’000 barrel decline in supply and the surprise 7.5-mio barrel decline in US crude inventories last week helped pushing the price of American crude to $74 per ounce. We are now back to the levels before the Silicon Valley Bank (SVB) collapse.
Yet, because the bank stress is not over just yet, and the impact on the real economy is yet to be seen, we could encounter a decent resistance into the $75/77 range, which shelter the 50 and 100-DMA.
German and Spanish Inflation Prints in Focus
Market movers today
The main focus today will be on the German and Spanish flash inflation data, which will provide the first sense of what to expect from the euro area HICP figures tomorrow. Generally, we forecast gradually easing headline inflation, but see core inflation pressures still remaining at elevated levels. Euro area Economic Sentiment Indicators will also be released for March today.
In the evening, a range of Fed speakers will be on the wires, including Collins, Barkin and Kashkari.
Overnight, the official Chinese PMIs will be released for March. We look for a slight moderation as the initial post-Covid lift to activity has likely eased, but still expect both manufacturing and services indices to signal above-trend pace of growth.
The 60 second overview
Market sentiment: Asian equities are in red, while stock market futures are mixed in Europe and the US. In the absence of any news triggers, markets are tuning in for the Spanish and German inflation prints due this morning.
US banks: The US Federal Deposit Insurance Corp. (FDIC) is facing almost USD 23bn in costs from the failures of Signature and Silicon Valley Banks. Now, according to Bloomberg, the FDIC is contemplating to propose a so-called special assessment to speed up the process of refilling the fund, and the plan entails an outsize contribution by the largest lenders. The impacts on larger banks are expected to go beyond the contributions during the 2009 special assessment where e.g. JPMorgan had USD 675mn extracted from its earnings.
AT1 market: Yesterday, investors warned on FT that the investor treatment in Credit Suisse case could impair banks' ability to issue AT1 bonds, and lead to a more fragmented market where particularly smaller and weaker banks have to pay a higher risk premium going forward. AT1 bonds are perpetual but typically the issuers refinance the bonds with new issuance once the initial non-call period has expired. More than USD 37bn worth of AT1 debt issued globally has call dates in April alone that is app. 14% of the total AT1 market which is dominated by European banks (80% of the total amount outstanding).
Nordic consumers: Nordic retail sales came out mixed yesterday. In Sweden, consumers are clearly getting squeezed now as rising interest rates eat their disposable income. Retail sales fell 1.2% from previous month in February, and the 9.4% y/y change is the worst print since the time series began in 1992. On the opposite, in Norway, retail sales surprised to the upside maintaining a positive momentum in February (+0.2% m/m), but looking through monthly volatility, the trend is downwards this year.
FI: Yesterday, European yields rose on the back of comments from various ECB officials. ECBs Lane and Kazimir both stated that more rate hikes are needed as soon as the current financial tensions has eased. Hence, the hawks at the ECB are ready to raise rates when the market returns to "normal". However, the number and pace of the rate hikes is uncertain as Kazimir stated that "the pace of rate hikes may need to slow".
FX: Yesterday's FX session was dominated by Scandi weakness and a setback to the JPY, which likely was down to month-end interests. EUR/USD remains close to the 1.0850 level.
Credit: Mirroring the overall positive sentiment yesterday, credit markets continued to see tightening in CDS indices. iTraxx Main closed the day 5.8bp lower at 89.7bp, while iTraxx Xover was 24.5bp lower at 462.1bp. The primary market continued a constructive tone which also benefitted the service provider Securitas to print a EUR600m 4Y bond at final terms of MS+120bp, travelling from IPT of MS+150bp.
Nordic macro
Riksbank releases the report Account of Monetary Policy 2022 at 09.30 CET. It will be interesting to see how it justifies the steps taken last year, however, we doubt anything forward-looking will come out of this report.
More market-friendly is perhaps Deputy Governor Bunge speaking 14.40 CET about what could be dome to ensure financial stability together with FSA's chief economist Henrik Braconier and Lars Heikensten who is the Chairman of the Fiscal Policy Council and former Riksbank Governor.
USD/CAD Daily Outlook
Daily Pivots: (S1) 1.3562; (P) 1.3628; (R1) 1.3665; More....
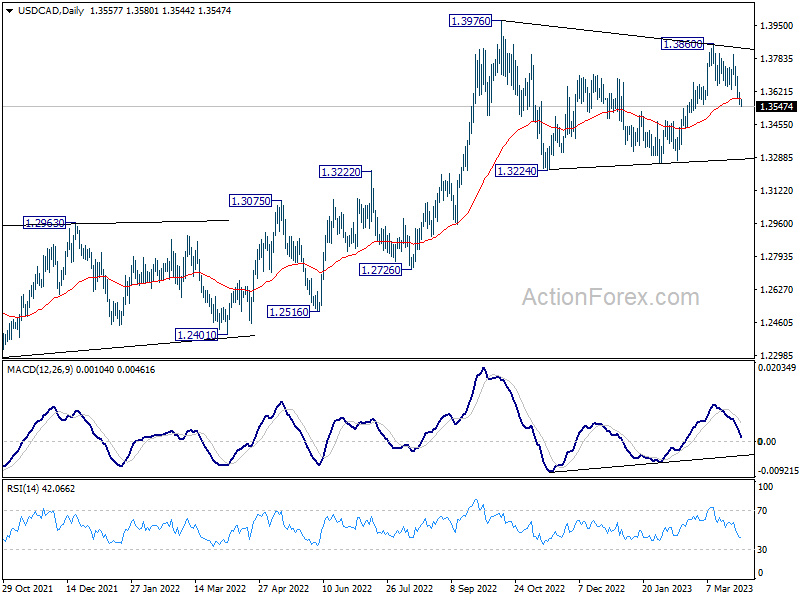
Intraday bias in USD/CAD remains on the downside for the moment, and further fall is expected as long as 1.3650 support turned resistance holds. Currently decline from 1.3860 could be seen as the third leg of the corrective pattern from 1.3976, and would target 1.3224. But strong support should be seen around there to bring rebound.
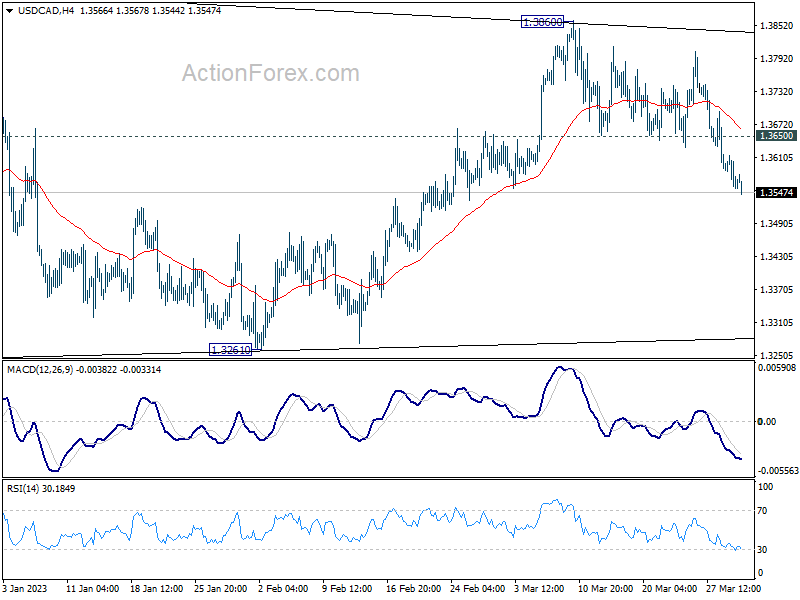
In the bigger picture, the up trend from 1.2005 (2021 low) is still in progress. Break of 1.3976 will confirm resumption and target 61.8% projection of 1.2401 to 1.3976 from 1.3261 at 1.4234. Firm break there will pave the way to long term resistance zone at 1.4667/89 (2016, 2020 highs). On the downside, sustained break of 55 week EMA (now at 1.3283) is needed to confirm medium term topping. Otherwise, outlook will remain bullish even in case of deep pull back.
Canadian Dollar Shines in Quiet Markets, Traders Await Tomorrow’s Inflation Data
In the quiet Asian session, Canadian Dollar continues to outperform, while positive risk sentiment is providing a slight boost to Australian Dollar, though not New Zealand Dollar. Euro is drawing support from hawkish remarks by ECB officials but lacks strong follow-through buying. Yen, Swiss Franc, and Dollar remain the weaker currencies this week, reflecting overall market sentiment. Trading may stay subdued until tomorrow's Eurozone and US inflation data release or could be even be on hold until next week's wave of April economic indicators.
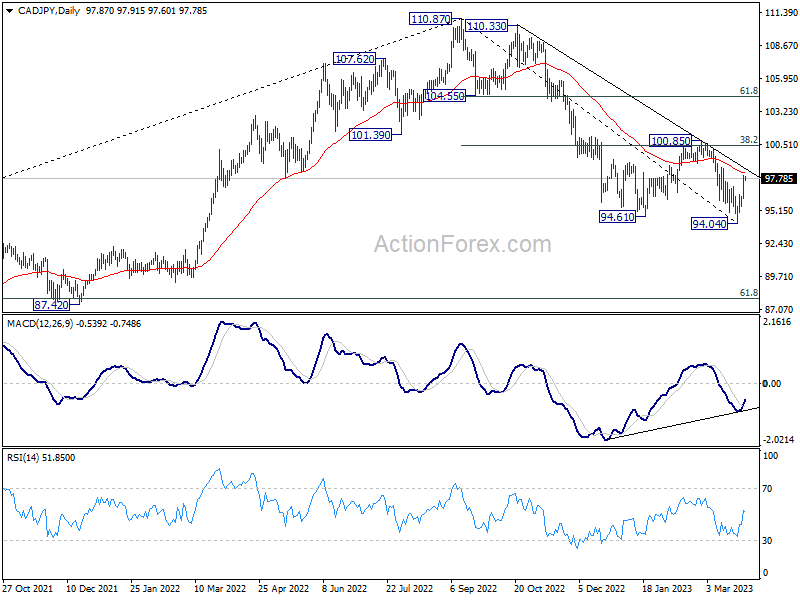
From a technical perspective, CAD/JPY seems to have completed its five-wave impulse from 110.87 to 94.04, as evidenced by bullish convergence in daily MACD. A further rebound towards the 55 day EMA (now at 98.22) and above is expected. The crucial test lies in the 100.85 cluster resistance (38.2% retracement of 110.87 to 94.04 at 100.46). Rejection by this resistance zone will keep outlook bearish for another decline through 94.04 at a later stage.
In Asia, at the time of writing, Nikkei is down -0.54%. Hong Kong HSI is up 0.43%. China Shanghai SSE is up 0.48%. Singapore Strait Times is down -0.25%. Japan 10-year JGB yield is up 0.0145 at 0.321. Overnight, DOW rose 1.00%. S&P 500 rose 1.42%. NASDAQ rose 1.79%. 10-year yield rose 0.002 to 3.566.
ECB Schnabel: Influence of energy price spike may not drop out as quickly as it moves in
ECB Executive Board member Isabel Schnabel commented yesterday on the challenges of underlying inflation in the Eurozone, noting that it has proven "sticky" and may not be significantly impacted by the recent fall in energy costs. Schnabel stated that the influence of the energy price spike "may not drop out as quickly as it moves in" and added that "it's not even clear whether it's going to be completely symmetric in the sense that everything is even going to drop out at all."
Regarding monetary policy, Schnabel acknowledged that the ECB possesses "a bit of flexibility" and emphasized that the central bank's target is defined over the medium term, which prevents the need to "cause unnecessary pain."
As for the recent crisis, Schnabel observed that there has been a shift from overnight deposits to time deposits, but no general deposit outflow from banks, suggesting the banking sector remains relatively resilient. She also noted that the crisis could have a disinflationary effect that the ECB must consider, but the magnitude of that effect remains uncertain at this time.
BoE Mann: Rising core goods and services prices make our job difficult
BoE MPC member Catherine Mann, known for her hawkish stance, highlighted yesterday the difficulties in tackling inflation as core goods and services prices continue to trend upward. Despite falling gas prices, which Mann believes will be crucial in driving headline inflation down, she acknowledged the challenges that persist in managing inflation.
Mann said, "Gas prices in particular are on the down slope, and that type of dynamic is going to be very important in driving headline inflation down." However, she also admitted that "core goods and services are trending up... It is going to make it very difficult to do our job."
Although Mann has previously advocated for more aggressive tightening, she adjusted her vote to a 25 basis point increase during last week's meeting, reflecting the complexities in navigating the current inflationary environment.
BoC Gravelle emphasizes agility amid uncertain times; monitors global banking stress
BoC Deputy Governor Toni Gravelle, in a speech yesterday, stressed the need for flexibility in response to the uncertain economic environment. He pointed out that, within the past month, headline inflation has dropped, and global markets have seen reduced risk appetite, partially due to the increased stress in global banking systems.
Gravelle noted that, despite these challenges, Canada's labor market remains tight, which is pushing many services prices upward. He said, "We continue to expect consumer price index (CPI) inflation to come down in the months ahead, but we will need to see further slowing in core inflation to get CPI inflation back to the 2% target."
As the BoC prepares for the April Monetary Policy Report, Gravelle explained that the central bank is closely monitoring global banking stresses, and will assess the macroeconomic impacts of this evolving situation. He emphasized that the bank will be "looking specifically at potential spillovers into the real economy to the extent that financial conditions tighten and there are broader confidence effects."
NZ ANZ business confidence dipped to -43.4, slowdown aligns with RBNZ's intentions
New Zealand ANZ Business Confidence index in March experienced a slight dip, moving from -43.3 to -43.4, while the Own Activity Outlook improved marginally, rising from -9.2 to -8.5. However, export intentions, investment intentions, employment intentions, and pricing intentions all experienced declines. Cost expectations also fell from 88.3 to 86.4, but profit expectations rose from -37.7 to -33.9. Inflation expectations dropped from 5.94 to 5.82. According to ANZ, firms are cautious but persevering, with indicators suggesting a soft landing.
Although the activity indicators are subdued, the labor market tightness is gradually shifting, and inflation and cost indicators are easing slowly. Nevertheless, the challenging environment is putting pressure on expected profitability as firms navigate high cost inflation and uncertain future demand. ANZ noted that the winter season might reveal more challenges as tourist numbers decline, but for now, the slowdown appears to align with RBNZ's intentions.
Looking ahead
Germany CPI flash is a focus in European session while Eurozone economic sentiment and ECB monthly bulletin will be released. Later in the day, US will publish Q4 GDP final and jobless claims.
USD/CAD Daily Outlook
Daily Pivots: (S1) 1.3562; (P) 1.3628; (R1) 1.3665; More....
Intraday bias in USD/CAD remains on the downside for the moment, and further fall is expected as long as 1.3650 support turned resistance holds. Currently decline from 1.3860 could be seen as the third leg of the corrective pattern from 1.3976, and would target 1.3224. But strong support should be seen around there to bring rebound.
In the bigger picture, the up trend from 1.2005 (2021 low) is still in progress. Break of 1.3976 will confirm resumption and target 61.8% projection of 1.2401 to 1.3976 from 1.3261 at 1.4234. Firm break there will pave the way to long term resistance zone at 1.4667/89 (2016, 2020 highs). On the downside, sustained break of 55 week EMA (now at 1.3283) is needed to confirm medium term topping. Otherwise, outlook will remain bullish even in case of deep pull back.
Economic Indicators Update
| GMT | Ccy | Events | Actual | Forecast | Previous | Revised |
|---|---|---|---|---|---|---|
| 00:00 | NZD | ANZ Business Confidence Mar | -43.4 | -43.3 | ||
| 08:00 | EUR | Italy Unemployment Feb | 8.00% | 7.90% | ||
| 08:00 | EUR | ECB Economic Bulletin | ||||
| 09:00 | EUR | Eurozone Economic Sentiment Mar | 99.7 | 99.7 | ||
| 09:00 | EUR | Eurozone Industrial Confidence Mar | 0.9 | 0.5 | ||
| 09:00 | EUR | Eurozone Services Sentiment Mar | 10.1 | 9.5 | ||
| 09:00 | EUR | Eurozone Consumer Confidence Mar F | -19.2 | -19.2 | ||
| 12:00 | EUR | Germany CPI M/M Mar P | 0.40% | 0.80% | ||
| 12:00 | EUR | Germany CPI Y/Y Mar P | 8.90% | 8.70% | ||
| 12:30 | USD | Initial Jobless Claims (Mar 24) | 195K | 191K | ||
| 12:30 | USD | GDP Price Index Q4 F | 3.90% | 3.90% | ||
| 12:30 | USD | GDP Annualized Q4 F | 2.70% | 2.70% | ||
| 14:30 | USD | Natural Gas Storage | -55B | -72B |
Technical Outlook and Review
DXY:
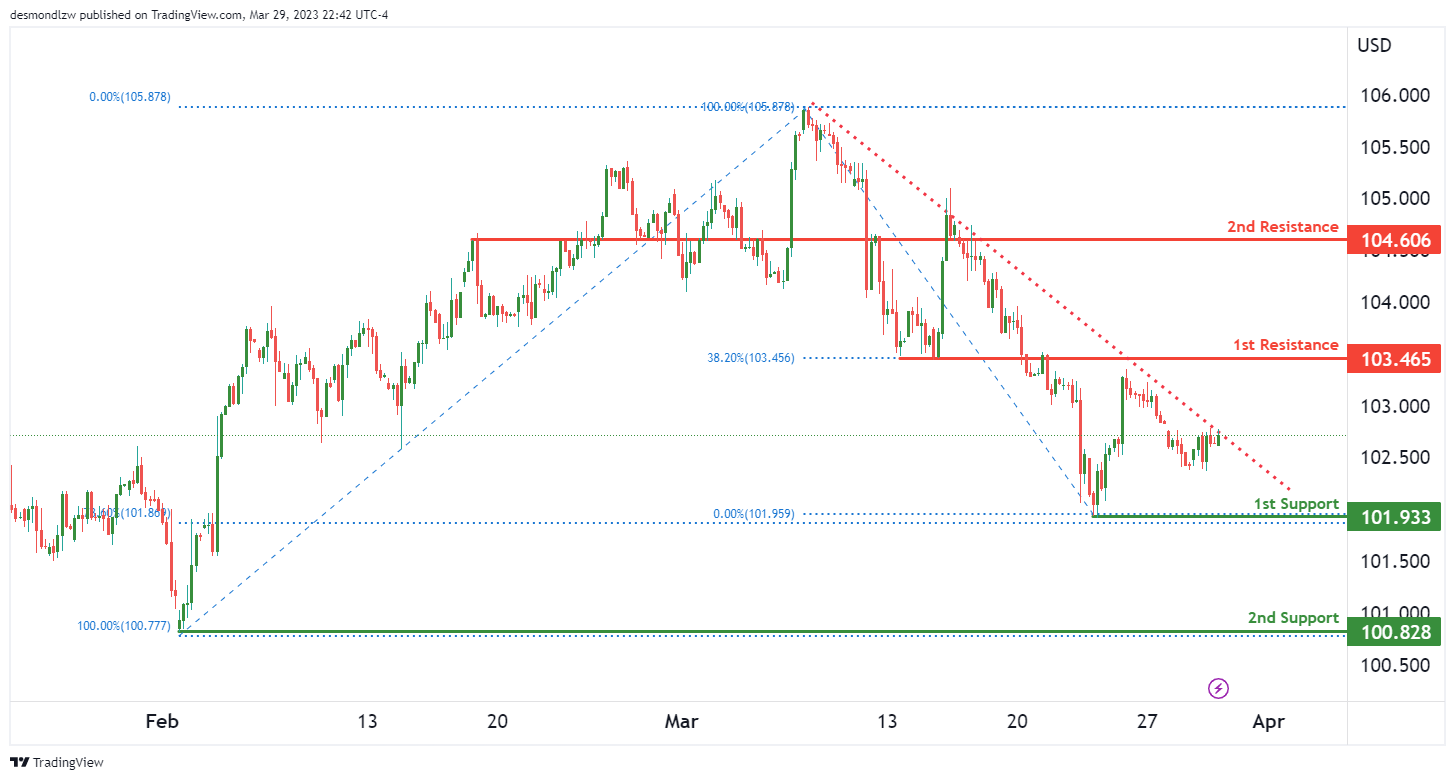
The DXY index is currently experiencing a strong bearish momentum, as it is trading below a major descending trend line. This suggests that there is further room for the price to drop.
In terms of potential price movement, the index could potentially continue its bearish momentum towards the 1st support level at 101.93. This level is a multi-swing low support and is also in confluence with the 78.60% Fibonacci retracement level. If price were to break this support level, it could drop further towards the 2nd support level at 100.82, which is a swing low support.
On the other hand, if price were to rise, it could face resistance at the 1st resistance level of 103.46, which is an overlap resistance level and also coincides with the 38.20% Fibonacci retracement level. A break of this resistance level could potentially lead to the next resistance level at 104.60, which is also an overlap resistance level.
EUR/USD:
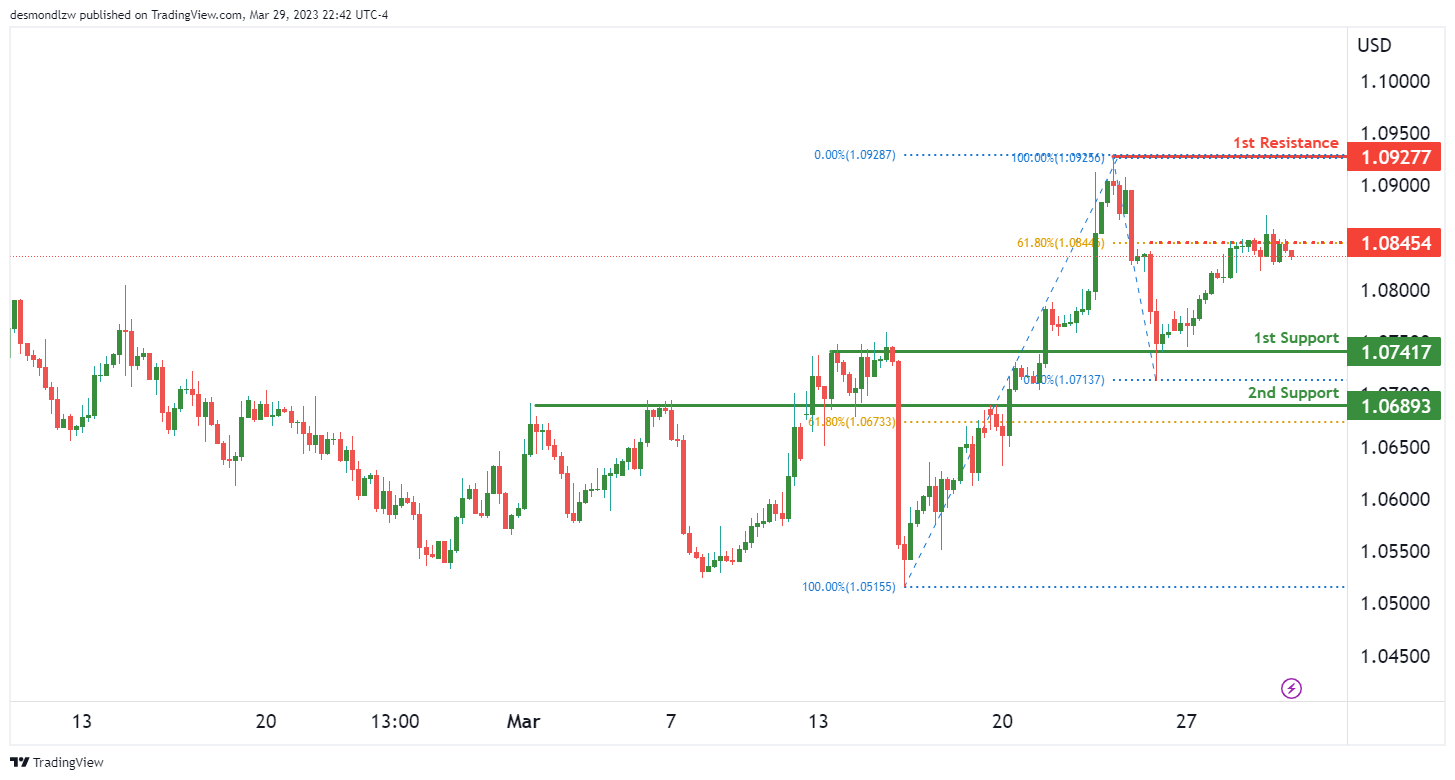
The EUR/USD chart is currently experiencing bearish momentum, with the potential for a continuation towards the 1st support level.
The 1st support level is located at 1.0741, which is an overlap support and could potentially act as a barrier to further price declines. Additionally, this support level lines up with a 61.80% Fibonacci retracement, adding further weight to its significance. Should the price break through this level, the next support level is located at the same 1.0741 level, which is a multi-swing low support.
On the resistance side, we have the 1st resistance level at 1.0927, which is a swing high resistance. This level could potentially prevent the price from rising further. In addition to the 1st resistance level, there is an intermediate resistance level at 1.0845. This level is a multi-swing high resistance and lines up with a 61.80% Fibonacci retracement. A break above this level could trigger a bullish acceleration towards the 1st resistance level.
GBP/USD:
The overall momentum for the GBP/USD chart is bearish, with price potentially making a continuation towards the first support level.
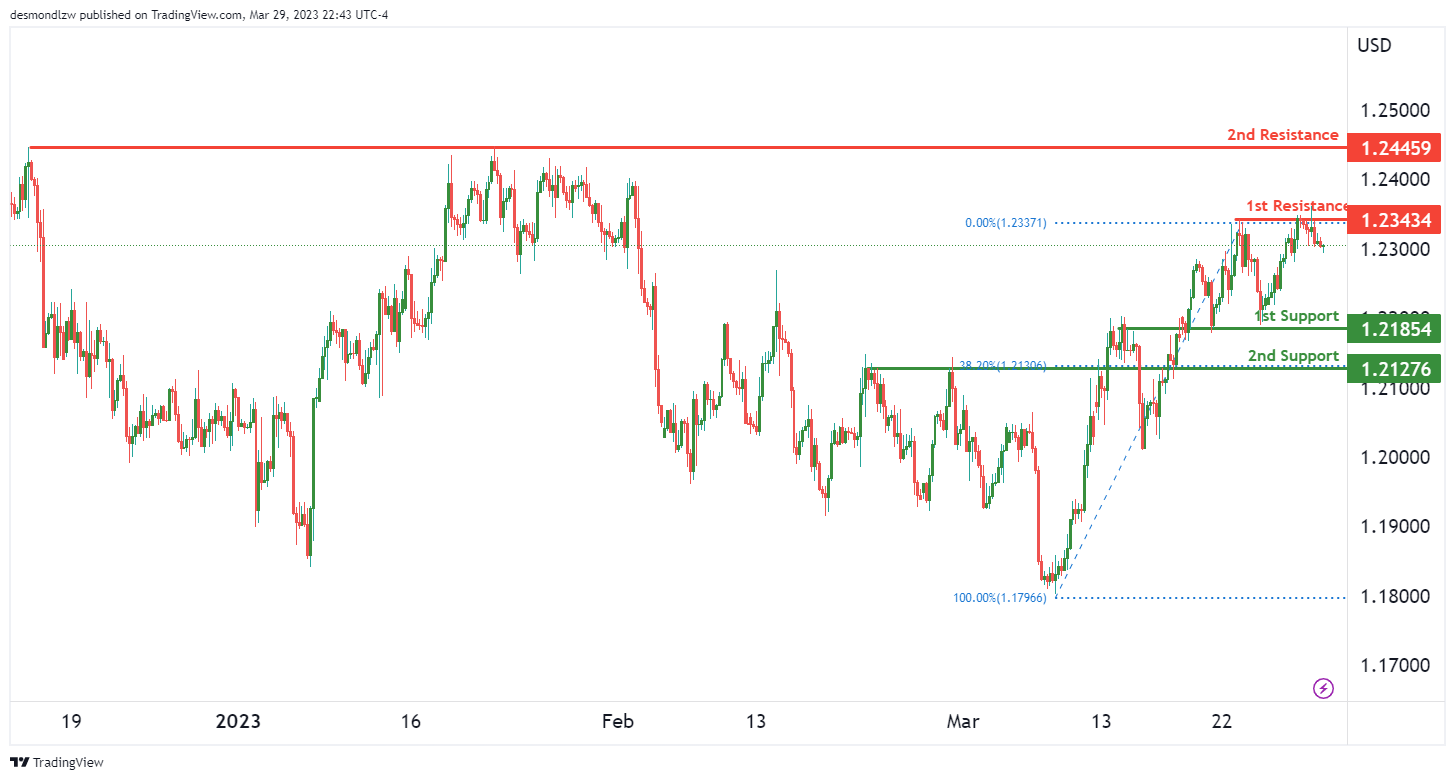
Price is currently testing the first resistance at 1.2343, which is a multi-swing high resistance level. If price were to fail to break through this resistance, it could trigger a bearish move towards the first support at 1.2185. This level is a strong overlap support and has a 38.20% Fibonacci retracement lining up with it. If price were to break the first support, it could continue its bearish momentum towards the second support at 1.2127, which is also an overlap support and has a 38.20% Fibonacci retracement lining up with it.
There are two strong resistance levels that price could encounter on its way up. The first is at 1.2343, which has already been mentioned. The second resistance is at 1.2445, which is a multi-swing high resistance level. If price were to break through these two resistance levels, it could potentially shift the momentum to a bullish one.
It’s worth noting that there isn’t an intermediate resistance level between the current price and the first resistance level. This means that if price were to break through the first resistance, it could potentially trigger a strong bullish move towards higher resistance levels.
USD/CHF:
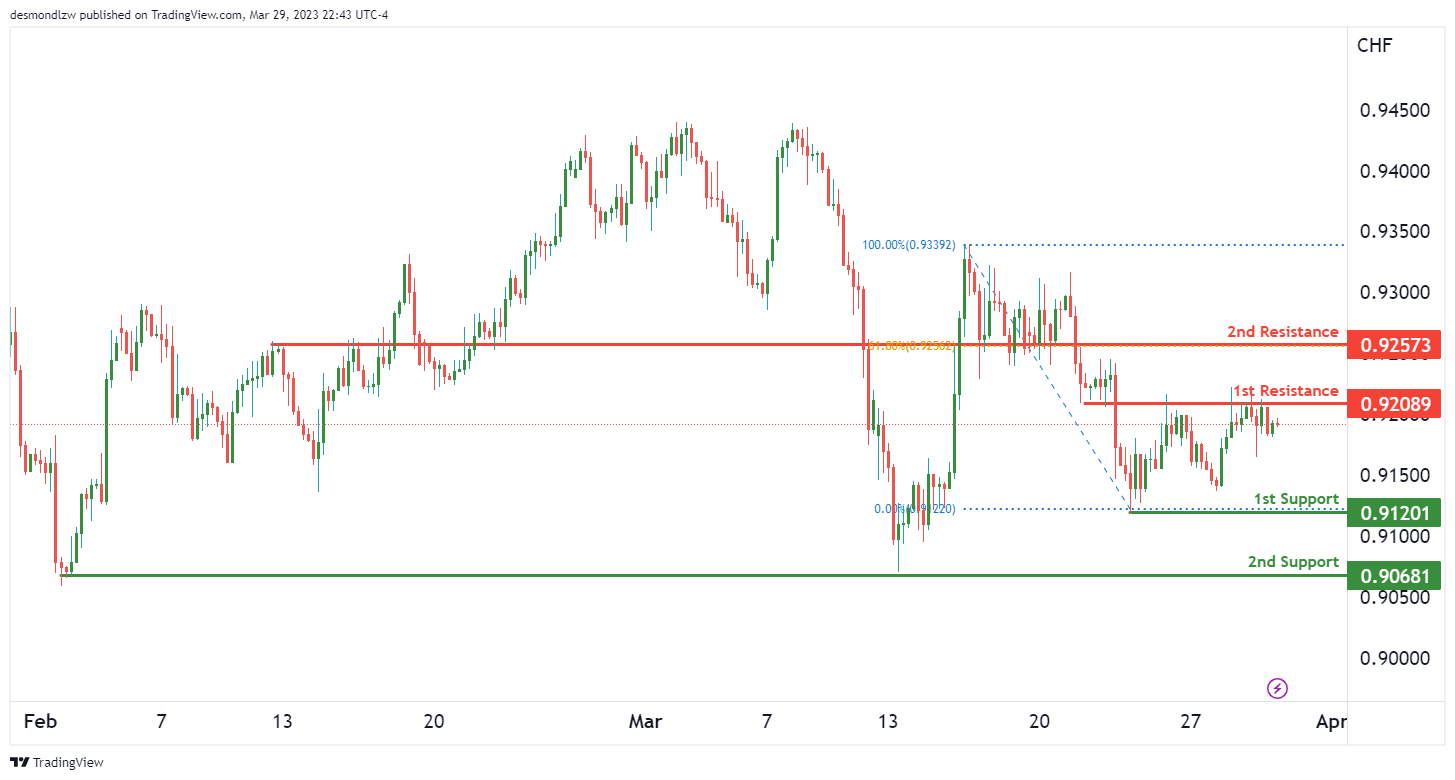
The USD/CHF pair is currently experiencing a bearish momentum on the chart, with price potentially continuing its bearish movement towards the first support. The pair’s overall momentum is bearish, and this is due to it being below a major descending trend line.
If the price continues its bearish momentum, it could potentially reach the first support at 0.9120. This level is a swing low support and could potentially halt the price’s drop. In case the price breaks through the first support, it could potentially reach the second support level at 0.9068. This level is a multi-swing low support and has held the price up several times in the past.
On the other hand, if the price manages to reverse its bearish momentum, it could potentially reach the first resistance at 0.9208. This level is an overlap resistance and could potentially push the price down. If the price manages to break through the first resistance, it could potentially reach the second resistance at 0.9257. This level is an overlap resistance and has a 61.80% Fibonacci retracement lining up with it.
USD/JPY:
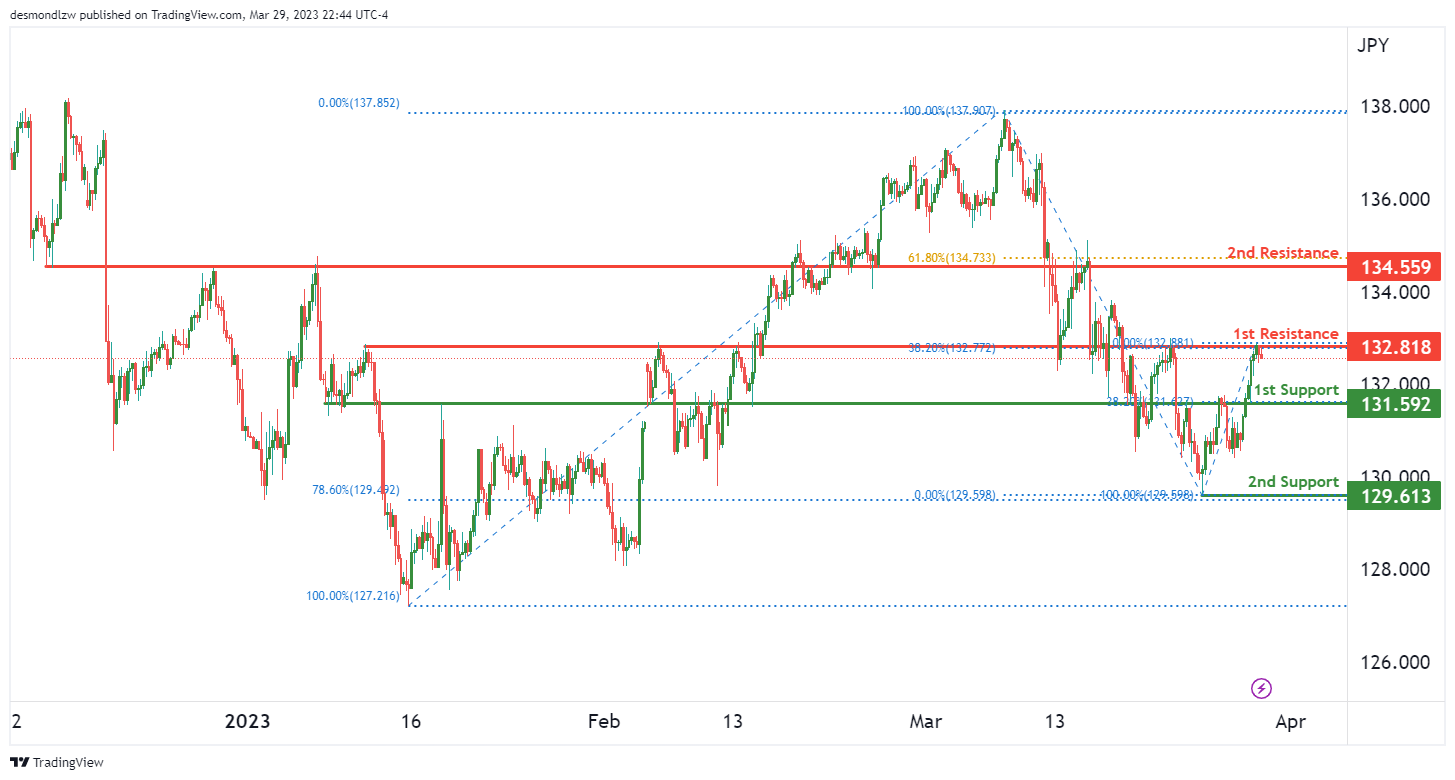
The overall momentum of the USD/JPY chart remains bearish, with the price potentially making a bearish reaction off the 1st resistance and dropping towards the 1st support. The 1st support at 131.59 is a strong level, as it coincides with an overlap support and a 38.20% Fibonacci retracement. If the price were to break below this support, the next support level it could drop to is the 2nd support at 129.61, which is a multi-swing low support and a 78.60% Fibonacci retracement.
On the other hand, the 1st resistance at 132.81 is also a significant level, as it lines up with an overlap resistance and a 38.20% Fibonacci retracement. If the price were to break above this resistance, it could potentially rise towards the 2nd resistance at 134.55, which is an overlap resistance and a 61.80% Fibonacci retracement.
AUD/USD:
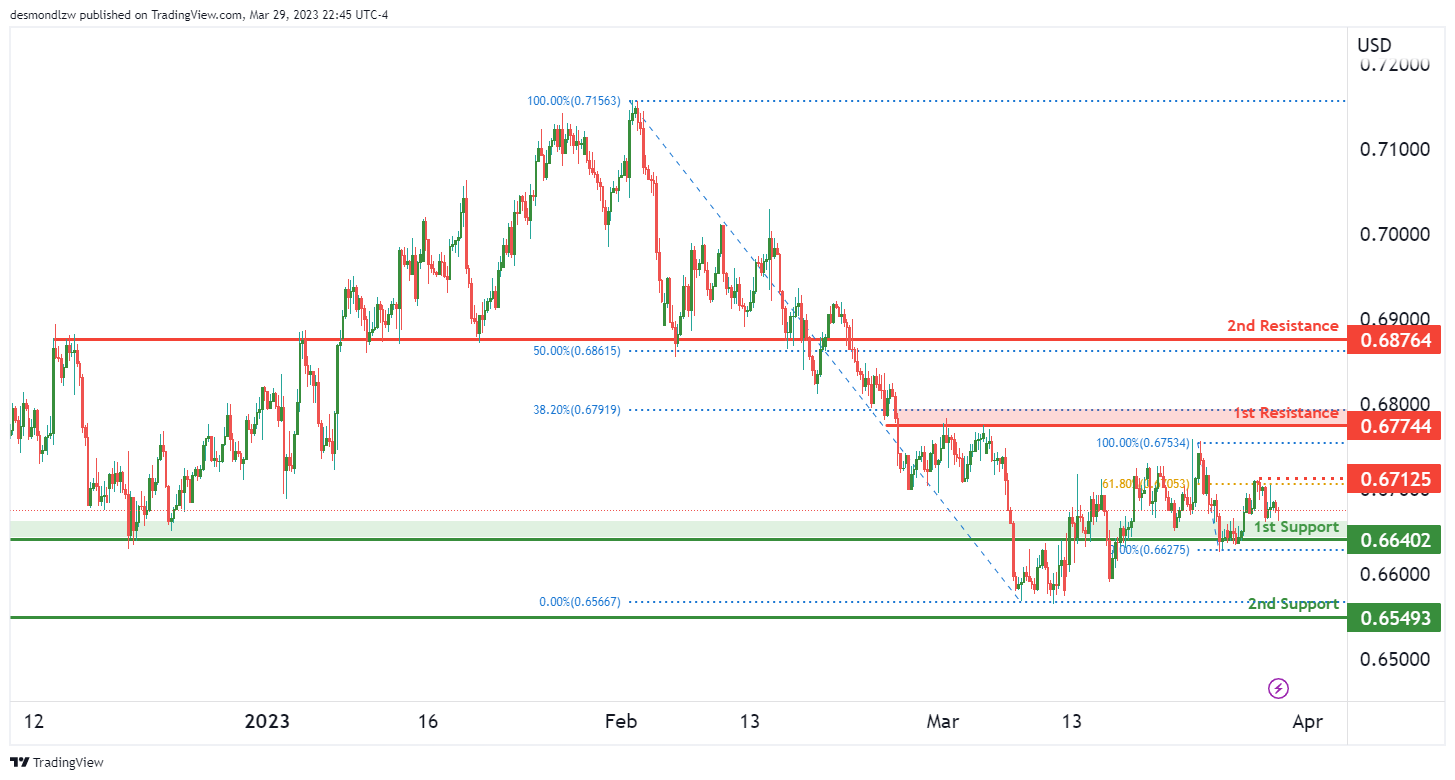
The overall momentum of AUD/USD is currently bearish. The price could potentially continue its bearish trend towards the first support at 0.6640, which is an overlap support. The second support at 0.6549 is a swing low support and could serve as a strong level if the price were to continue to drop.
On the other hand, the first resistance at 0.6774 is an overlap resistance and coincides with a 38.20% Fibonacci retracement. A breakout from this resistance level could signal a reversal of the current bearish momentum. The second resistance at 0.6876 is also an overlap resistance that the price may struggle to break through.
There is an intermediate resistance at 0.6712 between the current price and the first support. This is a multi-swing high resistance that aligns with a 61.80% Fibonacci retracement. If the price were to break this intermediate resistance level, it could trigger a strong bullish move towards the first resistance.
NZD/USD:
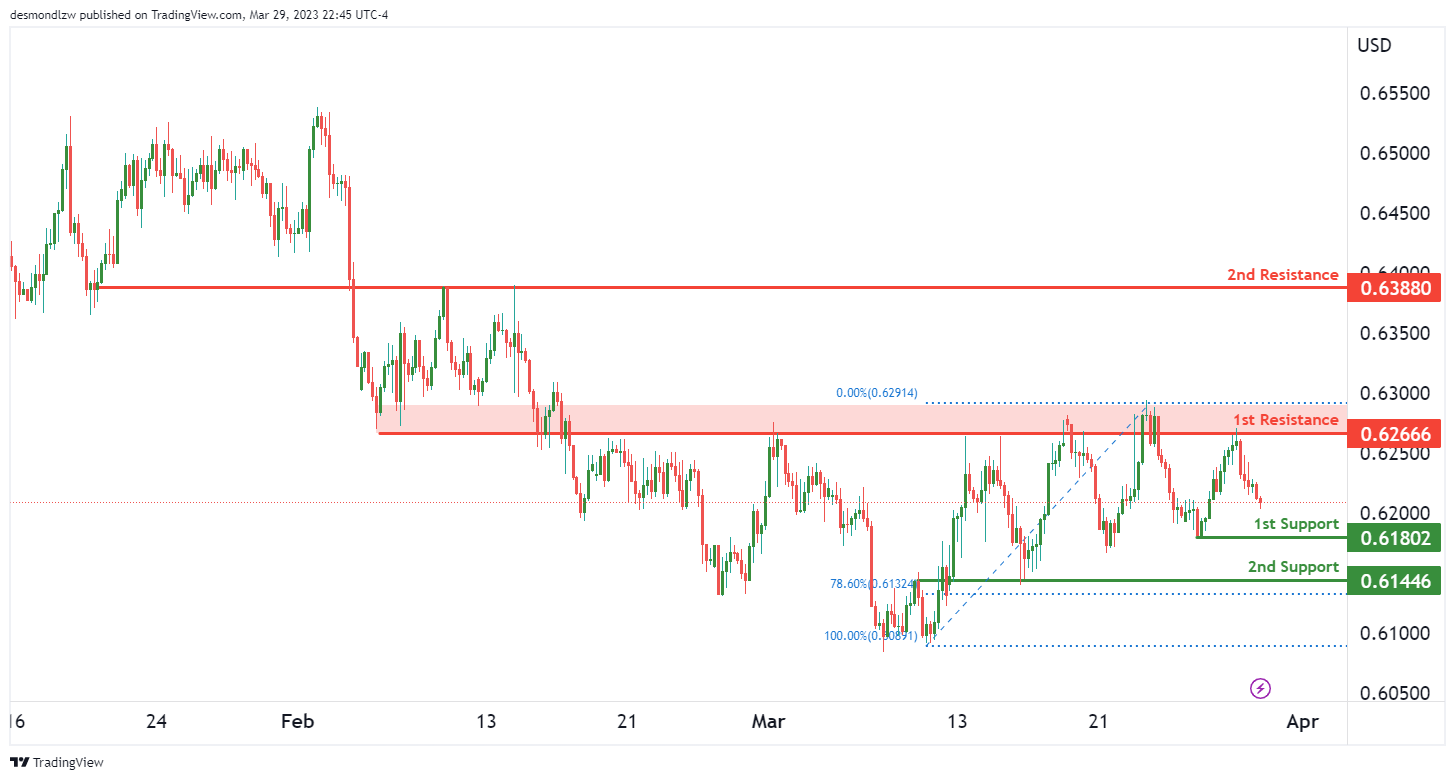
The NZD/USD chart is currently exhibiting bearish momentum, with the price potentially making a bearish continuation towards the 1st support. The first support is at 0.6180, which is a multi-swing low support that has held up in the past. If the price were to break through this support level, the next level it could drop to is the 2nd support at 0.6144. This support level is an overlap support and coincides with the 78.60% Fibonacci retracement, making it a strong level of support.
On the resistance side, the first resistance level is at 0.6266, which is an overlap resistance. The second resistance level is at 0.6388, which is also an overlap resistance. These levels could potentially hold up and prevent the price from rising any further.
USD/CAD:
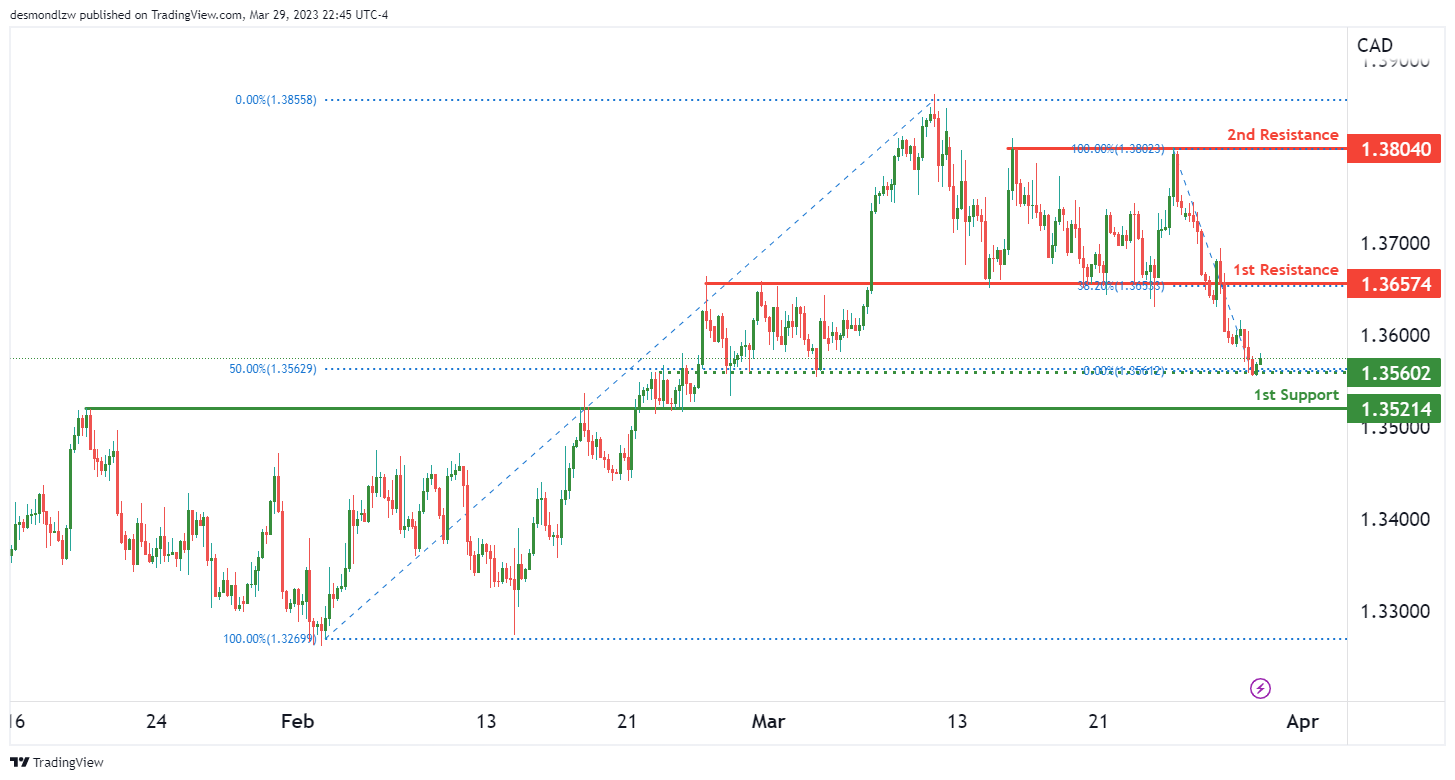
The USD/CAD chart is showing overall bullish momentum, with price potentially bouncing off the 1st support level at 1.3521 and heading towards the 1st resistance level at 1.3657.
The first support level is a strong overlap support and could provide a solid foundation for the price to bounce back up. Additionally, there’s an intermediate support level at 1.3560 that coincides with the 50% Fibonacci retracement, adding to its strength as a potential support level.
On the resistance side, the 1st resistance level is also an overlap resistance and coincides with the 38.20% Fibonacci retracement, adding to its significance as a potential level for price to encounter resistance. If price were to break through the 1st resistance level, the next level it could potentially face is the 2nd resistance level at 1.3804, which is a multi-swing high resistance level.
DJ30:
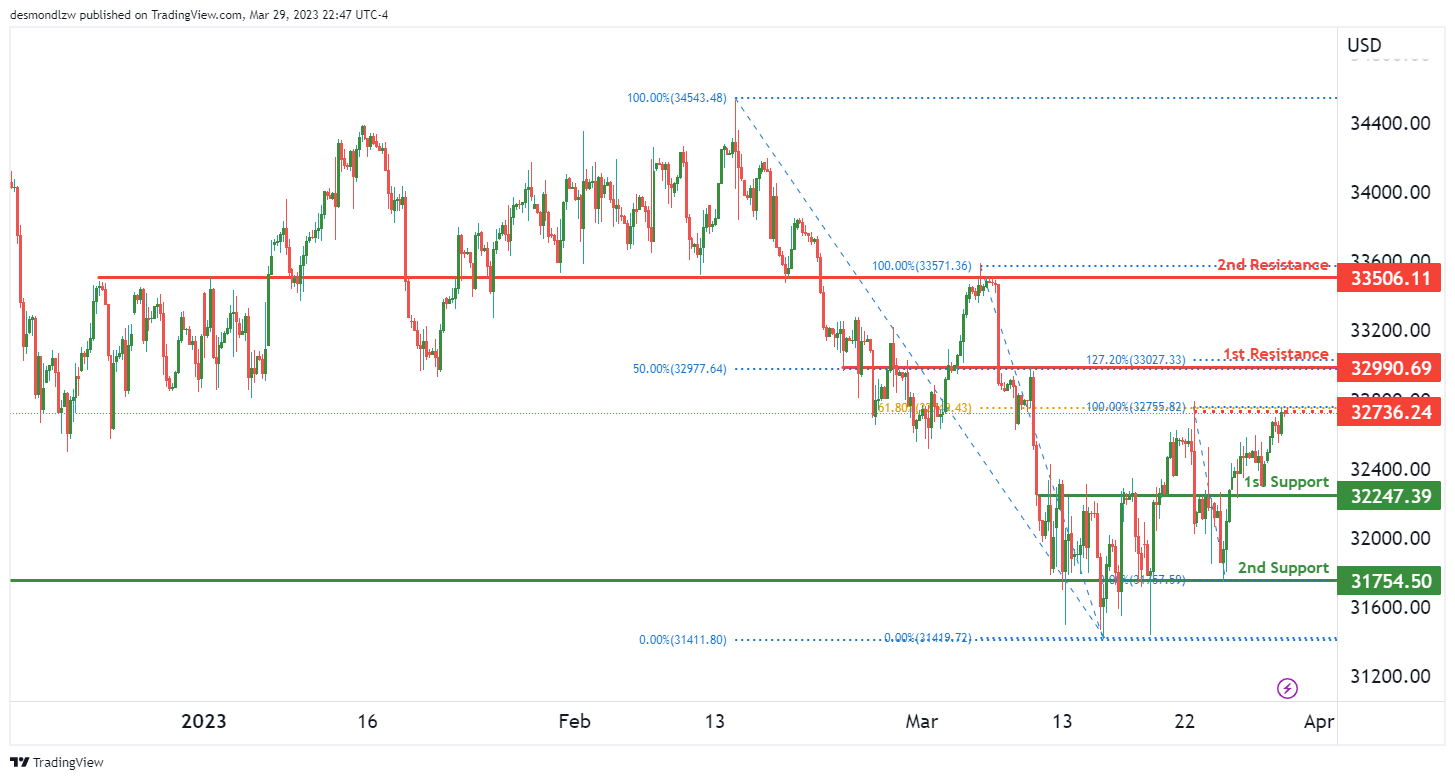
The DJ30 chart has shown a bullish momentum lately, with prices potentially continuing to rise towards the 1st resistance level. Currently, the price is above both the Ichimoku cloud and an ascending trend line, providing support for a bullish continuation.
Looking at the support and resistance levels, we can see that the 1st support level is at 32,247.39, which is an overlap support. The 2nd support level is at 31,754.50, which is a multi-swing low support. These levels provide strong support for the price to potentially bounce off and head towards the 1st resistance level.
The 1st resistance level is at 32,990.69, which is an overlap resistance, and is also at the 50% Fibonacci retracement level. The 2nd resistance level is at 33,506.11, which is also an overlap resistance. The intermediate resistance level at 32,736.24 is a multi-swing high resistance and is at the 61.80% Fibonacci retracement level.
It’s important to note that while the chart has a bullish bias, there is still potential for the price to drop towards the support levels. However, if the price can bounce off the support levels, the momentum could carry the price towards the resistance levels.
GER30:
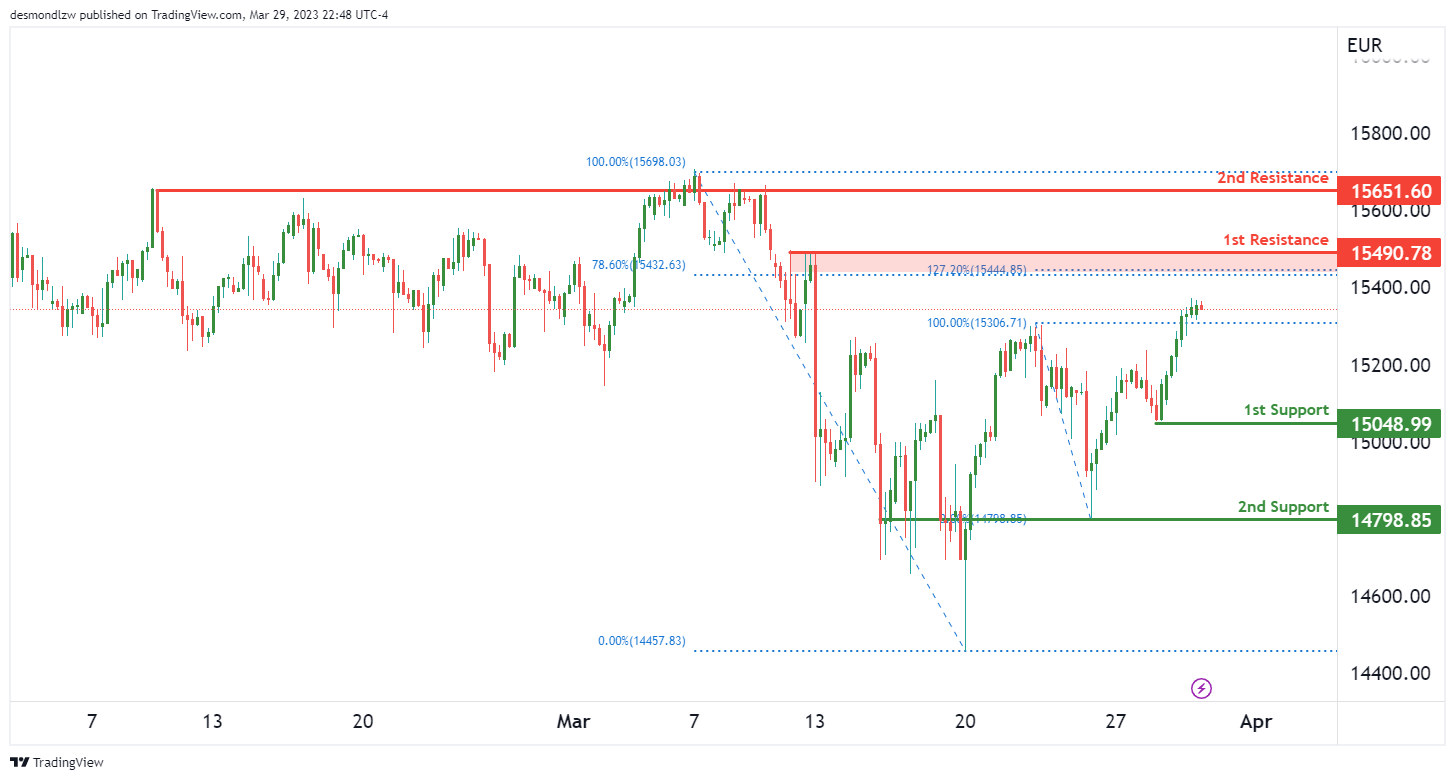
Overall, the momentum of the GER30 chart is bullish, as price is currently above the bullish Ichimoku cloud. This suggests that there is good support in place, contributing to the bullish momentum.
Price could potentially make a bullish continuation towards the first resistance level. However, it’s important to note that the overall momentum of the chart is always subject to change.
The first support level is located at 14960.89, which is an overlap support level. If the price falls towards this level, it is likely to find support and bounce back up. The second support level is at 14807.31, which is another overlap support level and coincides with the 61.80% Fibonacci retracement level. This support level may also provide a good buying opportunity.
On the other hand, the first resistance level is at 15241.58, which is an overlap resistance level. If the price rises towards this level, it is likely to face some selling pressure. The second resistance level is at 15488.32, which is also an overlap resistance level. If the price manages to break above this level, it could signal a strong bullish momentum and potential buying opportunity.
In summary, the overall momentum of the GER30 chart is bullish, and the price could potentially make a bullish continuation towards the first resistance level. The first and second support levels are at 14960.89 and 14807.31, respectively, while the first and second resistance levels are at 15241.58 and 15488.32, respectively. These levels are important to keep an eye on for potential buying or selling opportunities.
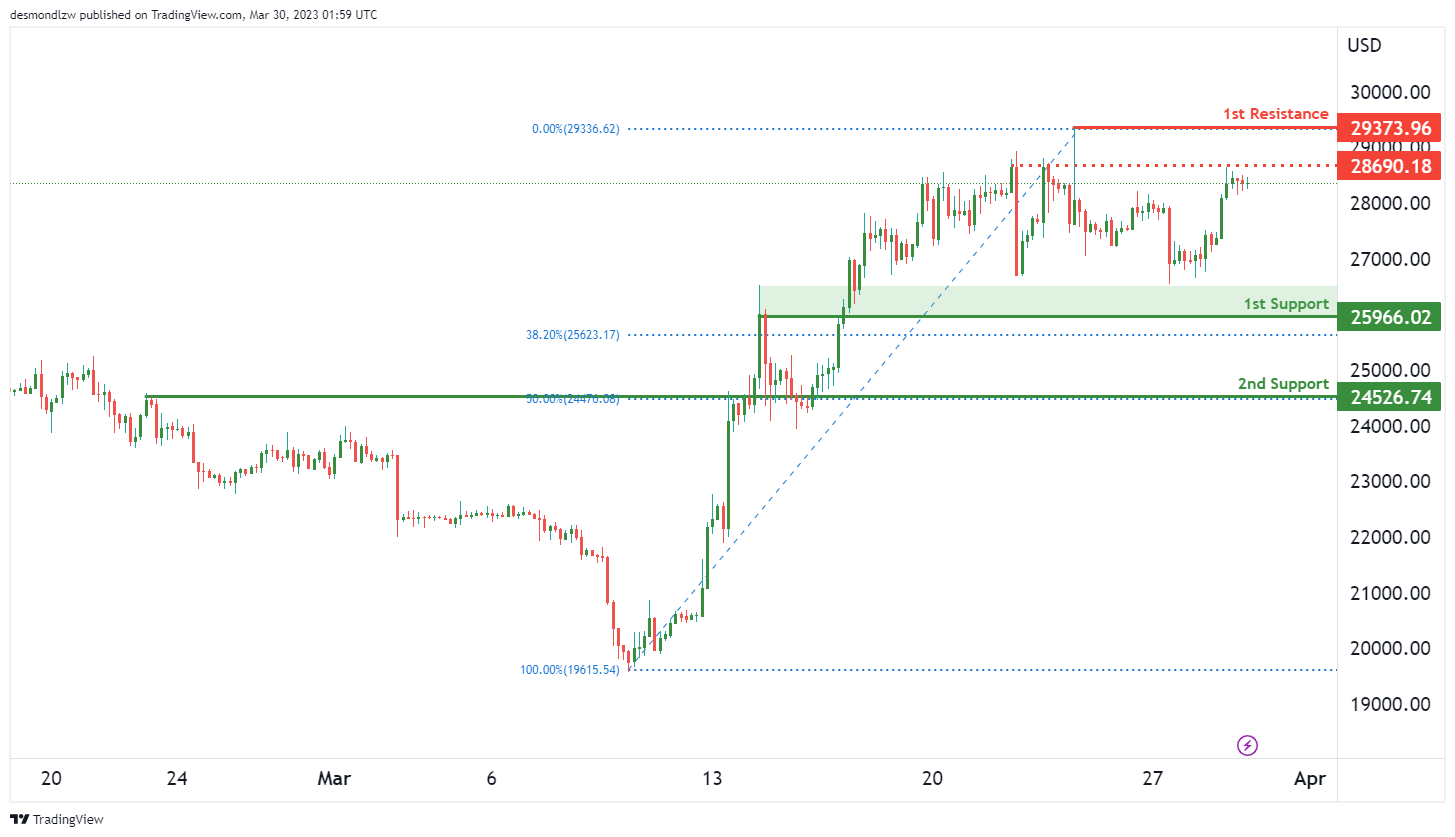
BTC/USD:
The overall momentum of BTC/USD remains bullish, as the price has the potential to continue its rise towards the first resistance level.
At present, the first support level is at 25966, which is a good multi-swing low support and coincides with the 38.20% Fibonacci retracement level. The second support is at 24526, which is another overlap support and coincides with the 50% Fibonacci retracement level. If the price bounces from the first support, it could rise to the first resistance level at 29373, which is a swing high resistance.
In addition, there is an intermediate resistance level at 28690, which is a good multi-swing high resistance level. If the price breaks through this intermediate resistance, it could potentially trigger a stronger bullish acceleration towards the first resistance.
US500
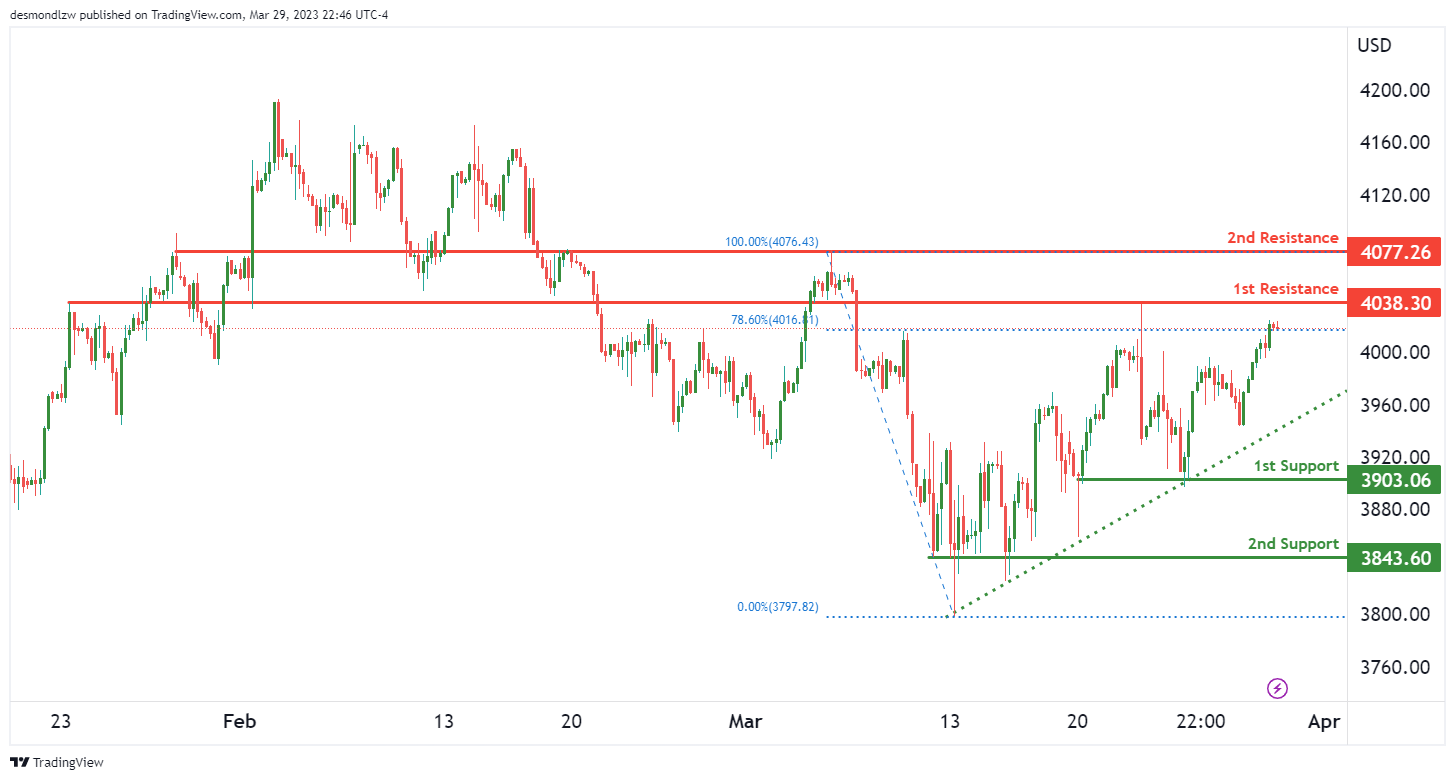
The US500 chart is currently showing bullish momentum, as the price is above a major ascending trend line. There are two potential support levels that could see the price bounce off and continue the bullish trend. The first support is located at 3903.06 and it is a multi-swing low support level. The second support is located at 3843.60 and it is also a multi-swing low support level.
On the other hand, there are also two potential resistance levels that the price could reach. The first resistance level is at 4038.30 and it is an overlap resistance level, with 78.60% Fibonacci retracement. The second resistance level is at 4077.26 and it is also an overlap resistance level.
If the price continues to show bullish momentum, it could potentially reach the first resistance level and bounce off it, continuing the uptrend. However, if the momentum turns bearish, the price could potentially drop to the first support level or even lower, breaking the ascending trend line and indicating a reversal of the overall bullish trend.
ETH/USD:
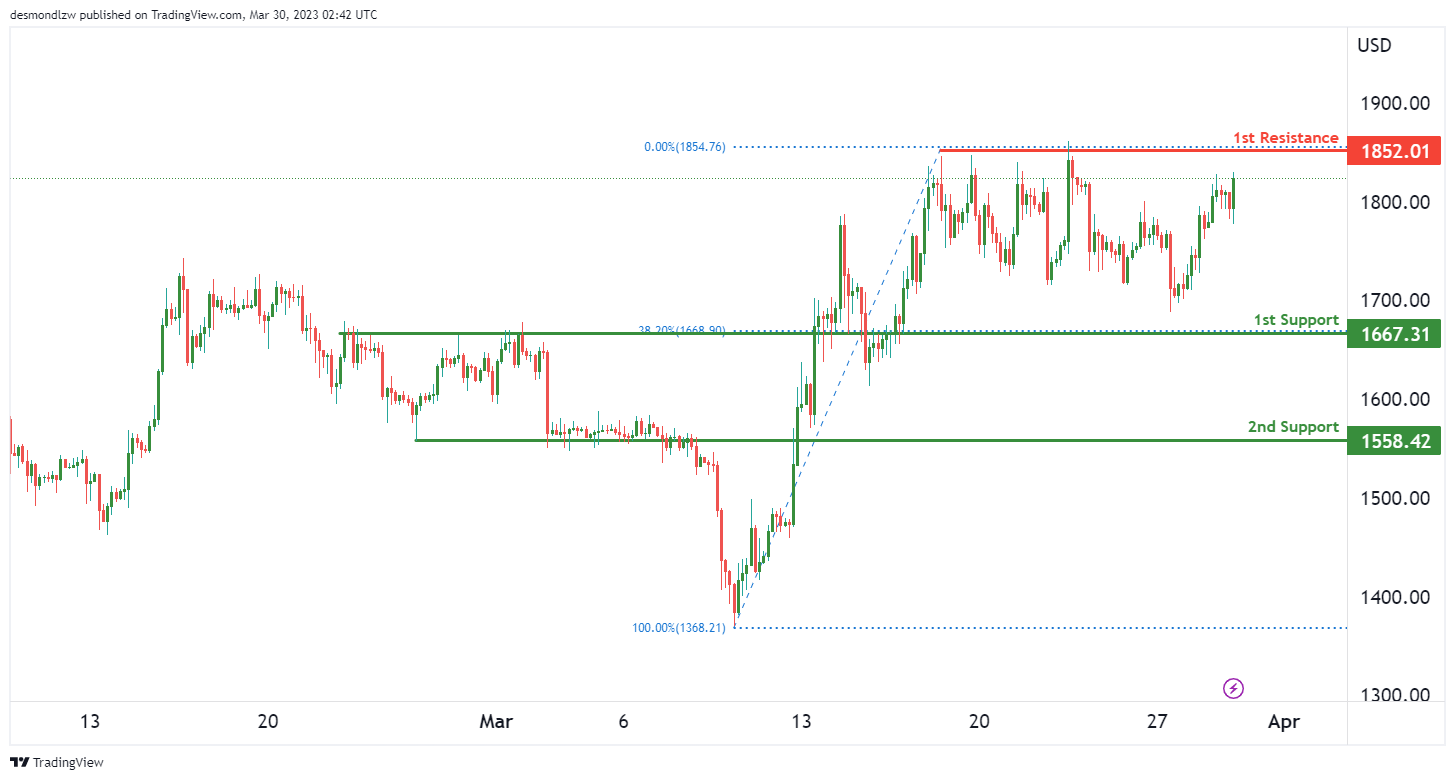
The overall momentum of the ETH/USD chart is bullish, indicating that there may be further upside potential in the near term. This is due to the fact that price is currently above a major ascending trend line, suggesting that bullish momentum is on the cards.
Looking at the potential price action, there is a possibility for a bullish continuation towards the first resistance level at 1852.01. Before that, the price could potentially bounce off the first support at 1667.31, which is a good level of support and also coincides with the 38.20% Fibonacci retracement level. If the price falls further, it could find support at the second level at 1558.42.
In terms of resistance, the first level at 1852.01 is a good level of overlap resistance. If the price manages to break above this level, it could potentially head towards the next resistance level at an overlap resistance of 1972.94.
WTI/USD:
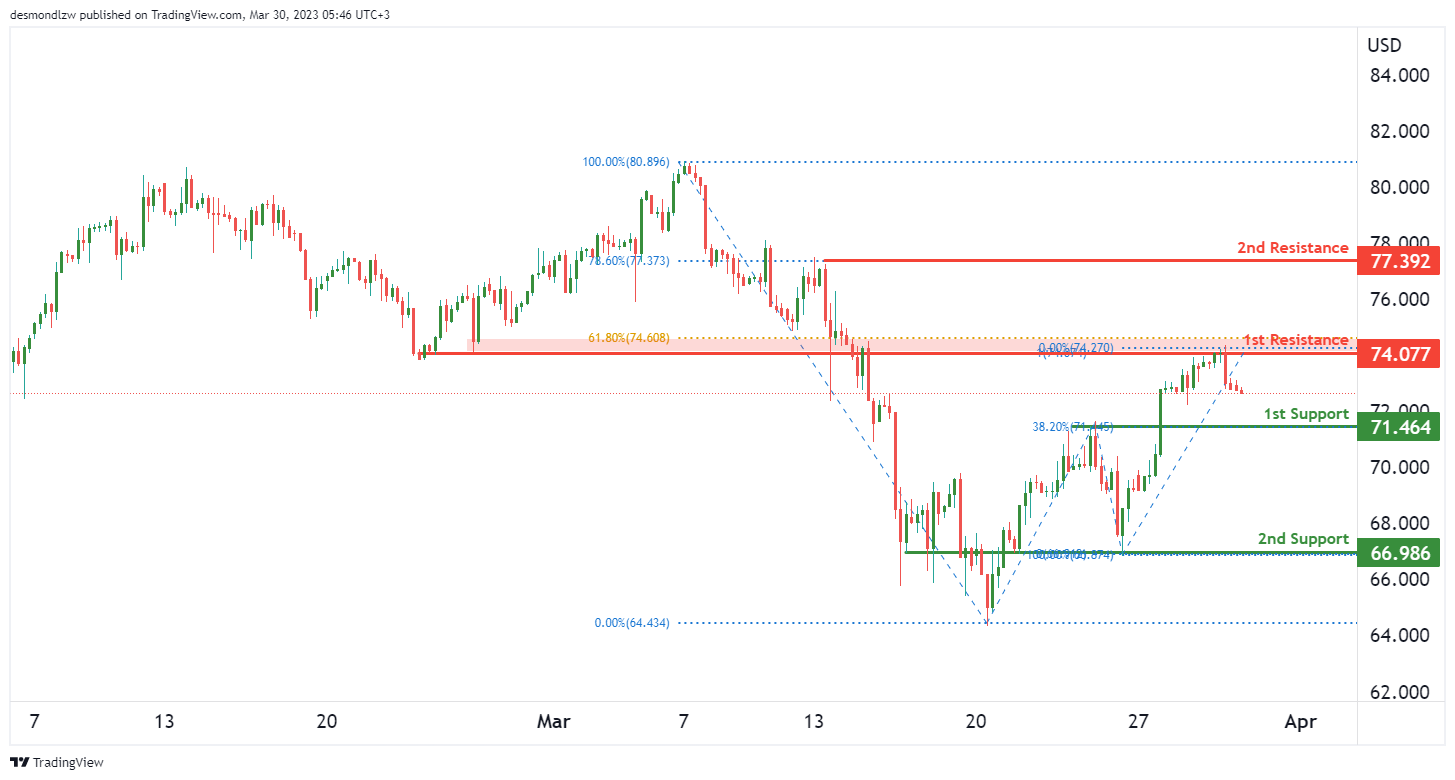
WTI remains in a bearish momentum as the price could potentially make a bearish continuation towards its first support. The first support is seen at 71.46, which is an overlap support and a 38.20% Fibonacci retracement level. If the price breaks below this level, it could continue to drop towards the second support at 66.98, which is another overlap support.
On the upside, the first resistance is seen at 74.07, which is an overlap resistance and a 61.80% Fibonacci retracement level. If the price manages to break above this level, it could head towards the second resistance at 77.39, which is a multi-swing high resistance and a 78.60% Fibonacci retracement level.
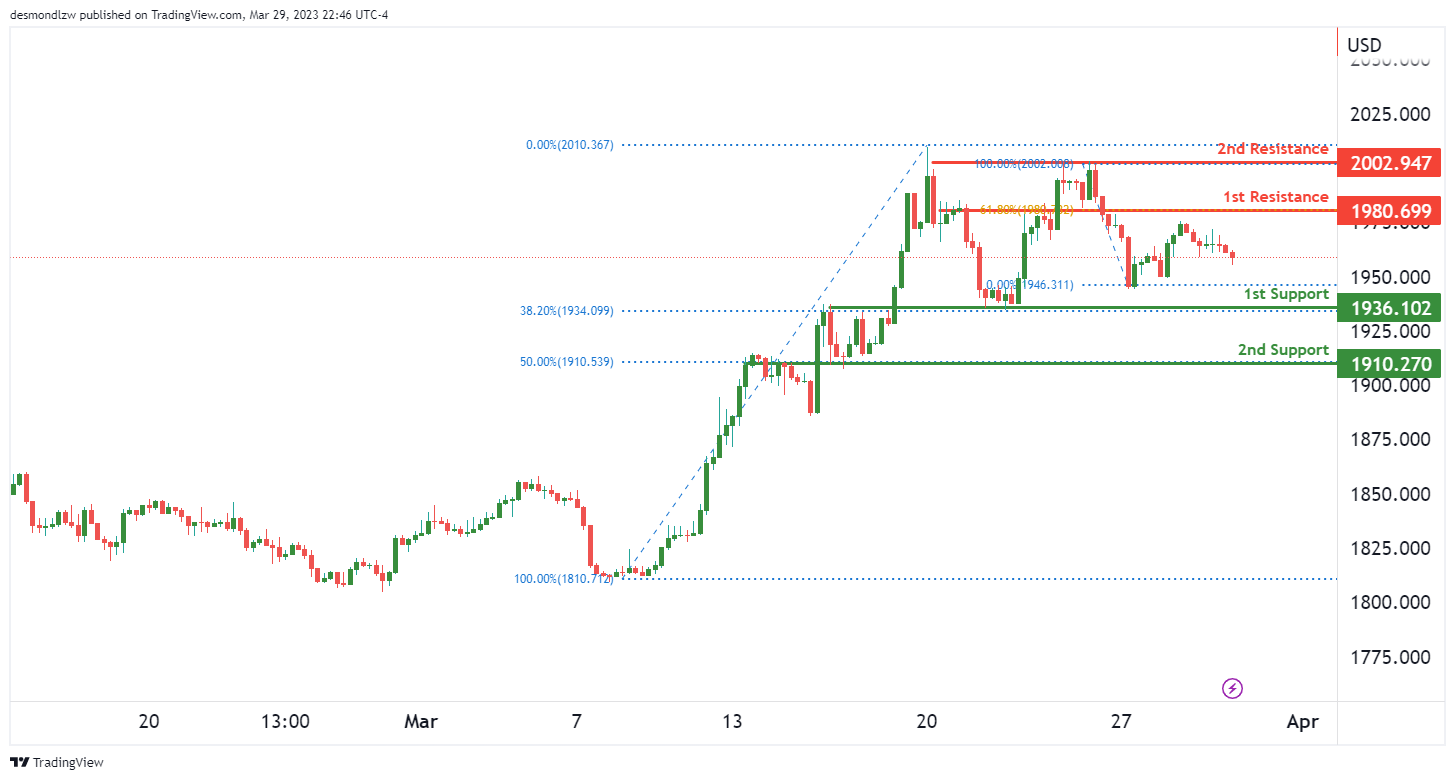
XAU/USD (GOLD):
The price of XAU/USD is currently experiencing bearish momentum, indicating that it may potentially move towards the 1st support level. The overall momentum of the chart is bearish.
The 1st support level is at 1936, which is a good support level because it is an overlap support and coincides with the 38.20% Fibonacci retracement level. The 2nd support level at 1910 is also a good support level as it coincides with the 50% Fibonacci retracement level and is also an overlap support.
On the resistance side, the 1st resistance level is at 1980, which is a good resistance level as it is an overlap resistance and coincides with the 61.80% Fibonacci retracement level. The 2nd resistance level at 2022 is also a good resistance level as it is a multi-swing high resistance.
RBA Board to Pause Next Week
The Reserve Bank Board meets next week on April 4.
We confirm the forecast we released on March 17 that the Board will decide to pause at the April meeting.
That move is unlikely to see the end of the tightening cycle since we expect a final 25 basis point increase at the May Board meeting.
The Minutes from the March Board meeting included the unusual: "Members agreed to reconsider the case for a pause at the following meeting, recognising that pausing would allow additional time to assess the outlook for the economy."
Signalling aspects of the decision process at the upcoming meeting is something I have not seen in previous Board Minutes. This approach indicates that there is arguably a preference for pausing.
And note that this "preference" was revealed prior to the developments in the global banking system. The Board meeting was on March 7 and the authorities took control of Silicon Valley Bank on March 10.
Some argue that the decision by the Federal Open Market Committee to still lift the Federal Funds Rate by 25 basis points on March 22 indicated that central banks were looking through the financial sector disruptions to focus specifically on inflation.
But it is important to compare the starting point of the two central banks.
Before the banking sector disruptions, the FOMC was favouring a 50 basis point increase in contrast to the RBA Board that was considering a pause at the next meeting.
In response to the financial sector developments the FOMC scaled the increase back to 25 basis points and changed the guidance from "ongoing increases in the target range will be appropriate "to "some additional policy firming may be appropriate".
This was a significant change in stance from the FOMC and would have had an impact on the Board's thinking.
We also ask ourselves why there was such a turnaround between the February and March Board meetings.
Recall that the Minutes to the February meeting sent a clear message to markets to expect two consecutive rate increases; "further increases in interest are likely to be needed over the months ahead."
The December quarter national accounts would have shocked the Board. Domestic demand stagnated in the December quarter largely due to a slowdown in consumer spending growth from 1% in the September quarter to 0.3% in the December quarter. Dwelling investment and new business investment both contracted, while the 0.5% growth in the quarter was entirely due to a boost from net exports.
Quarterly growth in the Wage Price Index surprised to the downside indicating to the Governor that "lower risk of a cycle in which prices and wages chase one another."
The Board also derived some encouragement that inflation had peaked from the January Inflation Report where annual inflation slowed from 7.8% to 7.4%, including a fall of 0.4% in the month of January.
The Governor responded with, "The monthly CPI indicator suggests that inflation has peaked in Australia."
While we think the Governor has a preference for pausing, the Board Minutes set out a path for the decision at the April meeting; "they agreed that upcoming releases on employment, inflation, retail trade, and business surveys would provide important additional information, as would developments in the global economy."
The February Employment Report was strong with new jobs printing 64,600 and the unemployment rate falling from 3.7% to 3.5% (a fall of 0.13% to the second decimal point from 3.67% to 3.54%).
This result would not have come as a major surprise to the RBA. The Governor pointed out to the House of Representatives Economics Committee that seasonality issues in January were significant and 100,000 respondents were reported by the ABS to have been outside the workforce in January but had secured jobs for February.
The NAB Survey of Business Conditions showed a sharp fall of 10 points to –4 in Business Confidence – firmly in pessimistic territory. Business Conditions held firm at +17 but clearly off the highs of September 2022 when they reached +24.
The February Retail Sales Report showed a muted increase of 0.2%. Following the 4% fall in December, and the partial rebound of 1.9% in January, this means that retail sales over the three months from December are 1.5% down on the previous three months. Our Card Tracker is pointing to a likely fall in real retail sales in the March quarter.
The February CPI Indicator rose 0.2% in February following the fall of 0.4% in January. Annual inflation fell from 7.4% in January to 6.8% in February. We now see downside risks to our current forecast for headline inflation in the March quarter.
Overall, these domestic data points do not provide a sufficiently convincing case for a Board whose prior, we believe, is to pause in April to change course.
Note that the global economy also figures in the Board's check list. While markets have stabilised the clear risk of credit tightening in the US and Europe as US regional banks deal with increased regulation and deposit instability in both US and Europe lowers the outlook for global growth.
Given these issues the appropriate policy for the Board is to pause to await clearer information.
When central banks are faced with high inflation the priority must be to move policy into contractionary territory. The Board acknowledges that policy is now contractionary so the urgency to move policy at every meeting passes.
The RBA Board, with more meetings per year than any other central bank, can now take that break.
By the May meeting the Board will have the benefit of refreshed forecasts from the staff, including the time required to return to the 2-3% target zone for inflation which we think is likely to remain at a distant mid–2025.
But of most importance will be a refreshed measure of underlying inflation – the Trimmed Mean. The monthly Indicators do not provide a measure of the Trimmed Mean. It was the surprise lift in the Trimmed Mean Inflation rate from the expected 6.5% to 6.9% in the December quarter that prompted the hawkish response in the February Minutes.
Westpac is forecasting the Trimmed Mean inflation to slow from 6.9% to 6.5%.
In an economy with full employment that is still too high and we expect a final 0.25% lift in the cash rate will be required.
Much better to make that decision with the benefit of a true indication of the inflation challenge along with the other benefits of another month of data, including around global developments, than needing to move in April.
Conclusion
We confirm our forecast from March 17 that the RBA Board will pause in April prior to one final move in May.