

Sample Category Title
Sunset Market Commentary
Markets
Today’s very first March inflation update – honor to the German North Rhine Westphalia region – set the tone for the start of European dealings. The regional figure printed softer than what was expected for the national number, suggesting a downward surprise. Soon after, Spanish inflation rose 1.1% M/M while markets expected a 1.6% M/M gain. The Spanish statistics agency didn’t provide much info yet, but said that energy prices fell in March. The Y/Y-figure nearly halved, from 6% to 3.1% , mainly due to a giant negative base effect stemming from last year’s surge in energy and road fuel prices after Russia invaded Ukraine. The combination of both triggered early buying in German Bunds, temporarily ending this week’s slide. The obvious reflex being that it provides an argument for the ECB not to aggressively push through with its flagged additional rate hikes. Markets initially easily looked past the fact that Spanish core CPI remained stubbornly high at 7.5% Y/Y (from 7.6% Y/Y). As more and more German States printed inflation numbers, it became clear that the story wouldn’t be as straightforward. German Bunds returned towards opening levels and currently trade even weaker as the overall German inflation number beat consensus! Headline German inflation accelerated to 1.1% M/M (vs 0.8% expected) with the Y/Y-figure falling somewhat less than hoped (from 9.3% Y/Y to 7.8% Y/Y). Belgian core inflation (see below) remains on an upward trend as well. German yields currently add 10.7 bps (2-yr) to 1 bp (30-yr). Money markets are again embracing two additional 25 bps rate hikes this year whereas this was only one last week around. Despite this ongoing repositioning, we still think it’s too conservative. German Bunds underperformed US Treasuries today with US yields gaining “only” 4 bps at the front end. The single currency benefited from the yield advantage with EUR/USD pushing for a test of the March high at 1.0930. It’s final resistance ahead of the YTD top at 1.1033. Positive risk momentum helped the single currency as well with main European indices adding another 1% to their rebound and US gauges opening 0.5% higher. The EuroStoxx50 is closing in on this year’s high at 4324.25. ECB board member Schnabel said yesterday after market close that European banks haven’t seen a general deposit outflow.
News Headlines
Belgian inflation rose by 0.57% to be 6.67% y/y in March. It’s the first yearly acceleration since prices started easing from their peak at 12.30% in October 2022. Food prices were a major contributor. By rising 17.02% (up from 16.12% last month), 3.12 ppts to the headline figure were added. Energy prices weighed heavily on the index, subtracting 1.49 ppts from the figure. On a yearly basis, energy prices dropped 10.11% y/y compared to 7.93% last month with especially gas prices recording a steep fall after surging in the same month last year (-45.6% y/y, -17.6% m/m). Core inflation continued to speed up, from 8.28% to 8.57%. Services inflation also rose further, from 6.96% to 7.06%, suggesting still wide-spread and strong underlying price pressures.
The Swiss KOF Economic Institute’s economic barometer fell marginally in March. The headline index lost 0.7 points in March from 98.9 (revised from 100.0). At 98.2, it printed just below its average value of 100. So the upward trend observed between November 2022 and last month came to a halt. The KOF Institute reported negative signals from the manufacturing, services and construction sectors. They are at least partly offset by positive developments in the indicator bundle reflecting Swiss exports. Other indicators included in the barometer were reported as little changed. In manufacturing and construction, the situation referring to employment and inventories is assessed more negatively than before, while new orders and intermediate goods have improved. The KOF Institute concludes that obstacles to production are still primarily due to recruitment problems in the labour market. EUR/CHF after the release trades little changed near 0.996. Recent financial turmoil also had only a temporary impact on the franc. In a broader perspective, the EUR/USD cross rate is holding a rather tight range near parity. The SNB at last week’s policy meeting, indicated that it is prepared to sell FX/buy the Swiss franc to support appropriate monetary conditions.
Dow Rises on Improved Risk Mode
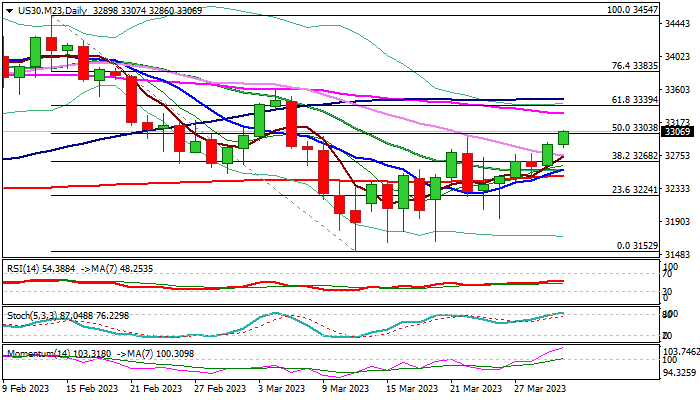
The Dow Jones Index continues to benefit from fresh risk appetite as traders feel more comfortable on easing fears after collapse of two US banks.
The price rose to three-week high in European trading on Thursday, in extension of 0.85% advance on Wednesday, marking 50% retracement of larger 34547/31529 fall.
Near-term action is underpinned by 10/200DMA golden cross and formation of 10/20DMA bull-cross and rising bullish momentum on daily chart.
Fresh advance needs close above cracked pivots at 32991/33038 (former top of Mar 22 / 50% retracement) to boost bullish signals and keep focus at 33289/33394 targets (55DMA / Fibo 61.8% of 34547/31529).
Investors await release of US PCE data on Friday, for more evidence on inflation, which will return to Fed’s focus after immediate threats from the recent bank turmoil eased.
Res: 32990; 33290; 33394; 33475
Sup: 32991; 32860; 32757; 32572
Challenge for ECB: German Inflation Undefeated
Preliminary estimates for Germany indicated an increase in consumer prices in March by 0.8% m/m and 7.4% y/y, which is higher than the average growth forecasts of 0.7% m/m and 7.3% y/y. In March last year, prices jumped by 2% at once, creating a high base for comparison, which caused a slowdown in the year-over-year rate.
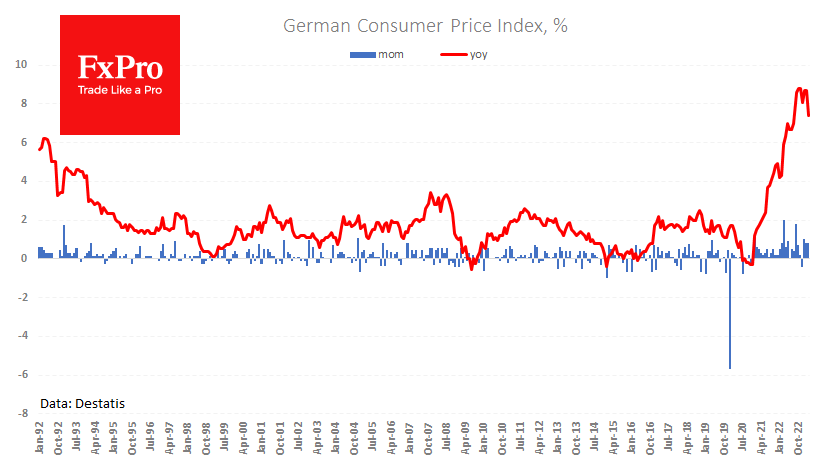
It would be a mistake to celebrate victory over inflation in the eurozone. Germany’s monthly price growth remains inconsistent with the ECB’s 2% annual growth target. The average monthly price growth rate over the past six months is 0.52%, resulting in a yearly increase of 6.2%, and over the past three months, it has added by an average of 0.9%, bringing an annual rate of 10.4%.
The acceleration of inflation over the past three months is striking, and it isn’t easy to attribute this to energy prices or disrupted supply chains. The latest acceleration appears to be due to a tight labour market pushing up service prices and the inflation carryover from the euro’s weakening earlier last year.
The ECB may try to overcome these hurdles through monetary tightening, which will simultaneously constrain business activity in the region and strengthen the euro. If no new problems emerge in the banking industry in the coming weeks, we should expect a further decisive tightening of the policy of the European Central Bank.
AUD/USD – Will RBA Take a Breather Next Week?
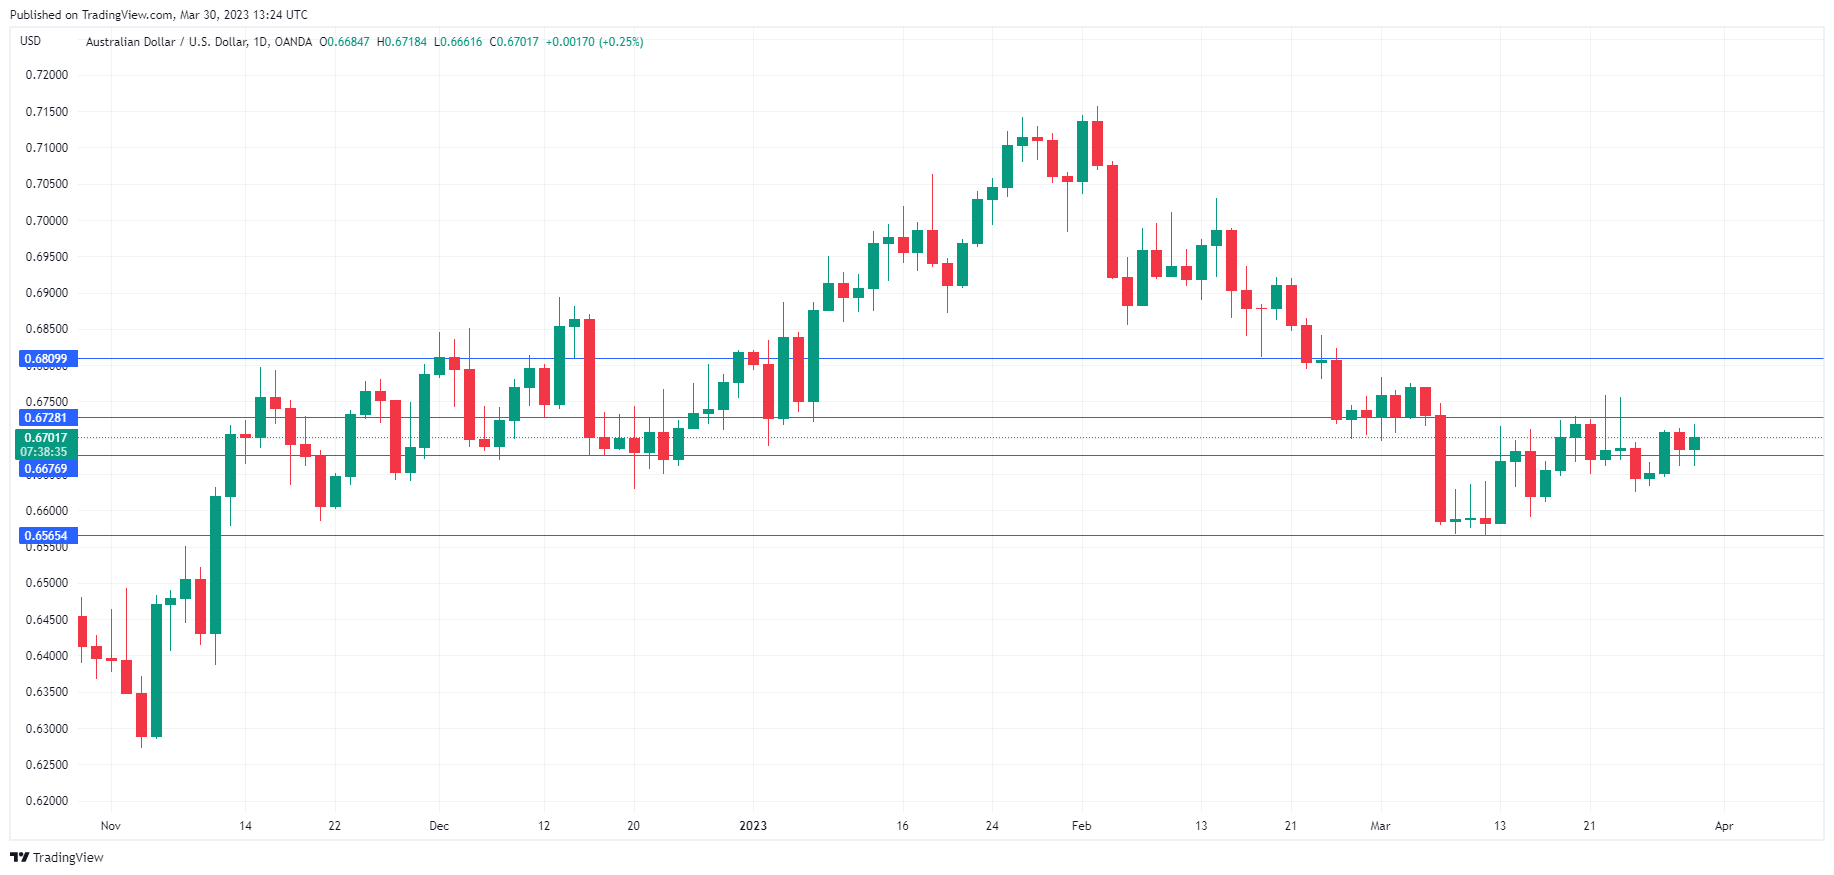
The Australian dollar has edged higher and is trading at the 0.6700 level in Europe. The RBA meets next week and the markets have priced in a pause. In the US, unemployment claims and GDP were within expectations.
RBA expected to pause rate hikes
The RBA holds its policy meeting on April 4th and the markets have fully priced in a pause after raising rates at 10 consecutive meetings. Governor Lowe mentioned that a pause at the April meeting was a possibility and said that employment, inflation and consumer spending data would play a key factor in the RBA’s decision.
Consumer spending and inflation both eased in February, which would support the case for a pause. As well, the fallout from the banking crisis has central banks thinking twice before raising rates. The markets have priced in a pause at 87%, but the National Australia Bank (NAB) is projecting a hike of 25-basis points. The NAB’s reasoning is that the labour market remains tight and the risks on wage growth are on the upside.
Whatever decision the RBA makes next week, it appears likely that the current rate-tightening cycle, which has brought the cash rate to 3.60%, is close to ending. If inflation continues to fall, it is entirely possible that the central bank will cut rates late in the year.
In the US, key releases were within expectations and had little effect on the US dollar. Unemployment claims rose to 198,000, versus 191,000 prior and 196,000 anticipated. Over the past 11 weeks, unemployment has remained below the 200,000 threshold, as the labour market remains tight. US third-estimate GDP for Q4 was revised downwards from 2.7% to 2.6%. This marks a deceleration from the Q3 reading of 3.2%, as exports and consumer spending were lower.
AUD/USD Technical
- There is pressure on resistance at 0.6728. Above, there is resistance at 0.6810
- AUD/USD tested support at 0.6676 earlier in the day. The next support level is 0.6565
USD/JPY Mid-Day Outlook
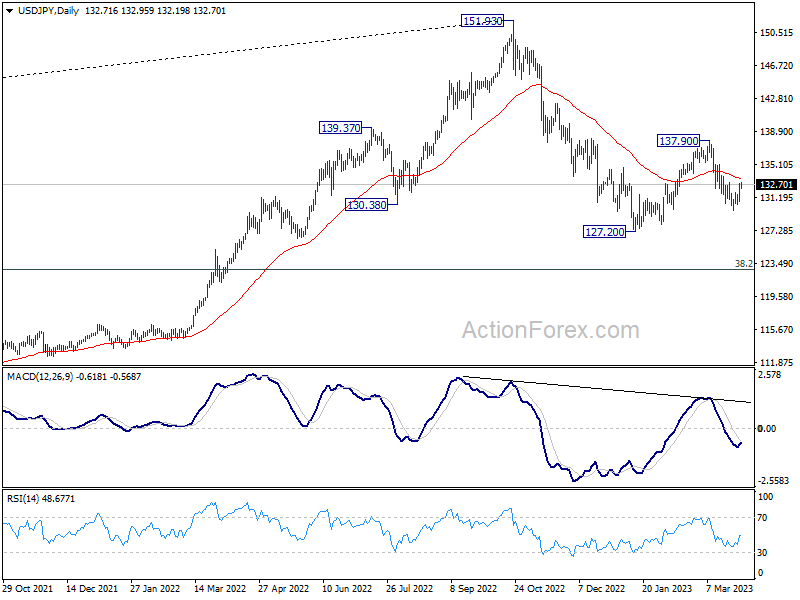
Daily Pivots: (S1) 131.46; (P) 132.17; (R1) 133.59; More...
Intraday bias in USD/JPY stays neutral for the moment, and further decline is in favor with 132.99 minor resistance intact. On the downside, break of 129.62 will target a test on 127.20 low. Decisive break there will resume larger decline from 151.93. However, firm break of 132.99 will argue that fall from 137.90 has completed, and turn bias back to the upside for 137.90.
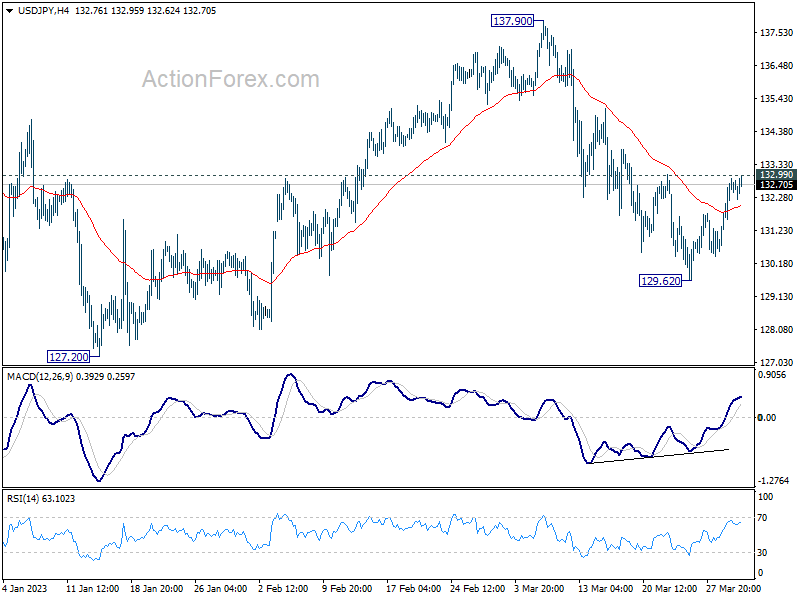
In the bigger picture, rebound from 127.20 should have completed at 137.90 as a corrective move. The down trend from 151.93 (2022 high) is still in progress. Break of 127.20 will resume this down trend and target 61.8% projection of 151.93 to 127.20 from 137.90 at 122.61. This will now be the favored case as long as 137.90 resistance holds.
USD/CHF Mid-Day Outlook
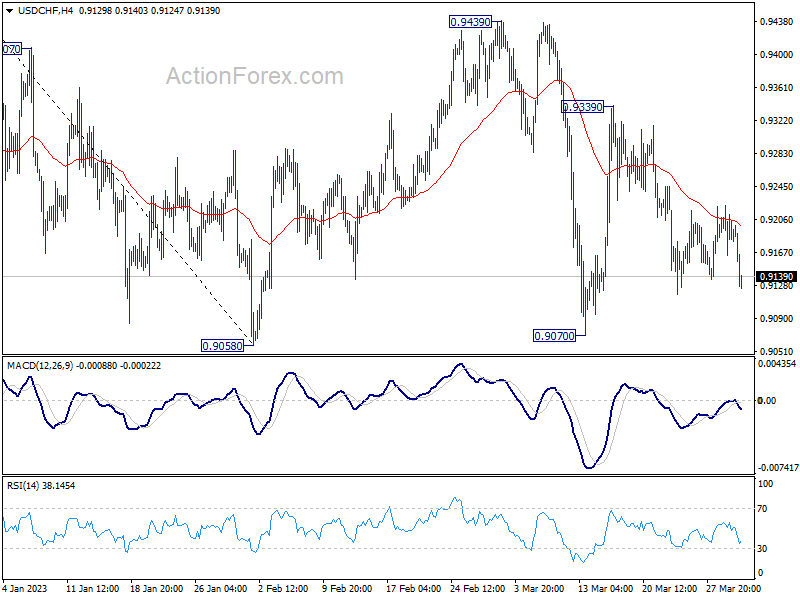
Daily Pivots: (S1) 0.9159; (P) 0.9191; (R1) 0.9216; More...
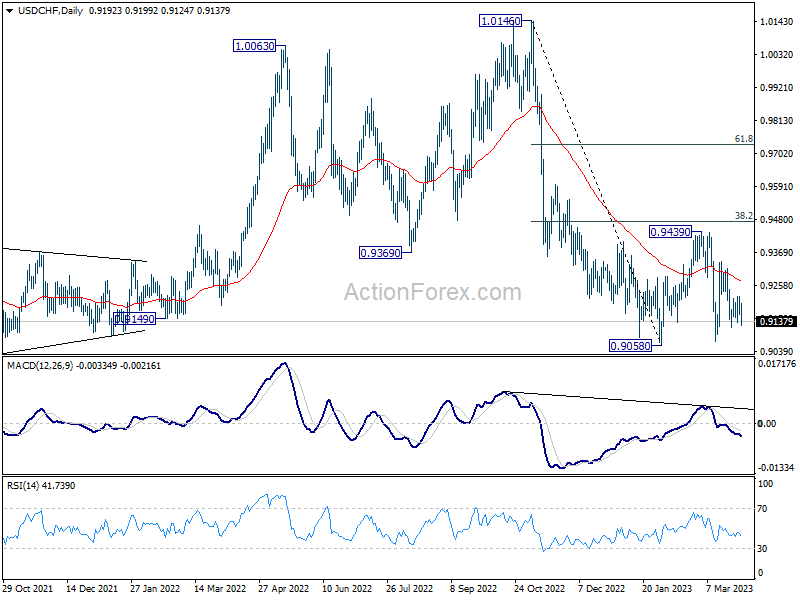
Range trading continues in USD/CHF and intraday bias remains neutral for the moment. Corrective pattern from 0.9058 low is extending. Another rise cannot be ruled out, but upside should be limited by 0.9474 fibonacci level. On the downside, firm break of 0.9058 will resume larger down trend from 1.1046.
In the bigger picture, fall from 1.1046 (2022 high) should still be in progress with 38.2% retracement of 1.0146 to 0.9058 at 0.9474 intact. Prior rejection by 55 week EMA was a medium term bearish sign. Break of 0.9058 will resume such decline towards 0.8756 support (2021 low). But overall, this fall is still as a leg in the long term range pattern from 1.0342 (2016 high). So, downside should be contained by 0.8756 to bring reversal.
GBP/USD Mid-Day Outlook
Daily Pivots: (S1) 1.2292; (P) 1.2327; (R1) 1.2351; More...
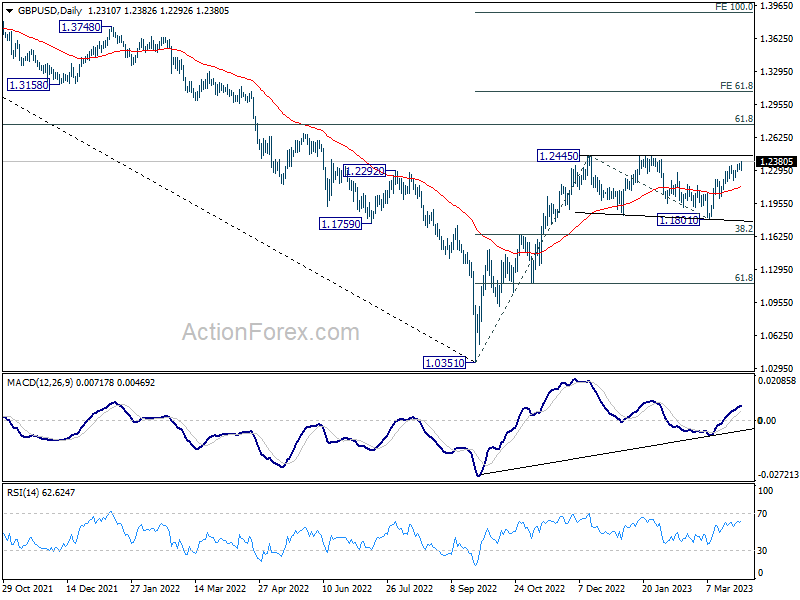
Intraday bias in GBP/USD remains on the upside for retesting 1.2445/6 resistance zone. Decisive break there will resume larger rally from 1.0351, and target 1.2759 fibonacci level. On the upside, below 1.2292 minor support will turn intraday bias neutral first. But further rally will remain in favor as long as 1.2203 resistance turned support holds.
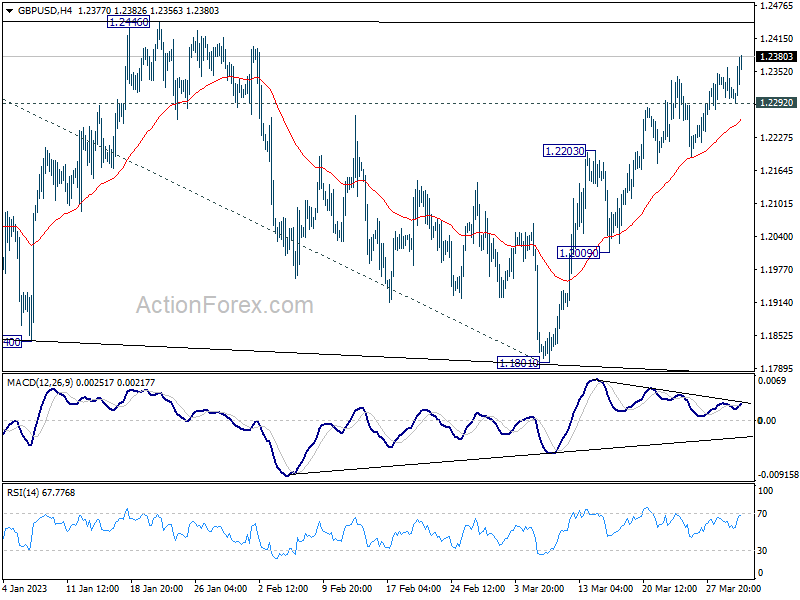
In the bigger picture, price action from 1.2445 are seen as a corrective pattern to rise from 1.0351 medium term bottom (2022 low). Resumption of the rally from 1.0351 is expected and break of 1.2446 will target 61.8% retracement of 1.4248 (2021 high) to 1.0351 at 1.2759. This will remain the favored case as long as 38.2% retracement of 1.0351 to 1.2445 at 1.1645 holds.
EUR/USD Mid-Day Outlook
Daily Pivots: (S1) 1.0818; (P) 1.0845; (R1) 1.0872; More...
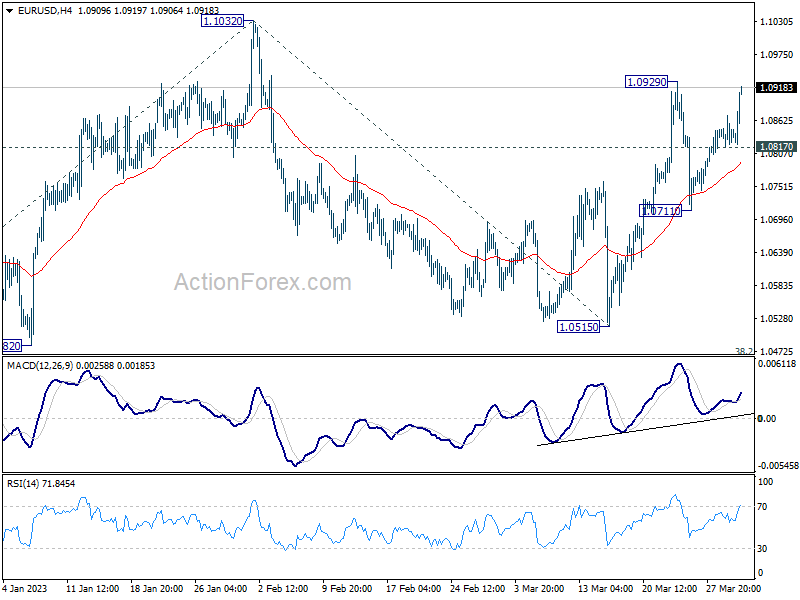
Immediately focus is now on 1.0929 resistance in EUR/USD. Break there will resume the rally from 1.0515 to retest 1.1032 high. Decisive break there will resume larger up trend from 0.9534 to 1.1273 fibonacci level next. On the downside, though, break of 1.0711 will turn bias to the downside to extend the corrective pattern from 1.1032 with another decline.
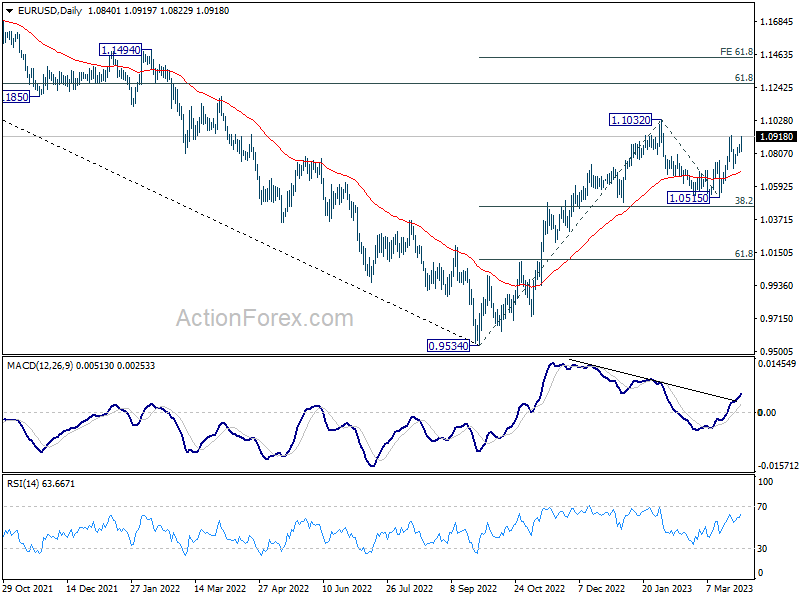
In the bigger picture, rise from 0.9534 (2022 low) is in progress with 38.2% retracement of 0.9534 to 1.1032 at 1.0460 intact. The strong support from 55 week EMA (now at 1.0623) was also a medium term bullish sign. Next target is 61.8% retracement of 1.2348 (2021 high) to 0.9534 at 1.1273. Sustained break there will solidity the case of bullish trend reversal and target 1.2348 resistance next (2021 high).
Rising Euro Lifts Sterling and Swiss Franc after German Inflation Data
Euro is on the rise today, pulling Sterling and Swiss Franc along with it. Slightly higher-than-expected German inflation data is sparking speculation of a potential upside surprise in Eurozone CPI tomorrow. This development, coupled with recent hawkish rhetoric from ECB officials, suggests further tightening are on the horizon, provided banking troubles don't resurface.
Dollar and Yen are experiencing a broad sell-off. Although US benchmark treasury yields are rising amid stabilizing sentiment, they are clearly outpaced by their German and British counterparts. Commodity currencies are not seeing significant gains, despite overall sentiment, as BoC has already paused and both RBA and RBNZ are nearing a pause.
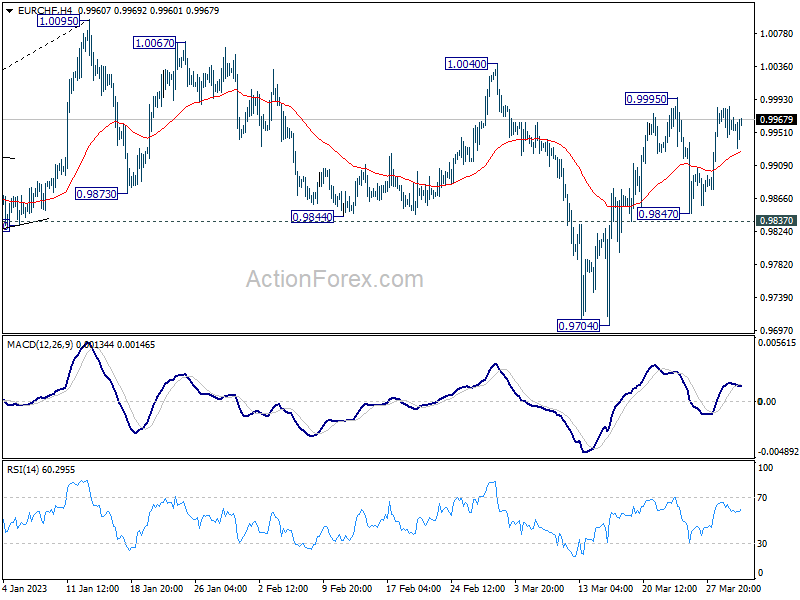
From a technical perspective, as Euro leads Sterling and Franc, focus is on 0.9995 resistance in EUR/CHF and 0.8864 resistance in EUR/GBP. Breaking these two levels will further strengthen EUR/USD's momentum through 1.0929 resistance towards 1.1032 high and increase the likelihood of breaking through this level to resume the larger uptrend.
In Europe, at the time of writing, FTSE is up 0.72%. DAX is up 0.93%. CAC is up 0.99%. Germany 10-year yield is up 0.047 at 2.374. UK 10-year gilt yield is up 0.047 at 3.518. Earlier in Asia, Nikkei dropped -0.36%. Hong Kong HSI rose 0.58%. China Shanghai SSE rose 0.65%. Singapore Strait Times dropped -0.16%. Japan 10-year JBG yield rose 0.0191 to 0.326.
US initial jobless claims rose to 198k, above expectations
US initial jobless claims rose 7k to 198k in the week ending March 25 above expectation of 195k. Four-week moving average of initial claims rose 2k to 198k. Continuing claims rose 4k to 1689k in the week ending March 18. Four-week moving average of continuing claims rose 10k to 1692k.
Also released, Q4 GDP growth was finalized at 2.6% while price index was finalized at 3.9%.
Swiss KOF dipped to 98.2, negative signals from manufacturing, services and construction
Swiss KOF Economic Barometer dropped slightly from 98.9 to 98.2 in March, below expectation of 100.5, staying below average value of 100.
According to KOF, the dip in the overall barometer reading is mainly due to negative signals emerging from the manufacturing, services, and construction sectors. However, these negative developments are partially offset by the positive performance of the Swiss exports indicator bundle. Meanwhile, other indicators incorporated in the barometer exhibit minimal changes.
NZ ANZ business confidence dipped to -43.4, slowdown aligns with RBNZ's intentions
New Zealand ANZ Business Confidence index in March experienced a slight dip, moving from -43.3 to -43.4, while the Own Activity Outlook improved marginally, rising from -9.2 to -8.5. However, export intentions, investment intentions, employment intentions, and pricing intentions all experienced declines. Cost expectations also fell from 88.3 to 86.4, but profit expectations rose from -37.7 to -33.9. Inflation expectations dropped from 5.94 to 5.82. According to ANZ, firms are cautious but persevering, with indicators suggesting a soft landing.
Although the activity indicators are subdued, the labor market tightness is gradually shifting, and inflation and cost indicators are easing slowly. Nevertheless, the challenging environment is putting pressure on expected profitability as firms navigate high cost inflation and uncertain future demand. ANZ noted that the winter season might reveal more challenges as tourist numbers decline, but for now, the slowdown appears to align with RBNZ's intentions.
EUR/USD Mid-Day Outlook
Daily Pivots: (S1) 1.0818; (P) 1.0845; (R1) 1.0872; More...
Immediately focus is now on 1.0929 resistance in EUR/USD. Break there will resume the rally from 1.0515 to retest 1.1032 high. Decisive break there will resume larger up trend from 0.9534 to 1.1273 fibonacci level next. On the downside, though, break of 1.0711 will turn bias to the downside to extend the corrective pattern from 1.1032 with another decline.
In the bigger picture, rise from 0.9534 (2022 low) is in progress with 38.2% retracement of 0.9534 to 1.1032 at 1.0460 intact. The strong support from 55 week EMA (now at 1.0623) was also a medium term bullish sign. Next target is 61.8% retracement of 1.2348 (2021 high) to 0.9534 at 1.1273. Sustained break there will solidity the case of bullish trend reversal and target 1.2348 resistance next (2021 high).
Economic Indicators Update
| GMT | Ccy | Events | Actual | Forecast | Previous | Revised |
|---|---|---|---|---|---|---|
| 00:00 | NZD | ANZ Business Confidence Mar | -43.4 | -43.3 | ||
| 07:00 | CHF | KOF Leading Indicator Mar | 98.2 | 100.5 | 98.9 | |
| 08:00 | EUR | Italy Unemployment Feb | 8.00% | 8.00% | 7.90% | 8.00% |
| 08:00 | EUR | ECB Economic Bulletin | ||||
| 09:00 | EUR | Eurozone Economic Sentiment Mar | 99.3 | 99.7 | 99.7 | |
| 09:00 | EUR | Eurozone Industrial Confidence Mar | -0.2 | 0.9 | 0.5 | 0.4 |
| 09:00 | EUR | Eurozone Services Sentiment Mar | 9.4 | 10.1 | 9.5 | |
| 09:00 | EUR | Eurozone Consumer Confidence Mar F | -19.2 | -19.2 | -19.2 | |
| 12:00 | EUR | Germany CPI M/M Mar P | 0.80% | 0.70% | 0.80% | |
| 12:00 | EUR | Germany CPI Y/Y Mar P | 7.40% | 7.30% | 8.70% | |
| 12:30 | USD | Initial Jobless Claims (Mar 24) | 198K | 195K | 191K | |
| 12:30 | USD | GDP Price Index Q4 F | 3.90% | 3.90% | 3.90% | |
| 12:30 | USD | GDP Annualized Q4 F | 2.60% | 2.70% | 2.70% | |
| 14:30 | USD | Natural Gas Storage | -55B | -72B |
ETHUSD and LTCUSD Technical Analysis
ETHUSD: Bullish HARAMI Pattern Above $1687
Ethereum was unable to sustain its bearish momentum, and after touching a low of $1687 on 27th Mar, the prices started to correct upwards against the US dollar touching a high of $1829 today in the Asian trading session.
We have seen a bullish opening of the markets this week.
The price of Ethereum is ranging near a new record high of 1 month.
We can clearly see a bullish Harami pattern above the $1687 handle which is a bullish pattern and signifies the end of a bearish phase and the start of a bullish phase in the markets.
ETH is now trading just above its pivot level of 1798 and is moving into a mildly bullish channel. The price of ETHUSD is now testing its classic resistance level of 1803 and Fibonacci resistance level of 1806 after which the path towards 1850 will get cleared.
We can see the formation of both bullish Harami and bullish Harami cross patterns in the 2-hour time frame.
The relative strength index is at 53.40 indicating a strong demand for Ether and the continuation of the buying pressure in the markets.
Both the STOCH and STOCHRSI are giving a neutral signal, which means that the prices are expected to enter into a consolidation phase in the short-term range.
Some of the technical indicators are giving a buy market signal.
Most of the moving averages are giving a buy signal at the current market levels of $1800.
ETH is now trading above both the 200 hourly simple and 200 hourly exponential moving averages.
- Ether: bullish reversal seen above the $1687 mark.
- The short-term range appears to be mildly bullish.
- ETH continues to remain above the $1750 level.
- The average true range is indicating high market volatility.
Ether: Bullish Reversal Seen Above $1687
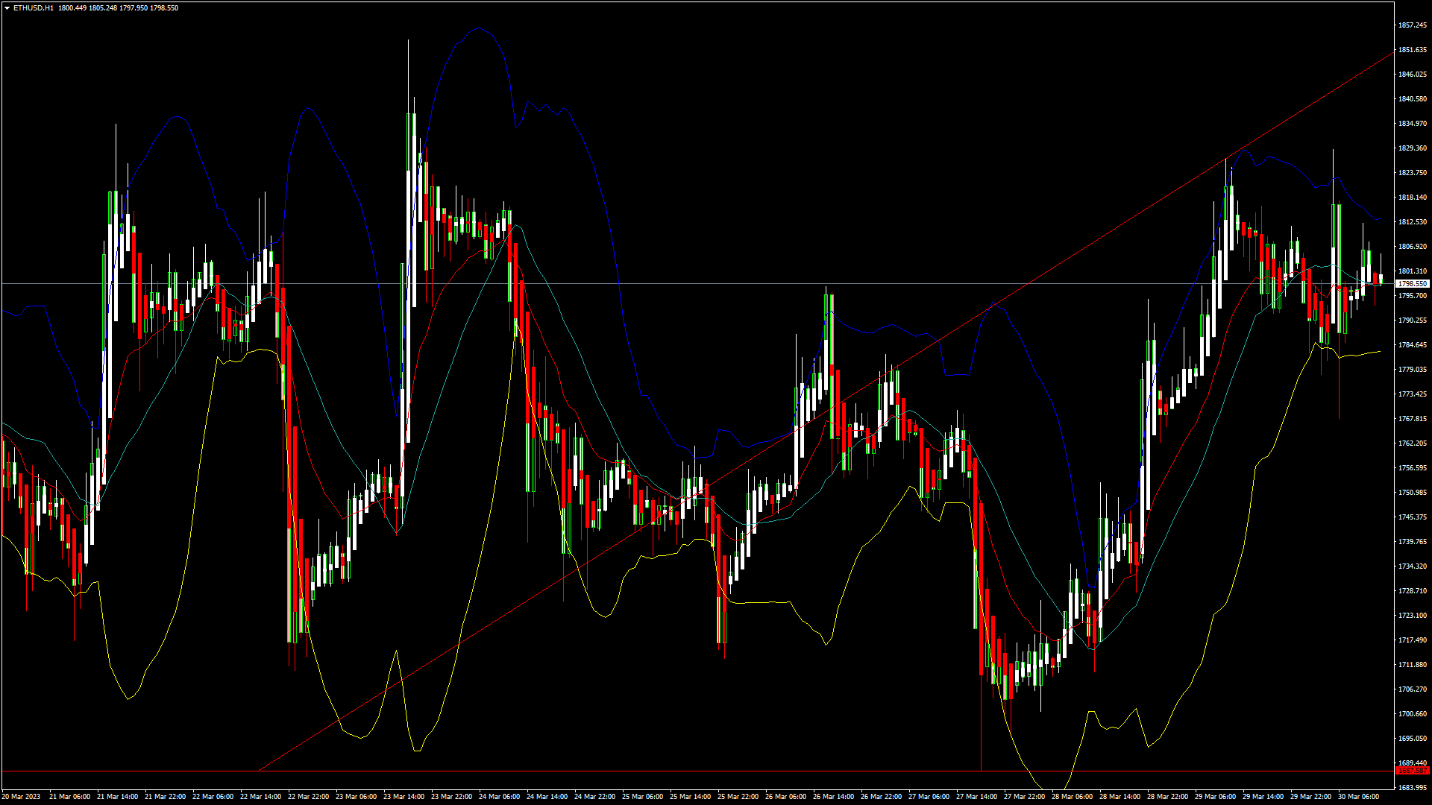
ETHUSD is now testing to cross the $1900 levels and the current momentum suggests that we are now moving towards the $1850 level.
We can see the formation of bullish engulfing lines in the weekly time frame.
The price is back over the pivot point in the weekly time frame indicating bullish trends.
We can see the formation of moving average bullish crossover patterns MA20 and MA50 in the 4-hourly time frame.
We have also seen an upside gap in the 15-minute timeframe which indicates the bullish nature of the markets.
ETHUSD touched an intraday high of 1829 and an intraday low of 1774 in the Asian trading session today.
The key support levels to watch are $1744, at which the price crosses the 9-day moving average stalls, and $1769 at which the price crosses the 9-day moving average.
ETH has decreased by 0.92% with a price change of 16.80$ in the past 24hrs and has a trading volume of 9.457 billion USD.
We can see a decrease of 6.37% in the total trading volume in the last 24 hrs which appears to be normal.
The Week Ahead
ETH is facing stiff resistance at crossing the $1850 handle after which the next visible targets are located at $1900 and $1950.
We can see the formation of a major bullish trend line with the support located at $1679 at which the price crosses the 18-day moving average.
We can see the formation of a bullish ascending channel from $1687 towards the $1852 level.
The immediate short-term outlook for Ether has turned mildly bullish, the medium-term outlook has turned bullish, and the long-term outlook for Ether is neutral under present market conditions.
The resistance zone is located at $1830 which is a pivot point 1st resistance point and at $1913 which is a 38.2% retracement from a 52-week low.
The weekly outlook is projected at $1950 with a consolidation zone of $1900.
LTCUSD: Bullish Engulfing Pattern Above $79.28
Litecoin was unable to sustain its bearish momentum last week and after touching a low of $79.28 on 22nd Mar, the price started to correct upwards against the US dollar touching a high of $95.79 on 24th Mar.
We have seen a bullish opening of the markets this week.
We can clearly see a bullish engulfing pattern above the $79.28 handle which is a bullish pattern and signifies the end of a bearish phase and the start of a bullish phase in the markets.
Litecoin is now trading above its 100 hourly simple moving average and above its 100 hourly exponential moving average. The price of LTCUSD is just above its pivot levels of 90.78.
The relative strength index is at 50.72 indicating a neutral demand for Litecoin and the shift towards the consolidation phase in the markets.
The price of Litecoin continues to remain above some of the moving averages, which are now giving a buy signal at current market levels of 90.09
Both the average direction index and commodity channel index are giving a neutral signal, which means that the prices are expected to remain in a consolidation phase in the short-term range.
The Williams percent range is back over -50 in the 30-minute time frame indicating bullish trends.
The short-term outlook for Litecoin has turned mildly bullish.
- Some of the technical indicators are giving a buy signal.
- Litecoin: bullish reversal seen above the $79.28 levels.
- The RSI is giving a neutral signal.
- The average true range is indicating high market volatility.
Litecoin: Bullish Reversal Seen Above $79.28
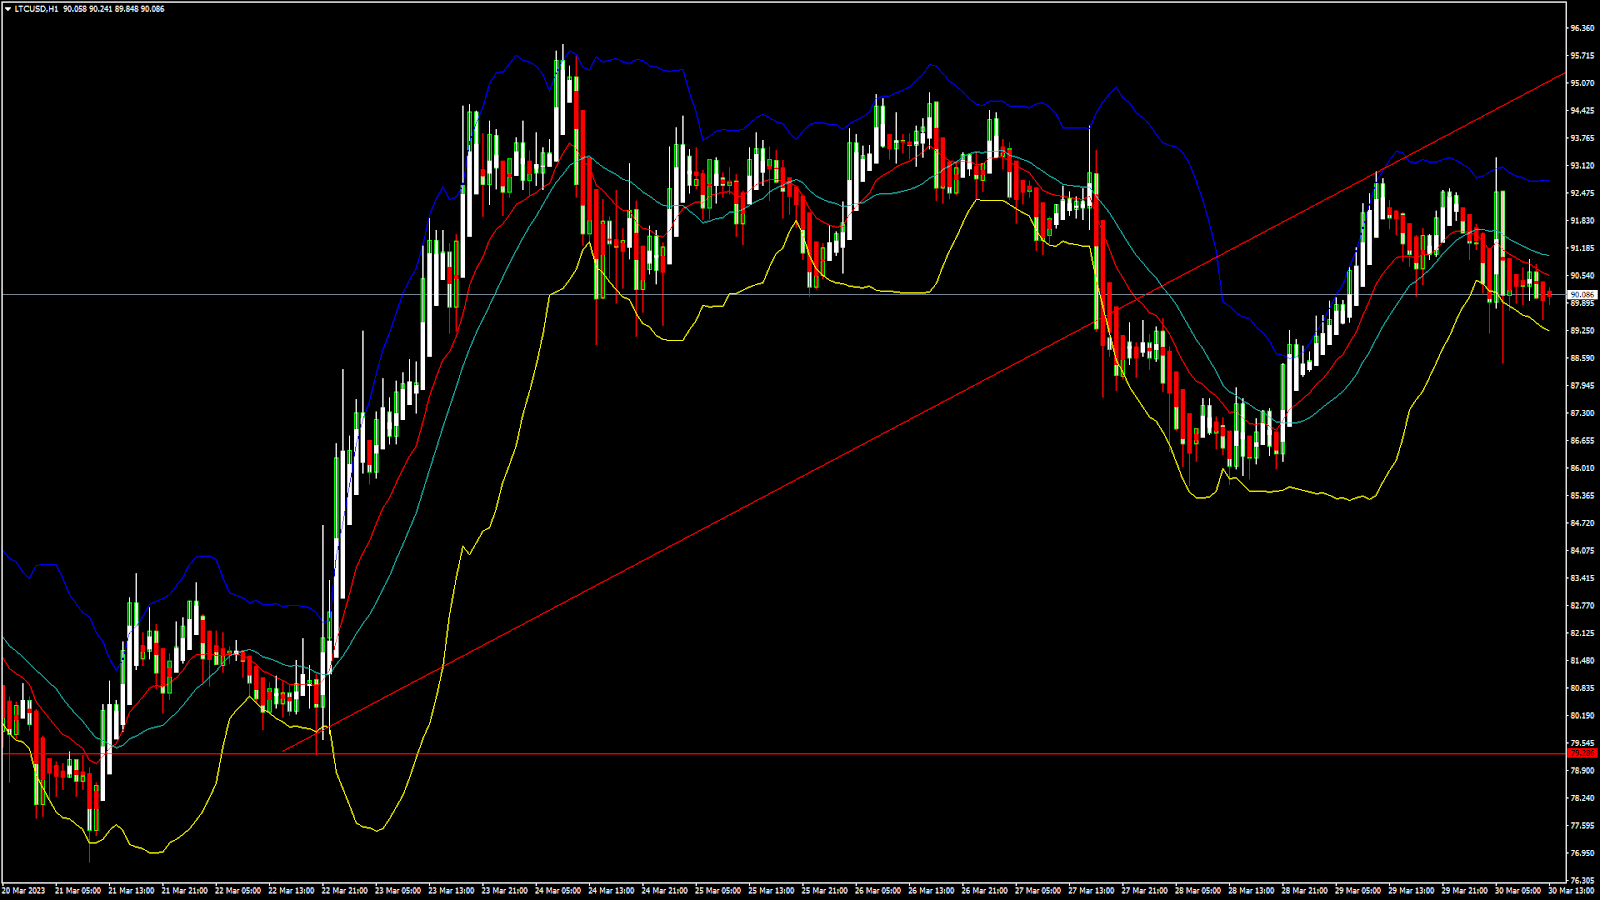
The price of Litecoin continues to move in a mildly bullish momentum above the $90 handle, and we have already entered into a consolidation zone in the European trading session today.
We can see the formation of a bullish trend reversal pattern with the Adaptive Moving Average AMA50 in the weekly time frame.
The MACD indicator is also giving a bullish signal in the weekly time frame.
The price of LTCUSD is now facing its classic resistance level of 92.91 and Fibonacci resistance level of 95.38 after which the path towards $100 will get cleared.
Litecoin touched an intraday high of $93.30 and an intraday low of $88.47 in the Asian trading session today.
Litecoin is now facing its resistance zone at $93.94 which is a pivot point 1st resistance point and at $97.06 which is a 3-10 day MACD oscillator stalls.
LTCUSD has decreased by 1.71% with a price change of 1.57$ in the past 24hrs and has a trading volume of 0.578 Billion USD.
Litecoin’s trading volume has increased by 2.91% compared to yesterday which appears to be normal.
The Week Ahead
The price of Litecoin has been successful in crossing the $95 barrier and now we are looking to touch the $100 level. At present, the markets are ranging in a consolidation phase after which we could see fresh upsides towards the $95 and $100 levels.
Some of the technical indicators are also giving a neutral tone present in the markets.
The price of Litecoin needs to remain above the important support levels of $87.13, which is a 14-day RSI at 50%, and $87.67, at which the price crosses 18-day moving average stalls.
The short-term outlook for Litecoin has turned mildly bullish, the medium-term outlook is bullish, and the long-term outlook is neutral at present market conditions.
The weekly outlook is projected at $100 with a consolidation zone of $95.