

Sample Category Title
EUR/USD Daily Outlook
Daily Pivots: (S1) 1.0818; (P) 1.0845; (R1) 1.0872; More...
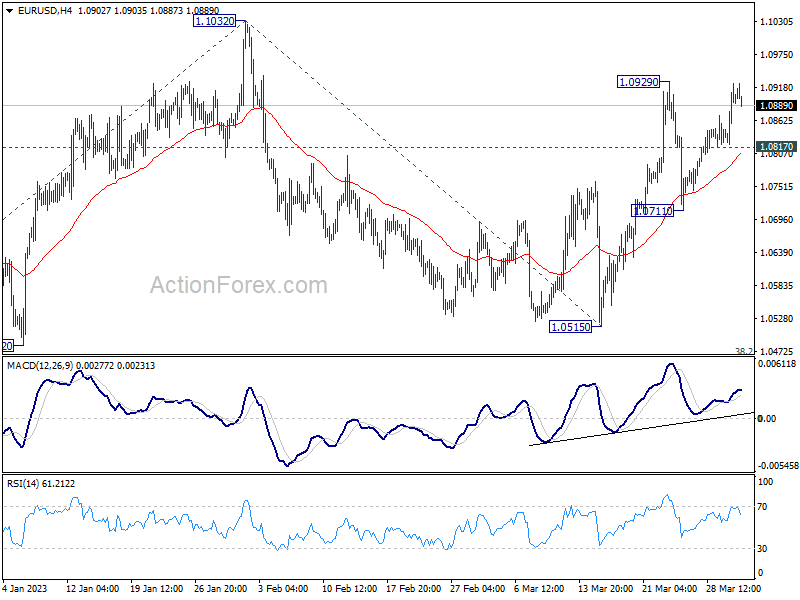
Focus remains on 1.0929 resistance in EUR/USD. Break there will resume the rally from 1.0515 to retest 1.1032 high. Decisive break there will resume larger up trend from 0.9534 to 1.1273 fibonacci level next. On the downside, though, break of 1.0711 will turn bias to the downside to extend the corrective pattern from 1.1032 with another decline.
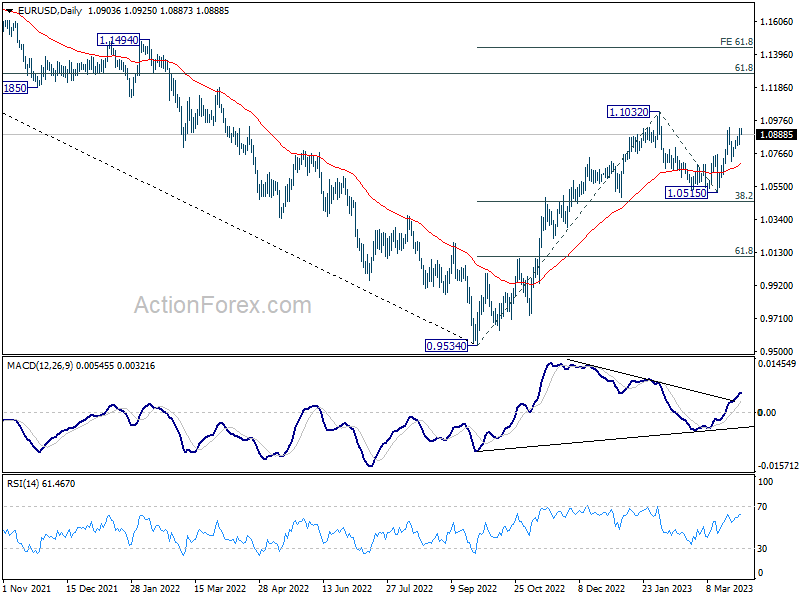
In the bigger picture, rise from 0.9534 (2022 low) is in progress with 38.2% retracement of 0.9534 to 1.1032 at 1.0460 intact. The strong support from 55 week EMA (now at 1.0623) was also a medium term bullish sign. Next target is 61.8% retracement of 1.2348 (2021 high) to 0.9534 at 1.1273. Sustained break there will solidify the case of bullish trend reversal and target 1.2348 resistance next (2021 high).
Euro Inflation Falls, But
First CPI figures from Spain and Germany confirmed that headline inflation in Europe eased by a big chunk in March, thanks to the base effect - as we now compare war months to war months.
Released yesterday, the German inflation fell from 9.3% to 7.8%, and inflation in Spain halved, from 6% to 3.1%.
Chic, but not enough.
When we filter out the energy and food prices – which exploded with the war – the inflation picture is not as optimistic. In fact, core inflation in Spain barely fell this month, from 7.6% to 7.5%.
And core inflation in the Eurozone is expected to rise to a fresh record high.
If the upside pressure in core inflation persists, no matter how fast we see the headline inflation fade, the European Central Bank (ECB) will stick to its guns to abate inflation and the euro will continue its journey higher.
The EURUSD will likely win over the 1.10 offers in the next few sessions, partly because the ECB hawks remain in charge of the market with the solid inflation, but also partly because the US dollar remains under a decent selling pressure.
The US dollar index is sitting at the low levels of the Silicon Valley Bank (SVB) collapse, and despite hawkish comments from Federal Reserve (Fed) officials – hinting at further rate hikes to tame inflation – the banking stress and soft economic data prevent the hawkish Fed pricing from taking effect.
Released yesterday, the US GDP data showed that the US economy grew 2.6% in Q4, slightly less than the 2.7% penciled in by analysts. Yet, the GDI – the gross domestic income – fell 1.1% during the same quarter, down from 2.8% printed in Q3. That was the largest decline since the pandemic.
Moreover, the US corporate profits fell 2% in Q4 – the most in the past two years – and the profit margins fell from around 15% to 14%.
As a result of soft economic data, the US 2-year yield stagnates a touch above the 4% mark – rejecting the further rate hike comments.
Soft yields continue giving support to stock indices despite warnings from the economic data front. The S&P500 will be closing the month with gains and Nasdaq 100 will step into the new quarter having stepped into the bull market.
Quarter in a nutshell
We had a quarter full of surprise and unexpected events.
We expected recession to show up, equities to fall and sovereign bonds to rally.
Instead, equities rallied, sovereign bonds fell until the SVB collapse and recession was … clearly not on the menu of the Q1.
Energy and commodities didn’t get the boost we expected from the Chinese reopening, and more importantly, money flew into money market funds with investors seeking higher returns with low-risk assets.
The technology stocks did the heavy lifting this quarter, as the Big Tech names like Apple, Microsoft and Google gained big. The FAANG stocks rallied almost 30% since the start of the year. That rally partly hid the bank selloff and saved the quarter for the S&P500. The S&P500 would be in the negative year-to-date, if Big Tech was not part of the game.
That, to me, means that the actual stock rally is certainly too sensitive to yields. If the yields push higher, due to an undesirably high inflation for example, we could see the recent equity gains crumble.
And the higher yields, which also boosts appetite for cash could be the next headache for banks, and for equities.
One last thing before we go
Today, the US will release the February PCE data – the Fed’s favourite gauge of inflation. Core inflation may have eased on a monthly basis but is expected to remain steady on a yearly basis around the 4.7% mark. A read in line with expectations, or ideally lower than expected could keep the Fed hawks at bay, and let the dollar further relax.
In the dollar-yen, we see the quarter end flows feed into a softer yen and a stronger dollar-yen. The pair is testing an important resistance zone, around 133, including the 50-DMA and the minor 23.6% Fibonacci retracement on October to January retreat.
With the softening Fed expectations, and increasingly pressure on Bank of Japan (BoJ) – to end its no-longer-adopted easy monetary policy under the new Governor Ueda, there is certainly not much positive potential in the dollar yen. The price rallies could be interesting top selling opportunities for a fall toward the 125/127 range.
All Eyes on Inflation Data
Market movers today
The main focus today will be on the euro area March flash HICP figures. The preliminary data released for Germany and Spain points towards headline inflation cooling to 6.7% y/y, lower than initially estimated. That said, the ECB focuses on core inflation, which has likely remained elevated.
The US Private Consumption Expenditures will be released for February. Consensus expects Core PCE inflation to settle at +0.4% m/m, close to the core CPI released earlier (+0.45%). Real private consumption growth likely moderated after the January boost from warm weather faded.
In the evening, Fed's Williams and Cook, as well as ECB's Lagarde will be on the wires.
In the Nordics, we expect the Norwegian jobless rate to rise moderately to 1.8% (s.a.) in February. Also, Riksbank will publish the details for the first sale of government bonds taking place on Tuesday.
The 60 second overview
Fed's weekly data showed that the use of the discount window declined to USD88.2bn (from USD110.2bn a week ago), while the use of the new Bank Term Funding Program (BTFP) increased to USD64.4bn (from 53.7bn). The combined use of the two emergency liquidity facilities continued the modest decline from the previous week, suggesting that the most acute risks could be contained for now. Similarly, the use of Fed's USD swap lines and the FIMA repo facility remained near the previous week's level, which means that foreign central banks' demand for USD liquidity has remained stable. Easing stability risks could turn markets' focus increasingly on the incoming macro data, which we think will likely support the case for a final Fed rate hike in May.
Also in the US, former President Trump has now been officially charged for crimes. The exact nature of charges is not yet known, but the case comes after a New York grand jury heard a witness give a statement on President Trump paying hush money to cover an alleged affair.
Finland is closing in on NATO membership after Turkey's parliament overnight approved a bill that allows Finland to join NATO. All NATO member countries have now ratified Finland's accession and it should only be a matter of days that Finland officially becomes a member. Sweden's membership bid still awaits ratification by both Hungary and Turkey, and Turkey has repeatedly said that Sweden needs to take additional steps against supporters of Kurdish militants. As the issue is highly political, it is very difficult to give an estimated timeline for the process.
Equities: Global equities higher yesterday as macro data registered close to expectations and confidence crisis in banking slowly abating. It is fascinating how fast investors either forget or forgive. Last Friday the global financial market was dead-scared that Deutsche Bank was going to be restructured over the weekend but since then equities have been marching high. We argue this Friday will be very different to the last three Fridays when no one dared to buy banks ahead of the weekend. Yesterday, equities were lifted by the cyclical growth stocks, min vol underperforming and VIX moving yet another step lower. In US Dow +0.4%, S&P 500 +0.6%, Nasdaq +0.7% and Russell 2000 -0.2%.
Asian markets are higher this morning after another set of strong Chinese PMI data with the service sector showing very strong acceleration. US and European futures higher as well.
FI: European yields continue to rise despite the decline in headline inflation data from Germany and Spain, but core-inflation is sticky and remains high. Today, more preliminary inflation data from EU will be released, where headline inflation is expected to decline, but core inflation is likely to remain high. Given the comments from ECB officials it will support more rate hikes and upward pressure on the front of the yield curve as we saw yesterday. Even though 2Y German yields have risen some 35bp, there is still some 50bp left from the peak in early March.
FX: As we enter the final session of the quarter focus will not least turn to quarter-end flows and interests. Yesterday's session was characterised by EUR/USD moving above 1.09 aided by broader risk sentiment and German core inflation data. The SEK continues to trade poorly while the NOK sell-off has eased slightly with oil moving higher.
Credit: Credit markets were broadly positive yesterday with iTraxx Main going 1.8bp tighter to 87.9bp while Xover tightened by 9.2bp to 452.9bp. In addition, the primary markets continue to be wide open with several financial and corporate issuers active with new deals across the Eurobond market. The current market sentiment is underpinned by a constructive interest also for the more leveraged share of the announced credit opportunities.
Nordic macro
Today, after market close (CET 16:20), the Riksbank will publish the details for the first sale of government bonds taking place on Tuesday. It is also the last day for a possible agreement in the Swedish wage negotiations.
Norwegian unemployment has remained surprisingly low despite leading indicators pointing to softer - albeit still strong - labour demand. We expect the jobless rate to rise moderately to 1.8% (s.a.) in February.
Ahead of the general election in Finland on Sunday, the three biggest parties, National Coalition (centre-right), Social democrats and the Finns party (right-wing), are running neck and neck. Different coalitions are possible, and forming a government may not be easy. A right-wing government is one of the options, potentially entailing significant cuts in government spending, even though campaigns have lacked details. Given the weak growth outlook, balancing public finances will be a challenge for any government composition.
Technical Outlook and Review
DXY:
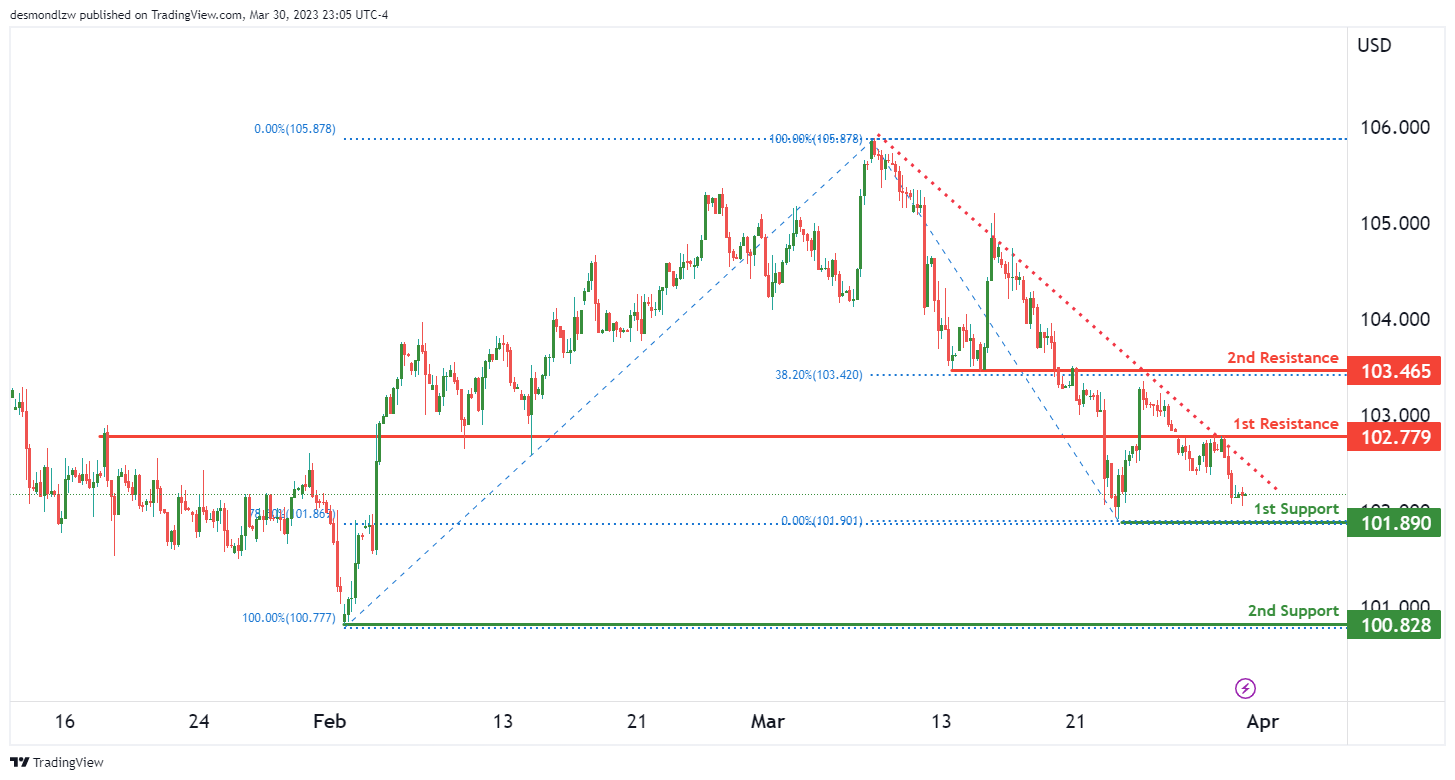
The DXY chart is currently showing bearish momentum, with prices below a major descending trendline, suggesting a continuation of the bearish trend. The first support level is at 101.89, which is a swing low support level and coincides with the 78.60% Fibonacci retracement level, making it a strong level to watch. If prices were to drop further, they could reach the second support level at 100.82, which is also a swing low support level.
On the other hand, the first resistance level is at 102.77, which is an overlap resistance level, indicating it could be a strong level to watch if prices were to rise. If the price were to break through this level, it could potentially rise towards the second resistance level at 103.46, which is also an overlap resistance level and coincides with the 38.20% Fibonacci retracement level.
EUR/USD:
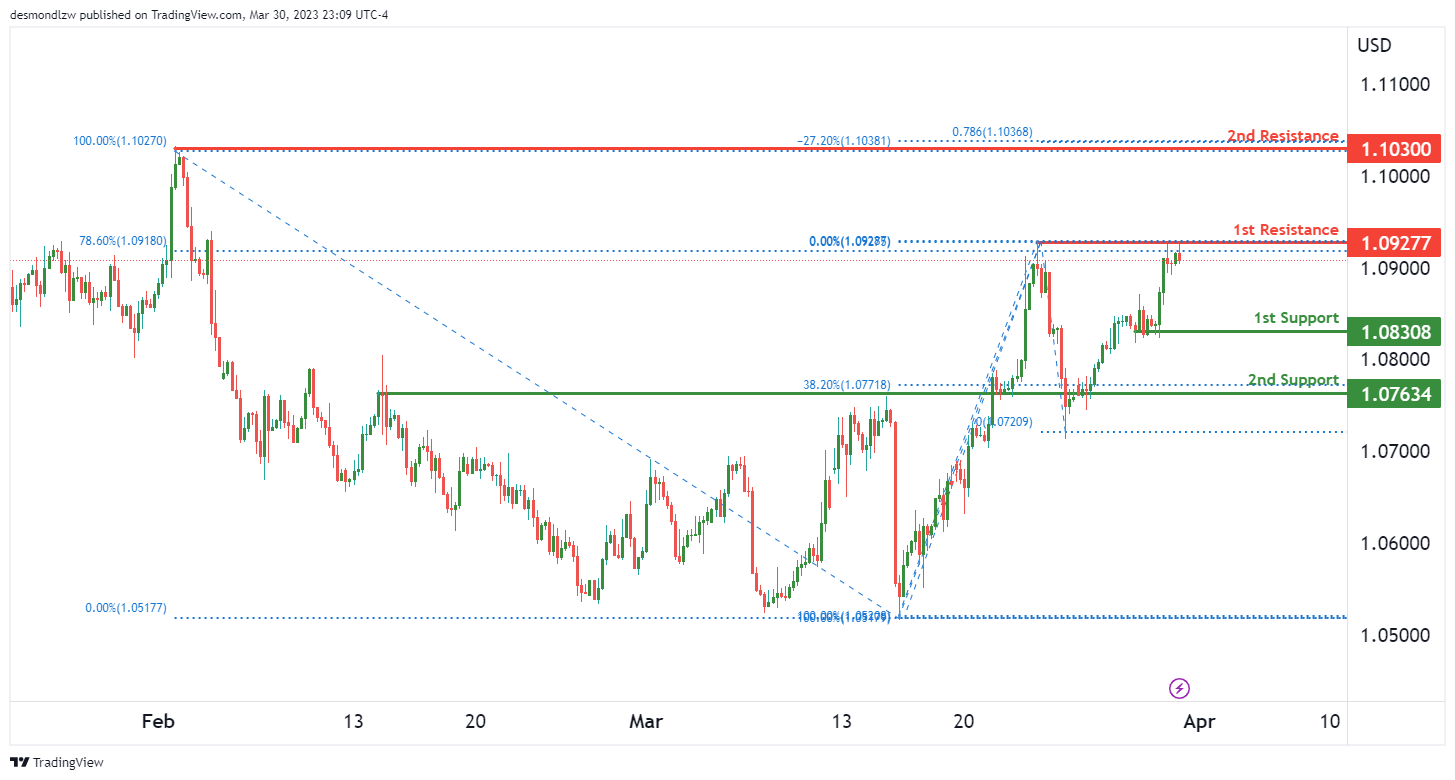
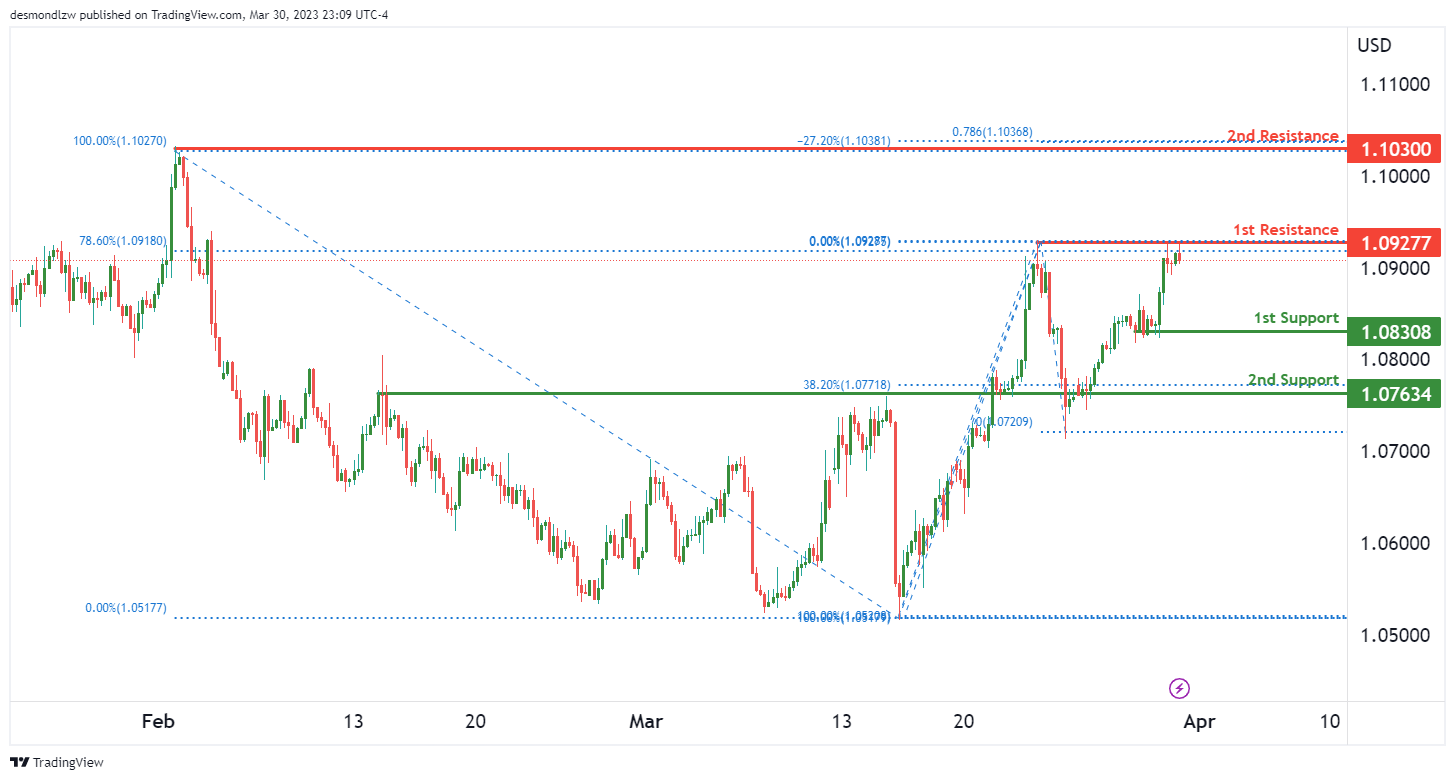
The EUR/USD chart is currently showing bearish momentum, indicating a potential bearish reaction off the first resistance level at 1.0927, which is a multi-swing high resistance level and coincides with a 78.60% Fibonacci retracement. If price were to drop from this level, it could potentially reach the first support level at 1.0830, which is a multi-swing low support level.
In the event of a further drop, the second support level at 1.0763 could also come into play, as it is an overlap support level and coincides with the 38.20% Fibonacci retracement level.
On the other hand, breaking through the first resistance level could lead to a rise towards the second resistance level at 1.1030, which is a swing high resistance level and coincides with a -27% Fibonacci expansion.
GBP/USD:
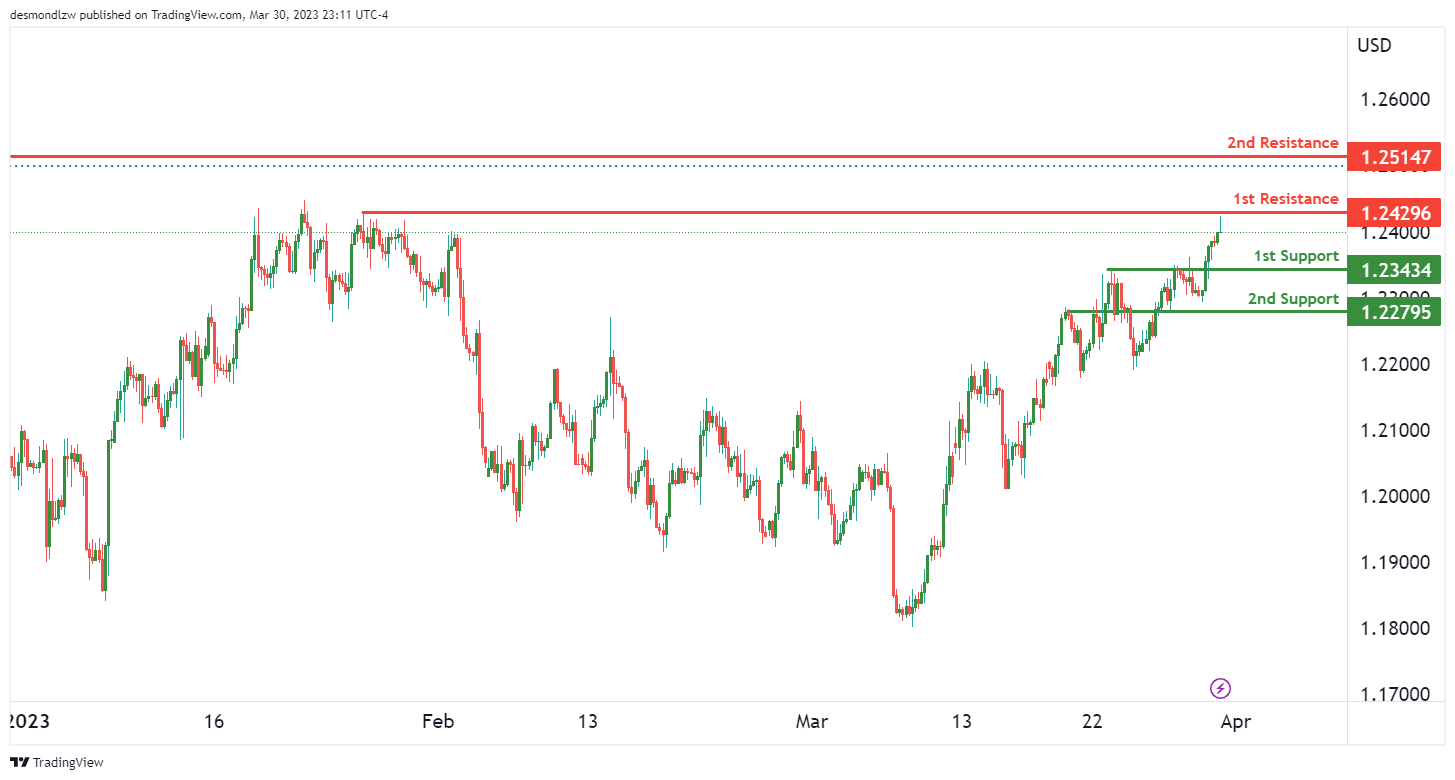
The GBP/USD chart is showing a bearish momentum overall, as price has the potential to react bearishly off the first resistance and drop to the first support level.
The first support level is at 1.2343, which is a strong overlap support level. Additionally, the second support level is at 1.2279, which is also an overlap support level. These support levels are good for potential price bounces as they have held in the past and are important price levels.
On the other hand, the first resistance level is at 1.2429, which is a multi-swing high resistance level. This level has previously caused price to reverse in the past and has the potential to cause another reversal. The second resistance level is at 1.2514, which is a swing high resistance level. This level also has the potential to cause a price reversal.
USD/CHF:
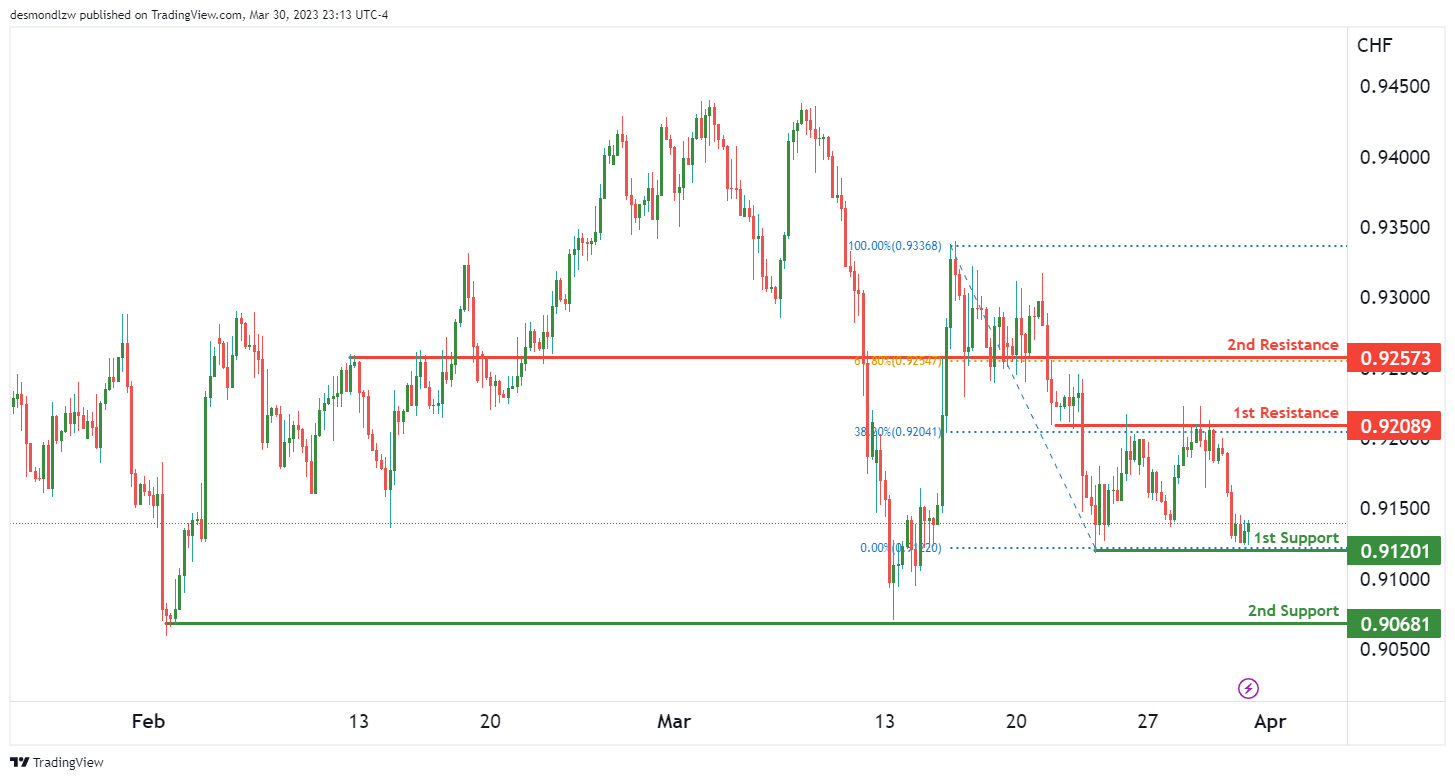
The USD/CHF chart is showing bullish momentum, which indicates that prices may rise further. A bounce off the 1st support level at 0.9120 could lead to a potential move towards the 1st resistance level at 0.9208.
The 1st support level at 0.9120 is a multi-swing low support, which makes it a significant level to watch. Additionally, the 2nd support level at 0.9068 is a swing low support, which also adds to its importance.
On the resistance side, the 1st resistance level at 0.9208 is an overlap resistance and coincides with a 38.20% Fibonacci retracement. This makes it a strong level of resistance to break through. Further up, the 2nd resistance level at 0.9257 is also an overlap resistance and lines up with a 61.80% Fibonacci retracement.
USD/JPY:
The overall momentum of the USD/JPY chart is currently bearish, with price below a major descending trend line suggesting that bearish momentum is on the cards.
Looking at the chart, price could potentially continue its bearish movement towards the 1st support at 131.59, which is a strong overlap support and coincides with a 50% Fibonacci retracement level.
If price were to break below the 1st support, the next support level it could drop to is the 2nd support at 130.42, which is also a multi-swing low support.
On the resistance side, we can see that price is currently facing a major hurdle at the 1st resistance level of 133.80, which is a swing high resistance and coincides with a 50% Fibonacci retracement level.
If price were to break above the 1st resistance, the next resistance level it could move towards is the 2nd resistance at 134.85, which is an overlap resistance and coincides with a 61.80% Fibonacci retracement level.
It’s worth noting that there is an intermediate support level at 132.81, which is between where price is currently and the 1st support. A break of this intermediate support could trigger a strong bearish acceleration towards the 1st support.
AUD/USD:
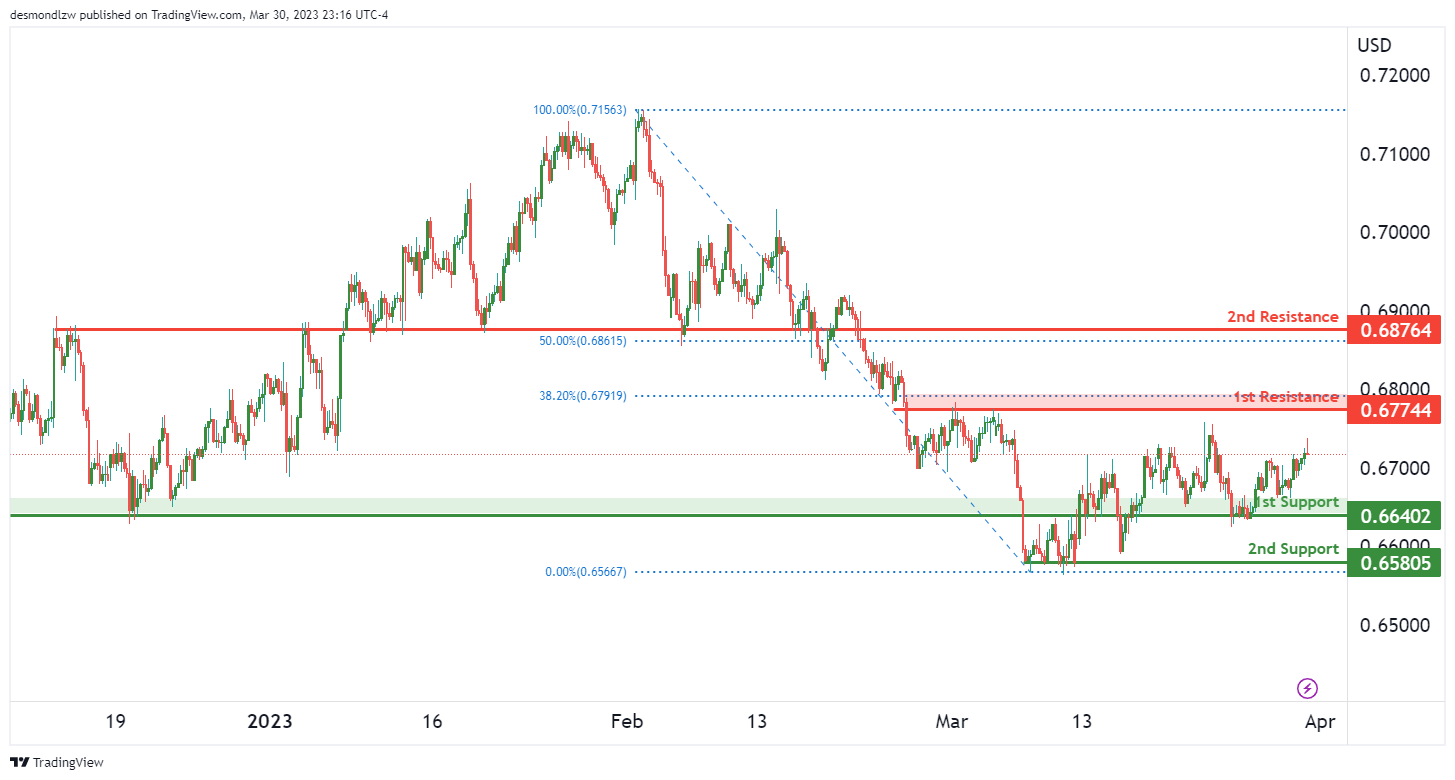
The chart’s overall momentum is currently bullish, indicating that it may continue to rise. The price is expected to continue to move towards the first resistance level, suggesting a bullish continuation.
The first support level is at 0.6640, which is a good level of support due to its overlapping nature. Another good support level is at 0.6580, which is a multi-swing low support. On the other hand, the first resistance level, which is at 0.6774, is a good level of resistance as it coincides with a 38.20% Fibonacci retracement level, which strengthens the resistance. The second resistance level is at 0.6876, which is another good level of resistance due to its overlapping nature and its alignment with a 50% Fibonacci retracement level.
NZD/USD:
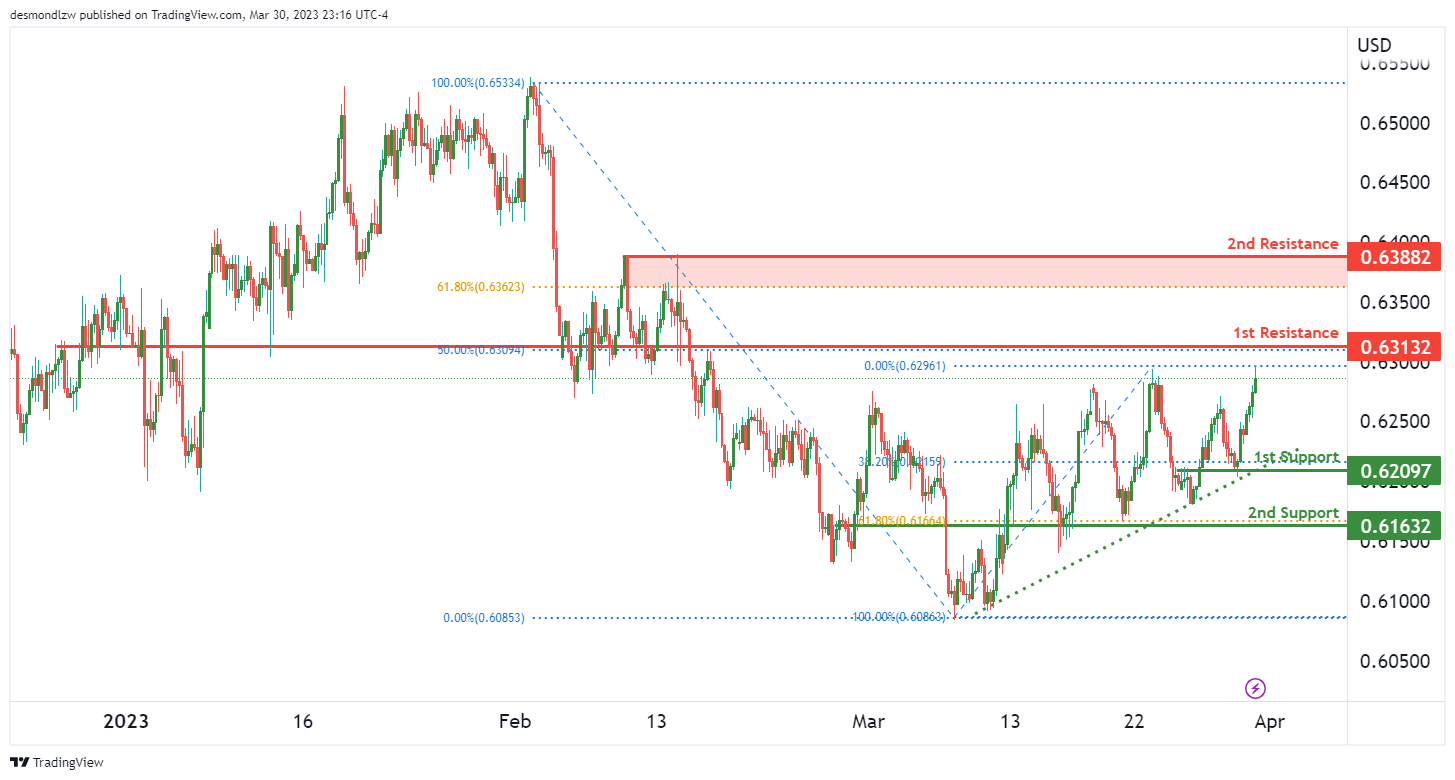
The NZD/USD chart has been showing bullish momentum. This could potentially continue towards the 1st resistance level. The 1st support is at 0.6209, which is a good level for a potential bounce. This level is an overlap support and is also at the 38.20% Fibonacci retracement level. If the price bounces from this level, it could potentially rise towards the 1st resistance at 0.6313. This resistance level is also an overlap resistance, and it aligns with the 50% Fibonacci retracement level. If the price manages to break this resistance level, it could rise towards the 2nd resistance level at 0.6388. This resistance level is a multi-swing high resistance, and it coincides with the 61.80% Fibonacci retracement level.
On the other hand, if the price fails to bounce off the 1st support level, it could potentially drop towards the 2nd support level at 0.6163. This support level is also an overlap support and coincides with the 61.80% Fibonacci retracement level. A break below this support level could signal a shift in momentum from bullish to bearish.
USD/CAD:
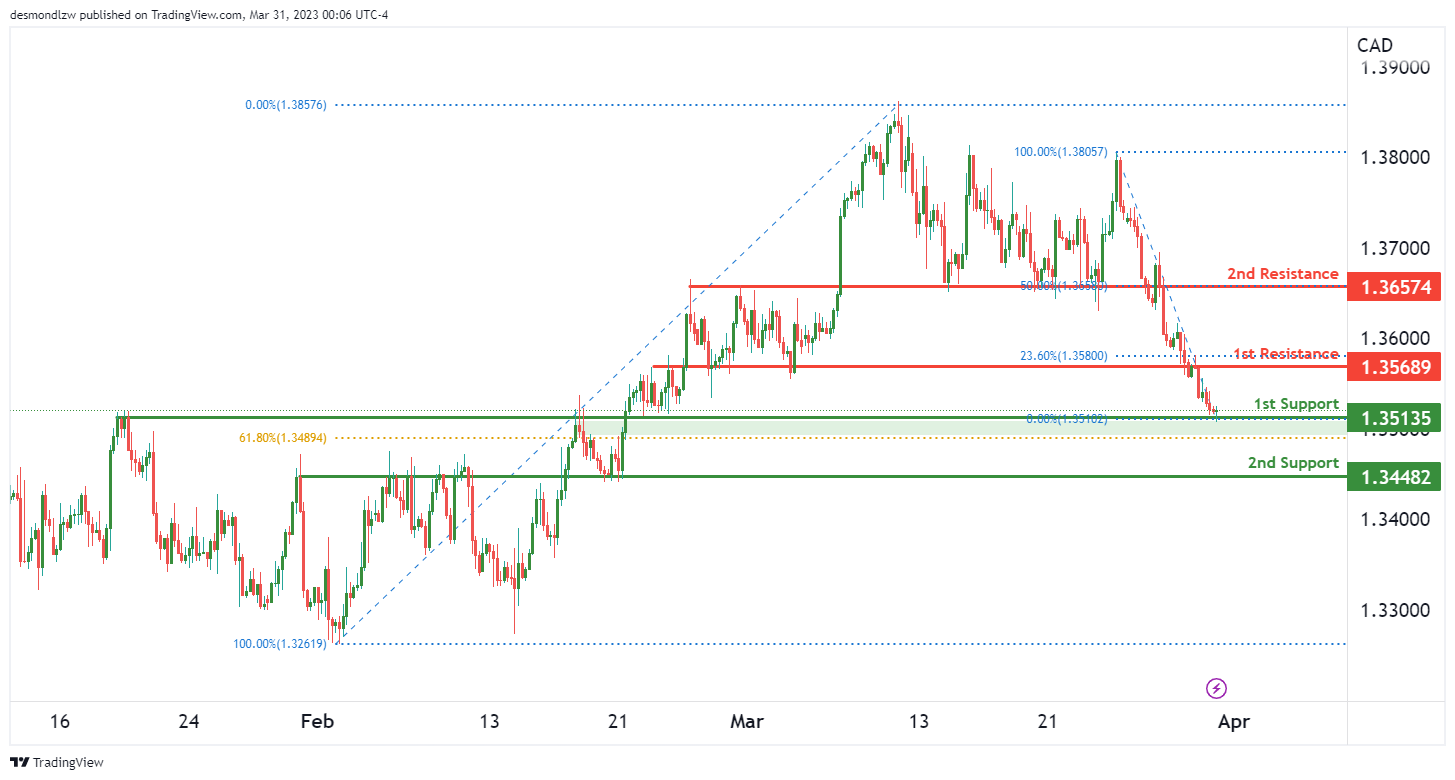
The overall momentum for the USD/CAD chart is bullish, and it could potentially make a bullish bounce off the first support level towards the first resistance level.
The first support level is at 1.3513, and it is a strong overlap support level with a 61.80% Fibonacci retracement lining up with it. This level could provide a good opportunity for a bullish bounce. The second support level is at 1.3448, and it is also an overlap support level.
The first resistance level is at 1.3568, and it is also an overlap resistance level with a 23.60% Fibonacci retracement lining up with it. If the price bounces from the first support level, it could rise towards this first resistance level. The second resistance level is at 1.3657, and it is another overlap resistance level with a 50% Fibonacci retracement lining up with it.
DJ30:
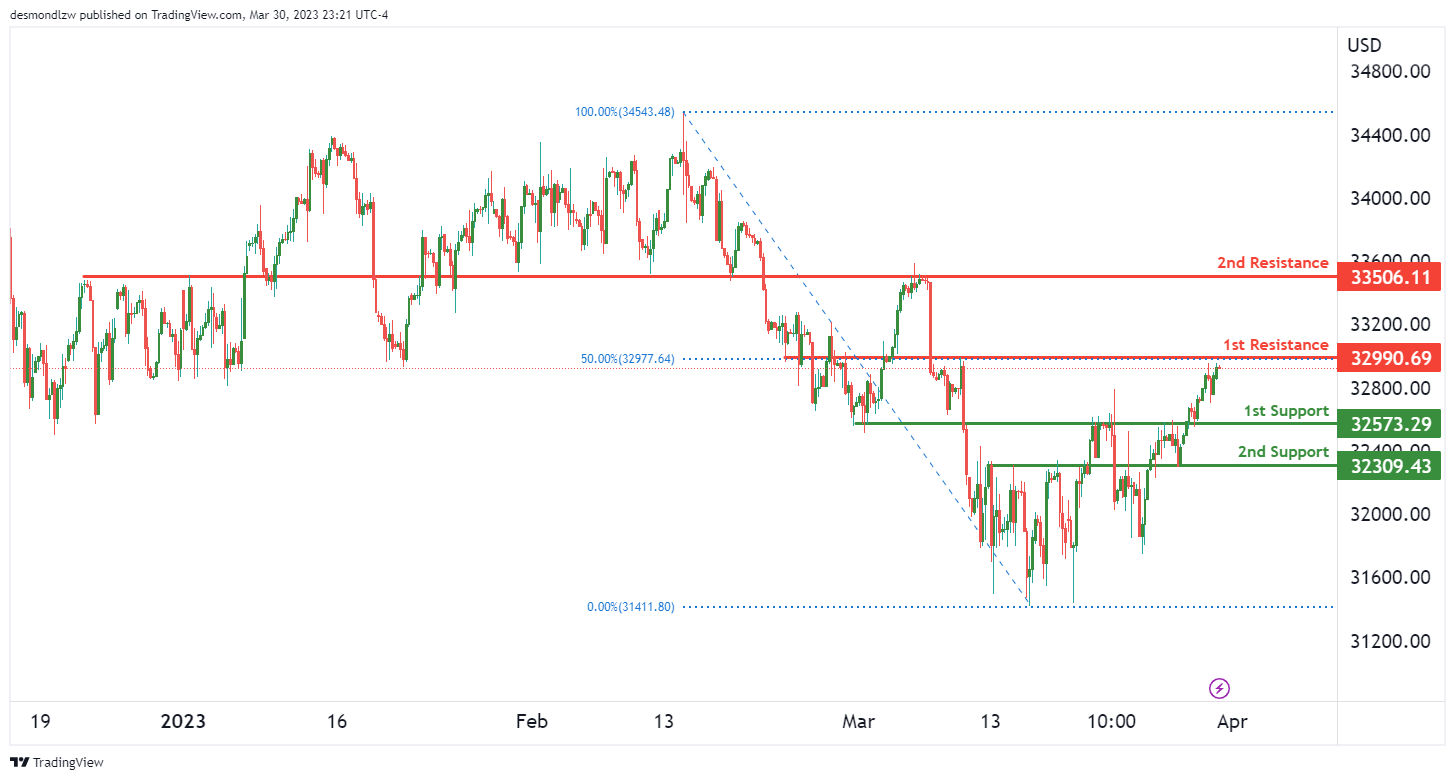
The overall momentum of the DJ30 chart is currently bearish, suggesting a potential bearish reaction off the 1st resistance level.
If price were to drop, it could find support at the 1st support level of 32573. This level is an overlap support and could potentially provide a bounce to push prices higher.
If the 1st support level were to break, the next support level to look out for is the 2nd support at 32309. This level is also an overlap support and could potentially provide another bounce.
On the other hand, if price were to rise, it could face resistance at the 1st resistance level of 32990. This level is also an overlap resistance and coincides with the 50% Fibonacci retracement.
If price were to break the 1st resistance level, the next resistance level to watch out for is the 2nd resistance at 33506. This level is also an overlap resistance.
GER30:
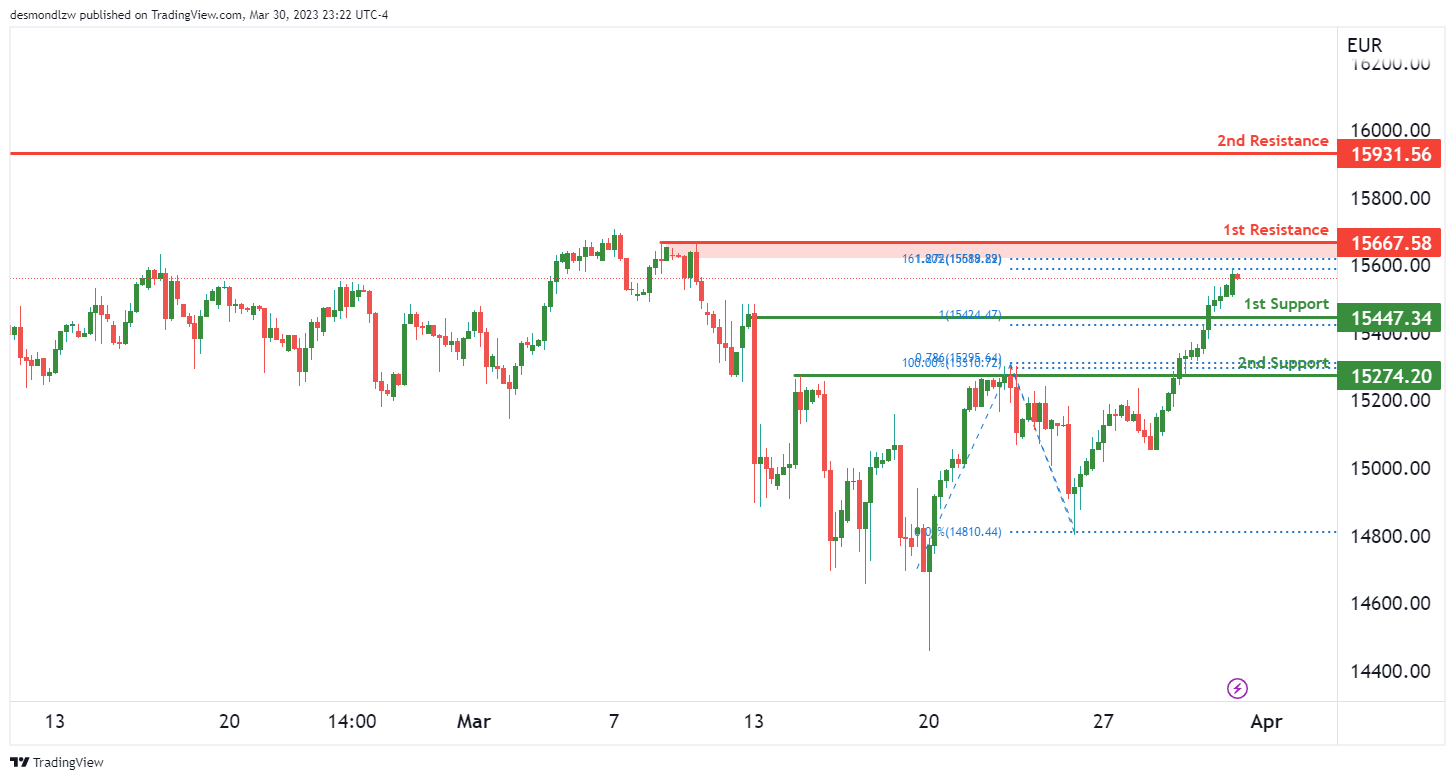
The GER30 chart seems to have a bearish momentum overall. However, in the short term, the price may potentially rise towards the 1st resistance before reversing and dropping towards the 1st support level.
The 1st support level at 15447.34 is an overlap support, indicating that it has been tested multiple times in the past and could provide strong support for the price. The 2nd support level at 15274.20 is also an overlap support and coincides with a 78.60% Fibonacci projection, making it another strong potential support level.
On the other hand, the 1st resistance level at 15667.58 is a multi-swing high resistance, indicating that it has been a significant area of resistance in the past. This resistance level also lines up with a 161.80% Fibonacci projection, making it a potential area of strong resistance. The 2nd resistance level at 15931.56 is a swing high resistance, which could also provide some resistance to the price.
BTC/USD:
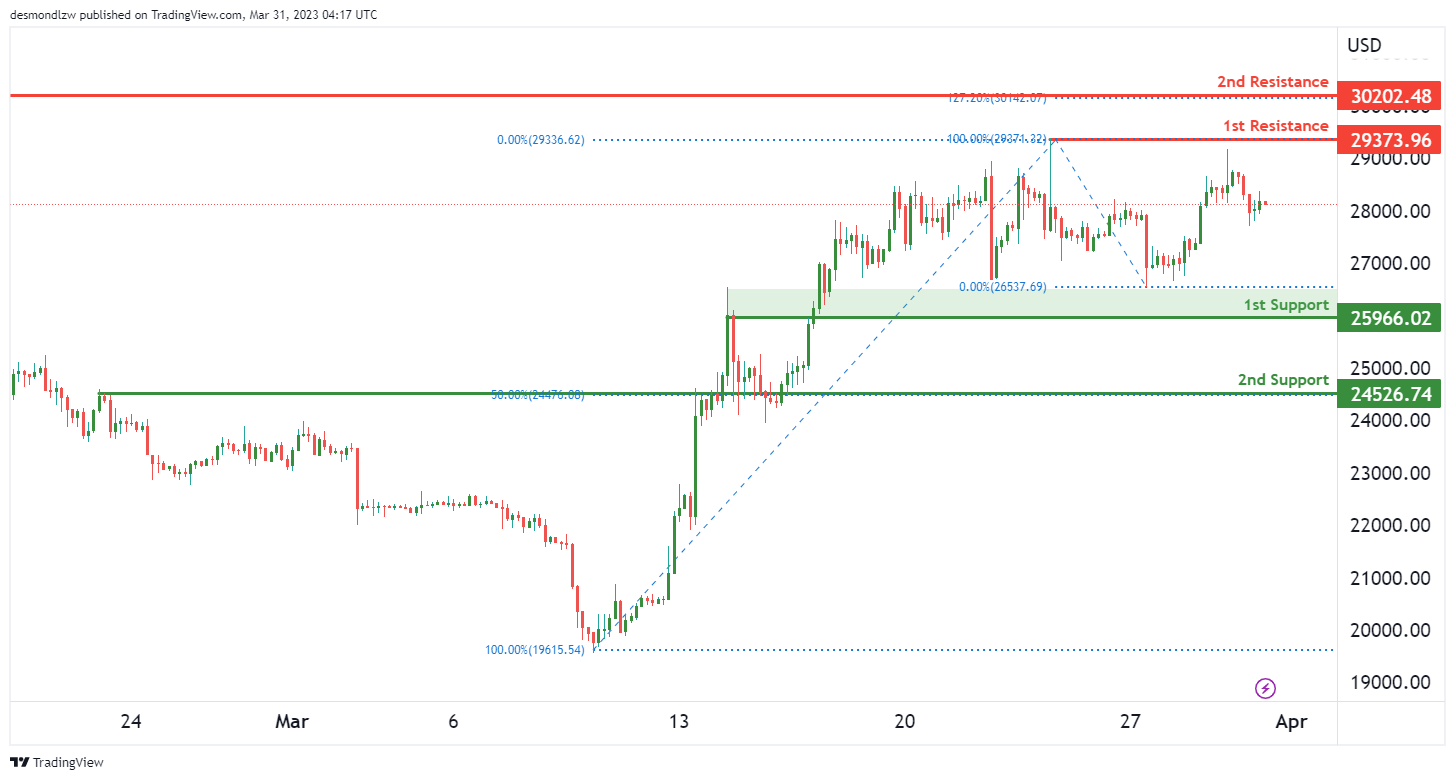
The BTC/USD chart is currently showing bearish momentum, with potential for a continuation towards the 1st support level at 25966. This support level is considered strong as it has acted as an overlap support in the past.
In the event that the price were to break below the 1st support level, the next level it could drop to is the 2nd support at 24526. This support level is also significant as it lines up with the 50% Fibonacci retracement.
On the other hand, the 1st resistance level at 29373 is considered strong as it has acted as a swing high resistance in the past. If the price were to bounce from the 1st support level, it could potentially rise towards this resistance level.
There is also a 2nd resistance level at 30202 which is a swing high resistance and could potentially offer additional resistance if the price were to rise towards it.
US500
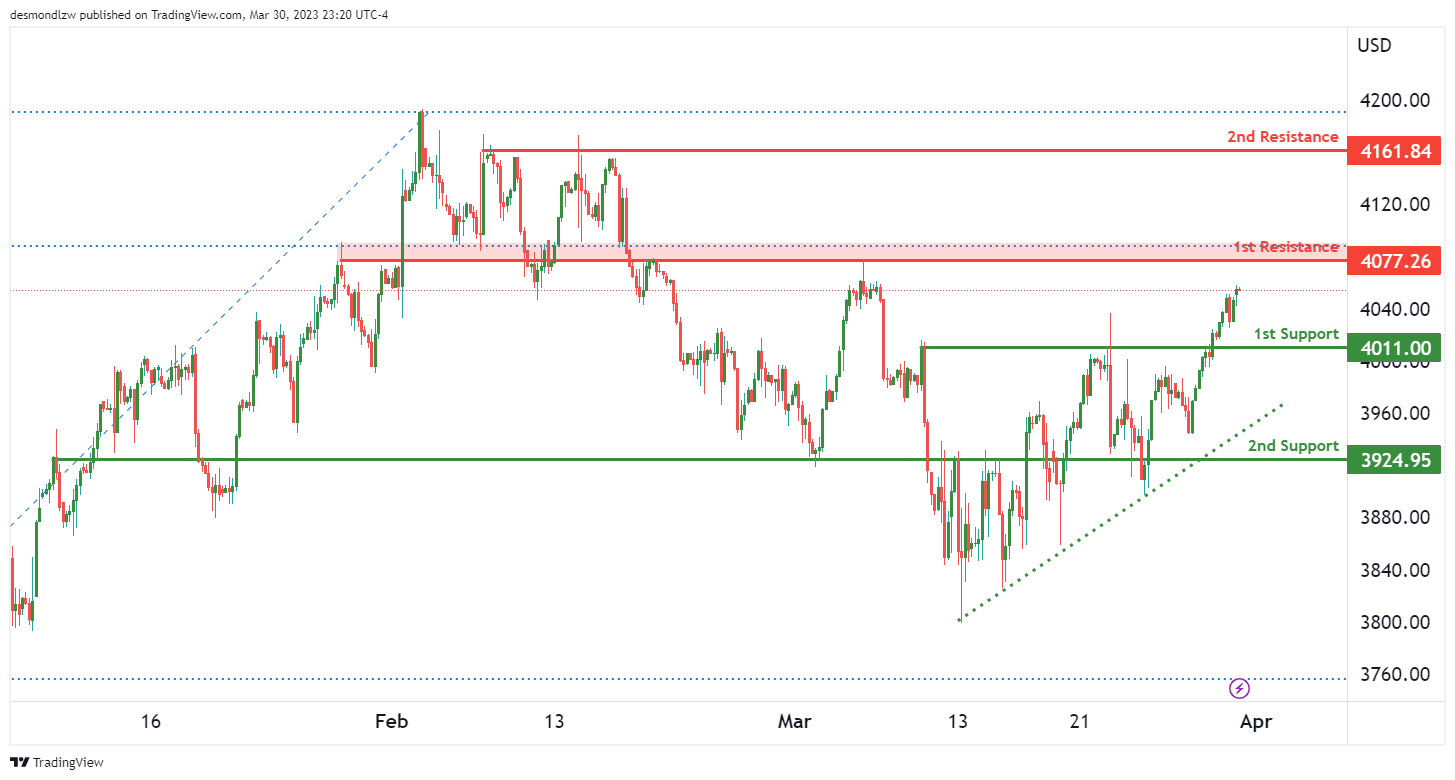
The US500 chart shows strong bullish momentum as price is currently above a major ascending trend line, indicating further bullish movement may be expected.
Price may potentially make a bullish continuation towards the 1st resistance at 4077. This level is a strong overlap resistance that has held in the past. If price manages to break through this level, it could head towards the 2nd resistance at 4161, which is a multi-swing high resistance.
On the downside, there is a 1st support at 4011, which is an overlap support. If price were to break below this level, it could head towards the 2nd support at 3924, which is also an overlap support.
ETH/USD:
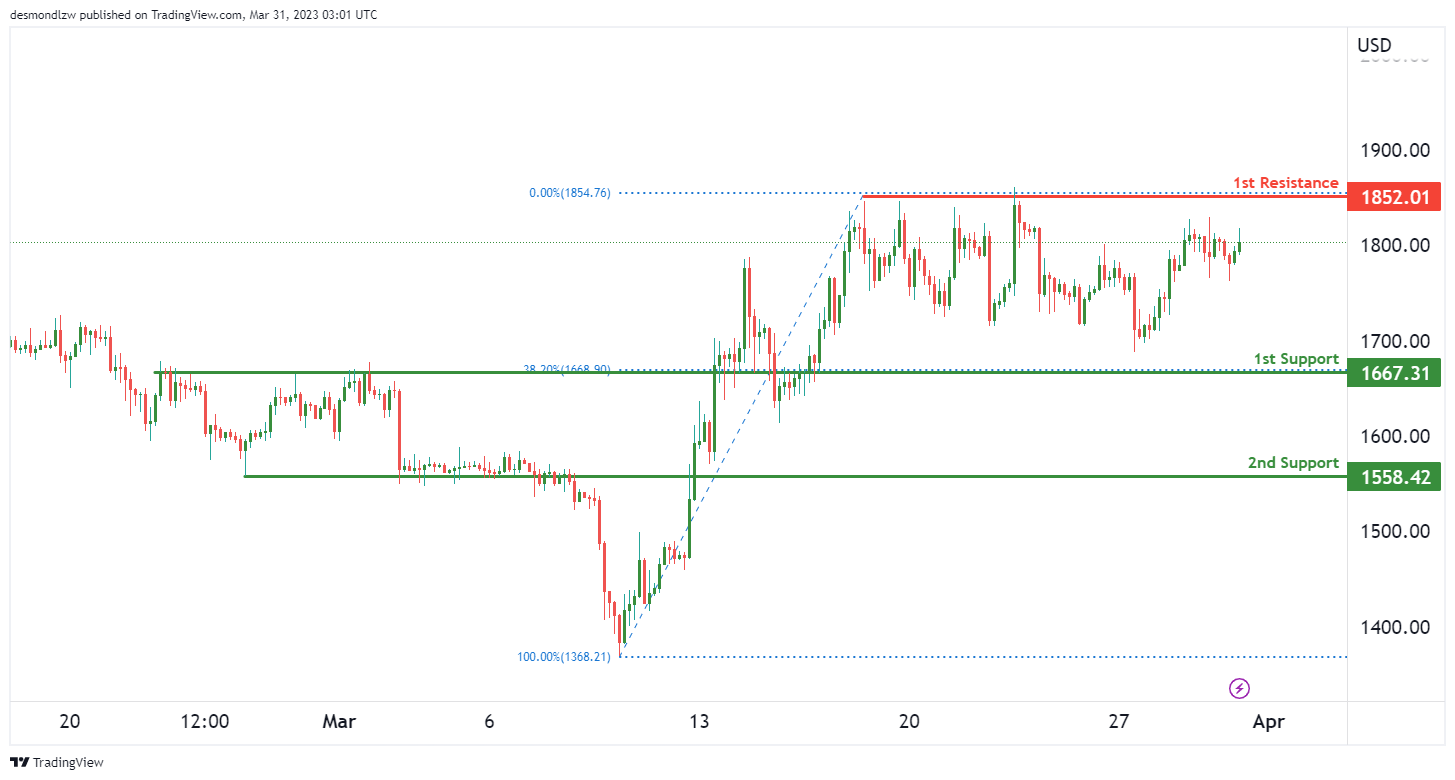
The overall momentum of the ETH/USD chart is neutral. This means that there is no clear bullish or bearish trend at the moment.
Price could potentially fluctuate between the 1st resistance and 1st support level. The 1st support level is at 1667.31, and it is an overlap support and a 38.20% Fibonacci retracement. The 2nd support level is at 1558.42, and it is an overlap support.
On the other hand, the 1st resistance level is at 1852.01, and it is a multi-swing high resistance.
WTI/USD:
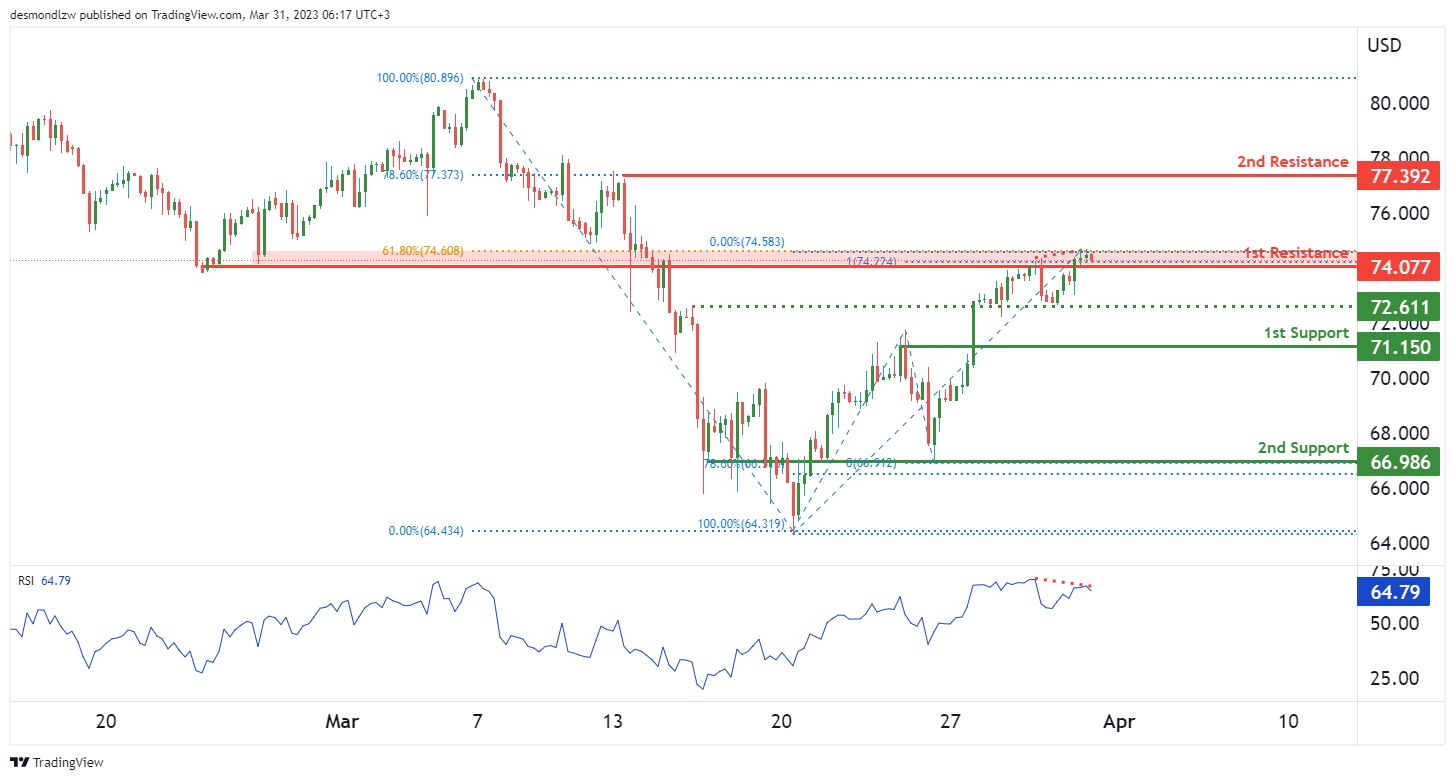
WTI crude oil prices have shown bearish momentum on the charts. Currently, the price may react bearishly towards the first resistance at 74.07, and drop towards the first support at 71.15. The first support is a significant overlap support while the second support is an overlap support and a 78.60% Fibonacci retracement. On the other hand, the first resistance is an overlap resistance with a 61.80% Fibonacci retracement. Additionally, the second resistance at 77.39 is a swing high resistance with a 78.60% Fibonacci retracement. There is also an intermediate support at 72.61, which is also an overlap support.
Furthermore, RSI is displaying bearish divergence versus the price, which suggests that there may be a reversal soon. It’s important to keep an eye on these levels and RSI for any potential breakouts or reversals in the coming days or weeks.
XAU/USD (GOLD):
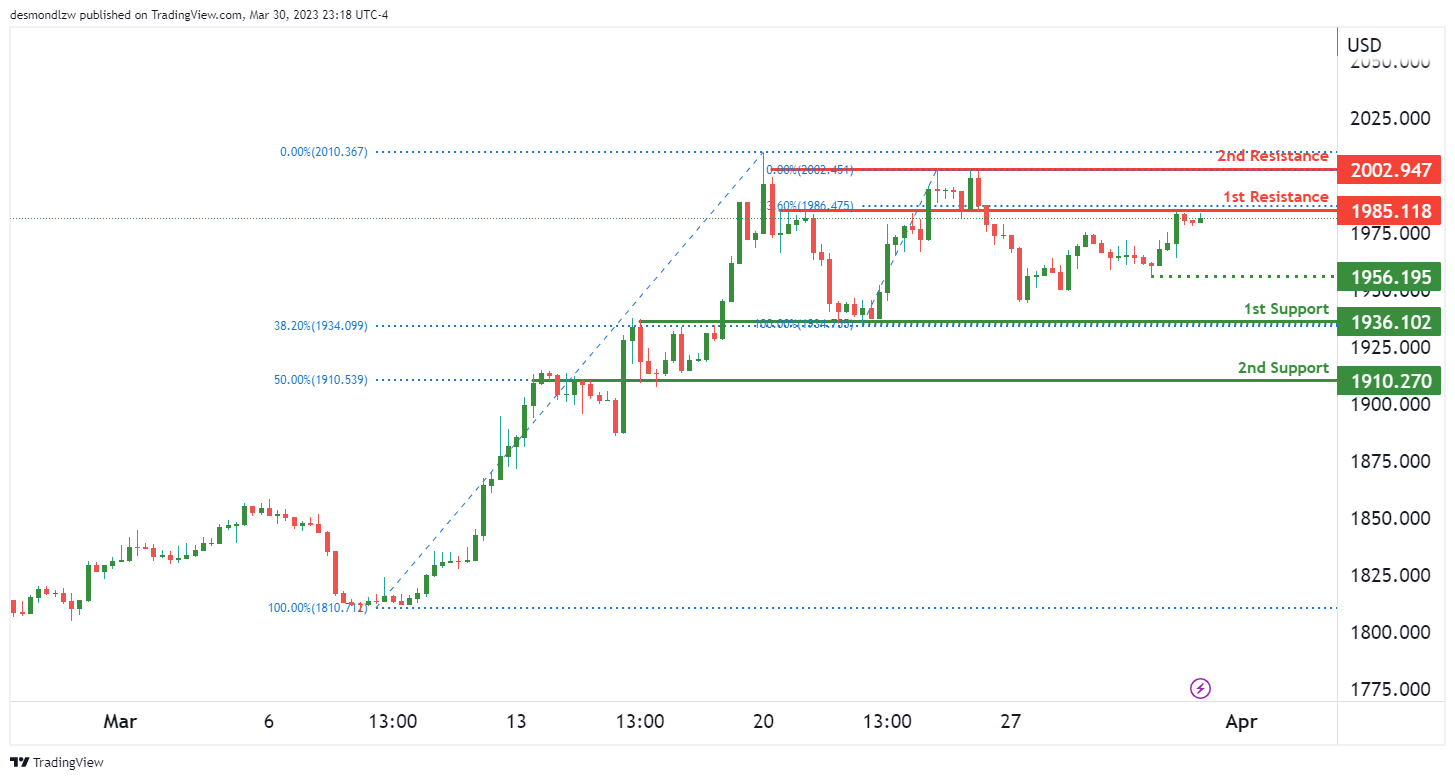
XAU/USD sees bearish momentum with potential for a bearish reaction off the 1st resistance and a drop towards the 1st support.
The 1st support level is at 1936.00, which is an overlap support and coincides with a 38.20% Fibonacci retracement. If price were to break below this level, it could drop towards the 2nd support at 1910.00, which is also an overlap support and lines up with a 50% Fibonacci retracement.
On the other hand, the 1st resistance level at 1985.00 is a strong overlap resistance and has a 23.60% Fibonacci retracement lining up with it. If price were to bounce from the 1st support, it could potentially rise towards this level. However, there is a possibility that the resistance level could trigger a bearish reaction, pushing prices back down towards the 1st support.
The 2nd resistance level at 2002.00 is a multi-swing high resistance, and if price were to break above the 1st resistance level, it could rise towards this level.
GBP/USD Daily Outlook
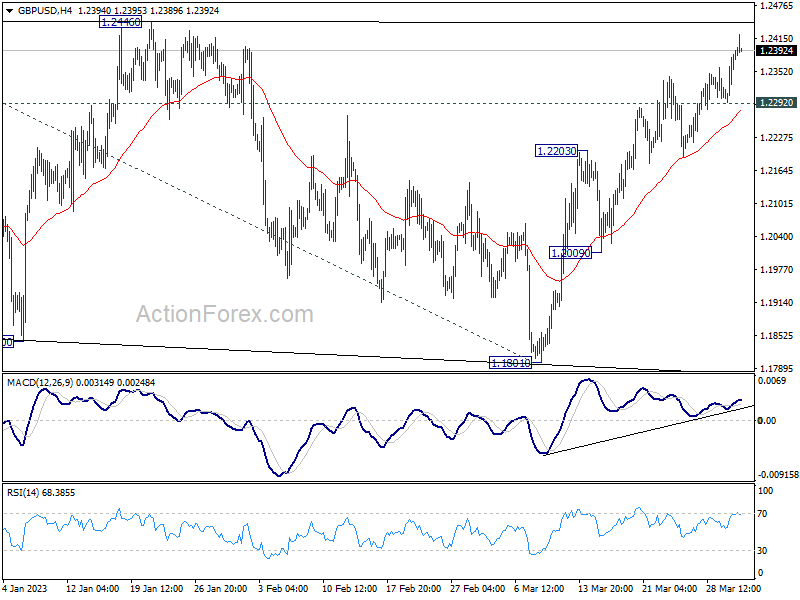
Daily Pivots: (S1) 1.2324; (P) 1.2359; (R1) 1.2423; More...
GBP/USD's rally continues today and intraday bias stays on the upside for 1.2445/6 resistance zone. Decisive break there will resume larger rally from 1.0351, and target 1.2759 fibonacci level. On the upside, below 1.2292 minor support will turn intraday bias neutral first. But further rally will remain in favor as long as 1.2203 resistance turned support holds.
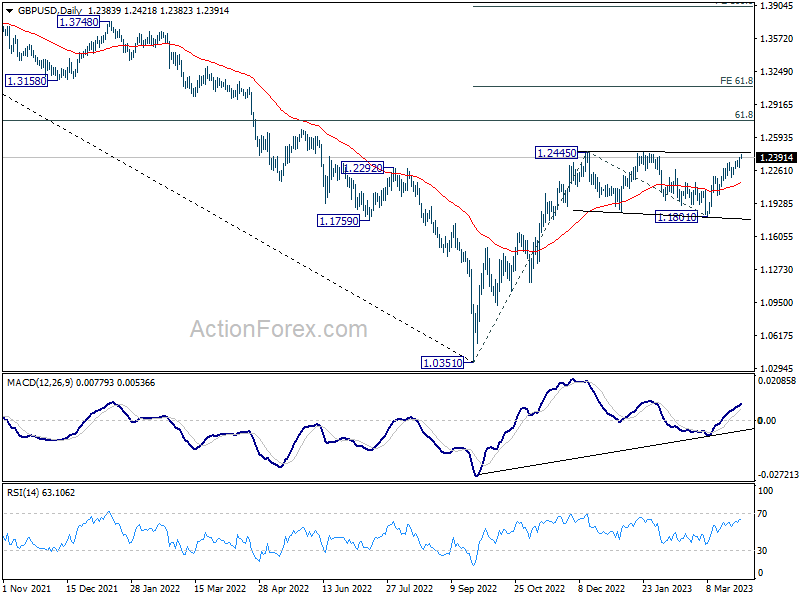
In the bigger picture, the rise from 1.0351 medium term term bottom (2022 low) is in progress for 61.8% retracement of 1.4248 (2021 high) to 1.0351 at 1.2759. Sustained break there will add to the case of long term bullish trend reversal. Further break of 61.8% projection of 1.0351 to 1.2445 from 1.1801 at 1.3095 could prompt upside acceleration to 100% projection at 1.3895. For now, this will remain the favored case as long as 1.1801 support holds, even in case of deep pull back.
China’s Robust Services Data Boosts Markets; UK Joins CPTPP, Strengthening Sterling
As March comes to an end, strong services data from China has invigorated the markets, providing additional support to Australian and New Zealand Dollar. Sterling is further bolstered by the news that the UK has secured a deal to join the 11-country Comprehensive and Progressive Agreement for Trans-Pacific Partnership (CPTPP), while Yen continues its selloff alongside a softer Euro and Swiss Franc.
For the week, Canadian Dollar stands as the strongest performer, followed by Euro and Sterling. Yen lags as the worst performer, succeeded by Dollar and Swiss Franc. Aussie and Kiwi are mixed, but upcoming Eurozone CPI and US PCE inflation data could shift the picture.
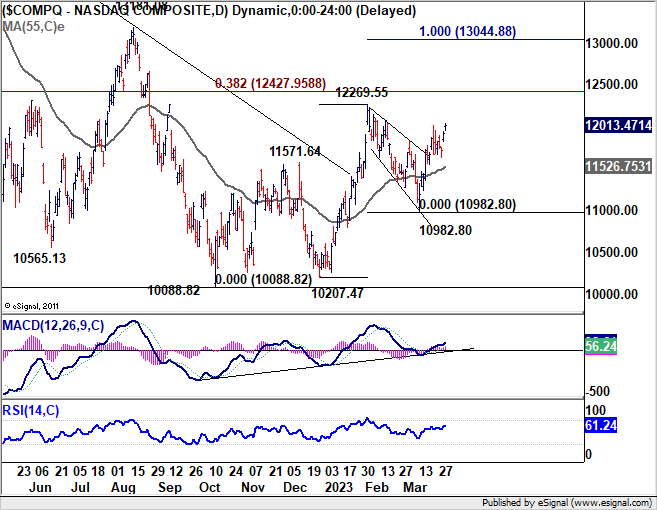
Technically, NASDAQ's break above last week's high of 12013.98 suggests a resumption of the rise from 10982.80, and a larger rebound from 10088.82 could be ready to resume too, potentially breaking through the 12269.55 resistance soon. This development, if realized, will continue to suppress any rebound attempts in Dollar and Yen. However, it remains to be seen whether Euro and Sterling or Loonie and Aussie will gain more ground.
In Asia, at the time of writing, Nikkei is up 1.10%. Hong Kong HSI is up 0.84%. China Shanghai SSE is up 0.22%. Singapore Strait Times is up 0.20%. Japan 10-year JGB yield is up 0.0035 at 0.329. Overnight, DOW rose 0.43%. S&P 500 rose 0.57%. NASDAQ rose 0.73%. 10-year yield dropped -0.0015 to 3.551.
Fed Collins: Tightening lending standards may partially offset need for more rate hikes
Fed's ongoing battle against inflation was underscored by Boston Fed President Susan Collins, who expressed concerns over the persistently high inflation rates. She stated yesterday, "Inflation remains too high, and recent indicators reinforce my view that there is more work to do, to bring inflation down to the 2% target associated with price stability."
Collins reiterated her belief that Fed can successfully lower inflation without causing a recession, but acknowledged that a rise in unemployment would be necessary to achieve this goal. As Fed prepares for its May meeting, Collins admitted it is too early to predict the appropriate course of action.
She also noted that recent developments may lead banks to adopt a more conservative outlook and tighten lending standards, thus helping to slow the economy and reduce inflationary pressures. "These developments may partially offset the need for additional rate increases," she added in her prepared remarks.
Fed Kashkari: More work to do to bring services back into balance
Minneapolis Fed President Neel Kashkari expressed concerns over the current state of the service economy and its potential impact on inflation. "The one area that is particularly concerning right now is that the services economy, outside of housing, has not shown any sign of slowing down," he said yesterday.
Kashkari emphasized the need for further action, stating, "Wage growth is still growing faster than what is consistent with our 2% inflation target; that tells me we still have more work to do to bring the services side of the economy back into balance... we know we have to get inflation down, and we will."
He also addressed the ongoing banking stresses, drawing a comparison to the 2008 financial crisis. While he doesn't expect a repeat of that situation, he cautioned that banking panics tend to take longer to resolve than expected: "Every time in 2008, we thought we were through it, there was another shoe yet to drop. So I am prepared to think this could take a little longer than we expect until we fully get behind it."
Although the US banking system is sound and most banks are prepared for higher rates, Kashkari raised concerns about the potential for a sustained credit crunch, which could slow down the economy. "What's unclear right now is how much the banking stresses of the past few weeks are leading to a sustained credit crunch," he said.
Fed Barkin: I'm comfortable with the trajectory we're on now
Richmond Fed President Thomas Barkin expressed his comfort with Fed's current approach to interest rate hikes, stating, "I'm comfortable with the trajectory we're on now, meeting by meeting, whether you need a 25 basis point hike or not." He acknowledged the challenges of finding the right balance, but emphasized that even if the decision isn't perfect, it won't be too far off.
Barkin also addressed the uncertainties surrounding the ongoing banking situation and its potential impact on consumer confidence, business investment, and the availability of credit. "There is a lot of uncertainty about what if anything this bank situation does to consumer confidence, business confidence, business investment, consumer spending, availability of credit," he said, adding that it's difficult to predict the future effects on demand and inflation.
Despite the uncertainties, Barkin highlighted the wide range of possible outcomes and Fed's ability to respond accordingly. "If inflation persists, we can react by raising rates further," he said. "If I am wrong about the pricing dynamics at play, or about credit conditions, then we can respond appropriately."
Japan reported strong industrial production and retail sales growth
Japan reported strong industrial production growth of 4.5% mom in February, surpassing expectations of 2.8% mom growth. The seasonally adjusted production index for the manufacturing and mining sectors reached 94.8, with the industry ministry predicting a 2.3% mom increase in March and a 4.4% mom advance in April.
Retail sales also exceeded expectations, rising 6.6% yoy compared to the anticipated 5.9% yoy. However, the unemployment rate increased from 2.4% to 2.6%, higher than the expected 2.4%.
Inflation in Tokyo experienced a slight decline, with the March CPI dropping from 3.4% yoy to 3.3% yoy, still above the expected 2.7% yoy. The core CPI (excluding fresh food) eased from 3.3% yoy to 3.2% yoy, meeting expectations. Meanwhile, the core-core CPI (excluding fresh food and energy) rose from 3.2% yoy to 3.4% yoy, surpassing the anticipated 3.3% yoy.
Elsewhere
In March, China's NBS PMI Manufacturing dipped from 52.6 to 51.9, aligning with expectations. Despite the slight decline, the data still indicated growth for the third consecutive month and represented the second-highest level in nearly two years. Conversely, PMI Non-Manufacturing experienced a significant jump from 56.3 to 58.2, surpassing the expected 54.3. This marked the highest level recorded since May 2011.
Looking ahead, Eurozone CPI flash is the main focus in European session while unemployment rate will also be released. . Germany will release import price, retail sales and unemployment. Swiss will release retail sales. UK will publish Q4 GDP final.
Later in the day, US personal income and spending, with PCE inflation will be the highlight. Chicago PMI will also be released.
GBP/USD Daily Outlook
Daily Pivots: (S1) 1.2324; (P) 1.2359; (R1) 1.2423; More...
GBP/USD's rally continues today and intraday bias stays on the upside for 1.2445/6 resistance zone. Decisive break there will resume larger rally from 1.0351, and target 1.2759 fibonacci level. On the upside, below 1.2292 minor support will turn intraday bias neutral first. But further rally will remain in favor as long as 1.2203 resistance turned support holds.
In the bigger picture, the rise from 1.0351 medium term term bottom (2022 low) is in progress for 61.8% retracement of 1.4248 (2021 high) to 1.0351 at 1.2759. Sustained break there will add to the case of long term bullish trend reversal. Further break of 61.8% projection of 1.0351 to 1.2445 from 1.1801 at 1.3095 could prompt upside acceleration to 100% projection at 1.3895. For now, this will remain the favored case as long as 1.1801 support holds, even in case of deep pull back.
Economic Indicators Update
| GMT | Ccy | Events | Actual | Forecast | Previous | Revised |
|---|---|---|---|---|---|---|
| 23:30 | JPY | Tokyo CPI Core Y/Y Mar | 3.20% | 3.20% | 3.30% | |
| 23:30 | JPY | Unemployment Rate Feb | 2.60% | 2.40% | 2.40% | |
| 23:50 | JPY | Industrial Production M/M Feb P | 4.50% | 2.80% | -5.30% | |
| 23:50 | JPY | Retail Trade Y/Y Feb | 6.60% | 5.90% | 6.30% | |
| 00:30 | AUD | Private Sector Credit M/M Feb | 0.30% | 0.30% | 0.40% | |
| 01:00 | CNY | NBS Manufacturing PMI Mar | 51.9 | 51.9 | 52.6 | |
| 01:00 | CNY | Non-Manufacturing PMI Mar | 58.2 | 54.3 | 56.3 | |
| 05:00 | JPY | Housing Starts Y/Y Feb | -0.3% | -0.50% | 6.60% | |
| 06:00 | GBP | GDP Q/Q Q4 F | 0.00% | 0.00% | ||
| 06:00 | GBP | Current Account (GBP) Q4 | -17.5B | -19.4B | ||
| 06:00 | EUR | Germany Import Price Index M/M Feb | -0.80% | -1.20% | ||
| 06:00 | EUR | Germany Retail Sales M/M Feb | 0.50% | -0.30% | ||
| 06:30 | CHF | Real Retail Sales Y/Y Feb | -1.00% | -2.20% | ||
| 06:45 | EUR | France Consumer Spending M/M Feb | 0.20% | 1.50% | ||
| 07:55 | EUR | Germany Unemployment Change Feb | 2K | 2K | ||
| 07:55 | EUR | Germany Unemployment Rate Feb | 5.50% | |||
| 09:00 | EUR | Eurozone Unemployment Rate Feb | 6.70% | 6.70% | ||
| 09:00 | EUR | Eurozone CPI Y/Y Mar P | 7.20% | 8.50% | ||
| 09:00 | EUR | Eurozone Core CPI Y/Y Mar P | 5.70% | 5.60% | ||
| 12:30 | CAD | GDP M/M Jan | 0.00% | -0.10% | ||
| 12:30 | USD | Personal Income M/M Feb | 0.30% | 0.60% | ||
| 12:30 | USD | Personal Spending Feb | 0.30% | 1.80% | ||
| 12:30 | USD | PCE Price Index M/M Feb | 0.20% | 0.60% | ||
| 12:30 | USD | PCE Price Index Y/Y Feb | 5.30% | 5.40% | ||
| 12:30 | USD | Core PCE Price Index M/M Feb | 0.40% | 0.60% | ||
| 12:30 | USD | Core PCE Price Index Y/Y Feb | 4.40% | 4.70% | ||
| 13:45 | USD | Chicago PMI Mar | 43.6 | 43.6 | ||
| 14:00 | USD | Michigan Consumer Sentiment Mar F | 63.4 | 63.4 |
AUD/USD and NZD/USD Could Gain Bullish Momentum
AUD/USD started a fresh increase above the 0.6700 resistance zone. NZD/USD is rising and might aim a move above the 0.6300 resistance.
Important Takeaways for AUD/USD and NZD/USD
- The Aussie Dollar started a fresh increase above the 0.6700 resistance against the US Dollar.
- There was a break above a major bearish trend line with resistance near 0.6692 on the hourly chart of AUD/USD.
- NZD/USD started a decent increase above the 0.6250 resistance zone.
- There was a clear move above a key bearish trend line with resistance near 0.6265 on the hourly chart of NZD/USD.
AUD/USD Technical Analysis
The Aussie Dollar found support near 0.6620 and started a decent increase against the US Dollar. The AUD/USD pair gained pace for a move above the 0.6650 resistance.
The pair even moved above the 0.6685 level and the 50 hourly simple moving average. There was a break above a major bearish trend line with resistance near 0.6692 on the hourly chart of AUD/USD. The bulls were able to pump the pair above 0.6720 and the 50 hourly simple moving average.
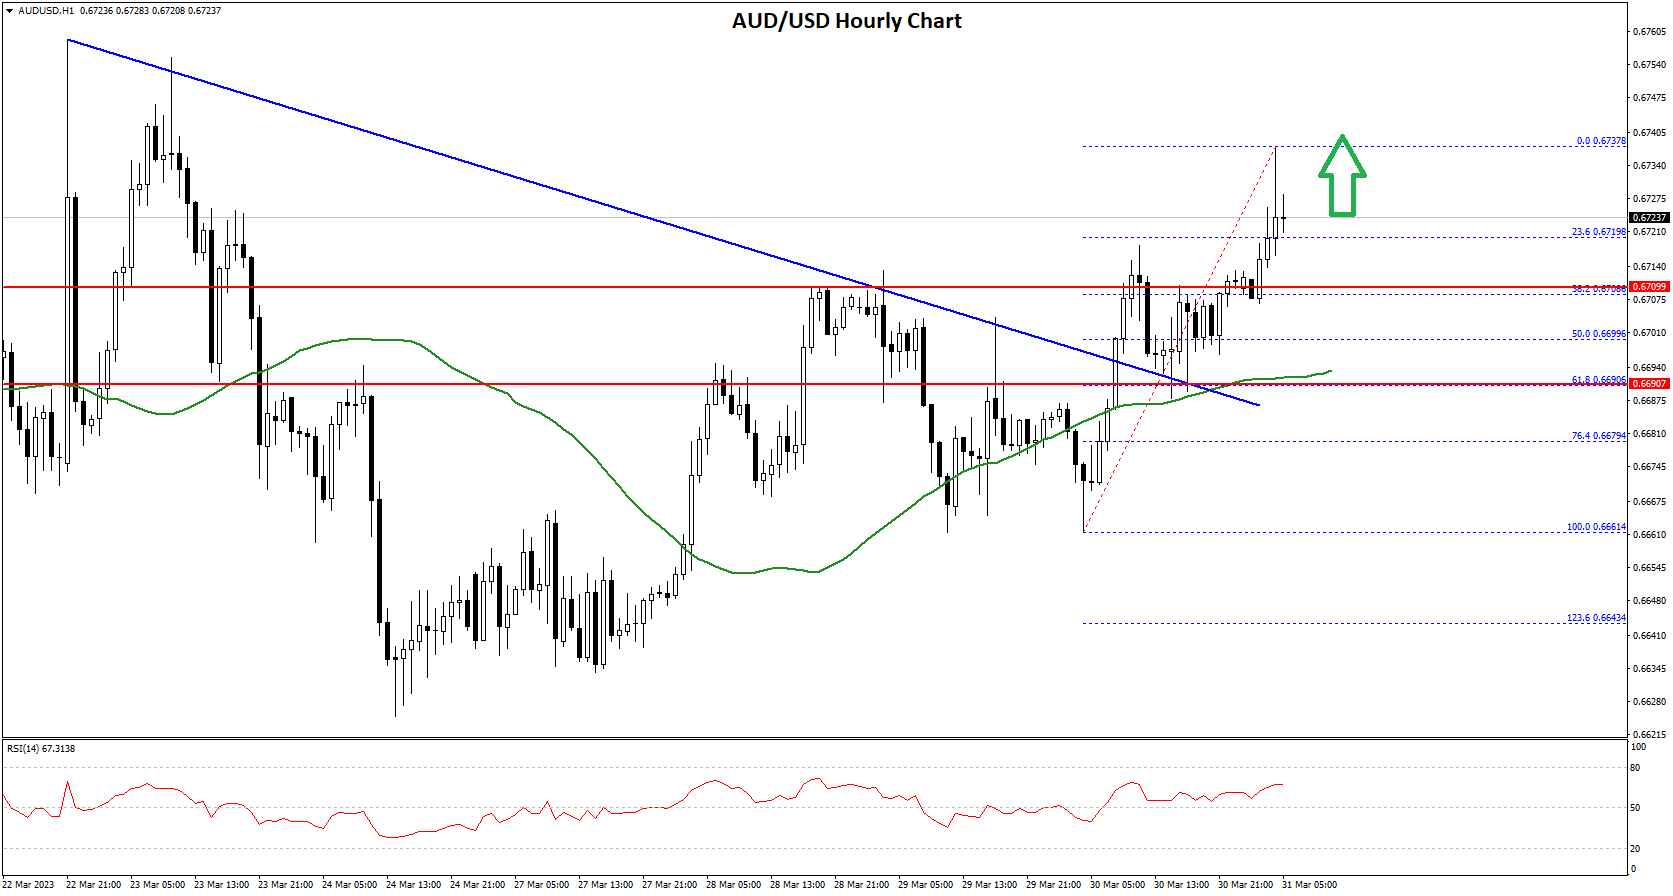
A high is formed near 0.6737 on FXOpen and the pair is now consolidating gains. On the downside, an initial support is near the 0.6720 level. It is near the 23.6% Fib retracement level of the recent increase from the 0.6661 swing low to 0.6737 high.
The next support could be the 0.6700 level or the 50 hourly simple moving average or the 50% Fib retracement level of the recent increase from the 0.6661 swing low to 0.6737 high.
If there is a downside break below the 0.6700 support, the pair could extend its decline towards the 0.6650 level. On the upside, the AUD/USD pair is facing resistance near the 0.6740 level. The next major resistance is near the 0.6780 level.
A close above the 0.6780 level could start another steady increase in the near term. The next major resistance could be 0.6850.
NZD/USD Technical Analysis
The New Zealand Dollar started a decent increase from the 0.6200 support zone against the US Dollar. The NZD/USD pair climbed above the 0.6220 and 0.6240 resistance levels.
The bulls pushed the pair above the 0.6250 level and the 50 hourly simple moving average. There was a clear move above a key bearish trend line with resistance near 0.6265 on the hourly chart of NZD/USD.
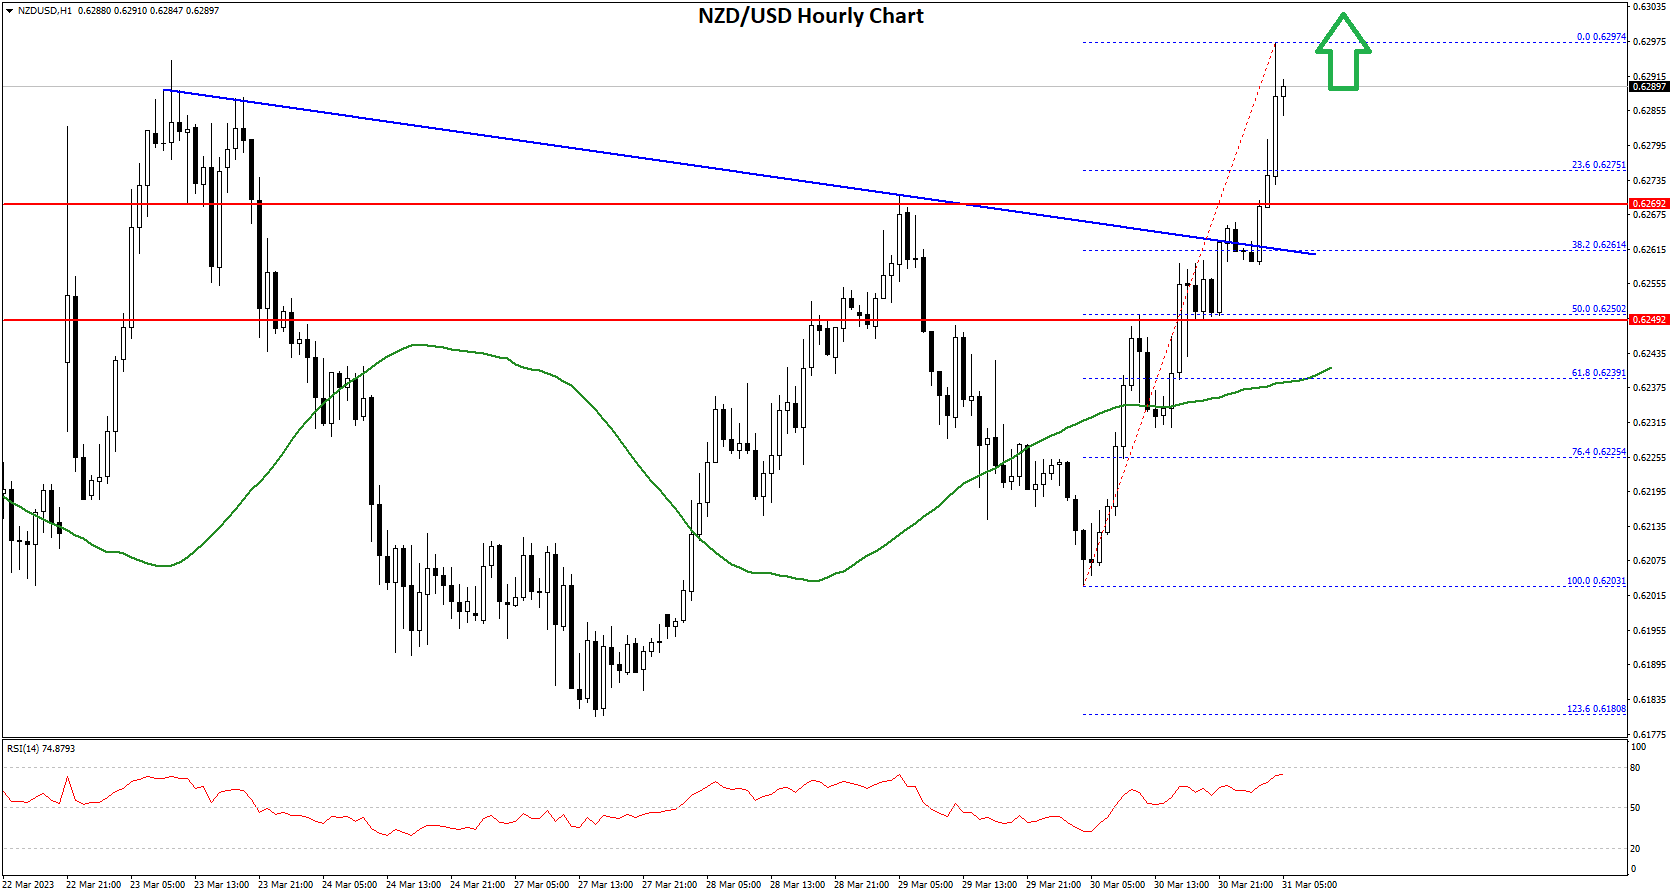
The pair even traded close to the 0.6300 level. A high is formed near 0.6297 and the pair is now consolidating gains. An immediate support is near the 0.6275 level. It is near the 23.6% Fib retracement level of the recent increase from the 0.6203 swing low to 0.6297 high.
The next support could be the 0.6260 zone. If there is a downside break below the 0.6260 support, the pair could extend its decline.
In the stated case, the pair may perhaps decline towards the 0.6240 support level or the 61.8% Fib retracement level of the recent increase from the 0.6203 swing low to 0.6297 high. Any more losses could set the pace for a test of the 0.6200 level.
On the upside, an initial resistance is near the 0.6295 level. The next major resistance is near the 0.6300 level. A clear move above the 0.6300 level might even push the pair towards the 0.6340 level. Any more gains might open the doors for a move towards the 0.6400 resistance zone in the coming days.
Japan reported strong industrial production and retail sales growth
Japan reported strong industrial production growth of 4.5% mom in February, surpassing expectations of 2.8% mom growth. The seasonally adjusted production index for the manufacturing and mining sectors reached 94.8, with the industry ministry predicting a 2.3% mom increase in March and a 4.4% mom advance in April.
Retail sales also exceeded expectations, rising 6.6% yoy compared to the anticipated 5.9% yoy. However, the unemployment rate increased from 2.4% to 2.6%, higher than the expected 2.4%.
Inflation in Tokyo experienced a slight decline, with the March CPI dropping from 3.4% yoy to 3.3% yoy, still above the expected 2.7% yoy. The core CPI (excluding fresh food) eased from 3.3% yoy to 3.2% yoy, meeting expectations. Meanwhile, the core-core CPI (excluding fresh food and energy) rose from 3.2% yoy to 3.4% yoy, surpassing the anticipated 3.3% yoy.
Fed Barkin: I’m comfortable with the trajectory we’re on now
Richmond Fed President Thomas Barkin expressed his comfort with Fed's current approach to interest rate hikes, stating, "I'm comfortable with the trajectory we're on now, meeting by meeting, whether you need a 25 basis point hike or not." He acknowledged the challenges of finding the right balance, but emphasized that even if the decision isn't perfect, it won't be too far off.
Barkin also addressed the uncertainties surrounding the ongoing banking situation and its potential impact on consumer confidence, business investment, and the availability of credit. "There is a lot of uncertainty about what if anything this bank situation does to consumer confidence, business confidence, business investment, consumer spending, availability of credit," he said, adding that it's difficult to predict the future effects on demand and inflation.
Despite the uncertainties, Barkin highlighted the wide range of possible outcomes and Fed's ability to respond accordingly. "If inflation persists, we can react by raising rates further," he said. "If I am wrong about the pricing dynamics at play, or about credit conditions, then we can respond appropriately."
Fed Kashkari: More work to do to bring services back into balance
Minneapolis Fed President Neel Kashkari expressed concerns over the current state of the service economy and its potential impact on inflation. "The one area that is particularly concerning right now is that the services economy, outside of housing, has not shown any sign of slowing down," he said yesterday.
Kashkari emphasized the need for further action, stating, "Wage growth is still growing faster than what is consistent with our 2% inflation target; that tells me we still have more work to do to bring the services side of the economy back into balance... we know we have to get inflation down, and we will."
He also addressed the ongoing banking stresses, drawing a comparison to the 2008 financial crisis. While he doesn't expect a repeat of that situation, he cautioned that banking panics tend to take longer to resolve than expected: "Every time in 2008, we thought we were through it, there was another shoe yet to drop. So I am prepared to think this could take a little longer than we expect until we fully get behind it."
Although the US banking system is sound and most banks are prepared for higher rates, Kashkari raised concerns about the potential for a sustained credit crunch, which could slow down the economy. "What's unclear right now is how much the banking stresses of the past few weeks are leading to a sustained credit crunch," he said.