Sample Category Title
Bank of England Would Love Some Positive News From Inflation Front This Week
With the preliminary fourth-quarter GDP print on Friday saving the UK from declaring two consecutive quarters of negative growth, the focus turns to Tuesday's inflation numbers. The calendar is filled with economic data releases including labour market statistics on Tuesday, but the market seems to care primarily about the CPI prints. Could we finally see the much-awaited dip in inflationary pressures or will the Bank of England remain under pressure to adopt a more aggressive strategy?
Sticky inflation, many reasons
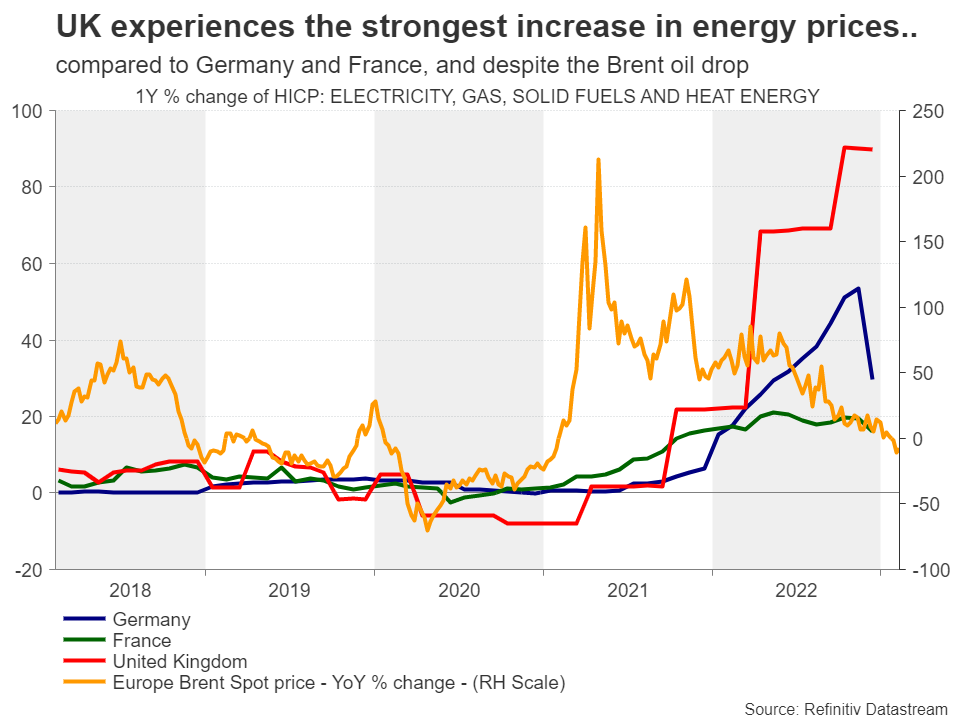
The repeatedly positive news on the employment front has been set aside as the focus rests on the elevated inflation rates. Particularly in the case of the UK, the CPI year-on-year change remains in double digits for the past four months, despite the decent deceleration seen elsewhere. Interestingly, the electricity, gas and other fuels subcomponent of the CPI continues to fuel the elevated UK inflation prints amidst a continued drop in oil and gas prices in Europe. One of the main reasons for this condition could potentially be the lower energy support programmes offered by the UK government compared to the other two heavyweight countries in Europe, Germany and France. Critically, the UK government’s Energy Price Guarantee is changing from April 2023 and another rise in energy costs for households is on the cards, which could potentially mean that the much-wanted dip in CPI might be pushed even further out.
Pressure on the BoE to increase?
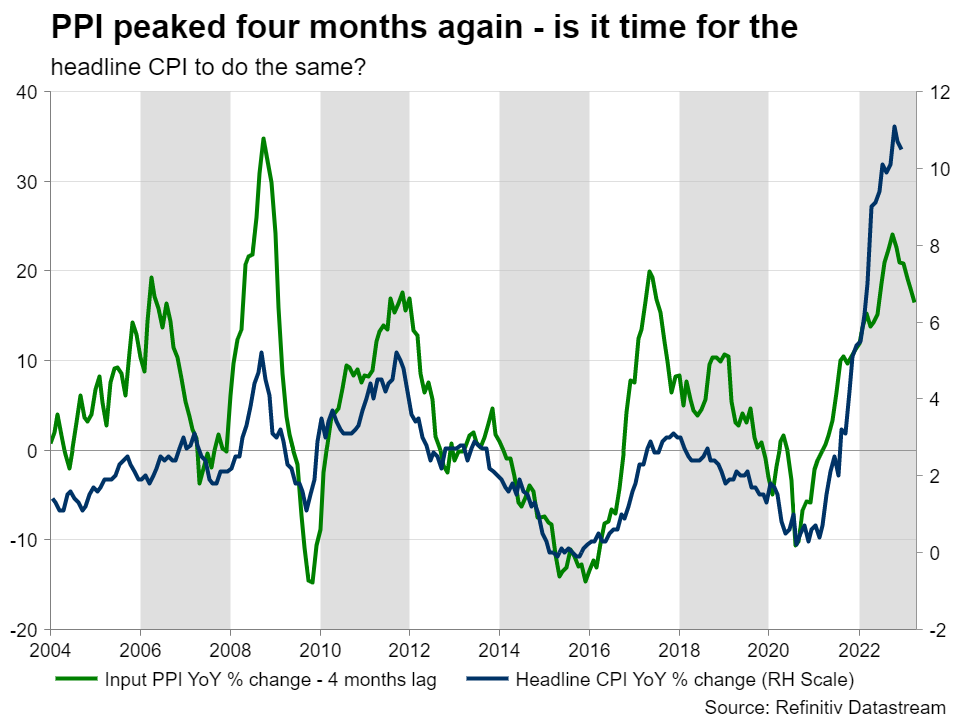
Amidst these developments, the December unemployment rate is seen stable at 3.7% with a monthly employment change of 40k. Additionally, the January CPI print is forecast by the Reuters poll to show a 10.2% year-on-year increase, just a tad lower than the 10.5% change in December. Similarly, the core component of the CPI is seen increasing by 6.2% year-on-year, down from 6.3% in the previous month. These figures are not going to be a pleasant reading for the BoE. Governor Bailey appeared confident at the recent press conference that inflation will continue to fall this year, more rapidly in the second half of 2023, but current evidence is not optimistic. Questions have been raised in government corridors about the BoE strategy going forward, particularly compared to the ECB. The latter is seen by the market hiking more than 100bps by September 2023 while the BoE is expected to make just two more rate hikes, despite the divergence seen in inflation rates lately. The BoE appears to fret about the growth outlook, and thus potentially overlooking its mandate on maintaining monetary stability. Maybe the PPI data, published also on Tuesday, could offer some solace to the bruised BoE. The market tends to ignore this release. However, this seems to have changed lately as the PPI is traditionally seen leading the headline CPI by 4-7 months. Assuming this trend is confirmed again, inflation could potentially surprise on the downside on Tuesday, despite market expectations to the opposite.
Retail sales supported by strong earnings?
Despite the BRC retail sales indicator easing last week, the market is looking for a small improvement at the January retail sales. The gap in the year-on-year figures in the two datasets is expected to be gradually reduced despite the GfK consumer confidence index remaining at record low levels. And this could happen on the back of the increasing average earnings figures. At a year-on-year increase of 6.5%, the average earnings excluding bonuses seem to offer some support to the household facing the strongest inflationary pressures for decades.
Sterling fans look for evidence before another rally
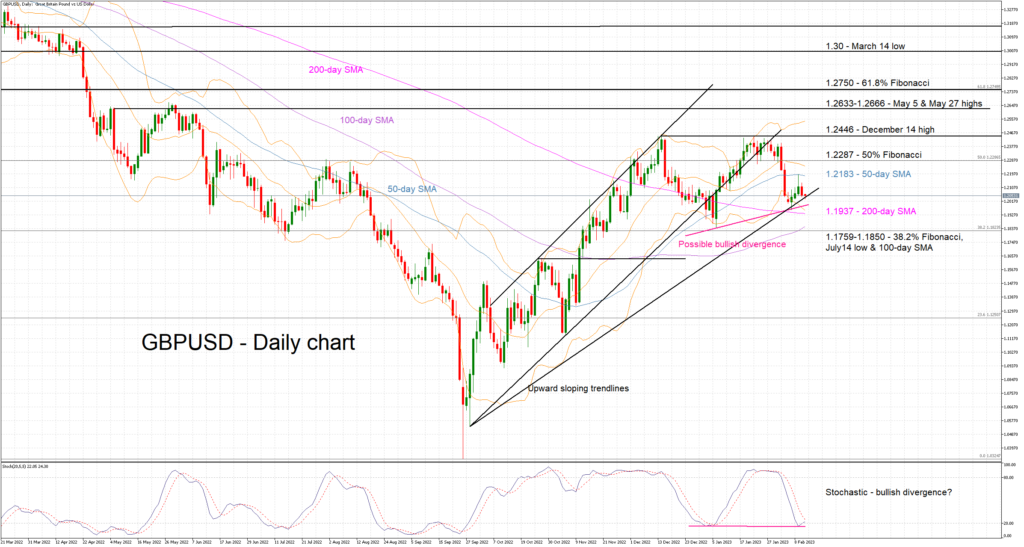
Sterling lovers are trying to find sufficient evidence to stage another rally, potentially continuing on the move recorded since October 2022, despite the recent news flow not supporting their cause. However, the technical picture is showing some early bullish signs. In particular, the stochastic oscillator appears to be suggesting that a bullish divergence is currently developing, as the higher low in the sterling/dollar pair has been met with a lower low in the stochastic. Should this result in a sterling rally, the bulls would love a move up to the 1.2446 area, which twice in the past 60 days has acted as a significant resistance point.
Yen Slides as Ueda Set to Lead BoJ
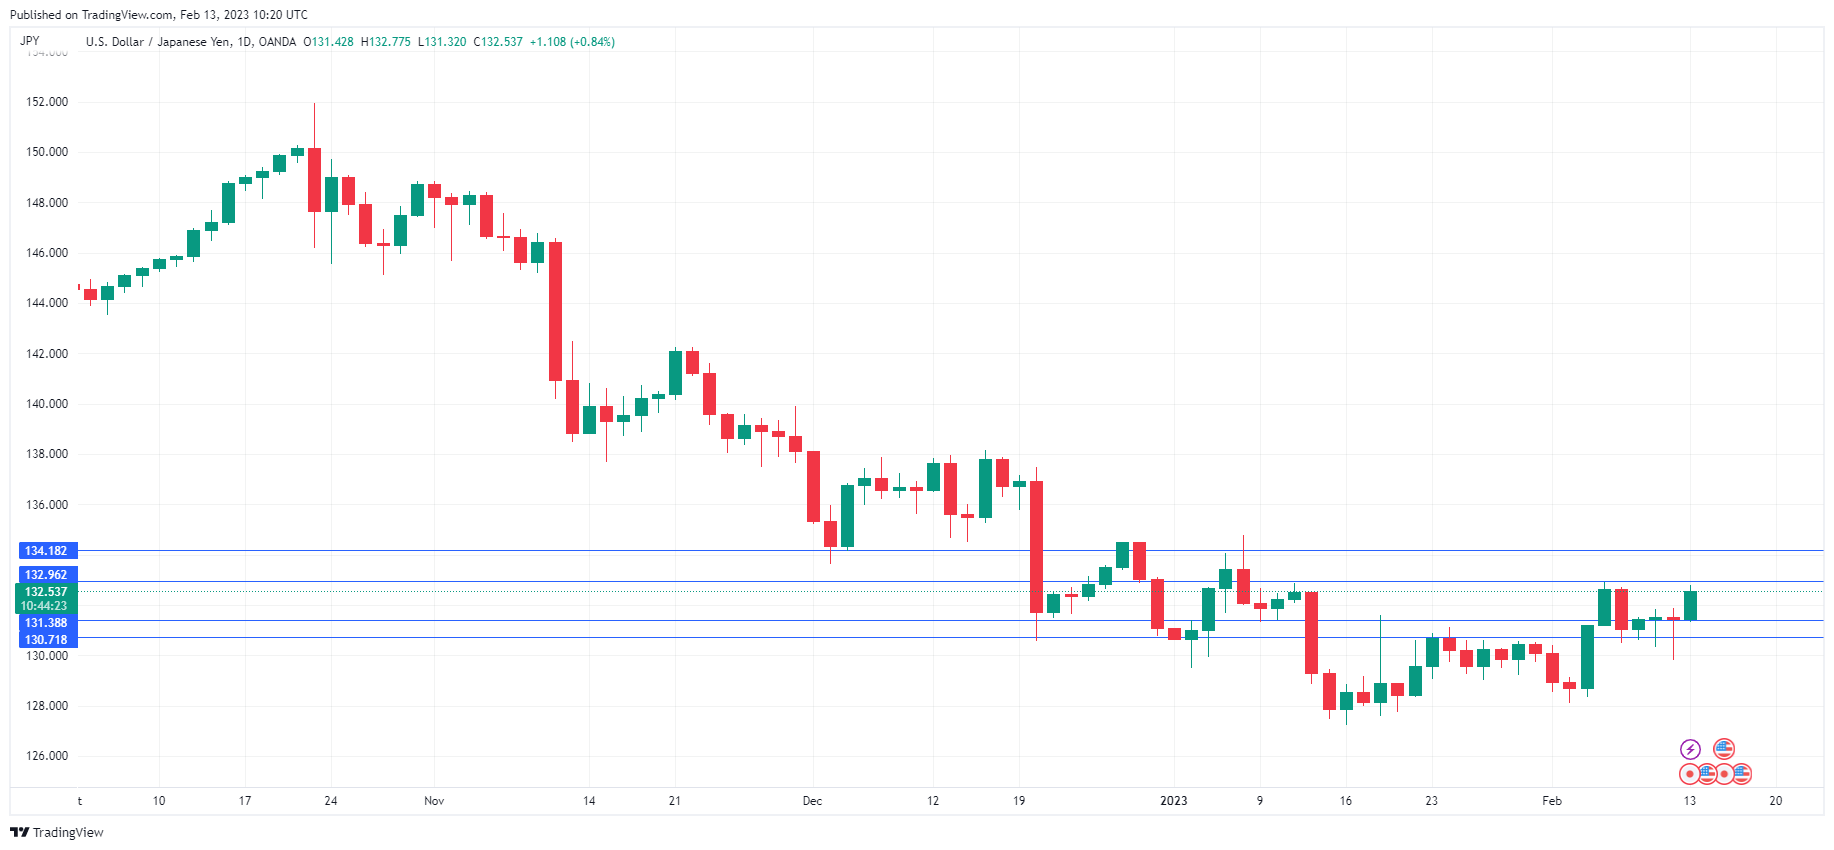
The Japanese yen has started the week with sharp losses. In the European session, USD/JPY is trading at 132.54, up 0.86%.
Japan’s GDP expected to rebound
There are high hopes for the Japanese economy, which is expected to climb by 2% in the fourth quarter, following a 0.8% decline in Q3. Japan reopened to tourists in October, which fueled a recovery in the services sector and this will likely boost GDP. Even so, the economy has headwinds to deal with such as higher inflation and a weaker global economy, which will likely weigh on growth in 2023 Q1.
Ueda to take over at BoJ
There has been a guessing game over the successor to Haruhiko Kuroda as Governor of the Bank of Japan and press reports about a successor have generated plenty of volatility from the Japanese yen. Last week, a report that Deputy Governor Masayoshi Amamiya had been approached for the position sent the yen briefly lower, as Amamiya is considered a dove. Amamiya declined the offer and in a surprise move, the BoJ has decided to appoint Kazua Ueda. The news initially resulted in yen buying, as the markets viewed the choice as a signal for fresh thinking and a change in policy.
This view was quickly dampened by Ueda himself, who said on Friday that current policy settings were appropriate. This has sent the yen sharply lower on Monday. Ueda may be trying to sound diplomatic in order to avoid any waves ahead of his appointment, and it’s very possible he will tighten policy once he’s in charge. In the meantime, the BoJ is expected to maintain its ultra-loose policy, so the yen won’t be getting any help from the BoJ for the time being.
USD/JPY Technical
- USD/JPY has support at 131.38 and 130.71
- There is resistance at 132.96 and 134.18
European commission upgrades 2023 growth forecasts, lowers inflation slightly
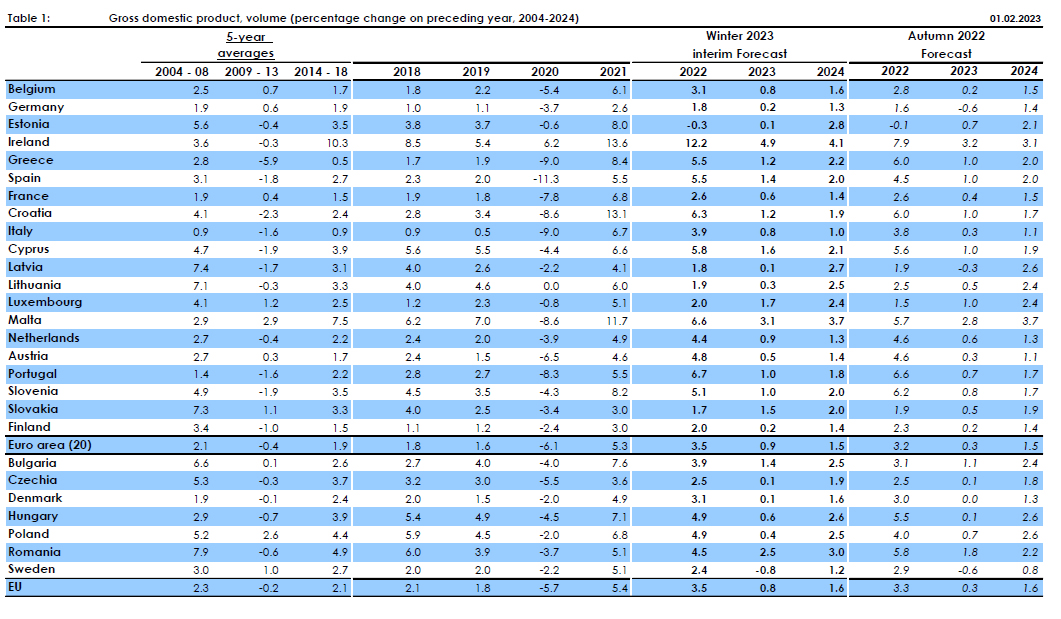
In the Winter interim Forecast, European commission upgraded growth projections for Eurozone in 2023 and downgraded inflation projections.
"Europe's economy is proving resilient in the face of current challenges. We were able to narrowly avoid a recession. We are somewhat more optimistic about growth prospects and the projected decline in inflation this year," said Valdis Dombrovskis, Executive Vice-President for an Economy that Works for People.
"We have entered 2023 on a firmer footing than anticipated: the risks of recession and gas shortages have faded and unemployment remains at a record low," said Paolo Gentiloni, Commissioner for Economy.
GDP growth forecasts for:
- 2023 at 0.9% (upgraded from Autumn's 0.3%).
- 2024 at 1.5% (unchanged).
HICP inflation forecasts for:
- 2023 at 5.6% (downgraded from 6.1%).
- 2024 at 2.5% (downgraded from 2.6%).
ECB Centeno: For sure, we’re much closer to that terminal rate than before
ECB Governing Council member Mario Centeno told BloombergTV, "for sure, we're much closer to that terminal rate than before... We're approaching it and I think March will be a great moment for us to be very clear about it."
Meanwhile, for the central bank to slow tightening pace from current 50bps per meeting, Centeno said, "we really need to see inflation converging to 2% in the medium term".
He added, the new forecasts in March are "going to tell us exactly where we are in that process".
EUR/USD: Bears Hold Grip But Likely to Stay on Hold, Awaiting US Inflation Data
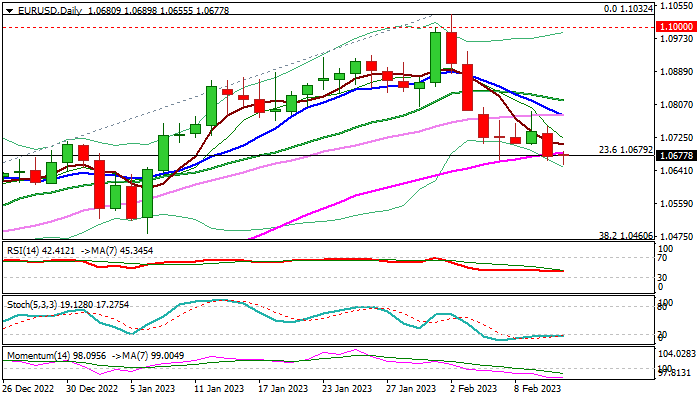
The Euro keeps negative tone at the start of the week following 0.55% drop on Friday, which resulted in a marginal close below 55DMA (1.0686) and Fibo 23.6% of 0.9535/1.1032 (1.0679), on probe through the floor of four-day consolidation range
The second consecutive bearish weekly close after a bull-trap above weekly cloud top (1.0930) adds to bearish signals.
Repeated close below 55DMA is needed to maintain bearish bias for further weakness and test of strong support at 1.0611, provided by the top of rising thick daily cloud.
Bears may face headwinds on approach to this support as daily RSI turned sideways and stochastic is oversold.
On the other hand, strengthening negative momentum keeps overall structure bearishly aligned, suggesting that upticks should provide better selling opportunities while the action is capped by converged 10/30DMA’s (1.0780) in attempts to form a bear-cross.
Monday’s action may remain in a quiet mode, as today’s calendar is empty, but also as traders stay on hold, awaiting release of Eurozone Q4 GDP and a key release, US Jan inflation data on Tuesday, which are expected to provide stronger direction signals.
Res: 1.0752; 1.0780; 1.0817; 1.0843.
Sup: 1.0655; 1.0611; 1.0483; 1.0460.
Gold’s Bullish Channel at Risk; Support at 50-SMA
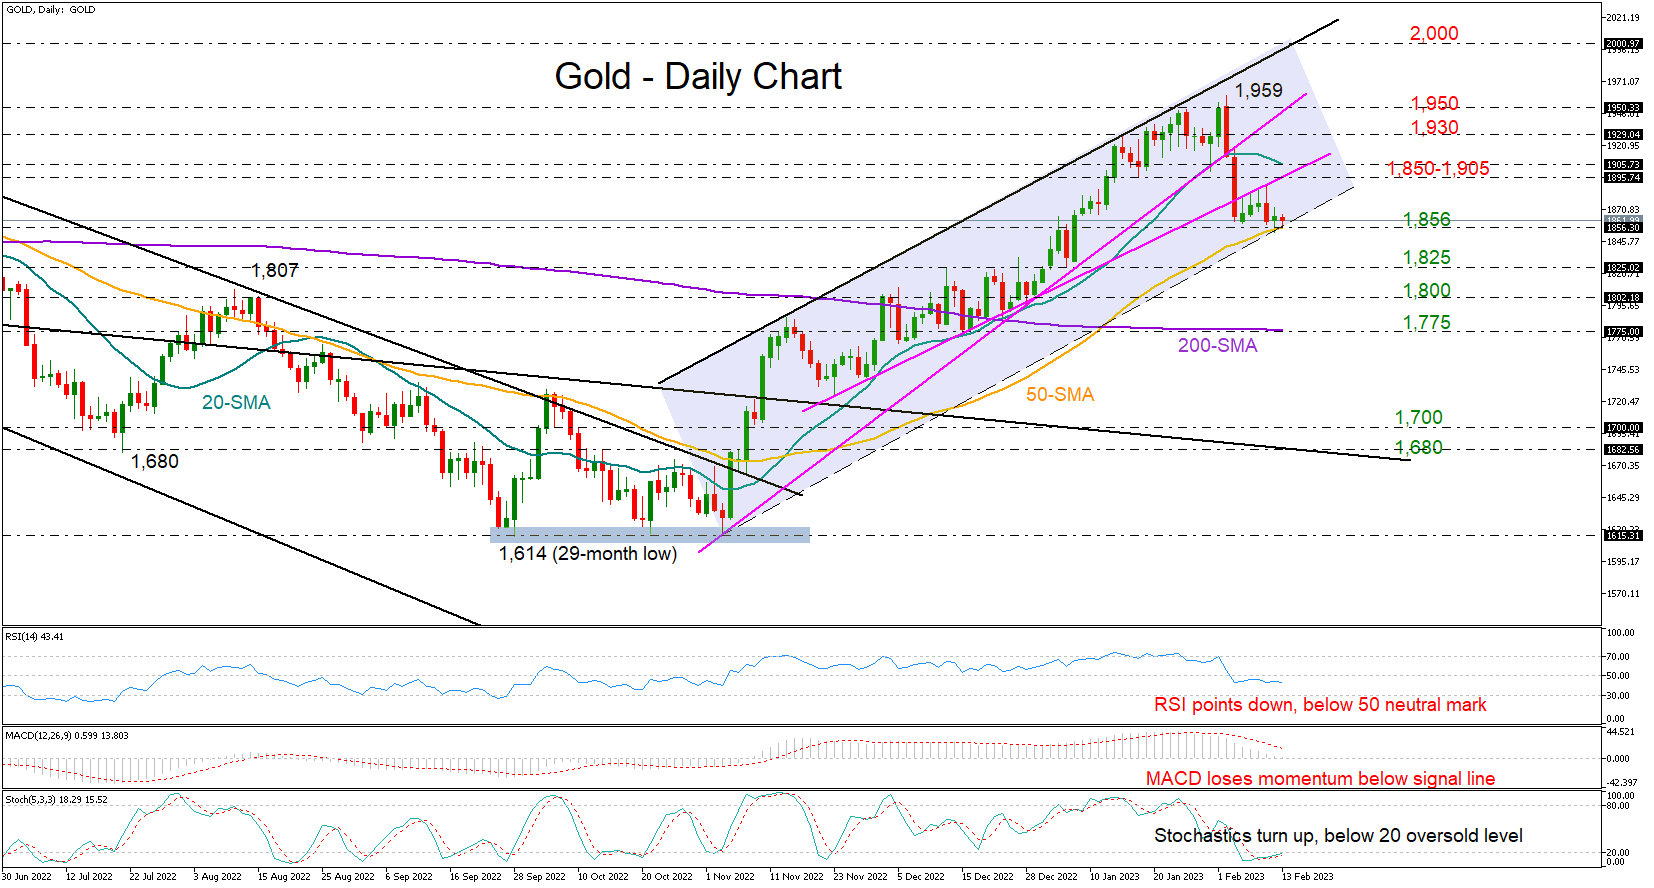
Gold was experiencing a flat trading session around the 1,860 level during Monday’s early European hours after a not-so-encouraging week, which sent the price to a one-month low of 1,852.
Specifically, the precious metal could not attract enough buying to crawl back above the support-turned-resistance trendline, edging lower instead to test the 50-day simple moving average (SMA) at 1,856. That is where the lower boundary of a bullish channel seems to be positioned. Hence, failure to rebound here could cause a relatively sharper decline to 1,825. If the 1,800 psychological mark proves fragile too, the door will open for the flattening 200-day SMA at 1,775. Another violation at this point would officially invalidate the uptrend from autumn’s lows.
The RSI and the MACD are backing the aforementioned bearish scenario as the former is facing downside pressures below its 50 neutral mark, while the latter has well distanced itself below its red signal line and is set to enter the negative area.
On the other hand, the stochastic oscillator is showing a soft bullish divergence after bottoming out in the oversold area, feeding some optimism that the price could soon pivot. Nevertheless, sentiment may remain weak unless the price bounces above the 1,895-1,900 wall, where the 20-day SMA is located. A successful penetration higher may face some congestion around 1,930 before heading for the key resistance area of 1,950. Then, the bulls will push towards the channel’s upper band, likely charting a new higher high at 2,000.
All in all, gold traders are expected to stay on the sidelines in the short term, waiting for fresh direction below the 50-day SMA at 1,856 or above the 1,895-1,900 barrier.
GBP/USD: Is Pound Ready for a Bearish Trend?
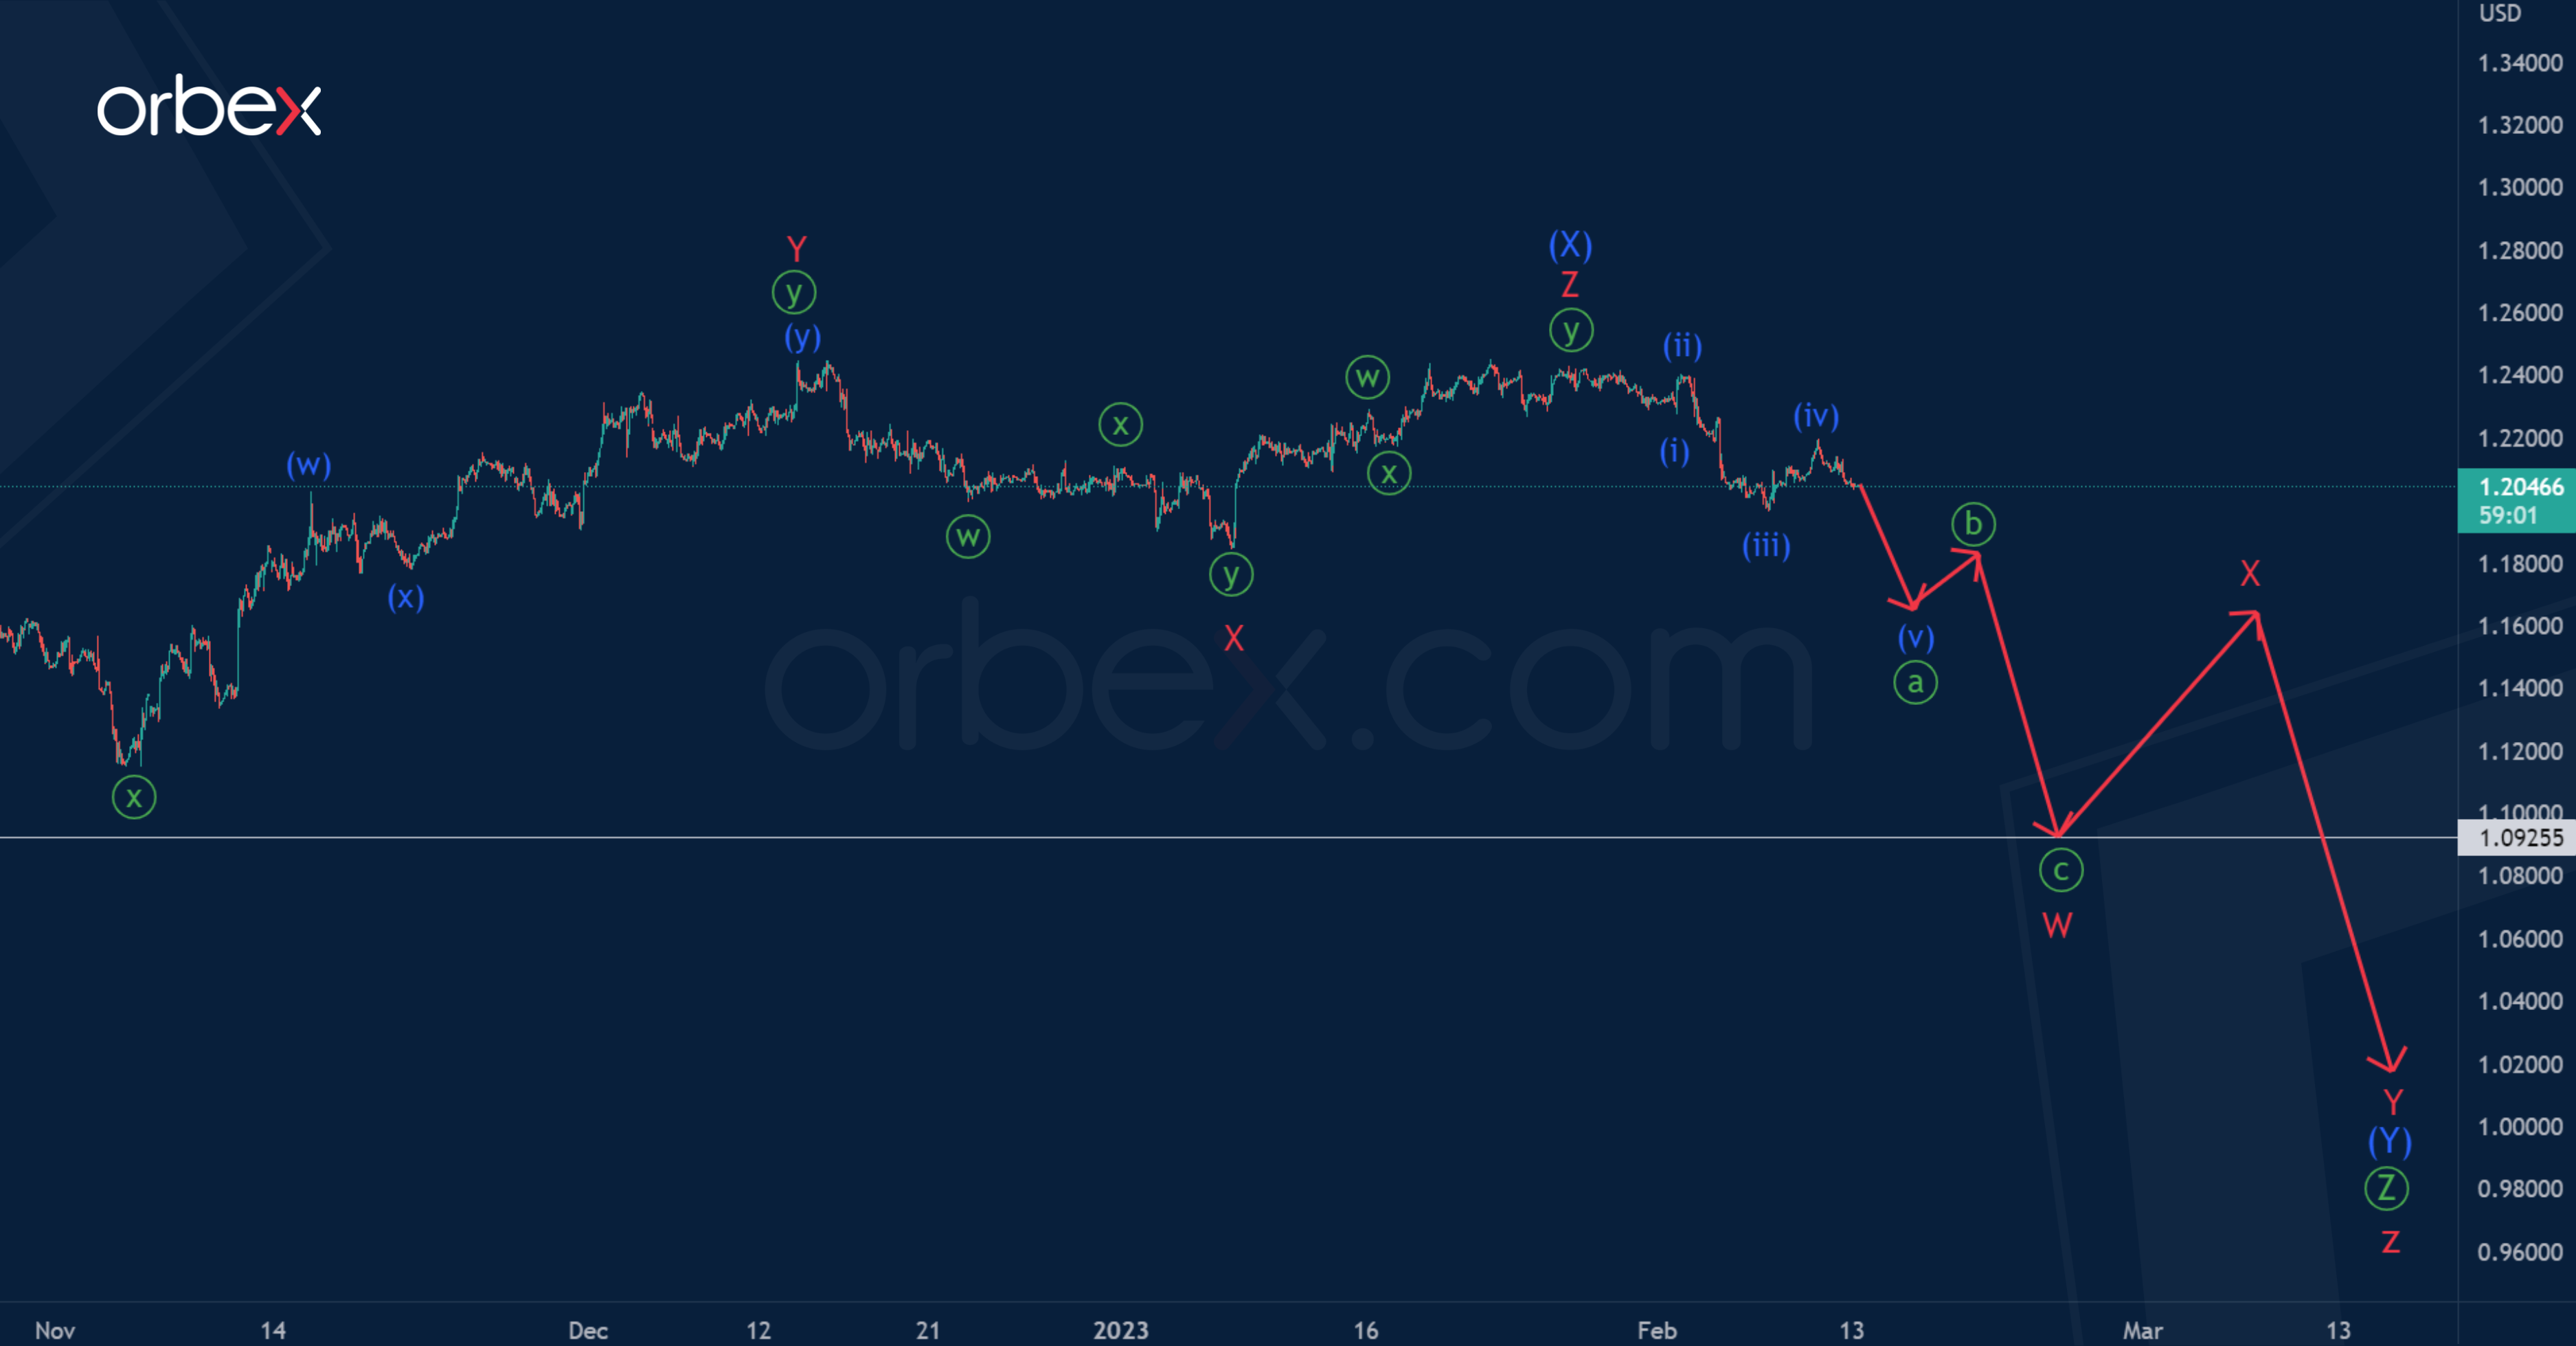
In the long run, GBPUSD seems to be forming a global triple zigzag w-x-y-x-z, in which the final actionary wave z develops.
Wave z most likely takes the form of a primary triple zigzag Ⓦ-Ⓧ-Ⓨ-Ⓧ-Ⓩ, in which we see the development of the primary wave Ⓩ. It can take the form of a double zigzag pattern (W)-(X)-(Y). The formation of the intervening wave (X) has recently ended.
There is a high probability that the last sub-wave (Y) will take the form of a double zigzag W-X-Y.
The first actionary leg W can end in the form of a minute zigzag to a minimum of 1.092.
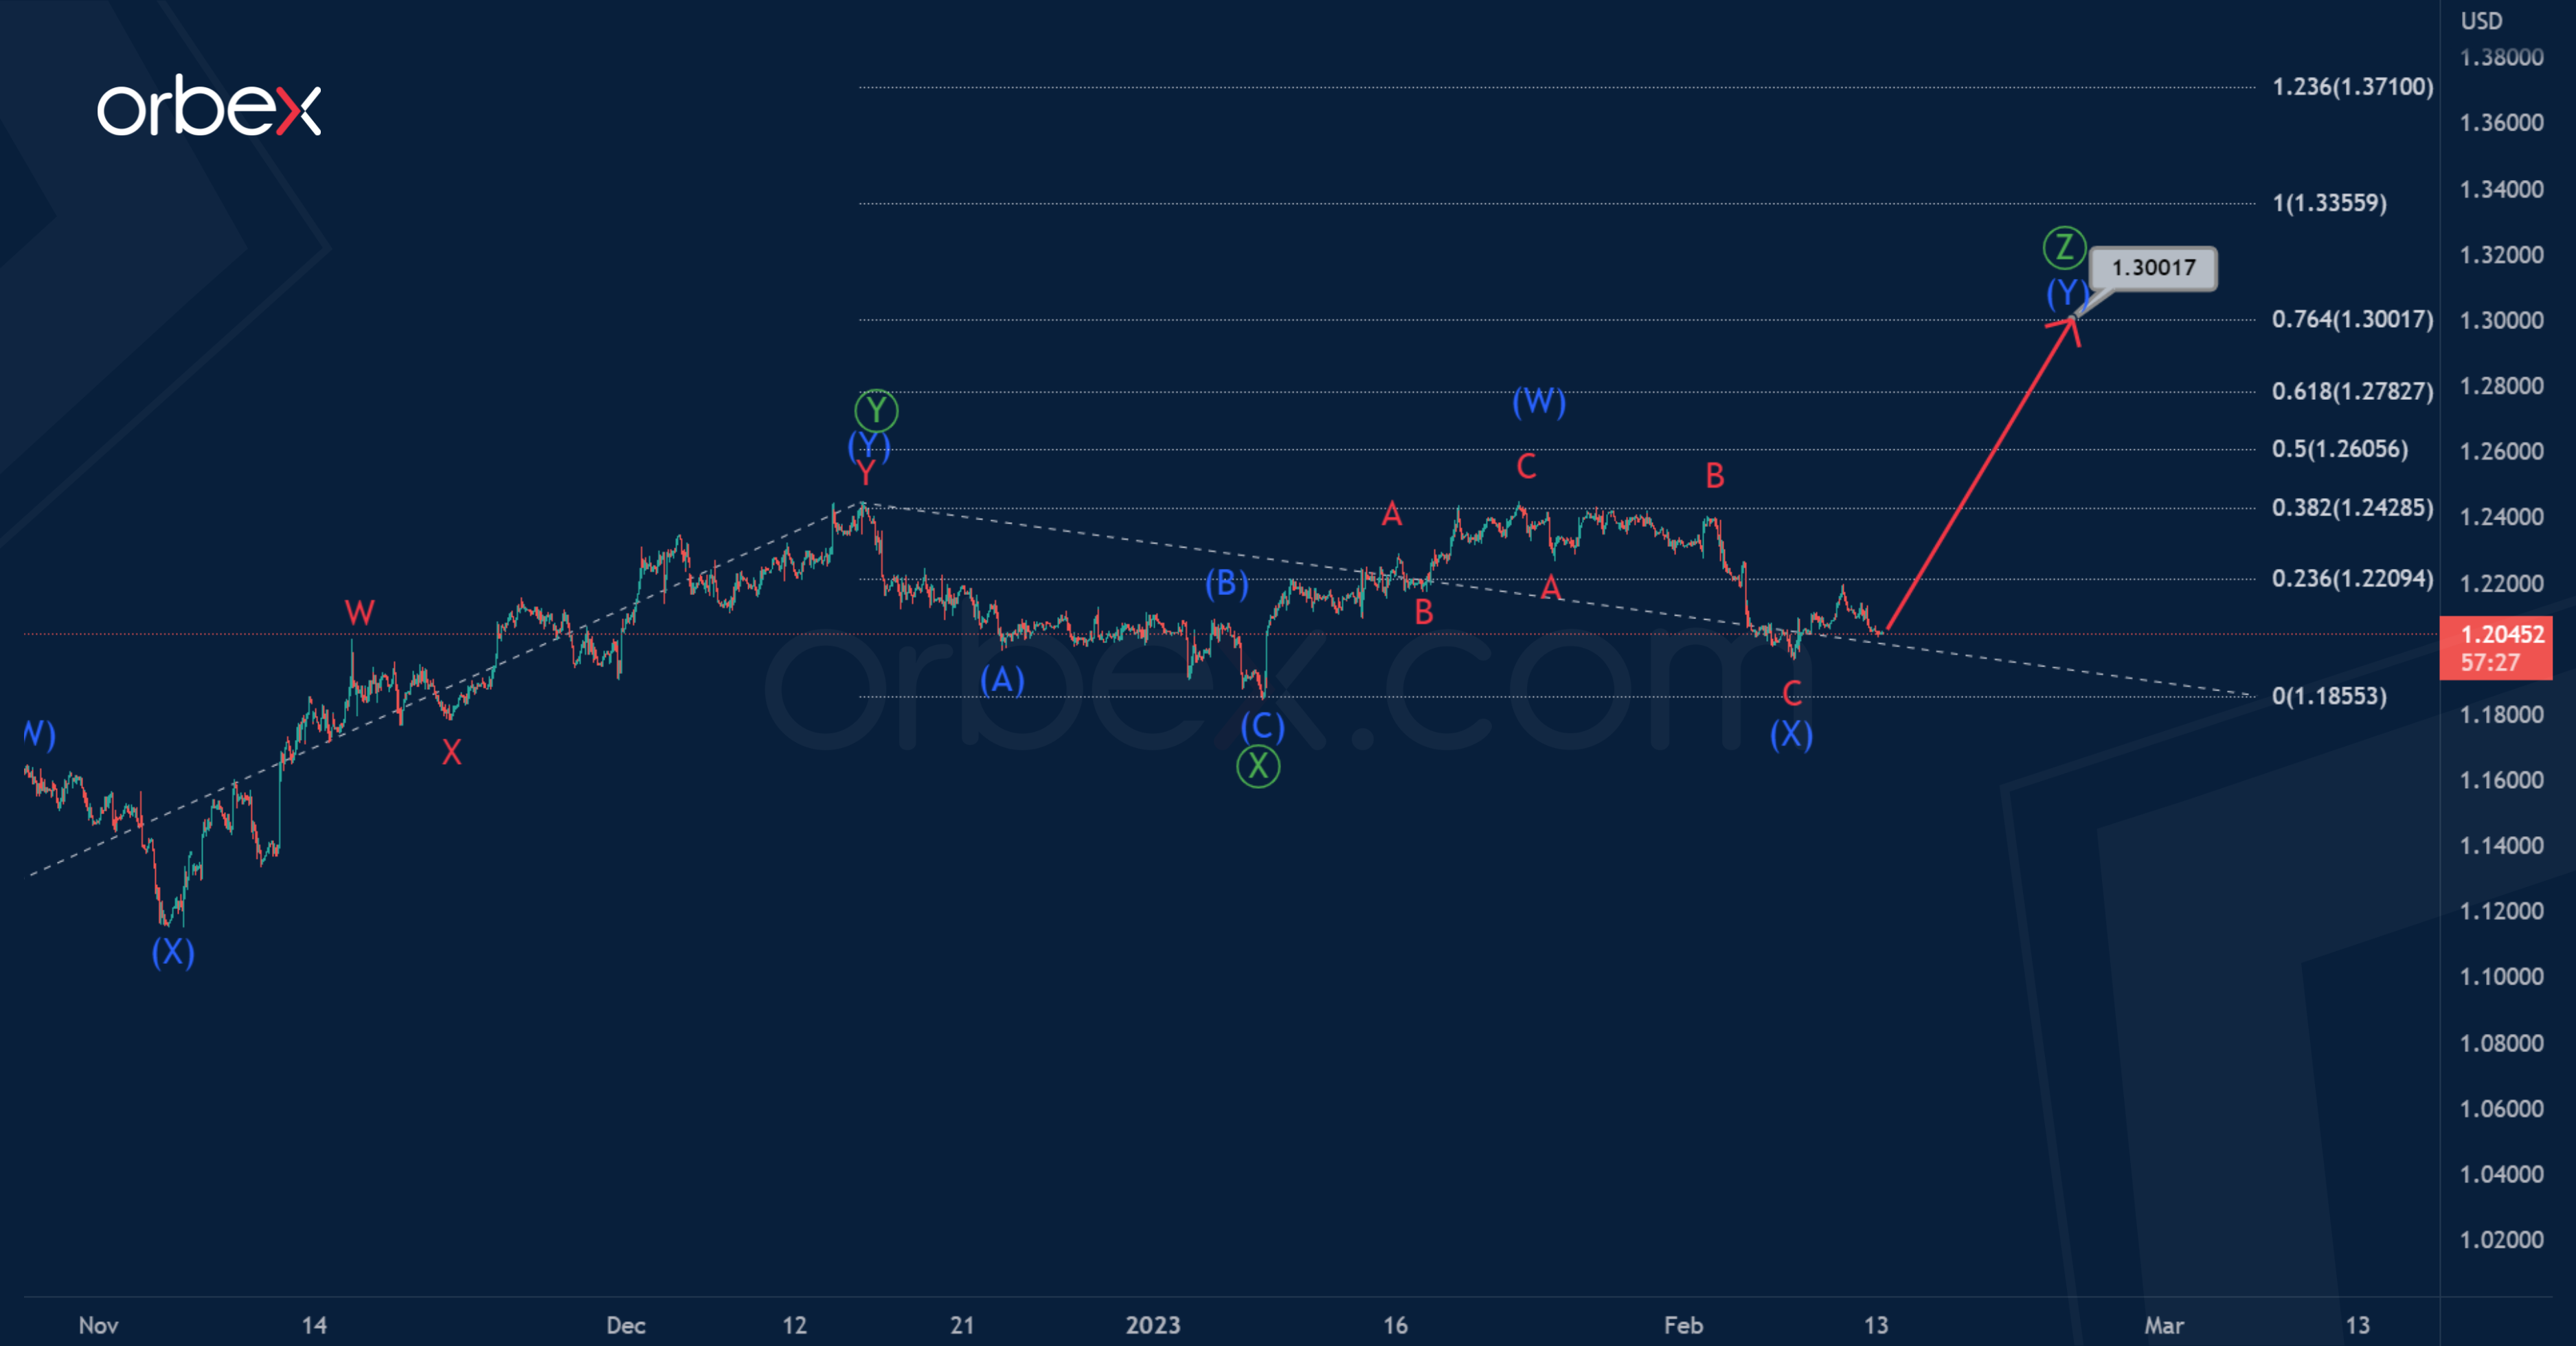
In the second scenario, the wave z could be fully completed. And now the bulls can move the price up within the new trend.
It is assumed that the formation of a primary triple zigzag Ⓦ-Ⓧ-Ⓨ-Ⓧ-Ⓩ occurs, where the first four parts are already formed.
In the last section of the chart, the final actionary wave Ⓩ is formed, the structure of which is similar to a double zigzag (W)-(X)-(Y). Most likely, it will be at 76.4% of wave Ⓨ, and will end near 1.300.
Dax 40 Breaks Lower
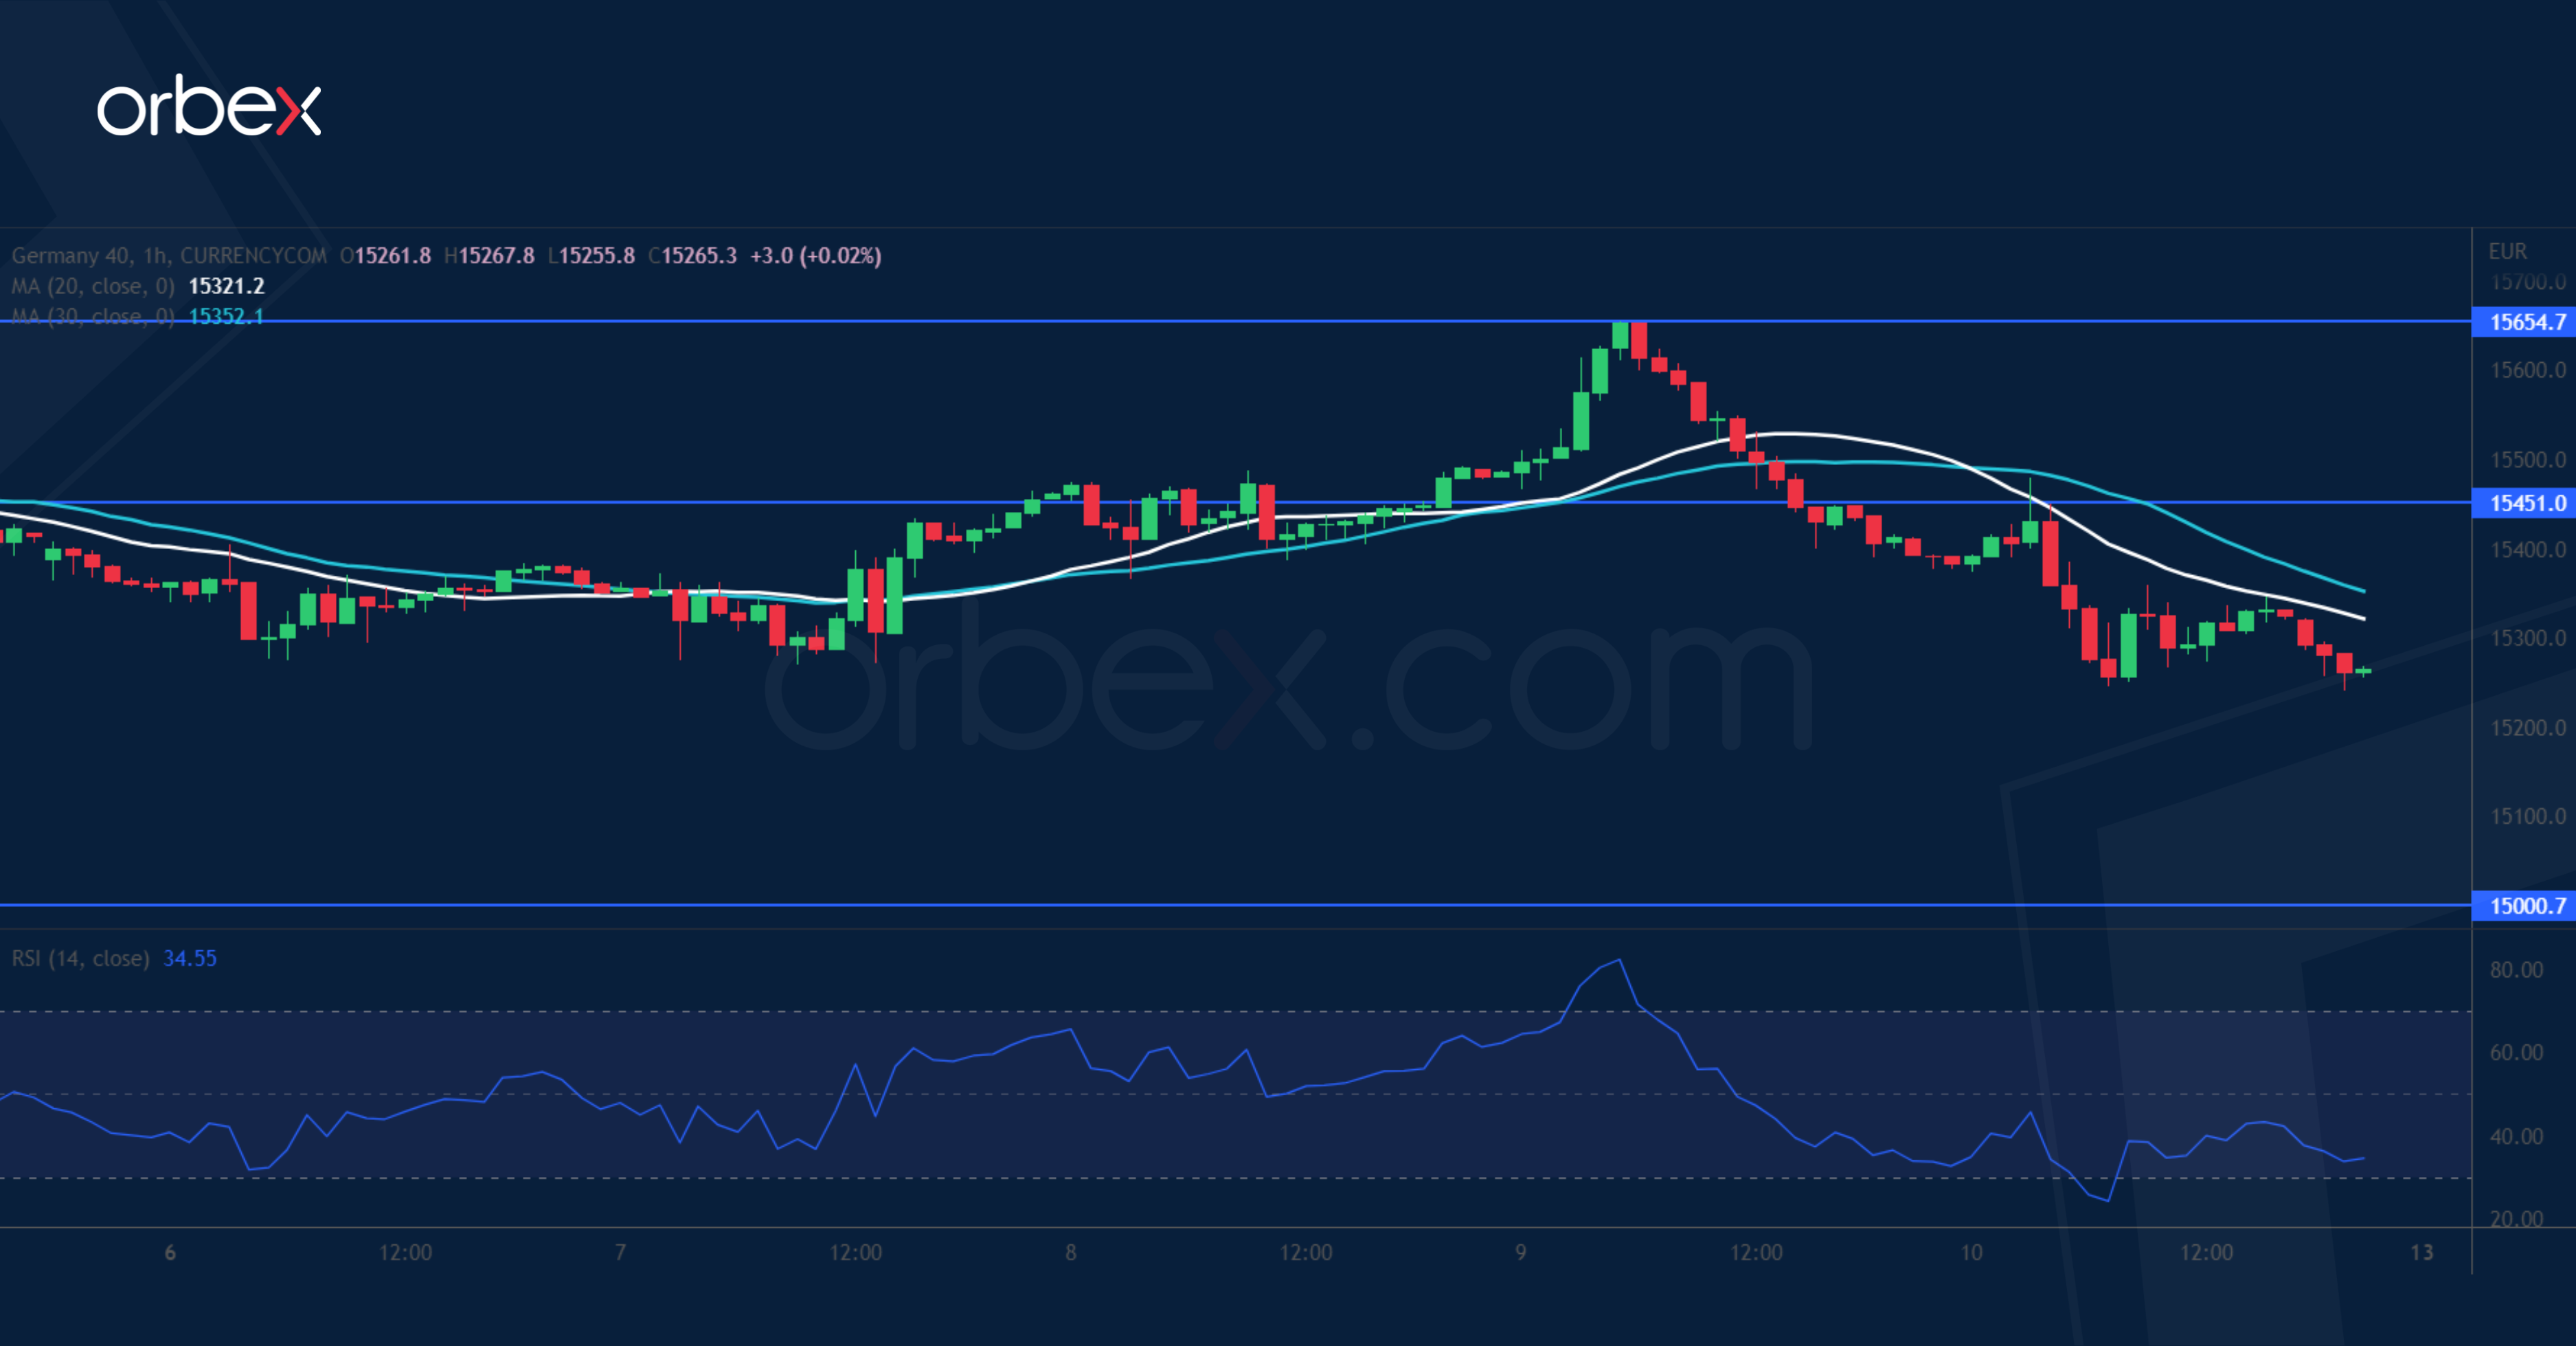
Equities trade on a cautious note amid rising US Treasury yields. The Dax 40 has failed to hold on to its gains above 15400, prompting the bulls to scramble for the exit. A drop below the previous swing low of 15280 would confirm the lack of follow-up bids and potentially trigger a broader liquidation. The psychological level of 15000 at the confluence of the lower end of a previous consolidation and the 30-day SMA is a major floor. 15450 at the top of a brief rebound would be the first hurdle when buyers make their way back.
EUR/GBP Struggles for Support
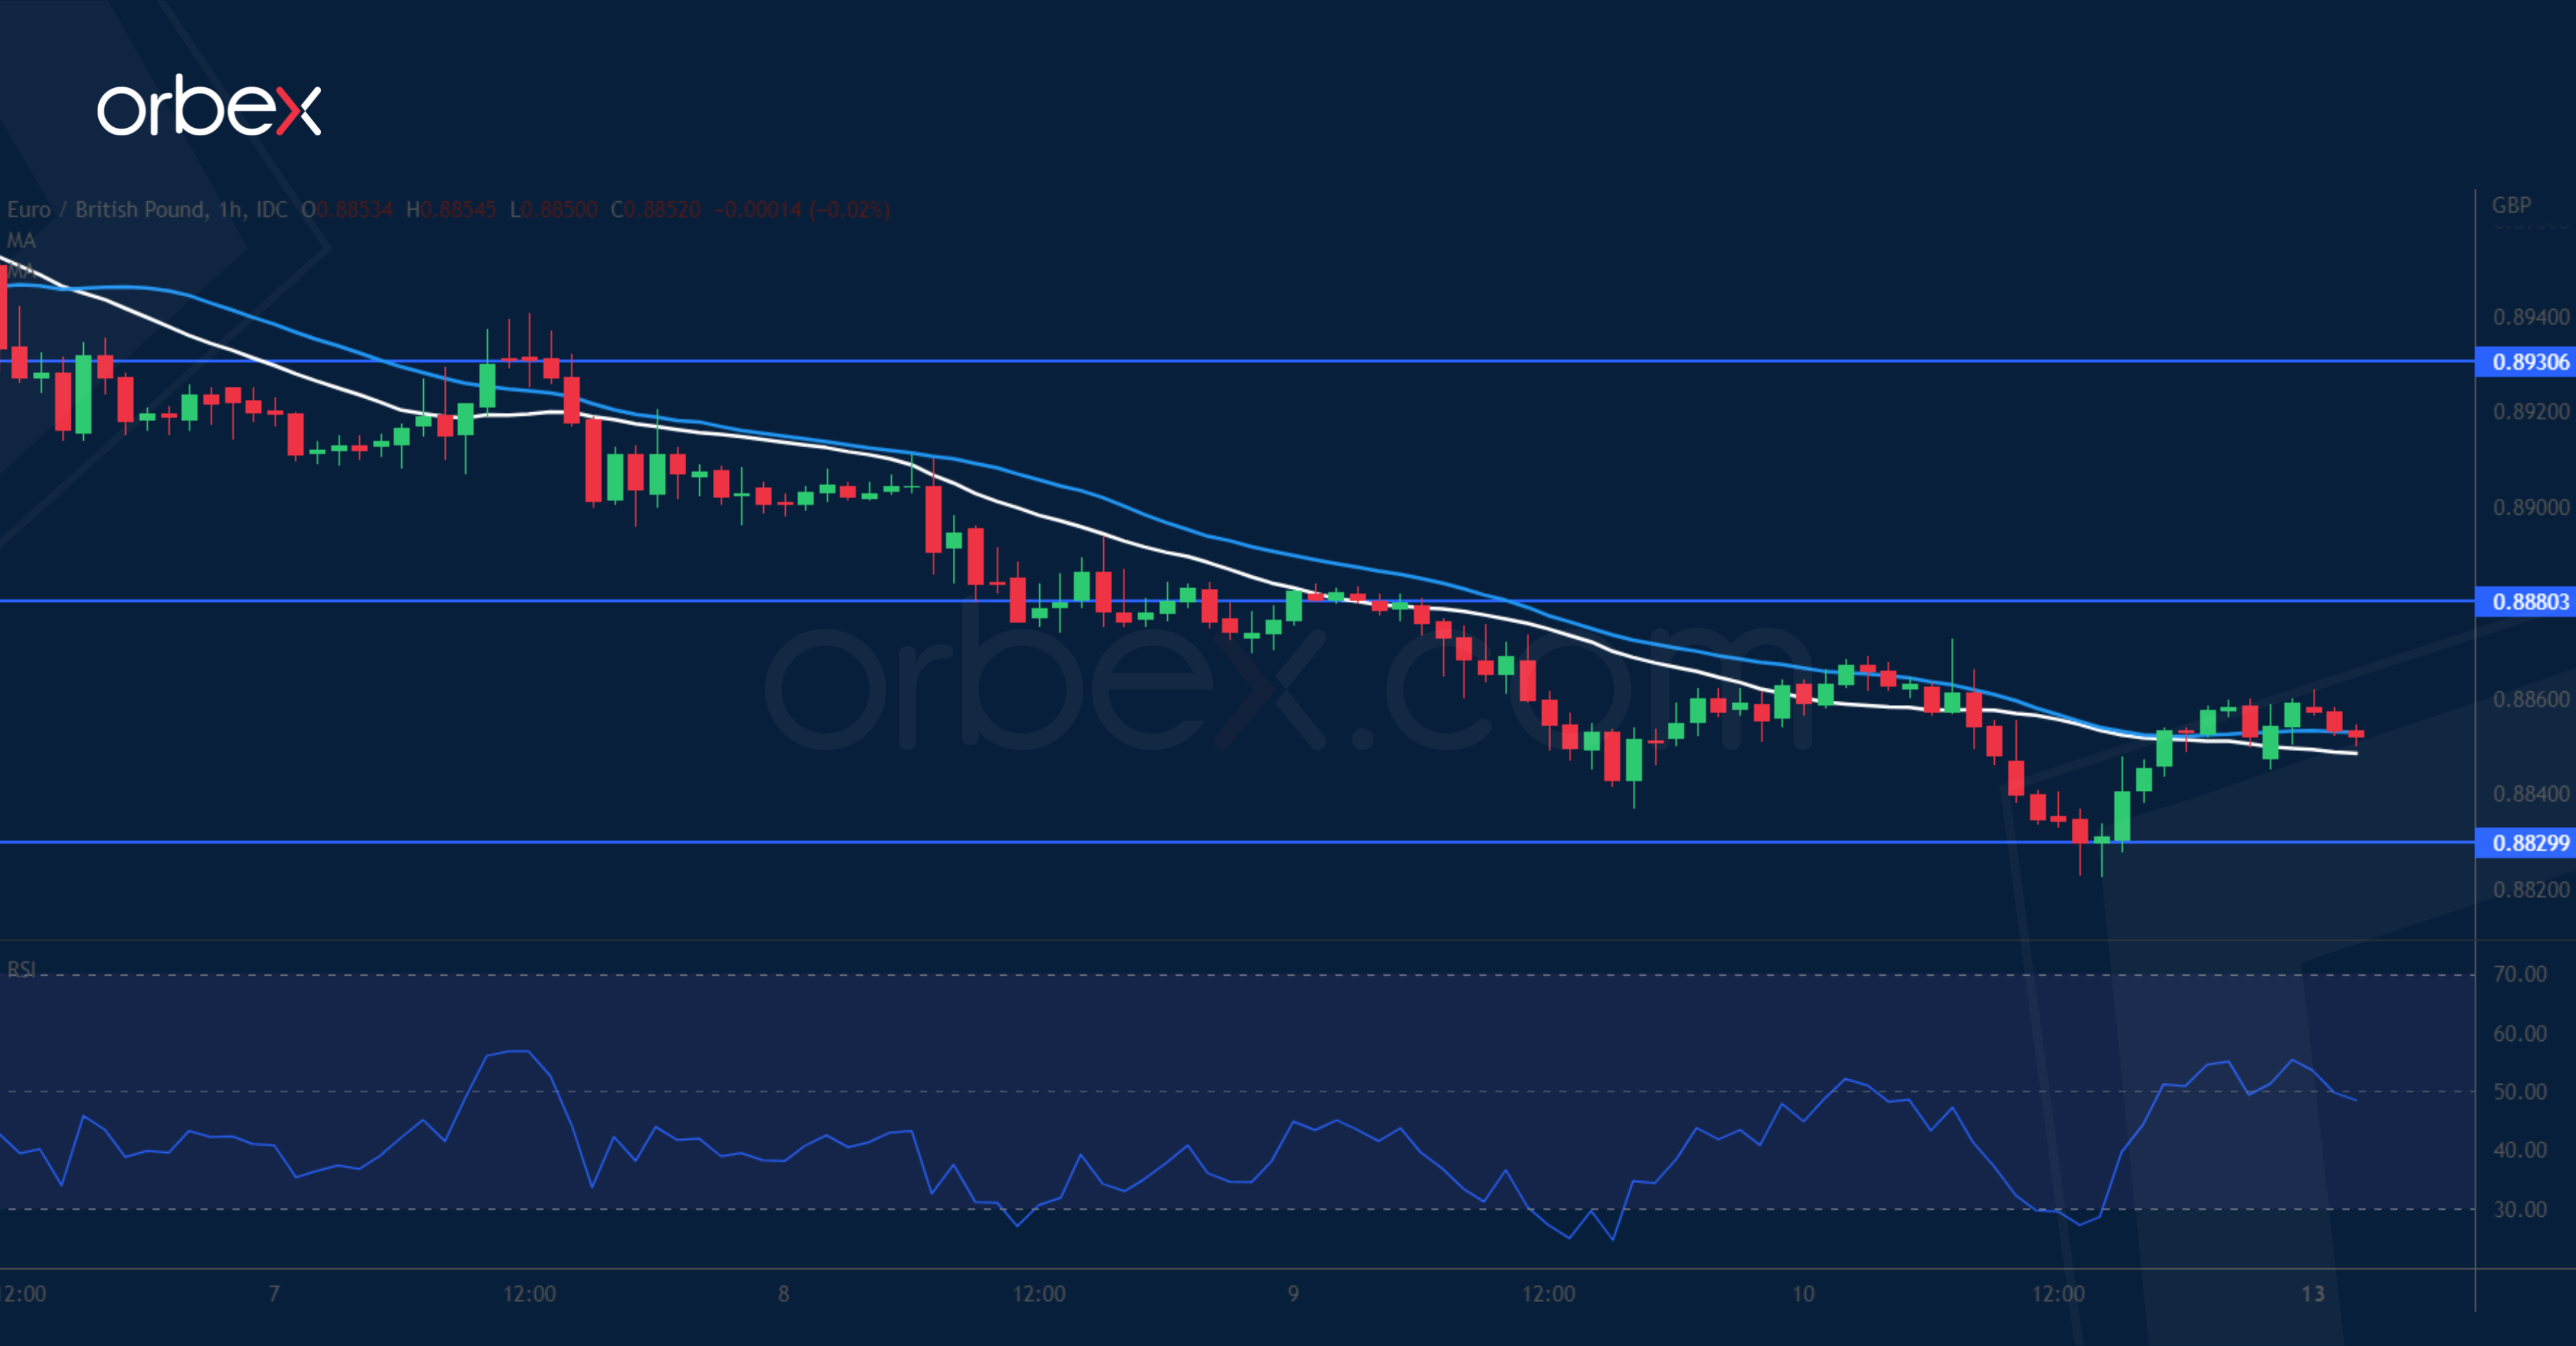
The pound slipped after December’s GDP showed a 0.5% contraction. The euro is still under pressure after a break below 0.8880, turning it into a resistance. The previous high of 0.8830 is the current support and coincides with the 30-day SMA on the daily chart. The RSI’s another venture into the oversold area attracted some interest but the bulls will need to reclaim 0.8930 before they could hope for a bullish continuation. A retest of the daily low and critical level at 0.8760 would threaten the uptrend in the medium-term.
USD/CAD to Test Major Support
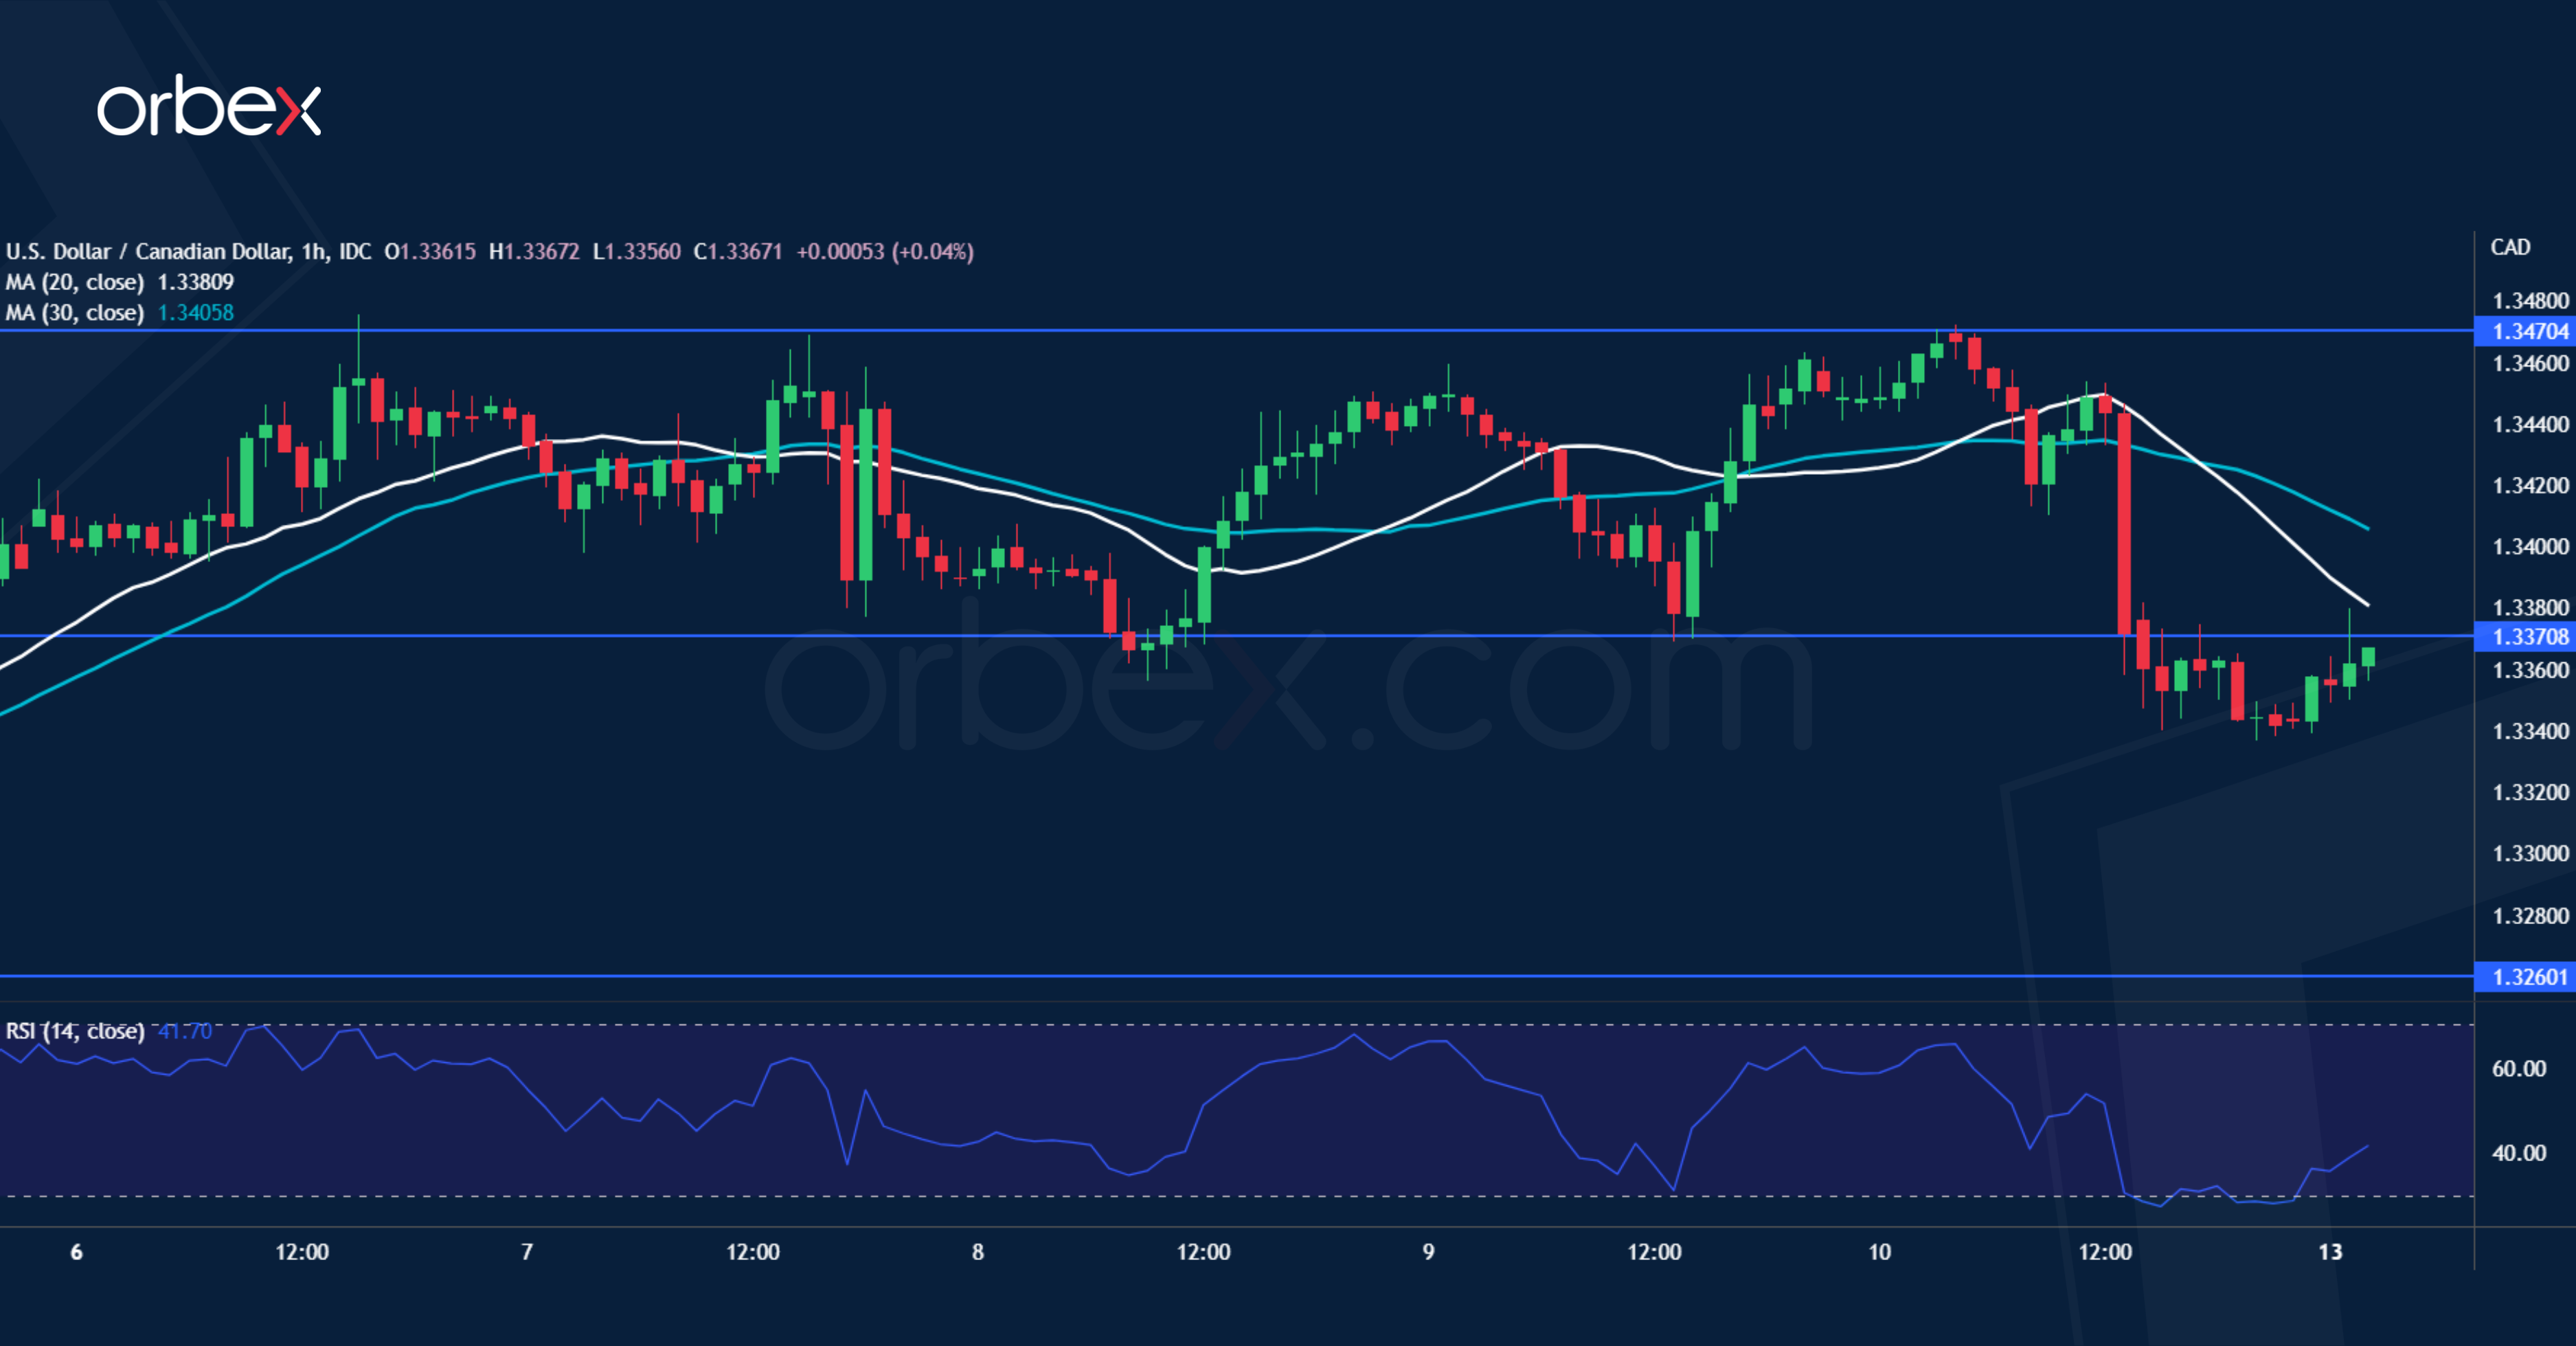
The Canadian dollar surged after a blowout jobs report fuelled speculation about further tightening. The recent consolidation has failed to secure a foothold above 1.3370, which has turned into a fresh resistance. This suggests that despite multiple tests, 1.3470, right under the daily resistance of 1.3520 may continue to keep the greenback in check. Looking at the bigger picture, the pair is still in a descending triangle on the daily chart and 1.3260 at the lower boundary is a major level to keep the pattern intact.