

Sample Category Title
What If US Inflation Didn’t Ease as Much as Expected?
US equities recorded their worst week since the year started.
Hawkish comments from many Federal Reserve (Fed) members hammers sentiment, as stress mounts before the much-important US CPI data due Tuesday.
If US inflation hasn’t eased, or eased enough, or God forbid, ticked unexpectedly higher on yearly basis, we could rapidly see the post-NFP optimism, and the pricing on the goldilocks scenario to leave its place to fear and chaos.
And I say on a yearly basis, because on monthly basis, the consensus is, in fact, an uptick to 0.4% in January from 0.1% printed a month earlier.
The surprise U-turn in used-car prices, and a rally in commodity prices on the Chinese reopening may have impacted the US prices more than what the polls predict.
So, investors are holding their breath before they see how the recent developments impacted the US inflation, and how the US inflation will impact the Fed expectations and the market sentiment.
At the start of the week, the activity on Fed fund futures hints at around 91% chance for a 25bp in the next FOMC meeting, and around 9% chance for a 50bp hike.
Note that the pricing for a 50bp is already in play. An unpleasant surprise from the CPI front could boost the odds. Remember, a single CPI print could change the expectation from 50 to 25bp for the last FOMC meeting. And there is no guarantee that the opposite won’t happen this time.
FX and energy
The US dollar index finally cleared the 50-DMA offers on Friday - which I think could be premature if tomorrow’s US inflation number is sufficiently soft.
Besides a broadly better-bid US dollar, a wave of fresh buying in the Japanese yen also marked the latest mood in the currency markets, as Masayoshi Amamiya refused to take over the Bank of Japan (BoJ), and the role will finally go to Kazuo Ueda, who is seen as being more hawkish than Amamiya.
But the first thing Ueda told reporters since the news that he will take over the BoJ broke was that the easy policy will stay in place.
The dollar-yen is testing the 50-DMA to the upside this morning, and it could be just a matter of time before we see the pair jump over this level.
The EURUSD, on the other hand, is already below both the 50-DMA and the 23.6% retracement on October to January rally. Trend and momentum indicators look bearish, with the next key support seen at 1.0470/1.05 range, the major 38.2% retracement that will distinguish between the actual positive trend and a bearish reversal, and an important psychological mark.
But because the US dollar is what leads the dance, what’s next in the EURUSD will mostly depend on what’s next in the dollar, simply.
Across the Channel, good news came on Friday: the UK avoided a technical recession. The bad news may be that a jump in sales due to the World Cup may have made a difference in the latest numbers, and the positive vibes may not last. At the end of the day, Britain is the only G7 yet to recover from Covid weakness.
Anyway, the general state of the British economy is not a concern for the FTSE 100 stocks, where 80% of the revenues are made abroad. Therefore, any weakness in the UK economy, hence strerling remain, on the contrary, supportive of the British big cap index, which hit a fresh high last week.
We could see the index coming lower this week along with other major indices, but the energy and commodity exposure of the British index is still a good thing to have.
BP’s value hit the £100 billion mark for the first time in three years, and I can assure you that last week’s price action was nothing less exciting than Bitcoin’s in its good, old days.
And speaking of energy, US crude oil jumped past the $80pb on Friday, as Russia announced to cut its production by 500’000 barrels per day, which is roughly 5% of its daily production. But gains remain limited by an overall bearish mood and recession fears, and offers remain strong into the 100-DMA, which currently stands near $81pb level.
All Eyes on US CPI this Week
Market movers today
We start the week in a quiet fashion. The European Commission will release its new winter forecast and it will be interesting to see what they expect on the recession question and how fast inflation will slow down. Euro-area finance ministers also meet in Brussels to discuss energy markets and other topics.
Later this week the market highlight will be the US CPI print for January on Tuesday (read more in Research US - Soft landing to no landing?, 9 February). US retail sales will also give more input on the state of the US consumer.
The 60 second overview
US shoots down more objects: Another three objects have been shot down by the US air force following the shoot-down of the Chinese balloon a week ago. It is unclear where the objects come from and what they are exactly. They were not categorized as balloons. A US general Glen VanHerck said "I would be hesitant, and would urge you, not to attribute it to any specific country. We don't know". A State Department official last week said that Chinese President Xi Jinping may not have known about the Chinese balloon that flew into US airspace, see more here. In China, local authorities said they had spotted an unidentified flying object and were preparing to shoot it down.
Markets await US CPI: Markets in Asia are quiet, awaiting the important US CPI report tomorrow, which will be key for the next move in markets. On Friday, the University of Michigan consumer confidence report showed a rise in 1-year inflation expectations from 3.9% to 4.2% while 5-10 year inflation expectations stayed flat at 2.9%. Overall consumer confidence improved in a further sign that the headwinds for consumers and the overall economy seems to be easing.
Oil price higher: The oil price rose on Friday on the news that Russia plans to cut oil output 500kb/d in March and OPEC does not plan to increase output in response. Russia's oil production already dropped more than 1mb/d, or 10%, since the war broke out and we do not want to overstate the impact of a further drop. Buyers have shun Russian oil amid Russia's invasion of Ukraine and sanctions and forcing Russia to cut output. The additional drop in production in March may be involuntary. In the meantime, other producers have stepped in to reap market shares from Russia - mainly producers in Latin America. Finally, if the oil market tightens, i.e. and oil price rise above USD100/bbl, we expect OPEC+ to respond and hike output.
FI: European rates sold off from the opening by 5bp in core countries in the 10y point, but then range traded through most of the day. The entire yield curve ended higher, but the very front end rose the most, where ECB peak policy hike was 6bp higher on the day at 3.50% (€STR). 2y German Schatz reached 2.77% which is the since 2008. Banks chose to repay EUR36.6bn in ECB's voluntary TLTRO repayment option, which was a non-event for markets. Focus this week is clearly the US CPI print for January tomorrow, but otherwise this is a relatively quiet week. We also get the EC's new winter forecast.
FX: EUR/USD, currently back below 1.07, is expected to head lower over the coming months as global financial conditions re-tighten and this week's highlight in that regard could be tomorrow's US CPI report. The Riksbank sent EUR/SEK lower last week as they made a U-turn in terms of communication, and now the SEK seems to be back on the Riksbank's agenda. Short-term, this support should help EUR/SEK venture back towards the 11.00-region, which is fair according to our short-term model. The NOK was also supported by the Riksbank's shift, and last Thursday we entered a tactical short position in EUR/NOK. This Thursday's expectations survey from Norges Bank might be of interest near-term.
Credit: The credit markets ended last week on a rather negative note. During Friday, iTraxx Main widened 3.5bp to 78.7bp while iTraxx Crossover widened 16.9bp to 410.4bp. The weakness in the CDS market was also visible in the cash bond market, where secondary bond trading saw more balanced axes. Primary markets remained most of the week very active with a high issuance pace of both investment grade and high-yield rated instruments.
Nordic macro
There are no key movers in the Nordics today. Later this week we get Swedish house prices from Valueguard and unemployment while Norway releases the Q1 expectations survey and GDP for Q1. Governor of Norges Bank, Ida Wolden Bache, will also hold the annual address.
EUR/USD Daily Outlook
Daily Pivots: (S1) 1.0644; (P) 1.0699; (R1) 1.0731; More...
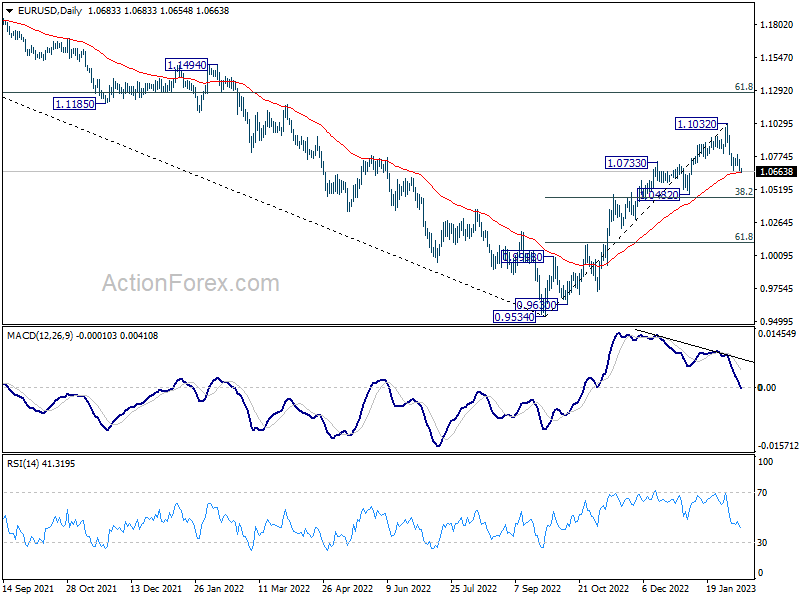
EUR/USD's decline from 1.1032 resumed by breaking 1.0668. Intraday bias is back on the downside for 38.2% retracement of 0.9534 to 1.1032 at 1.0463. Strong support should be seen around there to bring rebound, at least on first attempt. On the upside, above 1.0790 minor resistance will turn bias back to the upside for retesting 1.1032 high instead.
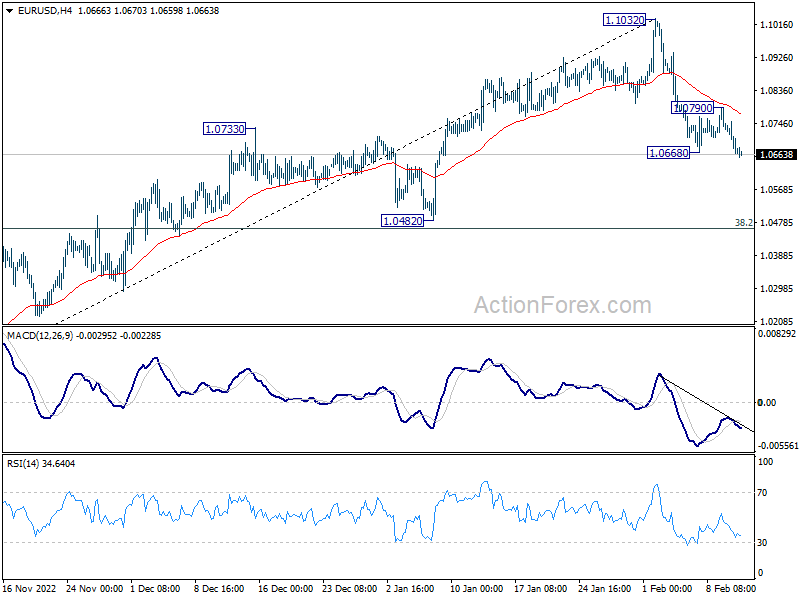
In the bigger picture, the rally from 0.9534 low (2022 low) is a medium term up trend rather than a correction. Further rise is in favor to 61.8% retracement of 1.2348 (2021 high) to 0.9534 at 1.1273 next. This will remain the favored case as long as 1.0482 support holds.
GBP/USD Daily Outlook
Daily Pivots: (S1) 1.2023; (P) 1.2081; (R1) 1.2116; More...
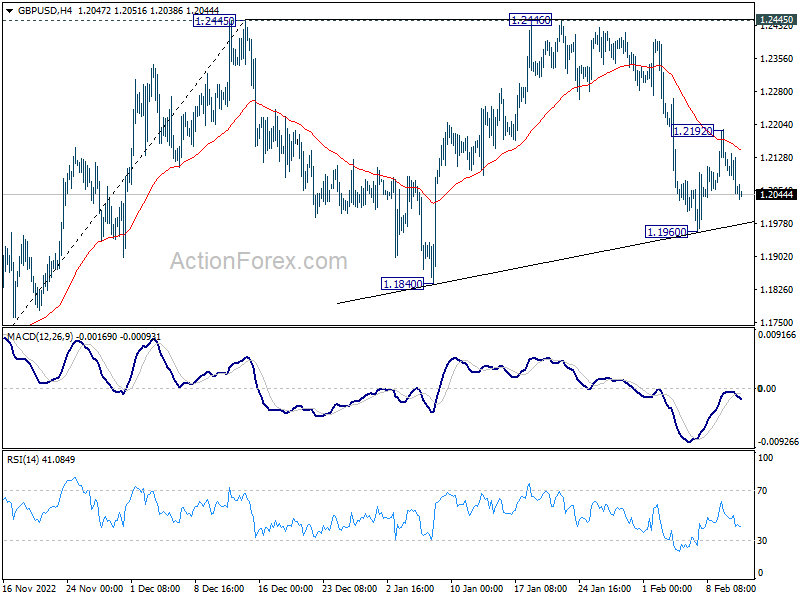
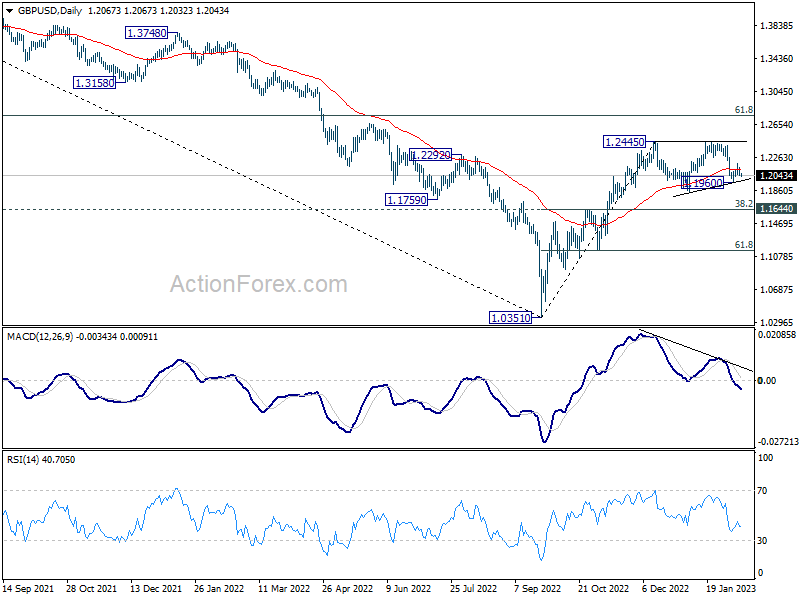
Intraday bias in GBP/USD remains neutral for the moment, and further decline is mildly in favor. On the downside, break of 1.1960 will resume the fall from 1.2446, as the third leg of the corrective pattern from 1.2445, to 1.1840 support, and possibly below. On the upside, though, break of 1.2192 will resume the rise from 1.1960 to retest 1.2445/6.
In the bigger picture, rise from 1.0351 medium term bottom is at least correcting whole down trend from 1.4248 (2021 high). Further rise is expected as long as 1.1644 resistance turned support holds. Next target is 61.8% retracement of 1.4248 to 1.0351 at 1.2759. Sustained break there will pave the way back to 1.4248.
AUD/USD Daily Report
Daily Pivots: (S1) 0.6899; (P) 0.6929; (R1) 0.6950; More...
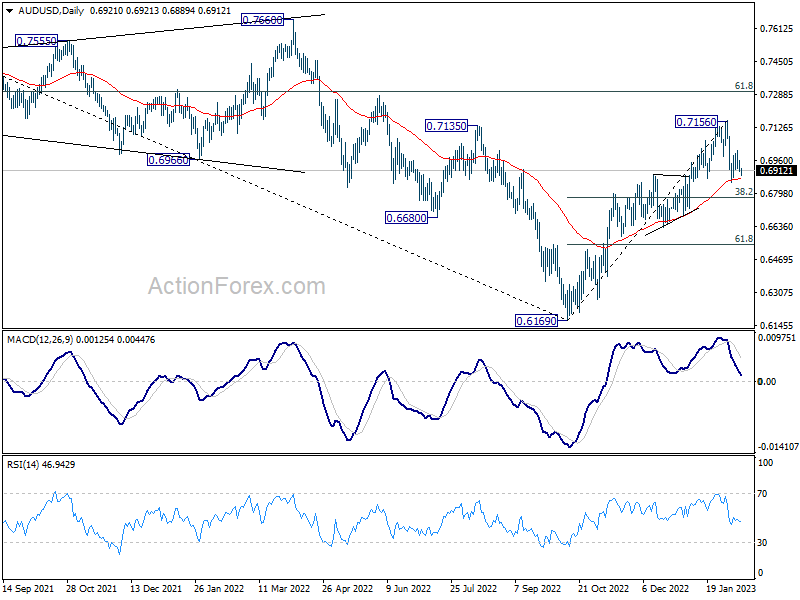
Intraday bias in AUD/USD remains neutral and deeper decline is mildly in favor. On the downside, break of 0.6854 will target 38.2% retracement of 0.6169 to 0.7156 at 0.6779. On the upside, break of 0.7010 will turn bias back to the upside for retesting 0.7156 high instead.
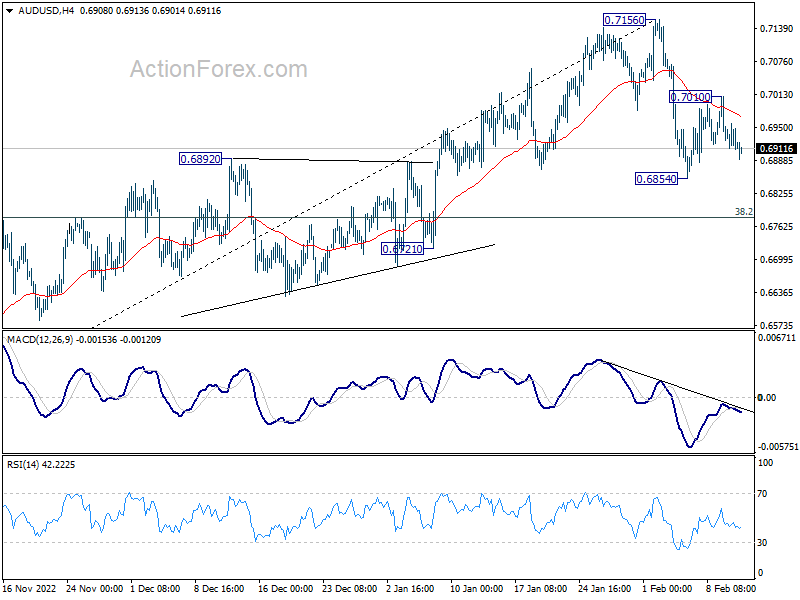
In the bigger picture, corrective decline from 0.8006 (2021 high) should have completed with three waves down to 0.6169 (2022 low). Further rally should be seen to 61.8% retracement of 0.8006 to 0.6169 at 0.7304. Sustained break there will pave the way to retest 0.8006. This will now remain the favored case as long as 0.6721 support holds.
USD/CAD Daily Outlook
Daily Pivots: (S1) 1.3298; (P) 1.3385; (R1) 1.3436; More....
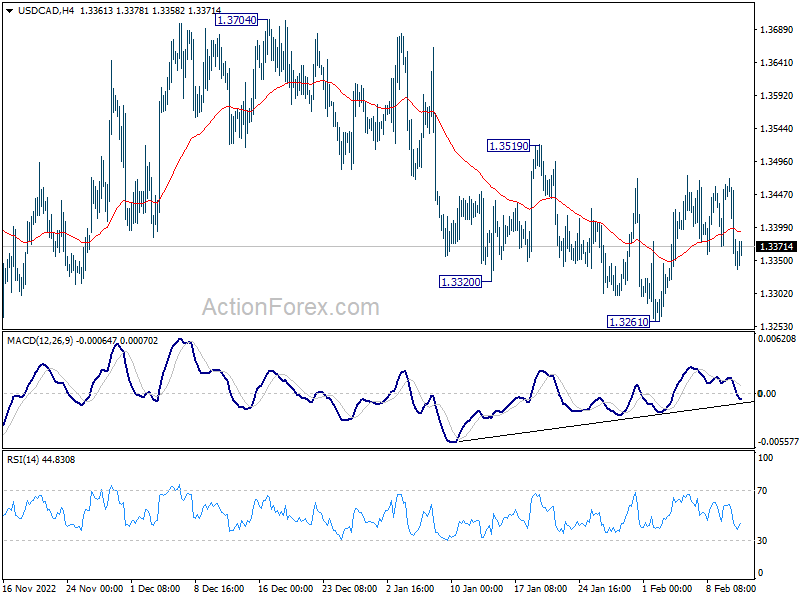
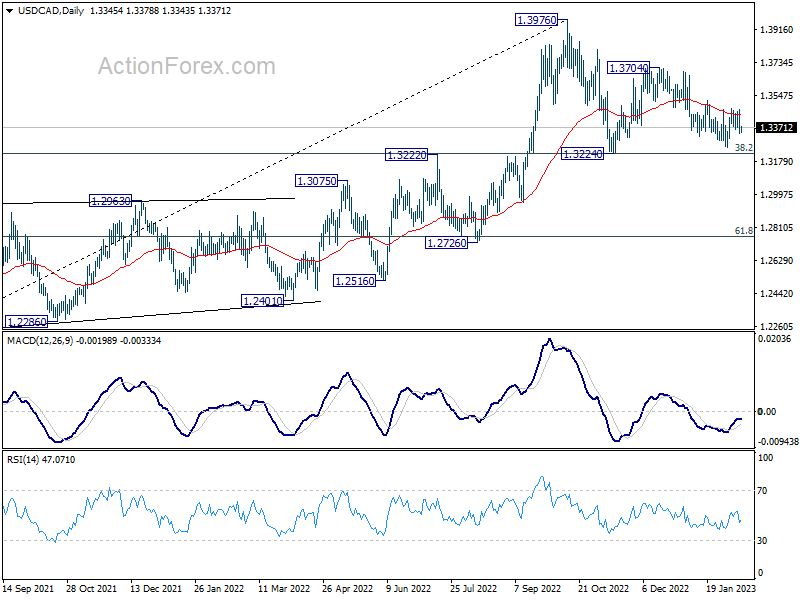
Intraday bias in USD/CAD stays neutral at this point. The choppy decline from 1.3704 might still extend lower, but strong support is expected to 1.3224 key support to bring rebound. On the upside, above 1.3519 resistance will confirm short term bottoming, and turn intraday bias back to the upside for retesting 1.3704 resistance. However, decisive break of 1.3224 would carry larger bearish implication.
In the bigger picture, as long as 1.3222 cluster support (38.2% retracement of 1.2005 to 1.3976 at 1.3223) holds, larger up trend from 1.2005 (2021 low) is still expected to resume through 1.3976 high at a later stage. However, firm break of 1.3222/3 will indicate that the trend might have reversed. Deeper fall would be seen to next cluster support at 1.2726 (61.8% retracement at 1.2758).
USD/CHF Daily Outlook
Daily Pivots: (S1) 0.9206; (P) 0.9229; (R1) 0.9261; More...
Intraday bias in USD/CHF remains neutral at this point. On the upside, firm break of 0.92879 resistance will confirm short term bottoming at 0.9058, and bring stronger rise to 0.9407 resistance. On the downside, however, sustained break of 0.9058 will resume larger decline from 1.0146 instead.
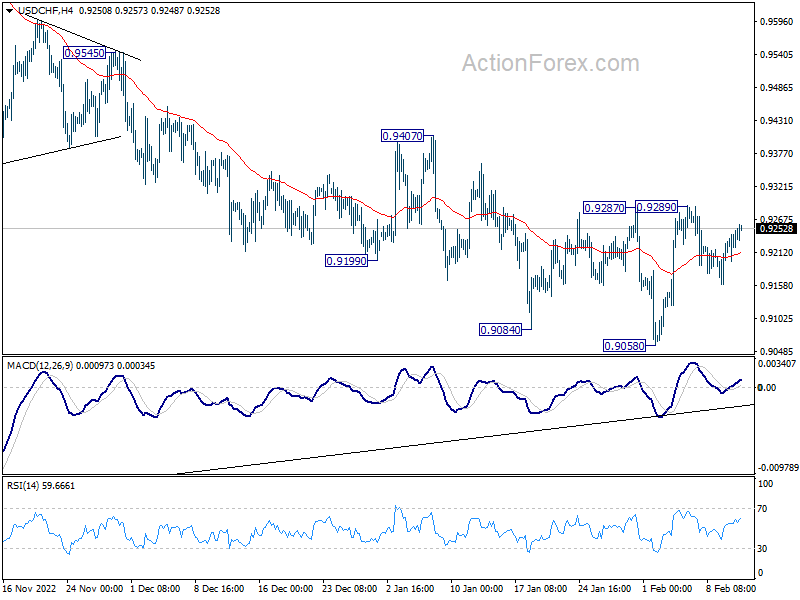
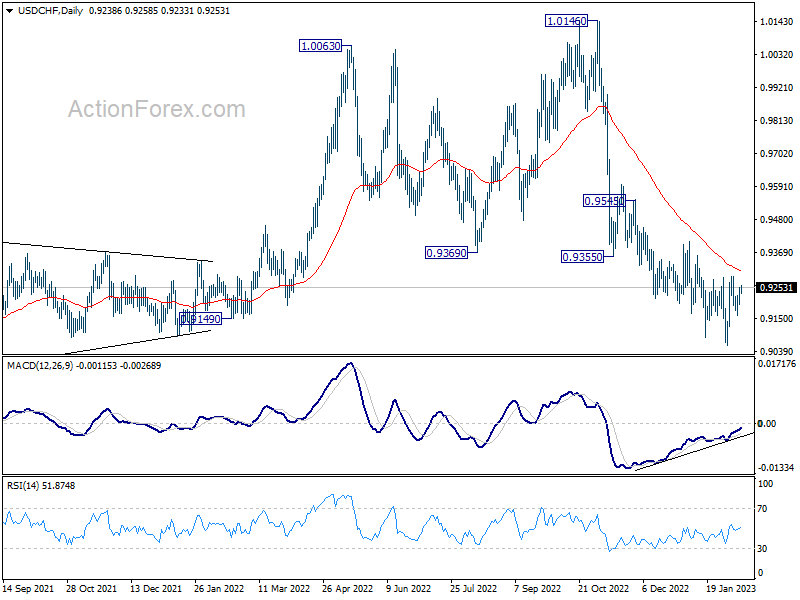
In the bigger picture, rise from 0.8756 (2021 low) has completed at 1.0146, well ahead of 1.0342 long term resistance (2016 high). Based on current downside momentum, fall from 1.0146 should be a medium term down trend itself. Next target is a test on 0.8756 low. Strong support should be seen there to bring rebound. Still, further decline will now be expected as long as 0.9407 resistance holds, in any case.
Technical Outlook and Review
USD/JPY:
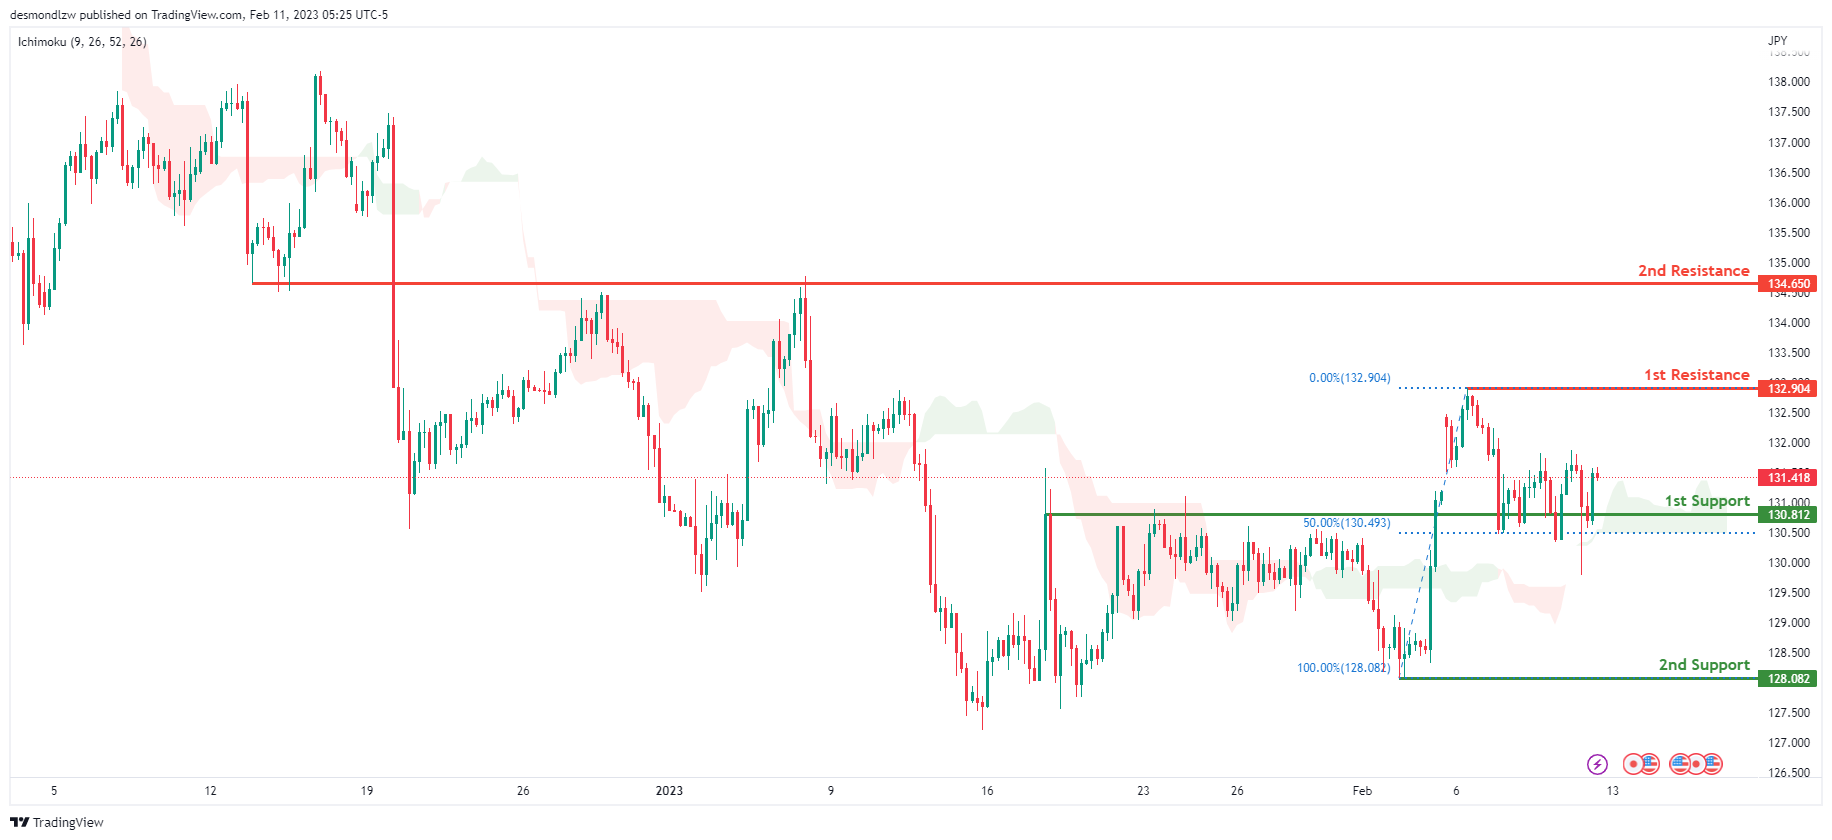
Looking at the H4 chart, my overall bias for USDJPY is bullish due to the current price crossing above the Ichimoku cloud, indicating a bullish market. If this bullish momentum continues, expect the price to possibly continue heading towards the 1st resistance at 132.904, where the recent high is. In an alternate scenario, price could possibly head back down to retest the 1st support at 130.812, where the overlap support and 50% Fibonacci line is.
Areas of consideration:
- H4 time frame, 1st resistance at 132.904
- H4 time frame, 1st support at 130.812
DXY:
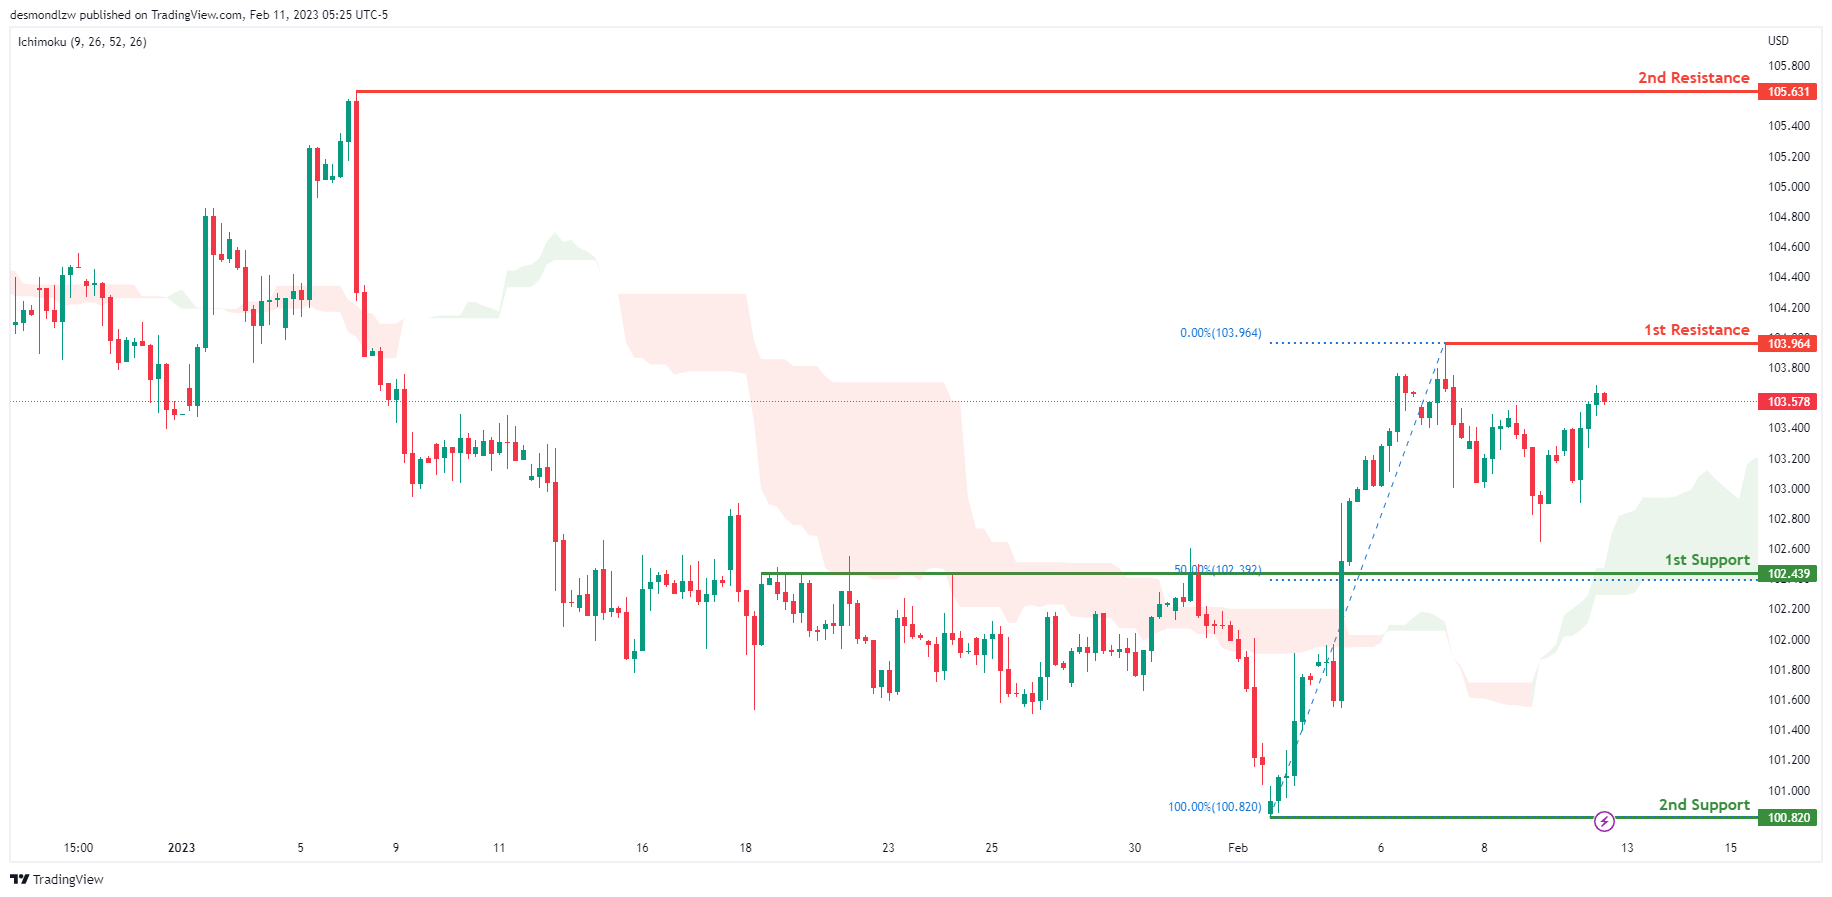
Looking at the H4 chart, my overall bias for DXY is bullish due to the current price crossing above the Ichimoku cloud, indicating a bullish market. If this bullish momentum continues, expect the price to possibly continue heading towards the 1st resistance at 103.964, where the previous swing high is. In an alternative scenario, price could head back down to retest the 1st support at 102.439, where the 50% Fibonacci line and overlap support is.
Areas of consideration:
- H4 time frame, 1st resistance at 103.964
- H4 time frame, 1st support at 99.241
EUR/USD:
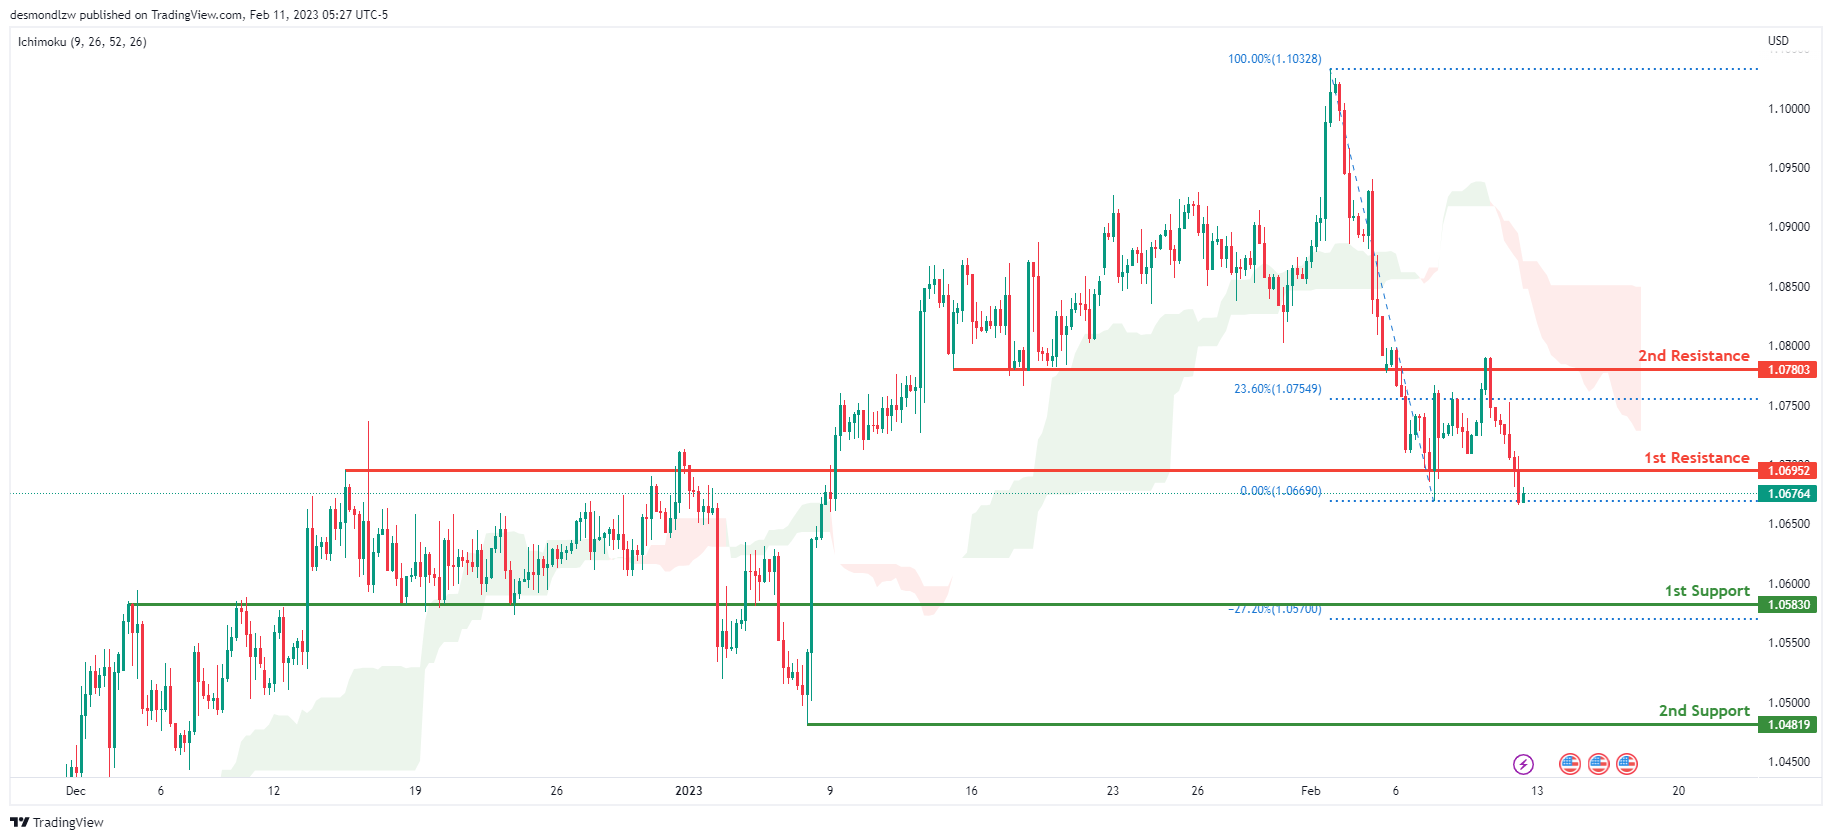
Looking at the H4 chart, my overall bias for EURUSD is bearish due to the current price crossing below the Ichimoku cloud, indicating a bearish market structure. If this bearish momentum continues, expect the price to possibly continue heading towards the 1st support at 1.05830, where the overlap support and -27.2% Fibonacci line is. In an alternate scenario, price could possibly head back up to retest the 1st resistance at 1.06952, where the overlap resistance is.
Areas of consideration :
- H4 1st resistance at 1.06952
- H4 1st support at 1.05830
GBP/USD:
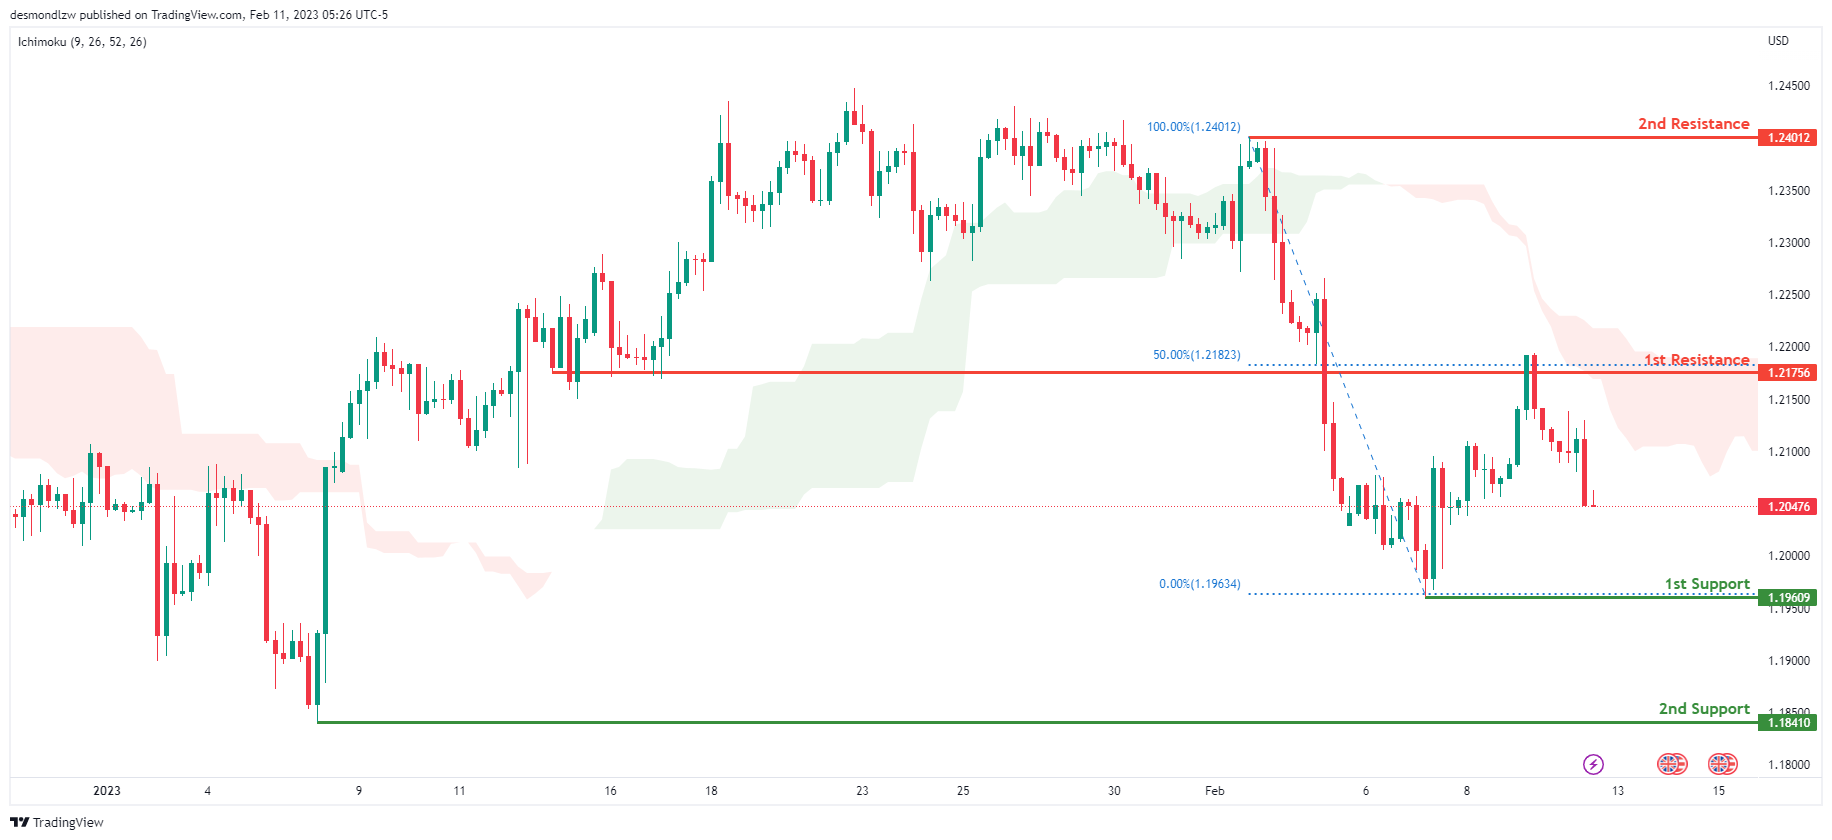
Looking at the H4 chart, my overall bias for GBPUSD is bearish due to the current price crossing below the Ichimoku cloud, indicating a bearish market. If this bearish momentum continues, expect the price to possibly continue to head towards the 1st support at 1.19609, where the recent swing low is. In an alternate scenario, price could head back up to retest the 1st resistance line at 1.21756 where the overlap resistance and 50% Fibonacci line is.
Areas of consideration:
- H4 1st resistance at 1.21756
- H4 1st support at 1.19609
USD/CHF:
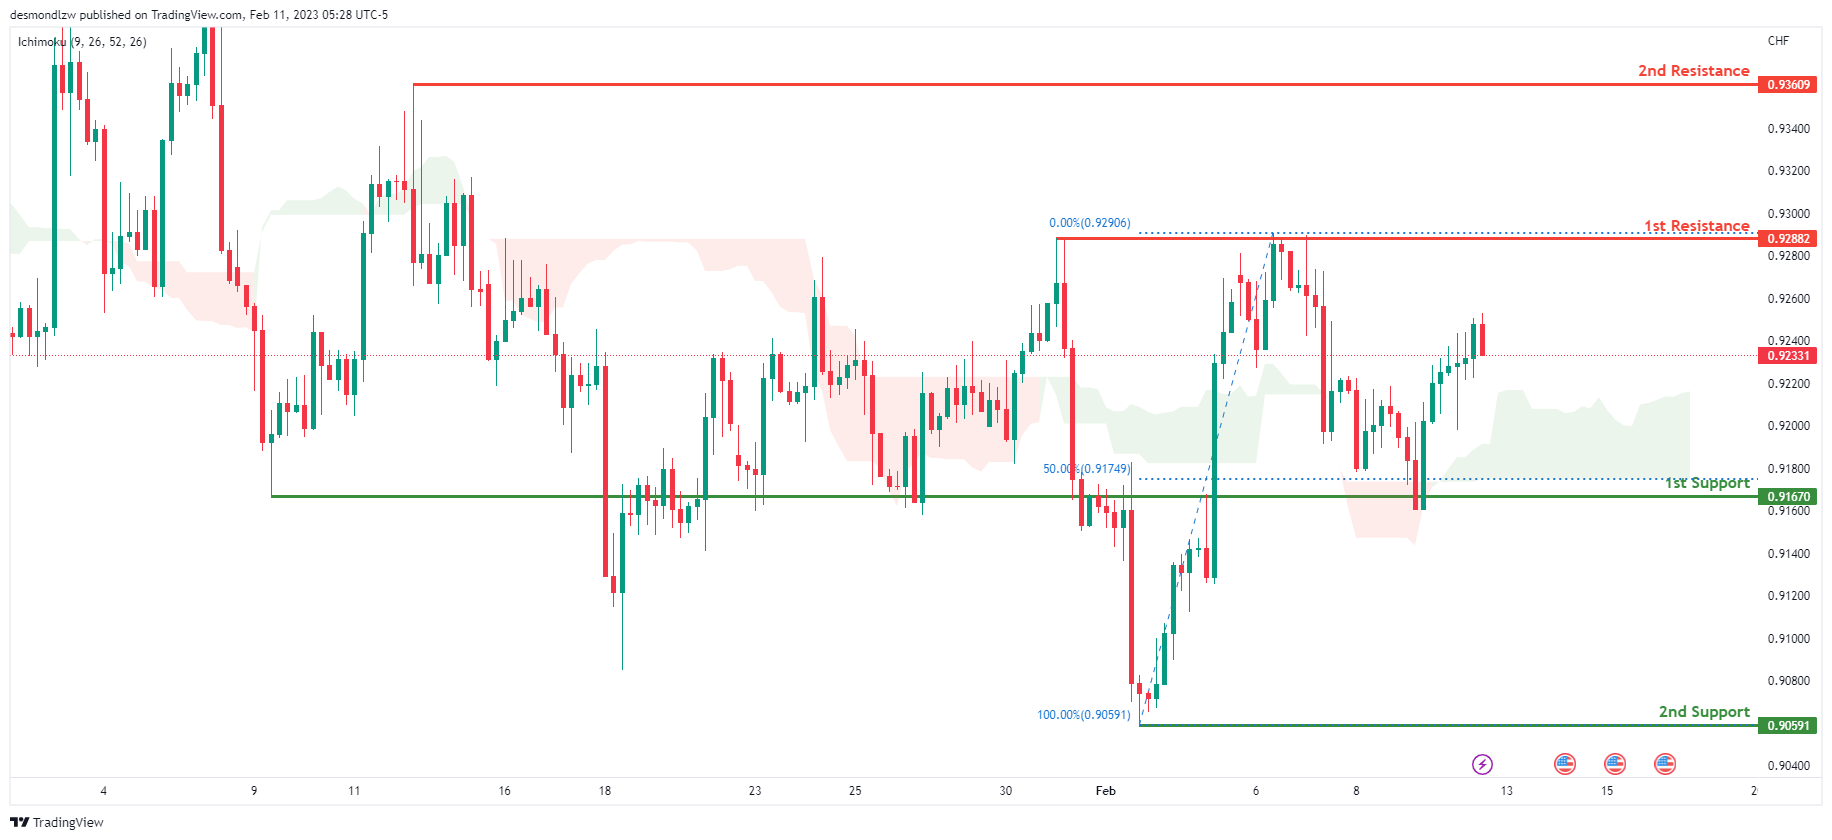
Looking at the H4 chart, my overall bias for USDCHF is bullish due to the current price being above the Ichimoku cloud, indicating a bullish market. If the current bullish trend continues, expect the price to possibly break the 1st resistance at 0.92882, where the previous swing high is, before heading towards the 2nd resistance at 0.93609 where the intermediate high is. In an alternative scenario, price could possibly head back down to retest the 1st support at 0.90591, where the recent swing low and 50% Fibonacci line is.
Areas of consideration
- H4 1st support at 0.90591
- H4 1st resistance at 0.92882
- H4 2nd resistance at 0.93609
XAU/USD (GOLD):
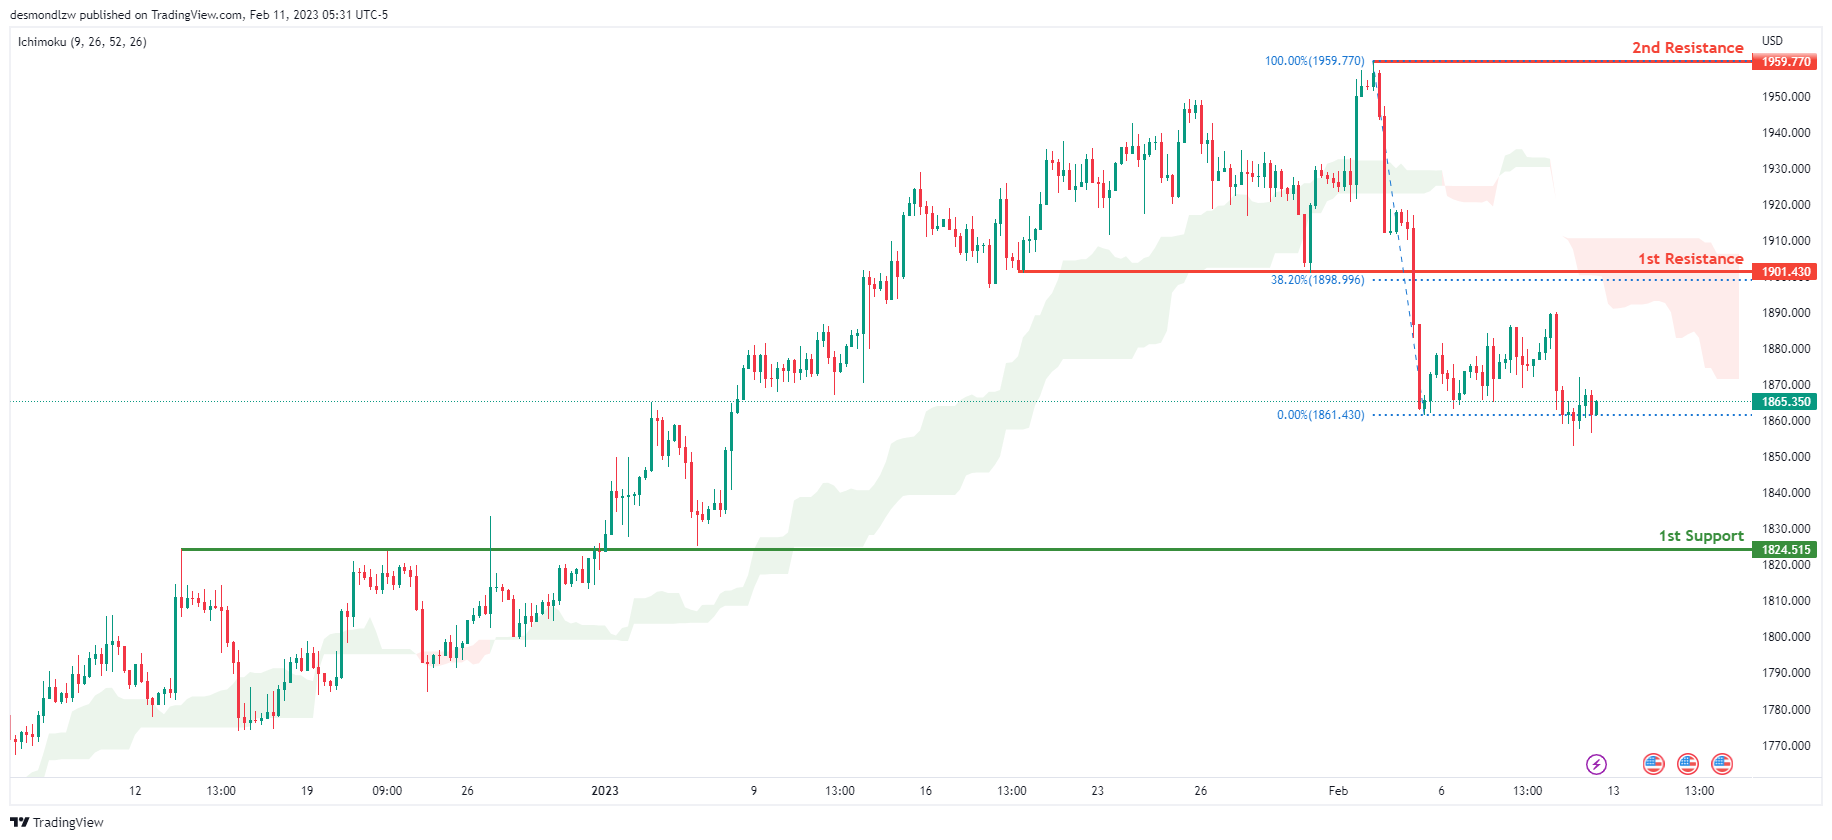
Looking at the H4 chart, my overall bias for XAUUSD is bearish due to the current price being below the Ichimoku cloud, indicating a bearish market. If this bearish momentum continues, expect the price to possibly continue heading towards the 1st support at 1824.515 where the overlap support is. In an alternative scenario, price could possibly head back up to retest the 1st resistance at 1901.430, where the overlap resistance and 38.2% Fibonacci line is.
Areas of consideration:
- H4 time frame, 1st resistance at 1901.430
- H4 time frame, 1st support at 1824.515
AUD/USD:
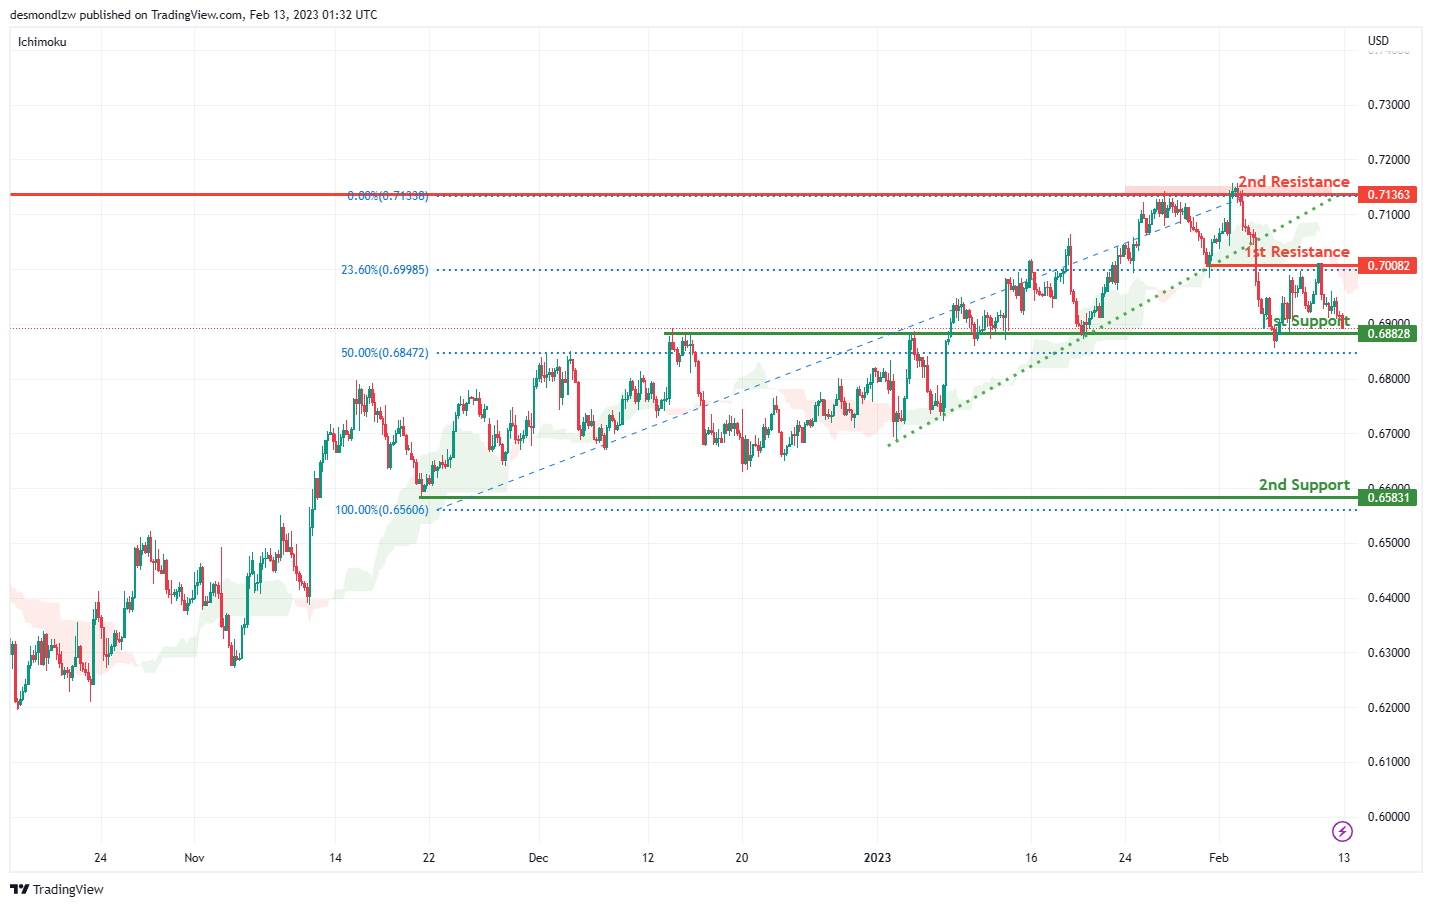
Looking at the H4 chart, my overall bias for AUDUSD is bearish due to the current price being below the Ichimoku cloud, and the ascending trend line has been broken, indicating a change of market structure.
The 1st support is at 0.68633 which is in line with the 50% Fibonacci retracement. The 2nd support is at 0.65831 which is the recent swing low.
In an alternate scenario, the price could possibly go back up towards the 1st resistance level at 0.70095 which is the recent swing high and in line with the 23.6% Fibonacci retracement. There is 2nd resistance at 0.71363 which is the previous swing high.
Areas of consideration
- H4. 2nd resistance at 0.71363
- H4. 1st resistance at 0.70095
- H4, 1st support at 0.68633
- H4, 2nd support at 0.65831
NZD/USD:
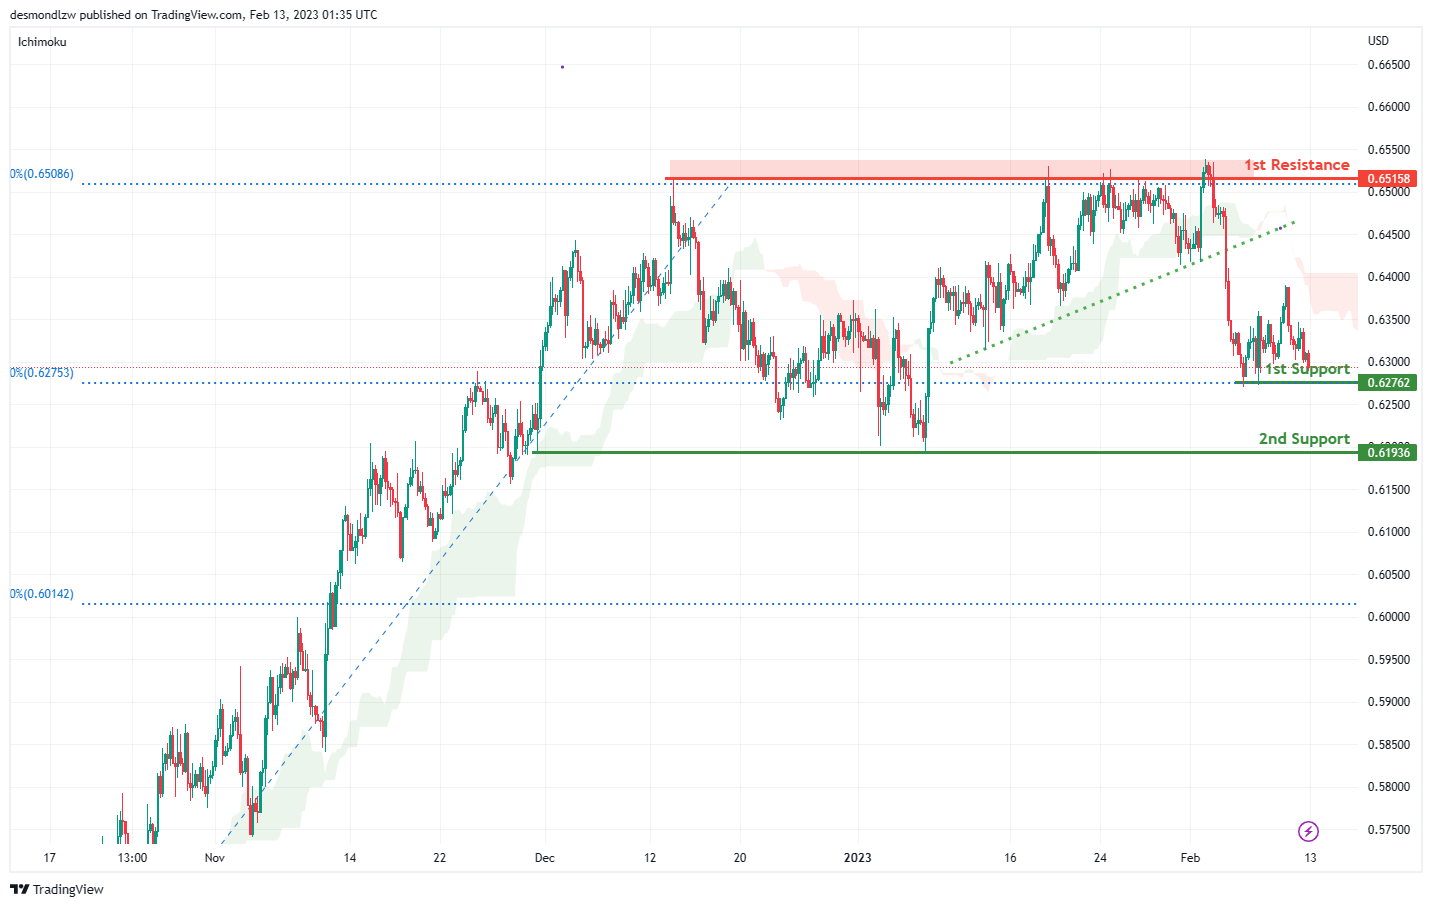
Looking at the H4 chart, my overall bias for NZDUSD is bearish, as the current price is below the Ichimoku Cloud, and the ascending trend line has been broken, indicating a change of market structure. Expecting the price to go down towards the 1st support at 0.62762 which is the recent overlap swing low. It is also inline with 23.6% Fibonacci retracement. The 2nd support is at 0.61936.
In an alternate scenario, price could possibly go up towards the 1st resistance level at 0.65158 which is the recent overlap swing high. There is an intermediate resistance at 0.63636 which is in line with 50% Fibonacci retracement.
Areas of consideration:
- H4 time frame, 1st resistance at 0.65158
- H4 time frame, intermediate resistance at 0.65158
- H4 time frame, 1st support at 0.62762
- H4 time frame, 2nd support at 0.61936
USD/CAD:
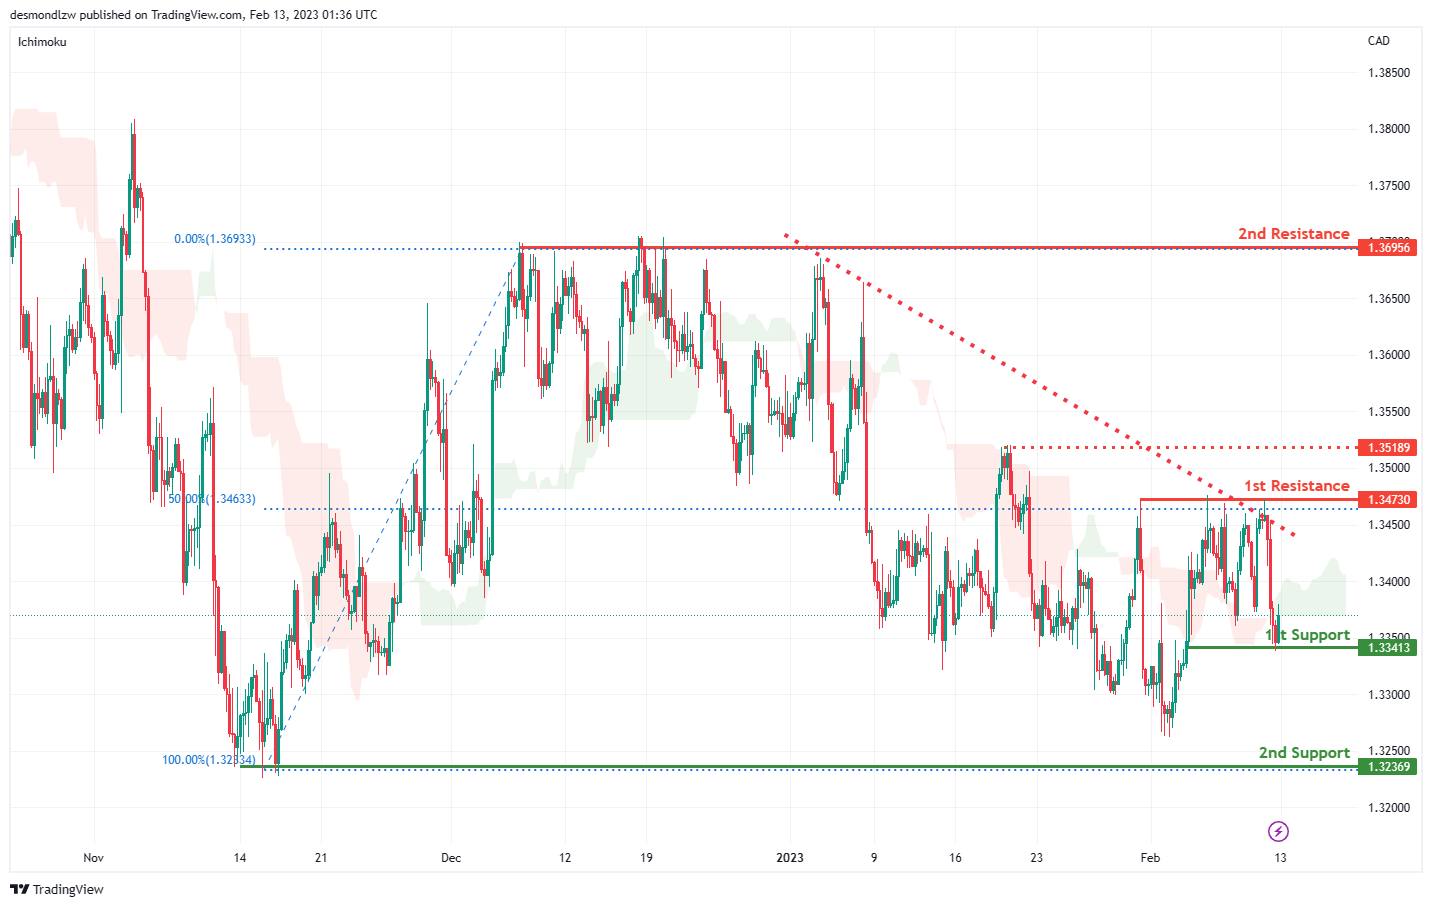
Looking at the H4 chart, my overall bias for USDCAD is bearish , as there is a descending trend line. Expecting the current price is head down towards the 1st support at 1.33413 which is the recent swing low. The 2nd support is at 1.32369 which is the previous swing low.
In an alternative scenario, the price could possibly head up to the 1st resistance at 1.34730 which is the recent swing high and also in line with the 50% Fibonacci retracement. The 2nd resistance is at 1.36933 which is the previous swing high.
Areas of consideration:
- H4 time frame, 2nd resistance at 1.36933
- H4 time frame, 1st resistance at 1.34730
- H4 time frame, 1st support at 1.33413
- H4 time frame, 2nd support at 1.32369
OIL:
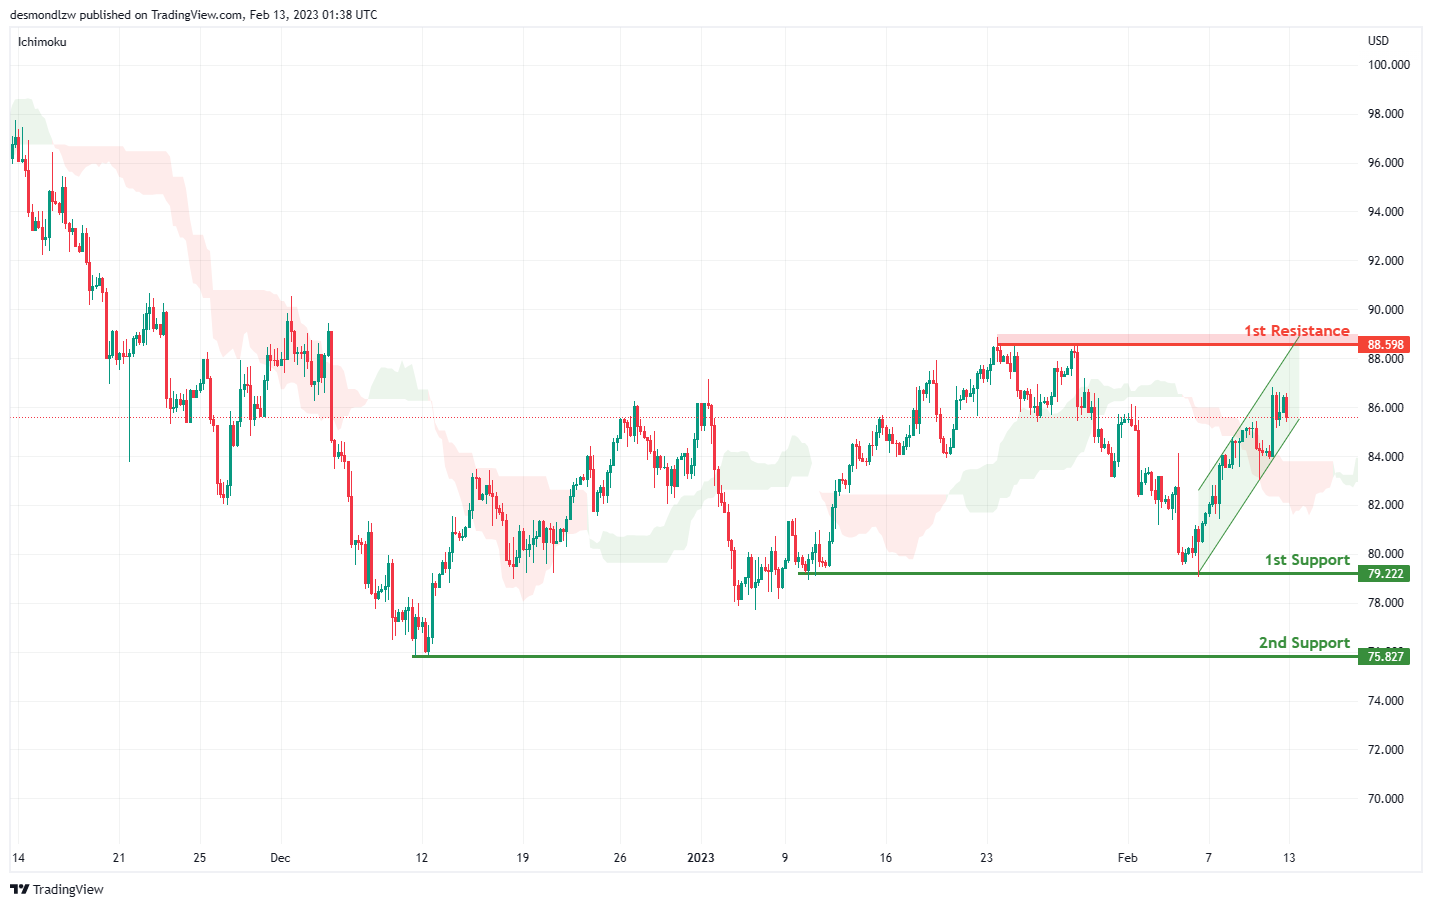
Looking at the H4 chart, my overall bias for BOC is bullish.as the there is an ascending channel, Expecting the price head up towards the 1st resistance level at 88.598 which is the recent swing high.
In an alternate scenario, the price could possibly head down towards the 1st support level at 79.222 which is the recent overlap swing low, before the price drops to the 2nd support at 75.827.
Areas of consideration:
- H4 time frame, 1st resistance at 88.598
- H4 time frame,1st support at 79.587
- H4 time frame, 2nd support at 75.827
Dow Jones Industrial Average:
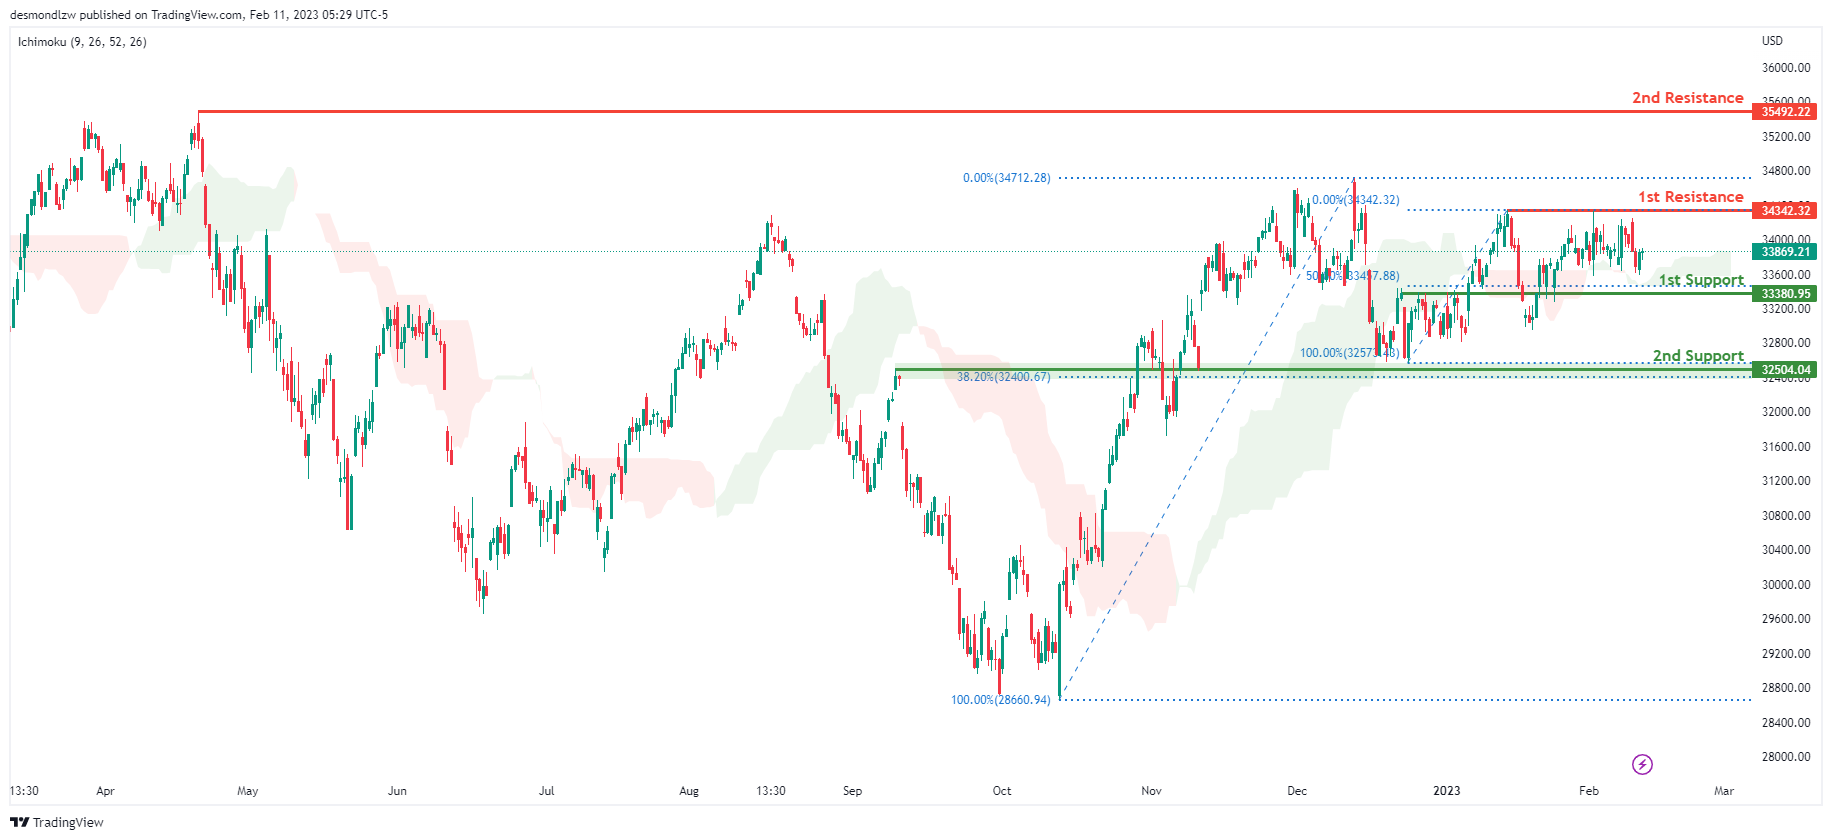
On the H4 chart, the overall bias for DJI is bullish. To add confluence to this, the price is crossing above the Ichimoku cloud which indicates a bullish market. If this bullish momentum continues, expect the price to possibly continue heading towards the 1st resistance line at 34342.32, where the recent swing high is. In an alternative scenario, price could possibly head back down towards the 1st support at 33380.95, where the 50% Fibonacci line is.
Areas of consideration:
- H4 time frame, 1st support at 33380.95
- H4 time frame, 1st Resistance at 34342.32
DAX:
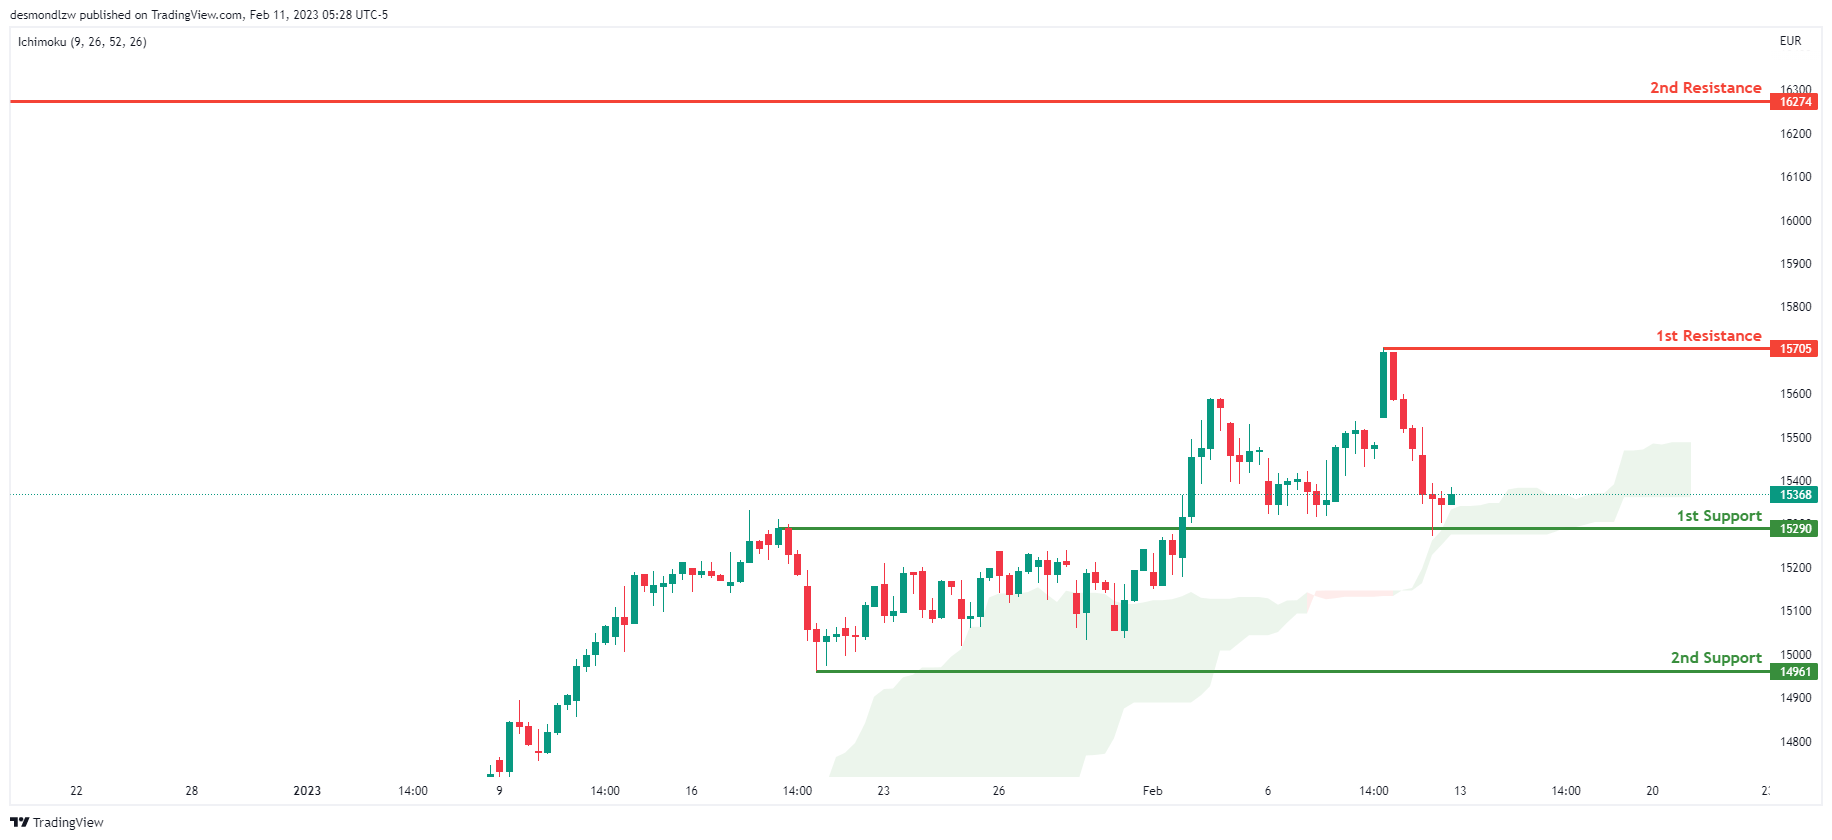
Looking at the H4 chart, my overall bias for DAX is bullish due to the current price crossing above the Ichimoku cloud, indicating a bullish market. If this bullish momentum continues, expect the price to possibly head towards the 1st resistance line at 15705, where the recent high is. In an alternative scenario, price could possibly head down to retest the 1st support at 15290, where the overlap support is.
Areas of consideration:
- H4 time frame, 1st resistance is at 15705
- H4 time frame, 1st support is at 15290
ETHUSD:
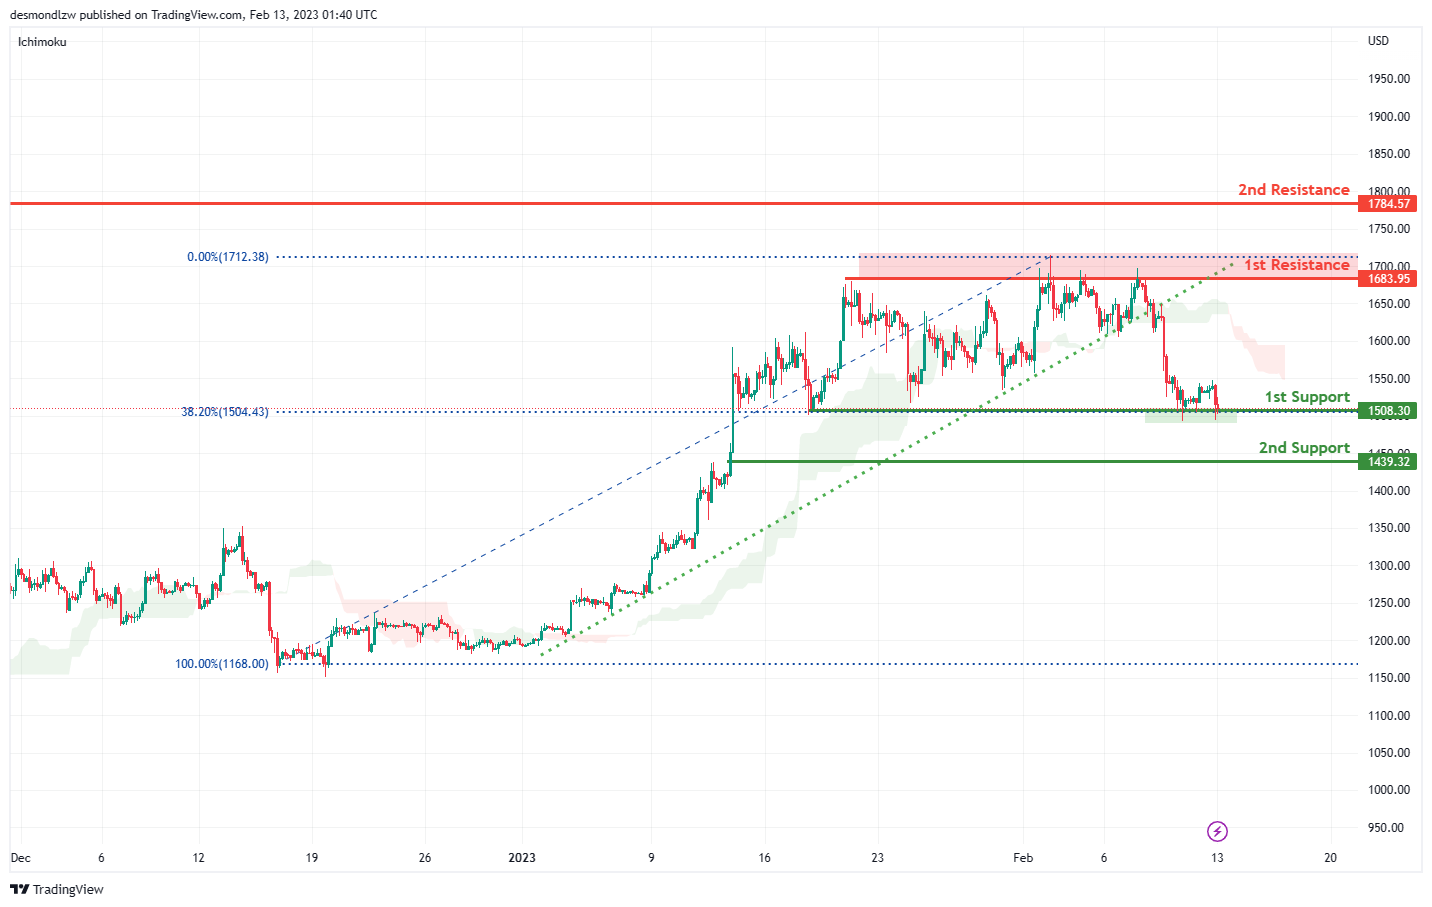
Looking at the H4 chart, my overall bias for ETHUSD is slightly bearish, the strong ascending trend line has been broken. Expecting the price to go down to break the 1st support line at 1508.30 which is the recent swing low, before it heads towards the 2nd support at 1439.32 which is in line with 50% Fibonacci retracement.
In an alternate scenario, the price may go up and break the 1st resistance line at 1683.95 before breaking the 2nd resistance line at 1784.57 which is the recent swing high.
Areas of consideration:
- H4 time frame, 2nd resistance of 1784.57
- H4 time frame, 1st resistance of 1683.95
- H4 time frame, 1st support at 1508.30
- H4 time frame, 2nd support at 1439.32
BTCUSD:
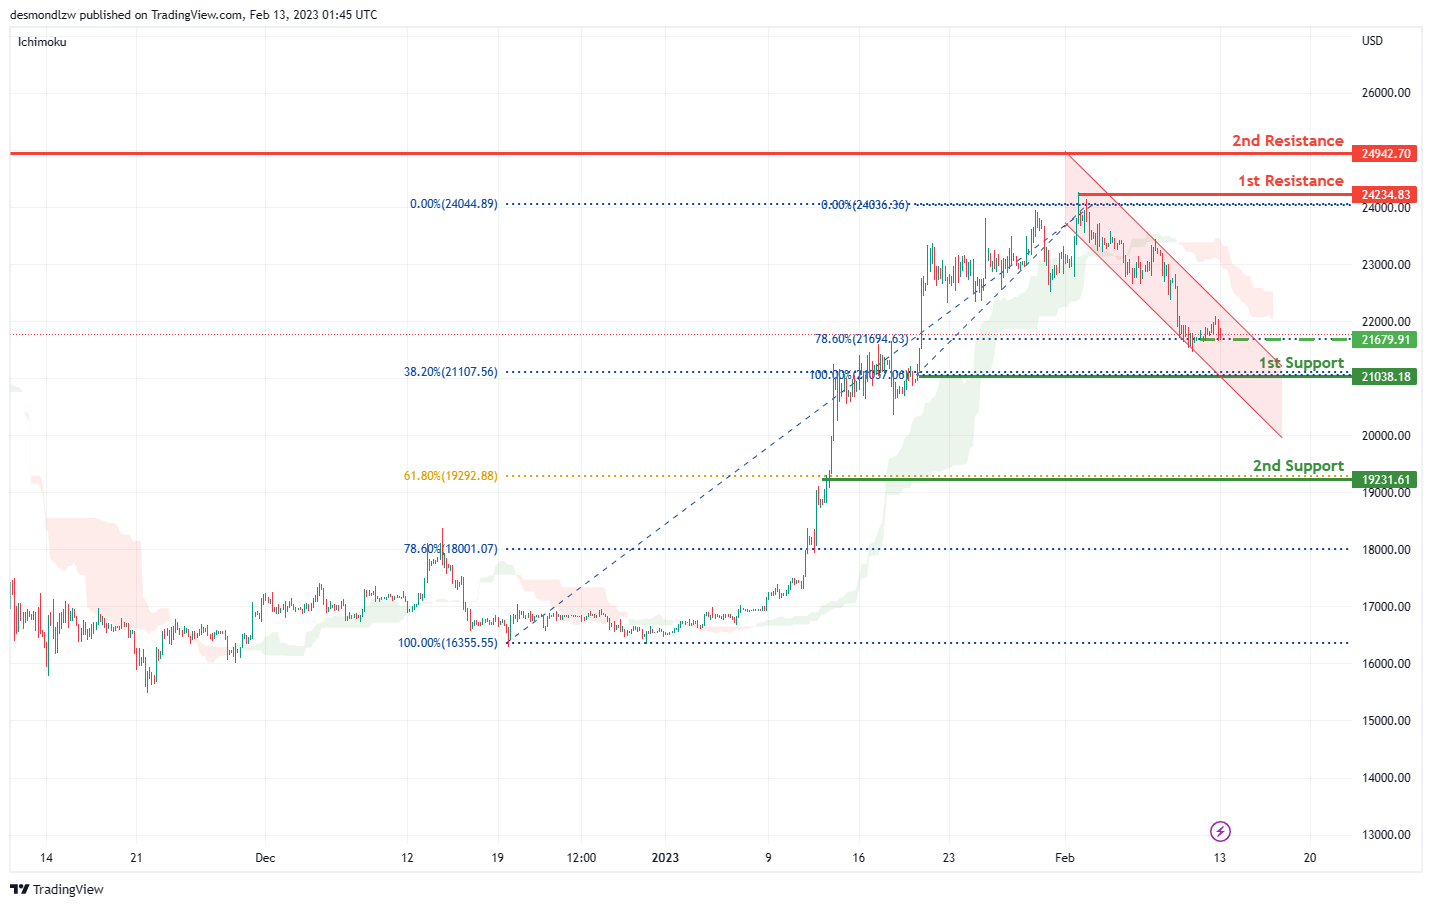
Looking at the H4 chart, my overall bias for BTCUSD is bearish. An ascending channel has broken, a descending channel was created, expecting the price to break the 1st support line at 20698.01 which is in line with 38.2% Fibonacci retracement, before heading down towards the 2nd support at 19231.61 which is in line with 61.8% Fibonacci retracement. There is an intermediate support at 21679.91 which is in line with 78.6% Fibonacci retracement.
In an alternative scenario, the price could possibly head up to the 1st resistance at 24234.83 which is the recent swing high.
Areas of consideration:
- H4 time frame, 2nd resistance 24942.70
- H4 time frame, 1st resistance 24234.83
- H4 time frame, intermediatesupport at 21679.91
- H4 time frame, 1st support at 20698.01
- H4 time frame, 2nd support at 19231.61
S&P 500:
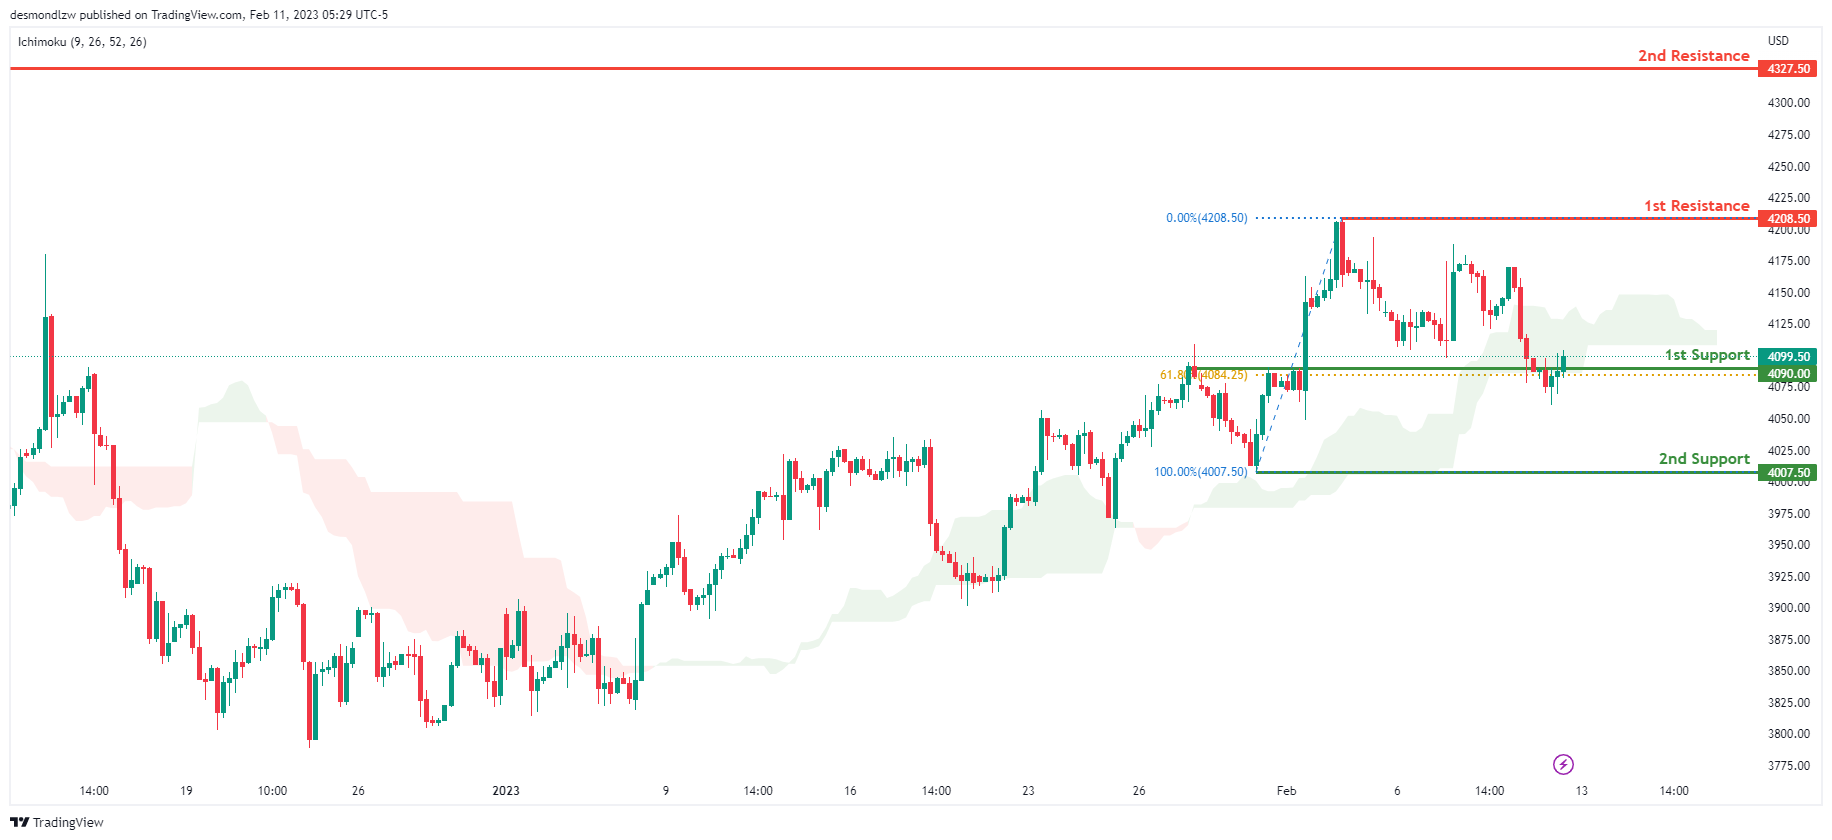
Looking at the H4 chart, my overall bias for S&P500 is bullish due to the current price being above the Ichimoku cloud, indicating a bullish market. If this bullish momentum continues, expect the price to possibly break the 1st resistance at 4208.50, where the recent swing high is., before heading towards the 2nd resistance at 4327.50 where the previous swing high is, In an alternative scenario, price could possibly head back down to retest the 1st support at 4090.00, where the 50% Fibonacci line is.
Areas of consideration:
- H4 time frame, 1st support at 4090.00
- H4 time frame, 1st resistance at 4208.50
- H4 time frame, 2nd resistance at 4327.50
USD/JPY Daily Outlook
Daily Pivots: (S1) 130.21; (P) 131.04; (R1) 132.28; More...
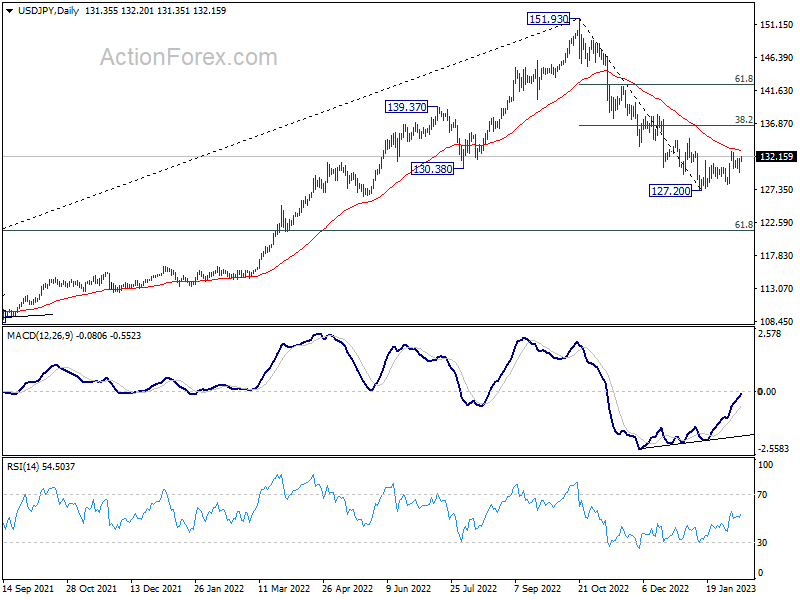
USD/JPY's break of 131.88 minor resistance suggests that pull back from 132.89 has completed at 129.79 already. Intraday bias is back on the upside for 132.89 first. Break there will resume whole rebound from 127.20. Further rally should then be seen to 38.2% retracement of 151.93 to 127.20 at 136.64, even as a correction to the decline from 151.39. For now, further rally is in favor as long as 129.79 support holds, in case of retreat.
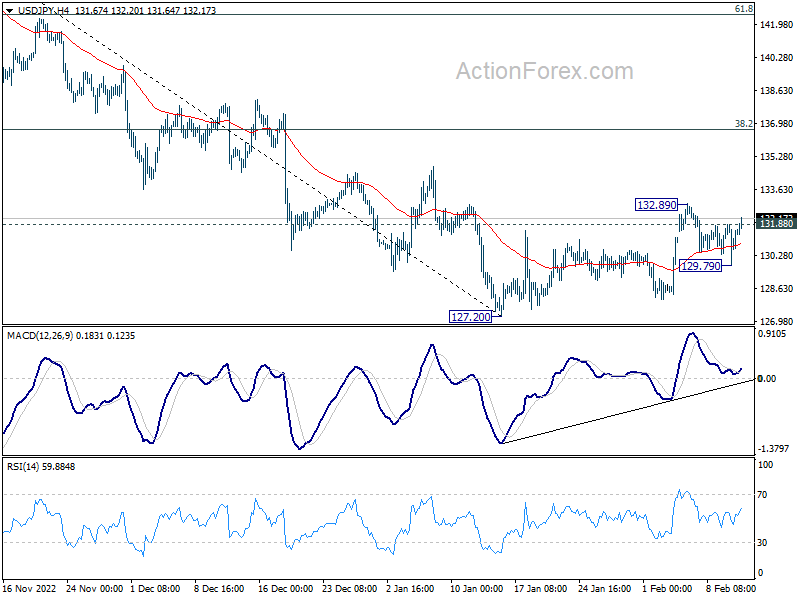
In the bigger picture, prior of 55 week EMA (now at 131.47) raises the chance of medium term bearish reversal, but that's not confirmed yet. Strong rebound from current level, followed by sustained break of 38.2% retracement of 151.93 to 127.20 at 136.64 will argue that price actions from 151.93 is merely a corrective pattern. However, rejection by 136.64 will solidify medium term bearishness for 61.8% retracement of 102.58 to 151.93 at 121.43 and 38.2% retracement of 75.56 to 151.93 at 122.75.
Dollar Rises as Focus Turns to CPI This Week, Yen Down ahead of BoJ Nomination
Dollar rises broadly in Asian session as helped by mild risk aversion. Nikkei hits a 2-week love as heavyweight technology stocks slip. Yen softens at the same time, after a former staff of the top runner for BoJ Governor Kazuo Ueda said he's neither hawkish nor dovish, but data dependent. Kiwi and Euro are following the greenback as next stronger. Canadian and Swiss Franc follow Yen as next weakest. Overall, much volatility is expected in the week with BoJ Governor hearing in parliament, US and UK CPI data.
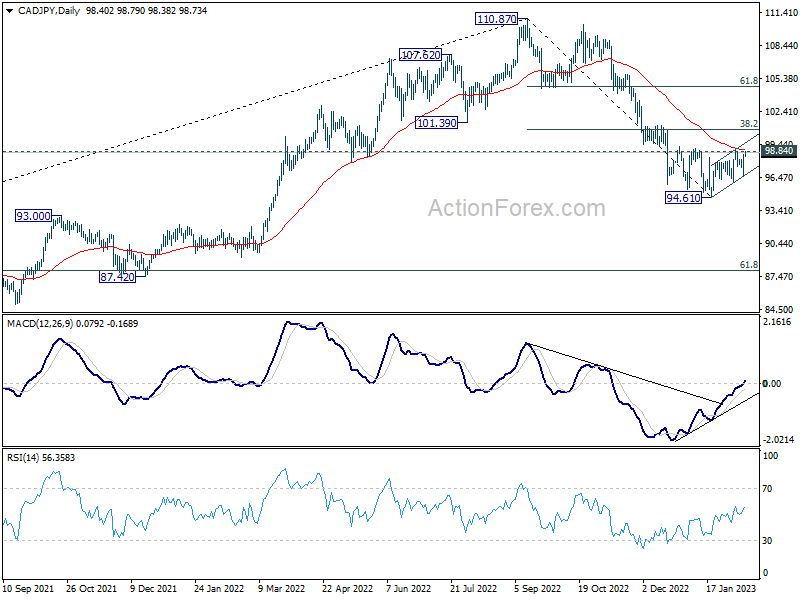
Technically, CAD/JPY looks ready to resume the choppy recovery from 94.61. Break of 98.84 resistance will bring stronger rise to 38.2% retracement of 110.87 to 94.61 at 100.82, even as a corrective move. The development, if happens, should be accompanied by break of 132.89 resistance in USD/JPY. A question is whether EUR/JPY and GBP/JPY would follow by breaking through 147.79 and 161.80 respectively.
In Asia, at the time of writing, Nikkei is down -1.05%. Hong Kong HSI is down -0.47%. China Shanghai SSE is up 0.53%. Singapore Strait Times is down -0.75%. Japan 10-year JGB yield is up 0.0083 at 0.499.
ECB Visco: Tightening should continue in a progressive but measured way
ECB Governing Council member Ignazio Visco said on Saturday, interest rates must continue to rise "in a progressive but measured way, on the basis of the incoming data and their use in the assessment of the inflation outlook". But when asked how far interest rates could rise, he replied "we don't know".
Visco also said, "today, disinflation is obviously needed, but given the levels of private and public debts that prevail in the euro area, we must be careful to avoid engineering an unnecessary and excessive rise in real interest rates."
"Indeed, I am convinced that the credibility of our actions is preserved not by flexing our muscles in the face of inflation, but by continually showing wisdom and balance."
NZ BusinessNZ services rose to 54.5, but negative comments trend higher
New Zealand BusinessNZ Performance of Services Index rose from 52.0 to 54.5 in January. Looking at some details, activity/sales rose form 51.9 to 52.1. Employment rebounded strongly from 46.9 to 51.9. New orders/business dropped from 57.7 to 54.5. Stocks/inventories rose from 51.6 to 54.3. Supplier deliveries dropped from 53.9 to 52.0.
BusinessNZ chief executive Kirk Hope said: "Despite the halt in lower expansionary levels, the trend of a higher proportion of negative comments continued in January (61.7%), compared with 58.2% in December and 47.3% in November. The holiday season was a common theme, along with the shortage of labour and general market uncertainty that has been evident for some months now".
BNZ Senior Economist Doug Steel said that "as encouraging as January's PSI result might look, we are reluctant to read too much into one month's result – especially around the holiday period".
CPI to take center stage again
Consumer inflation data will once again take center stage this week, with CPI from Swiss, US and UK featured. Additionally, US and UK will publish retail sales. Australia and UK will release employment data.
In terms of central bank activities, main focus will be on nomination of the next BoJ Governor and Deputies. ECB will publish monthly economic bulletin.
Here are some highlights for the week:
- Monday: New Zealand BusinessNZ Services; Swiss CPI.
- Tuesday: Japan GDP; Australia NAB business confidence; New Zealand inflation expectations; UK employment; Swiss PPI; Eurozone GDP revision, employment change; US CPI.
- Wednesday: Japan tertiary industry index; UK CPI, RPI; Eurozone industrial production, trade balance; Canada housing starts, manufacturing sales, wholesale sales; US retail sales, Empire State manufacturing, industrial production, business inventories, NAHB housing index.
- Thursday: Japan trade balance, machinery orders; Australia employment; ECB monthly bulletin; US PPI, Philly Fed manufacturing, jobless claims, housing starts and building permits.
- Friday: UK retail sales; current account; Canada IPPI and RMPI; US import prices.
USD/JPY Daily Outlook
Daily Pivots: (S1) 130.21; (P) 131.04; (R1) 132.28; More...
USD/JPY's break of 131.88 minor resistance suggests that pull back from 132.89 has completed at 129.79 already. Intraday bias is back on the upside for 132.89 first. Break there will resume whole rebound from 127.20. Further rally should then be seen to 38.2% retracement of 151.93 to 127.20 at 136.64, even as a correction to the decline from 151.39. For now, further rally is in favor as long as 129.79 support holds, in case of retreat.
In the bigger picture, prior of 55 week EMA (now at 131.47) raises the chance of medium term bearish reversal, but that's not confirmed yet. Strong rebound from current level, followed by sustained break of 38.2% retracement of 151.93 to 127.20 at 136.64 will argue that price actions from 151.93 is merely a corrective pattern. However, rejection by 136.64 will solidify medium term bearishness for 61.8% retracement of 102.58 to 151.93 at 121.43 and 38.2% retracement of 75.56 to 151.93 at 122.75.
Economic Indicators Update
| GMT | Ccy | Events | Actual | Forecast | Previous | Revised |
|---|---|---|---|---|---|---|
| 21:30 | NZD | BusinessNZ Services Index | 54.5 | 52.1 | 52 | |
| 07:30 | CHF | CPI M/M Jan | 0.50% | -0.20% | ||
| 07:30 | CHF | CPI Y/Y Jan | 2.70% | 2.80% |