Sample Category Title
Aussie Down as China Unrest Triggers Risk Aversion
Yen and Dollar rise broadly in Asian session today while Australian Dollar leads commodity currencies lower. Markets are trading with risk-off sentiment, with deeper selloff in China and Hong Kong markets. Large scale protests were carried out in multiple cities in China over the weekend, and the theme has escalated from anti-lockdown to anti-President Xi Jinping and the Chinese Communist Party. The development in China will be a key factor for sentiment over the next few days, along with US job data and Eurozone inflation later in the week.
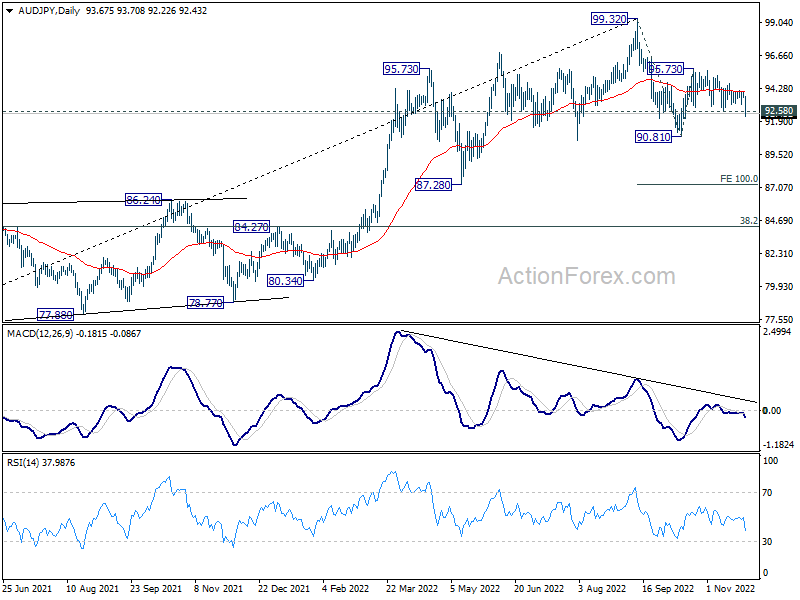
Technically, the break of 92.58 minor support in AUD/JPY suggests that recovery from 90.81 has completed after failing to sustain above 55 day EMA. Deeper decline is now in favor back to retest 90.81 first. Firm break there will extend the decline from 99.32, as a correction to larger up trend from 2020 low at 59.85. Next target is 100% projection of 99.32 to 90.81 from 95.73 at 87.22.
In Asia, Nikkei dropped -0.42%. Hong Kong HSI is down -2.15%. China Shanghai SSE is down -1.39%. Singapore Strait Times is down -0.52%. Japan 10-year JGB yield dropped -0.0053 to 0.255.
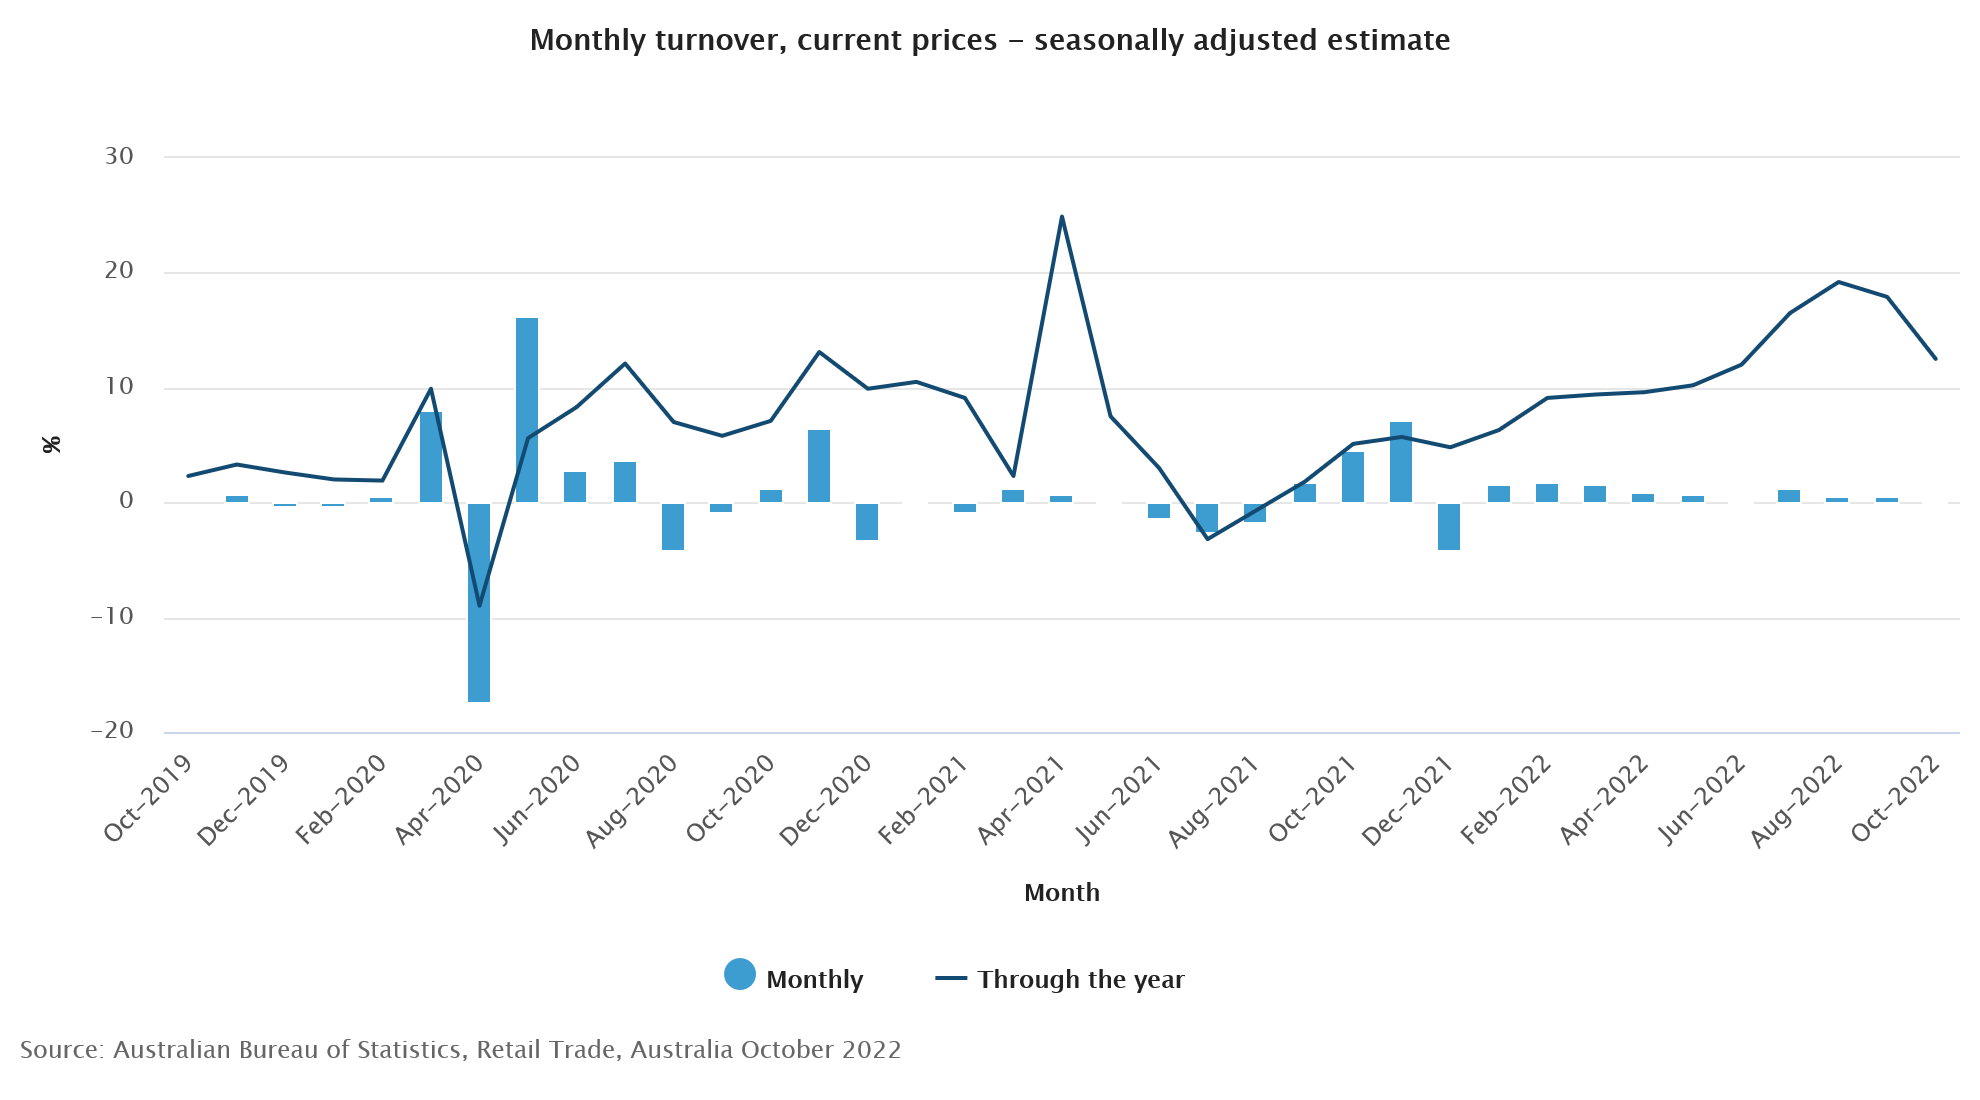
Australia retail sales fell -0.2% mom in Oct, first decline this year
Australia retail sales turnover dropped -0.2% mom to AUD 35.02B in October, much worse than expectation of 0.5% mom rise. That's also the first monthly decline in 2022.
Ben Dorber, ABS head of retail statistics said: "The October fall in retail turnover ends a run of nine straight monthly rises and suggests increased cost of living pressures including interest rate rises have started to weigh on consumer spending."
"Turnover fell in all industries in October except for food retailing, which rose 0.4 per cent boosted by flood-related spending in parts of Australia and continued high food prices."
RBA Lowe: Best outcome is for wages to pick up but not too much further
RBA Governor Philip Lowe told a parliamentary committee that the central bank is keeping an eye on electricity prices and housing. "If we can address those two issues then that will make a substantial contribution in bringing inflation back down over the next couple of years," he said.
Also, he added that a massive spike in wages would make it harder to bring inflation down. "If wage growth was 7 or 8 per cent then inflation would be 6 or 7 per cent … we were in this world in the 1970s and it worked out very badly," Lowe said. "The best outcome for the country is for wages to pick up but to not go too much further."
RBNZ Silk: The persistence factor of inflation was most surprising
RBNZ Assistant Governor Karen Silk said in an interview, "What we have seen is actual inflation continue to surprise on the upside, but more importantly inflation expectations have moved higher as well... And it's the persistence factor that has probably been the most surprising."
On tightening, "obviously we started way earlier than other central banks, so other central banks had to move an awful lot faster basically to play catch up," she said. "So no, I don't believe that the MPC has dilly-dallied around on this at all."
"If the information shows that we've reached that peak (5.5% interest rate) and we see that turn and we're starting to see real impacts on inflation and inflation expectations, then that does offer us the opportunity to revisit," she said.
US NFP and Eurozone CPI to confirm size of Dec rate hikes
Job data from the US and inflation data from Eurozone are the biggest events this week. Both could be the final piece of data that decide the size of rate hikes of Fed and ECB. In addition, US will release consumer confidence, ISM manufacturing, and PCE inflation.
Elsewhere data to be watched include Japan industrial production and retail sales, Swiss GDP and CPI, Canada GDP, New Zealand ANZ business confidence, and China PMIs.
Here are some highlights for the week:
- Monday: Australia retail sales; Eurozone M3 money supply; Canada current account.
- Tuesday: Japan unemployment rate, retail sales; Germany CPI flash; Swiss GDP; UK M4 money supply, mortgage approvals; Canada GDP; US house price index, consumer confidence.
- Wednesday: New Zealand ANZ business confidence; Australia building approvals, construction work done; Japan industrial production, housing starts; China PMIs; France consumer spending, GDP revision; Swiss KOF; Germany unemployment; Eurozone CPI flash; US ADP employment; GDP revision, goods trade balance, Chicago PMI, pending home sales, Fed Beige Book.
- Thursday: Australia AiG manufacturing, private capital expenditure; Japan PMI manufacturing final, capital spending, consumer confidence; China Caixin PMI manufacturing; Germany retail sales; Swiss CPI, retail sales; Eurozone PMI manufacturing final, unemployment rate; UK PMI manufacturing final; US Challenger job cuts, jobless claims, personal income and spending, ISM manufacturing, construction spending.
- Friday: New Zealand terms of trade; Japan monetary base; Germany import prices, trade balance; Eurozone PPI; Canada employment; US non-farm payroll.
USD/CAD Daily Outlook
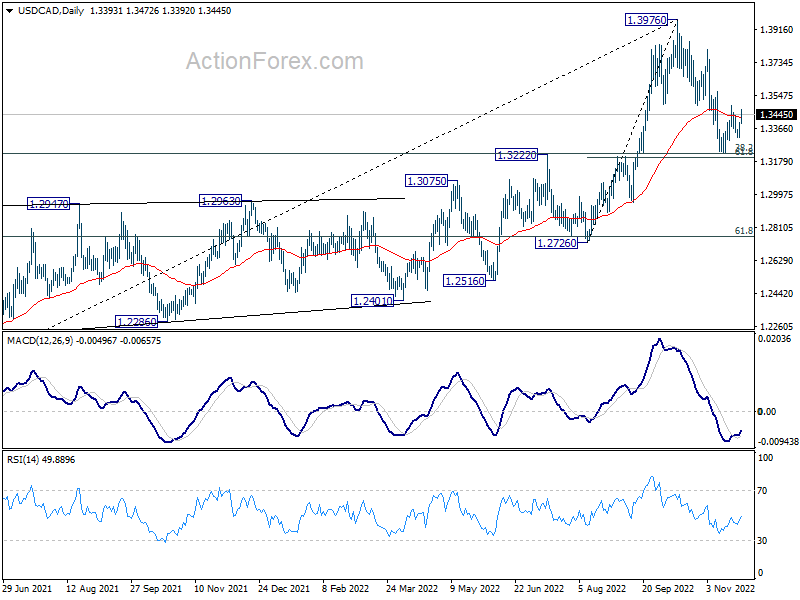
Daily Pivots: (S1) 1.3332; (P) 1.3366; (R1) 1.3414; More....
Intraday bias in USD/CAD stays neutral for the moment. On the upside, firm break of 1.3494 will indicate that correction from 1.3976 has completed at 1.3224, ahead of 1.3207 cluster support (61.8% retracement of 1.2726 to 1.3976 at 1.3204). Intraday bias will be turned back to the upside for 1.3807/3976 resistance zone. However, on the downside, sustained break of 1.3204/7 will carry larger bearish implication and target 1.2952 support next.
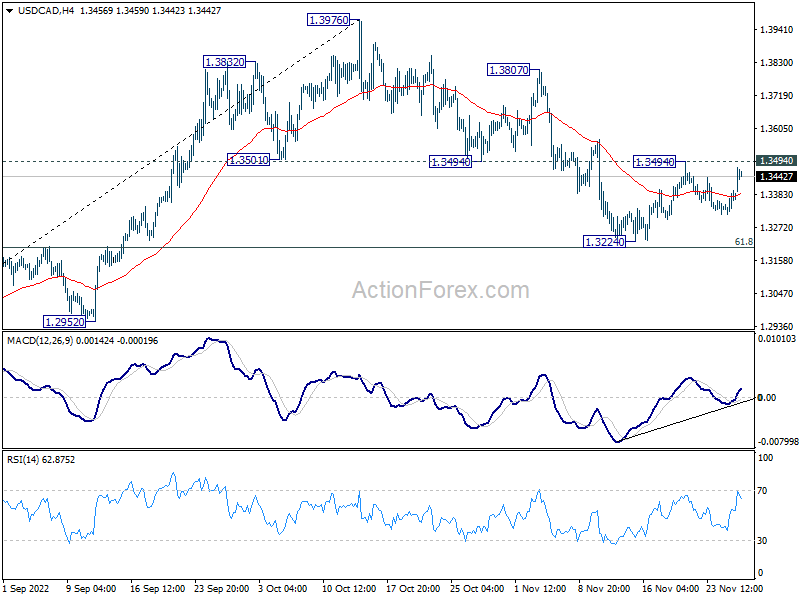
In the bigger picture, as long as 1.3222 cluster support (38.2% retracement of 1.2005 to 1.3976 at 1.3223) holds, larger up trend from 1.2005 (2021 low) is still expected to resume through 1.3976 high at a later stage. However, firm break of 1.3222/3 will indicate that the trend might have reversed. Deeper fall would be seen to next cluster support at 1.2726 (61.8% retracement at 1.2758).
Economic Indicators Update
| GMT | Ccy | Events | Actual | Forecast | Previous | Revised |
|---|---|---|---|---|---|---|
| 00:30 | AUD | Retail Sales M/M Oct | -0.20% | 0.50% | 0.60% | |
| 09:00 | EUR | Eurozone M3 Money Supply Y/Y Oct | 6.50% | 6.30% | ||
| 13:30 | CAD | Current Account (CAD) Q3 | -4.0B | 2.7B |
RBNZ Silk: The persistence factor of inflation was most surprising
RBNZ Assistant Governor Karen Silk said in an interview, "What we have seen is actual inflation continue to surprise on the upside, but more importantly inflation expectations have moved higher as well... And it's the persistence factor that has probably been the most surprising."
On tightening, "obviously we started way earlier than other central banks, so other central banks had to move an awful lot faster basically to play catch up," she said. "So no, I don't believe that the MPC has dilly-dallied around on this at all."
"If the information shows that we've reached that peak (5.5% interest rate) and we see that turn and we're starting to see real impacts on inflation and inflation expectations, then that does offer us the opportunity to revisit," she said.
RBA Lowe: Best outcome is for wages to pick up but not too much further
RBA Governor Philip Lowe told a parliamentary committee that the central bank is keeping an eye on electricity prices and housing. "If we can address those two issues then that will make a substantial contribution in bringing inflation back down over the next couple of years," he said.
Also, he added that a massive spike in wages would make it harder to bring inflation down. "If wage growth was 7 or 8 per cent then inflation would be 6 or 7 per cent … we were in this world in the 1970s and it worked out very badly," Lowe said. "The best outcome for the country is for wages to pick up but to not go too much further."
Australia retail sales fell -0.2% mom in Oct, first decline this year
Australia retail sales turnover dropped -0.2% mom to AUD 35.02B in October, much worse than expectation of 0.5% mom rise. That's also the first monthly decline in 2022.
Ben Dorber, ABS head of retail statistics said: "The October fall in retail turnover ends a run of nine straight monthly rises and suggests increased cost of living pressures including interest rate rises have started to weigh on consumer spending."
"Turnover fell in all industries in October except for food retailing, which rose 0.4 per cent boosted by flood-related spending in parts of Australia and continued high food prices."
The Big Picture – Recession with Different Undercurrents
Highlights:
- Various shocks challenge the global economy, with different undercurrents driving the economic outlook across regions.
- The euro area and the US are headed for recession, while the Chinese growth engine is sputtering. However, the outlook starts to brighten in 2024, once China leaves its zero-Covid behind and the US economy exits from its downturn.
- Inflation pressures will slowly recede, allowing central banks to gradually exit their tightening mode and rate cuts could return to top the central bank agenda in early 2024.
- Risks primarily stem from renewed geopolitical tensions, energy shocks and a return of the pandemic through new variants.
Technical Outlook and Review
USD/JPY:
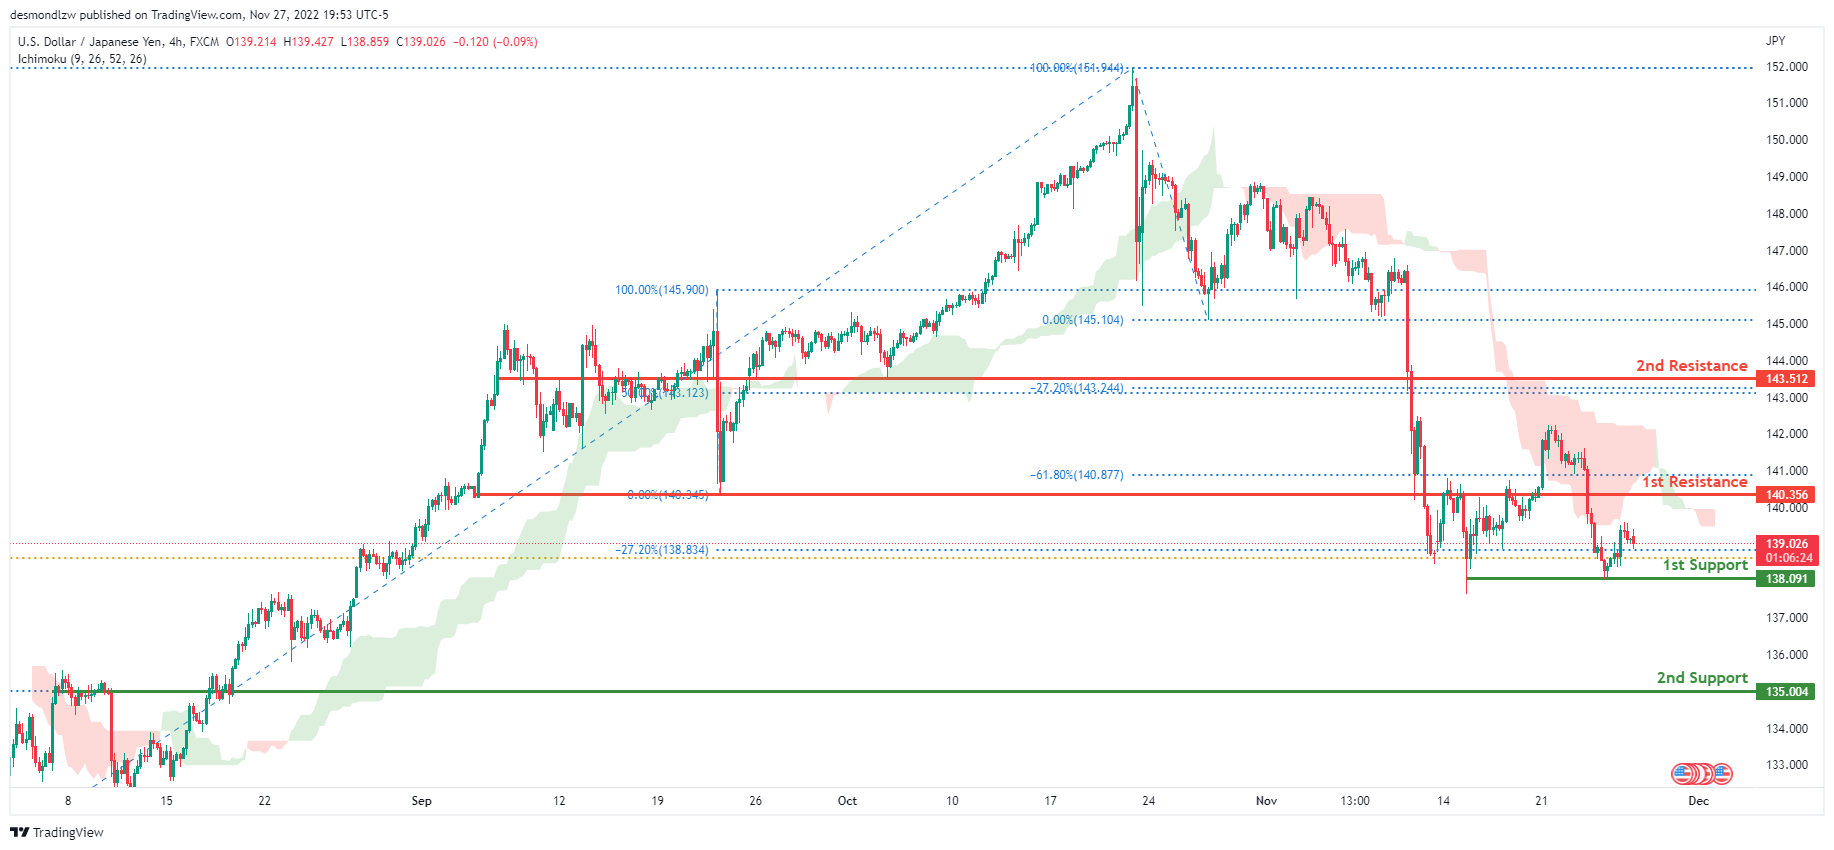
The current general bias for USDJPY on the H4 chart is bearish. To add confluence to this, the price is under the Ichimoku cloud which indicates a bearish market. If the bearish momentum continues, expect USDJPY to head towards the 1st support line at 138.091, where the –27.2% Fibonacci expansion line is located. In an alternative scenario, price could go up to retest the 1st resistance line at 140.356, where the -61.8% Fibonacci expansion line and previous low are located.
Areas of consideration:
- H4 time frame, 1st resistance at 140.356
- H4 time frame, 1st support at 138.091
DXY:
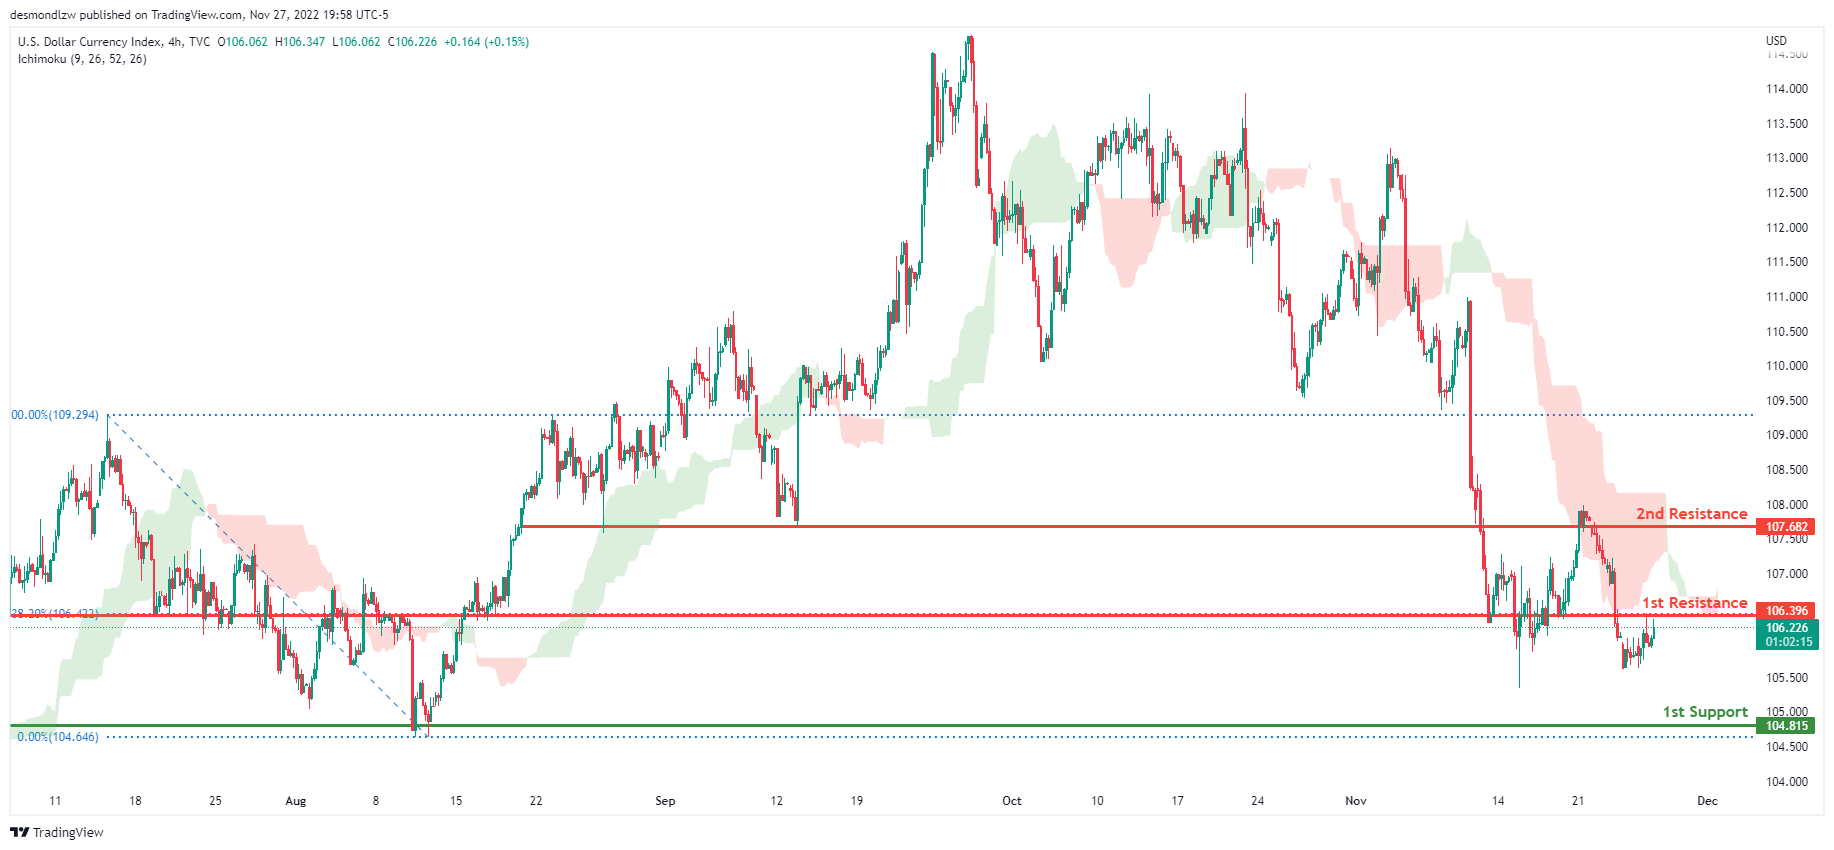
On the H4 chart, the overall bias for DXY is bearish. To add confluence to this, the price is crossing below the Ichimoku cloud which indicates a bearish market. If this bearish momentum continues, expect the price to head towards the 1st support line at 104.815 where the previous low and the 0% Fibonacci line are located. In an alternative scenario, price could head back up and retest the 1st resistance line at 106.396 where the 38.2% fibonacci line is located. If the 1st resistance is broken, the next area where price can reach is the 2nd resistance at 107.682, where the previous swing low lies.
Areas of consideration:
- H4 time frame, 1st resistance at 106.396
- H4 time frame, 2nd resistance at 107.682
- H4 time frame, 1st support at 104.815
EUR/USD:
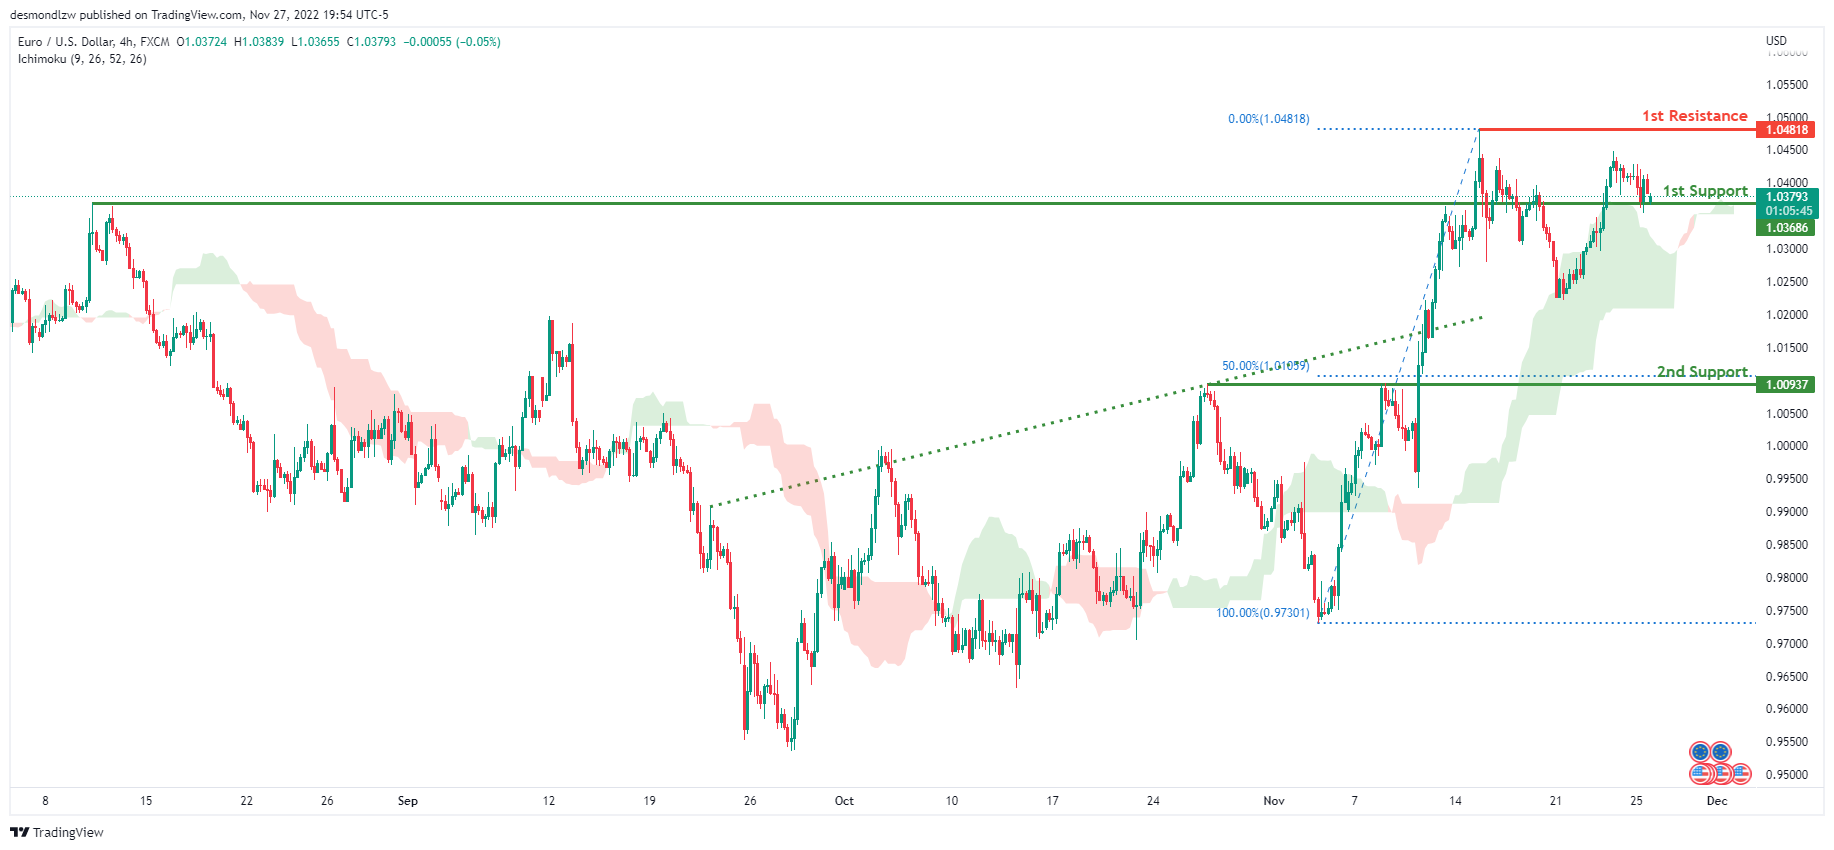
Looking at the H4 chart, my overall bias for EURUSD is bullish due to the current price being above the Ichimoku cloud, indicating a bullish market. To add confluence to this bias, price has also broken above the ascending trend line. If this bullish momentum continues, expect the price to possibly head towards the 1st resistance at 1.04818, where the previous swing high is located. In an alternate scenario, price could possibly head back down towards the 1st support level at 1.03686, where the previous swing high is located, before heading towards the 2nd support at 1.00937, where the 50% Fibonacci line is.
Areas of consideration :
- H4 1st resistance at 1.04818
- H4 1st support at 1.03686
- H4 2nd support at 1.00937
GBP/USD:
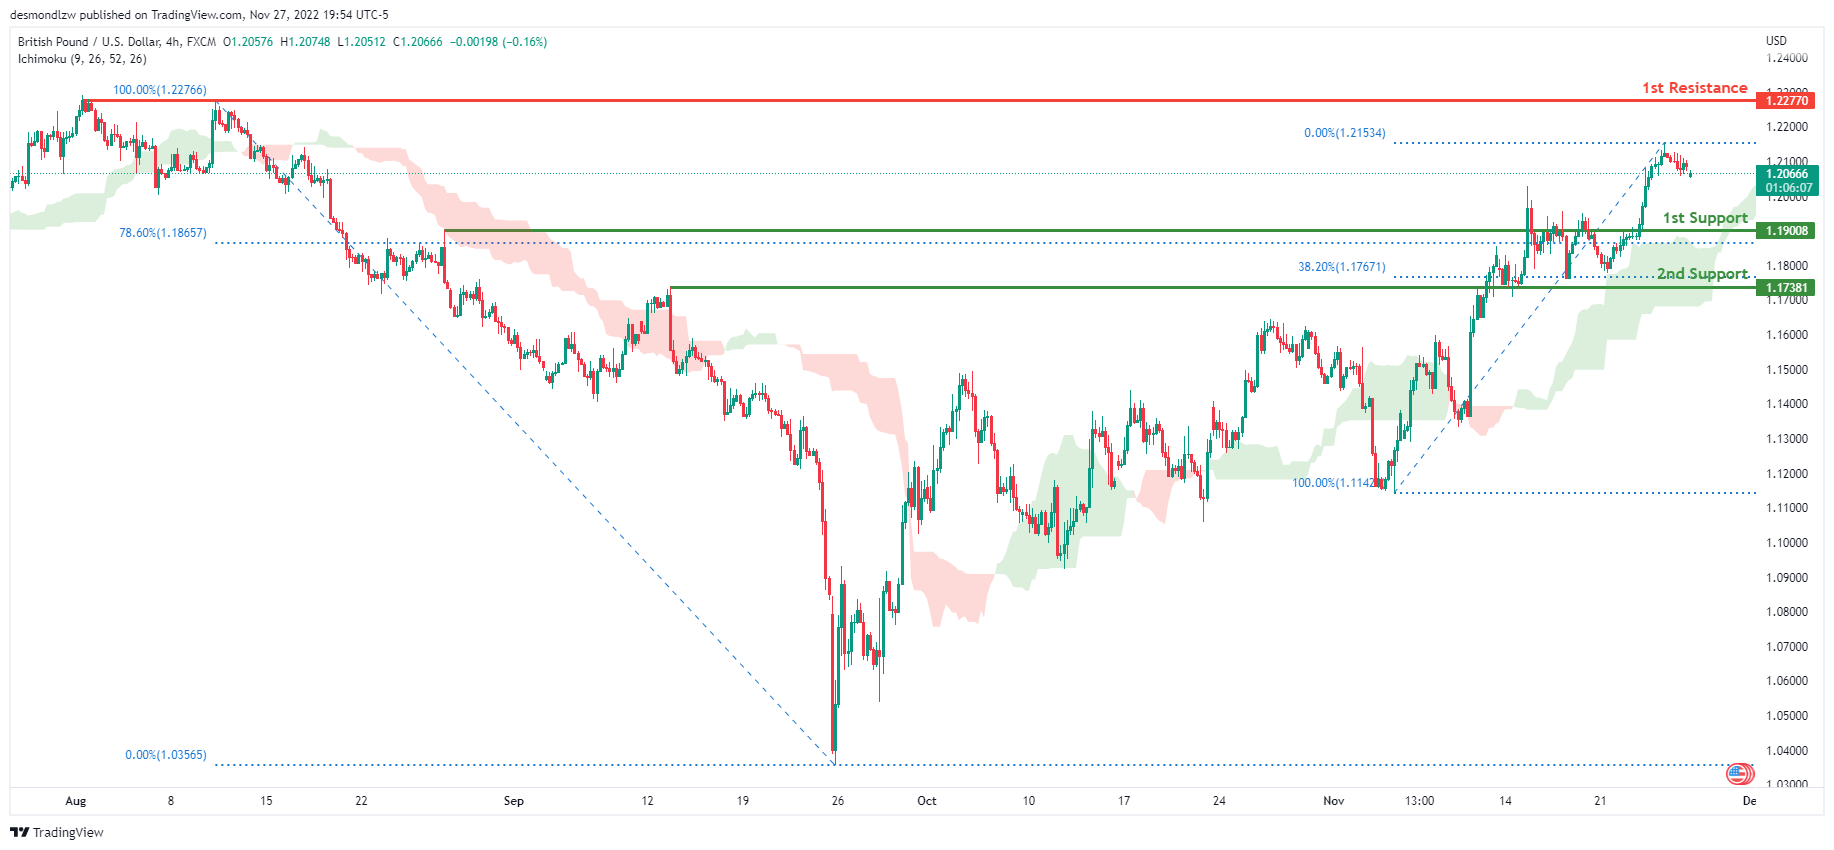
Looking at the H4 chart, my overall bias for GBPUSD is bullish due to the current price being above the Ichimoku cloud, indicating a bullish market. Expecting price to possibly head towards the 1st resistance line at 1.22770, where the previous swing high is. In an alternative scenario, price could possibly head back down to retest the 1st support line at 1.19008, where the 78.6% Fibonacci line is.
Areas of consideration:
- H4 1st resistance at 1.22770
- H4 1st support at 1.19008
USD/CHF:
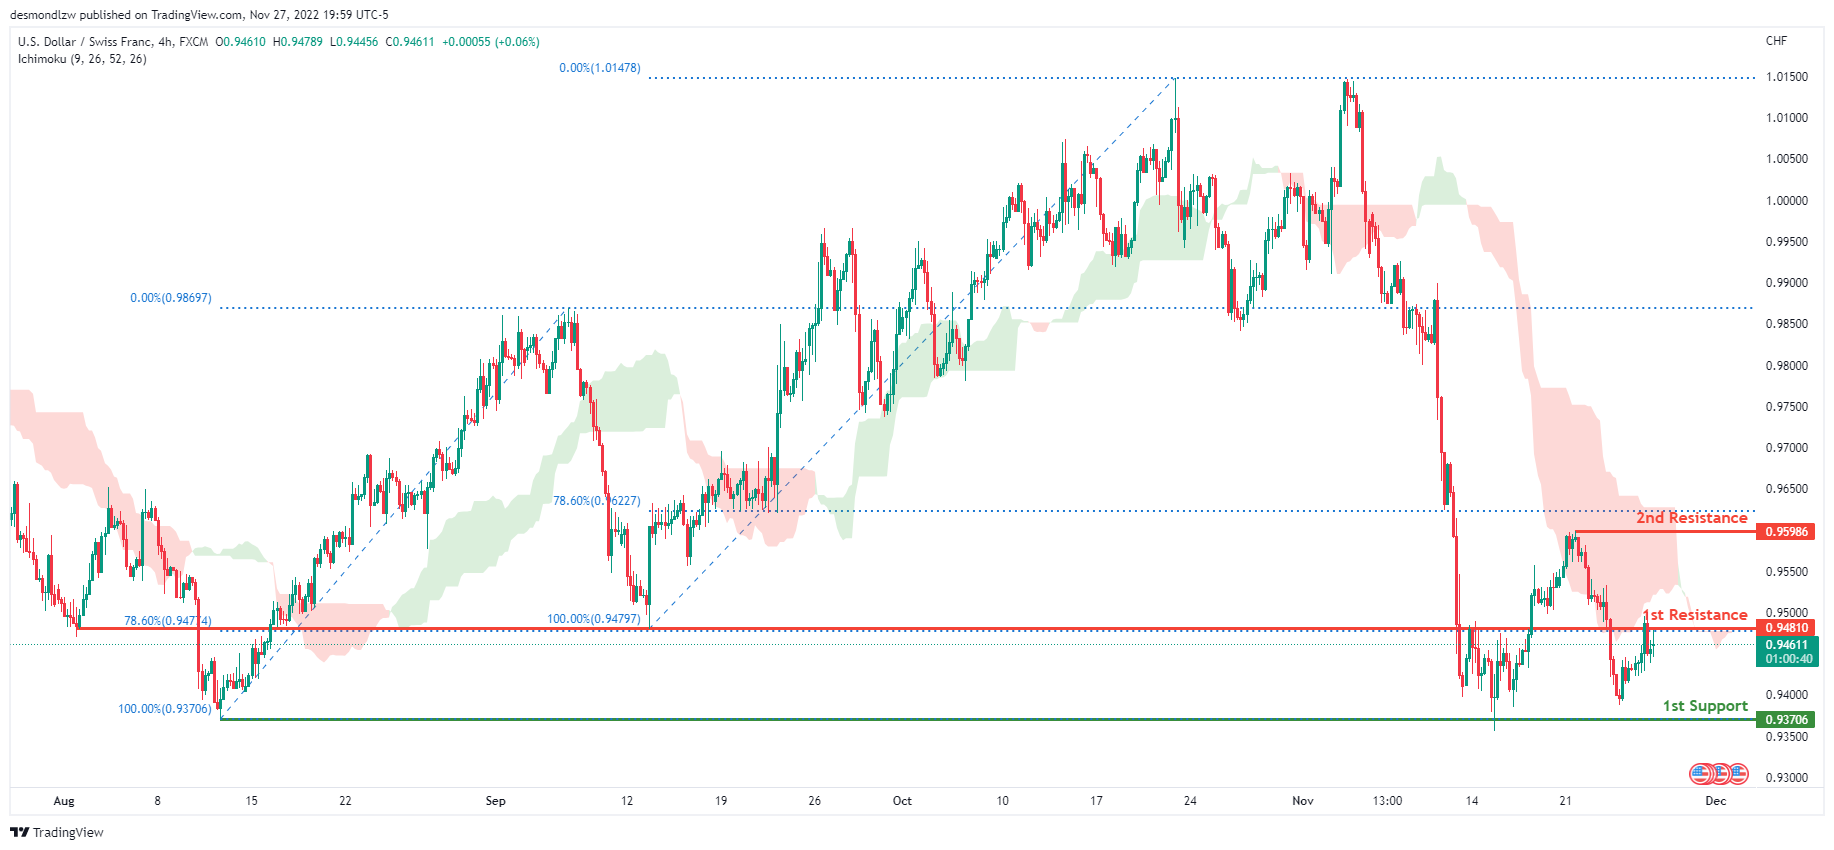
The overall bias for USDCHF on the H4 chart is bearish. In addition, the price is crossing below the Ichimoku cloud, indicating a bearish market. If the current bearish trend continues, expect price to continue heading towards the 1st support line at 0.93706, where the previous swing low is. In an alternate scenario, price could rise towards the 1st resistance line at 0.94810, where the 78.6% Fibonacci line is, before heading towards the 2nd resistance at 0.95986, where the previous swing high is.
Areas of consideration
- H4 1st support at 0.93706
- H4 1st resistance at 0.94810
- H4 2nd resistance at 0.95986
XAU/USD (GOLD):
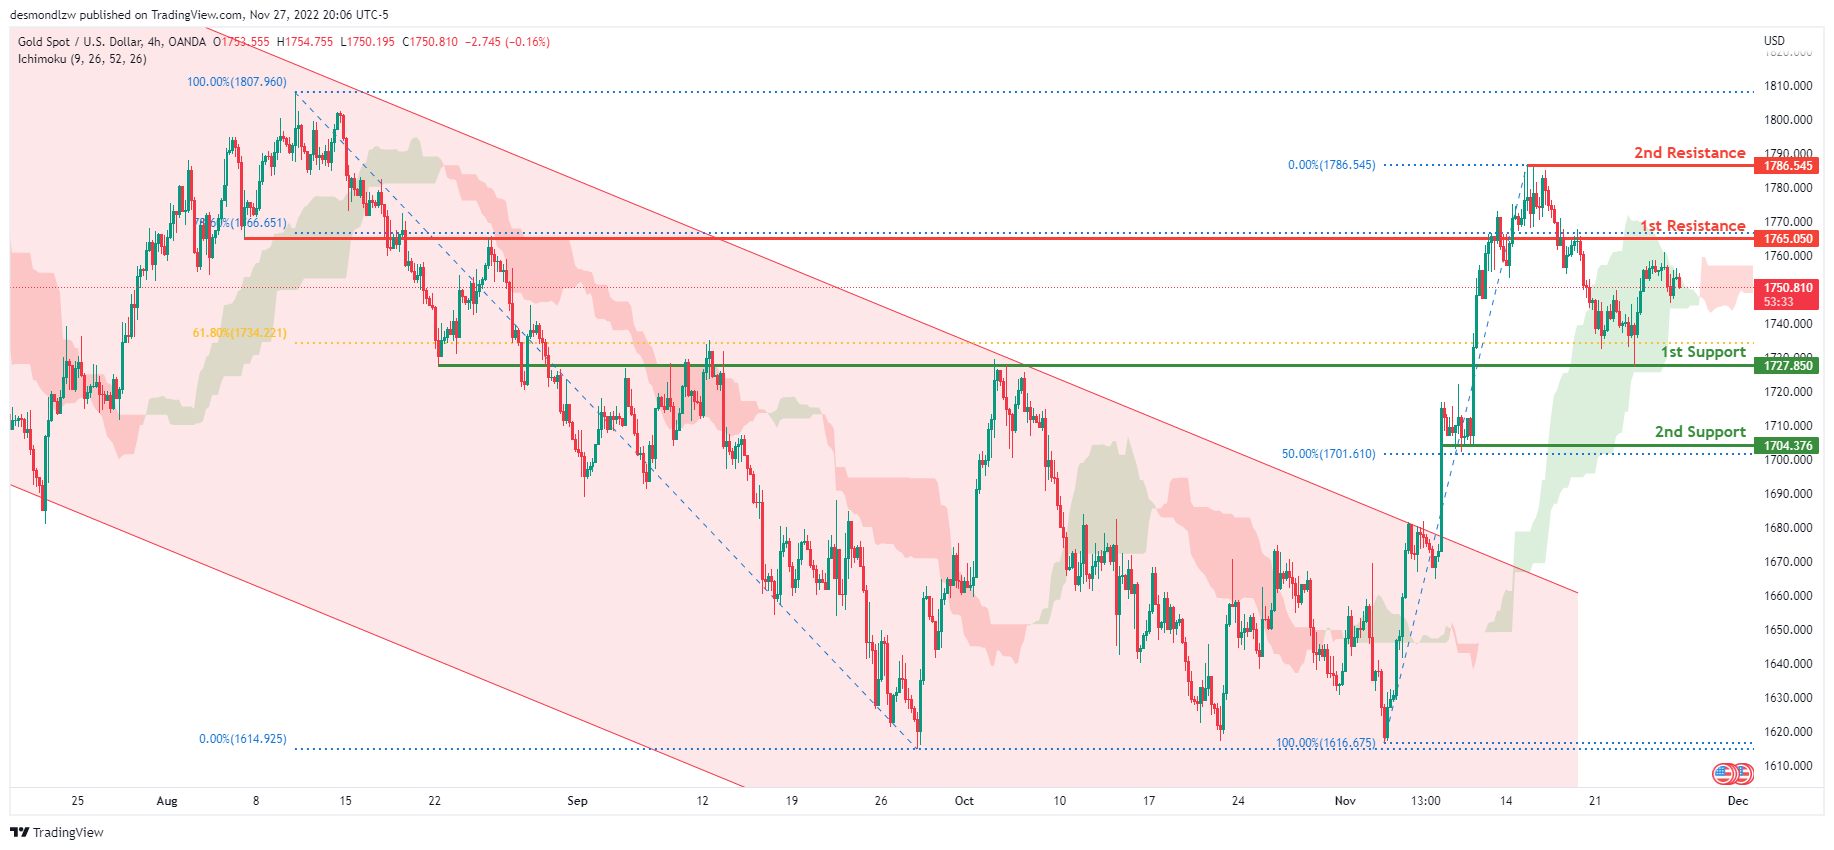
Looking at the H4 chart, my overall bias for XAUUSD is bullish due to the current price crossing above the Ichimoku cloud, indicating a bullish market. If this bullish momentum continues, expect the price to possibly head back up towards the 1st resistance at 1765.050, where the 78.6% Fibonacci line is located. In an alternate scenario, price could possibly head back down towards the 1st support level at 1727.850, where the 38.2% and 61.8% Fibonacci lines are located.
Areas of consideration:
- H4 time frame, 1st resistance at 1765.483
- H4 time frame, 1st support at 1727.850
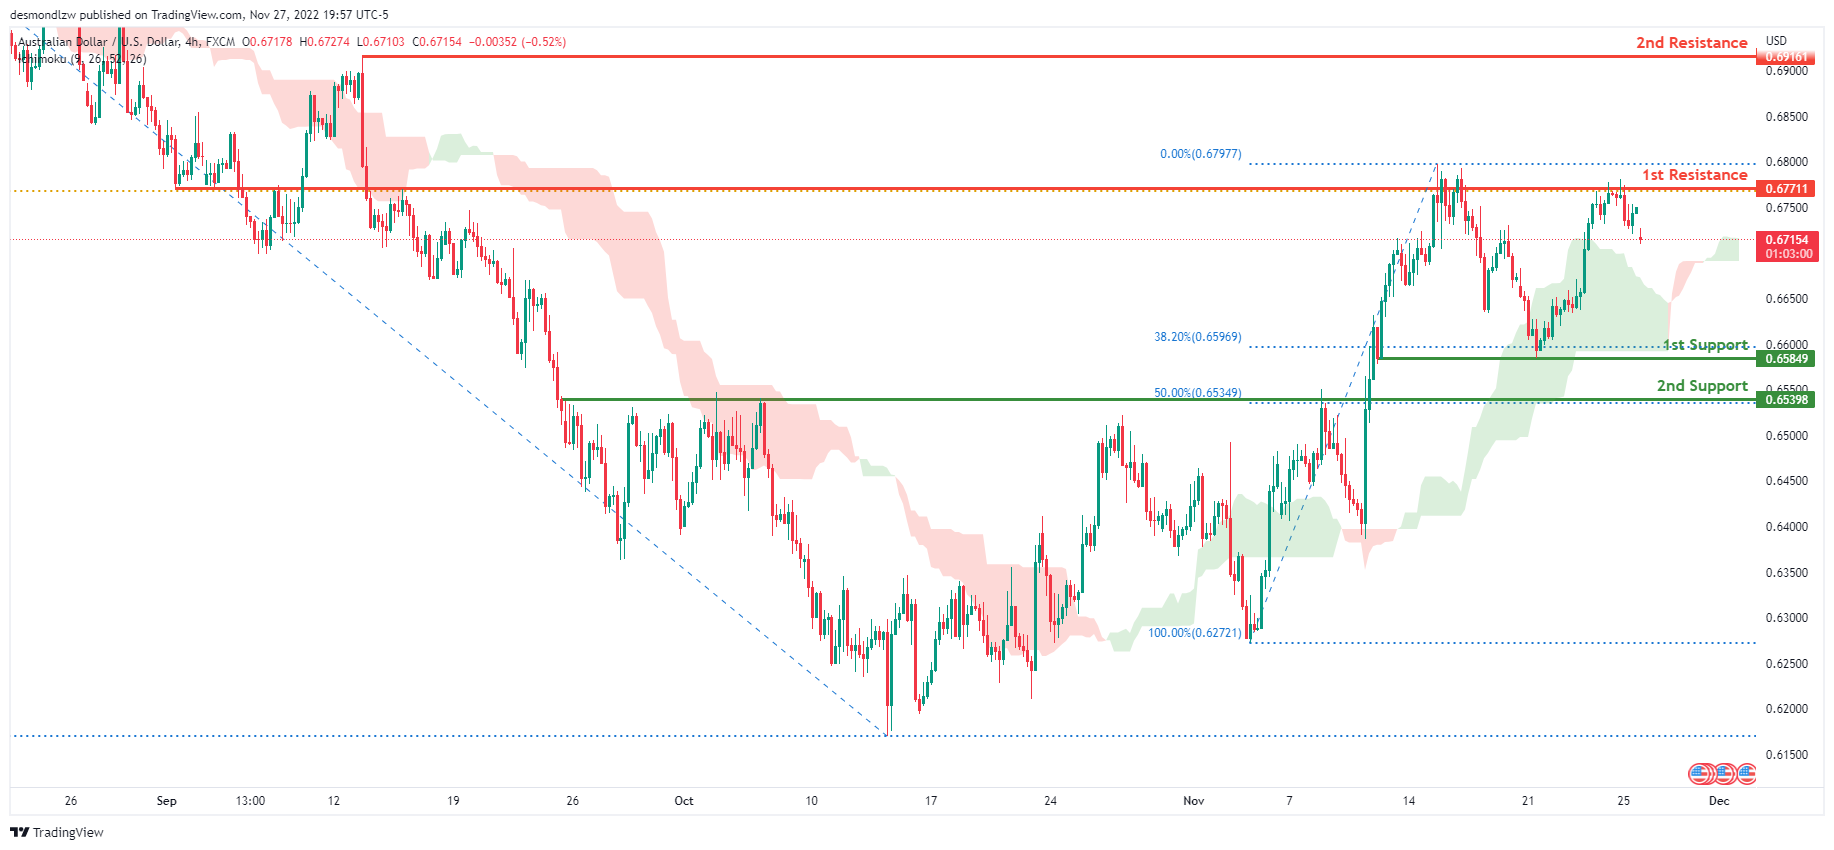
AUD/USD:
Looking at the H4 chart, my overall bias for ADUSD is bullish due to the current price being above the Ichimoku cloud, indicating a bullish market. Expecting price to continue heading towards the 1st resistance at 0.67711 where the 61.8% Fibonacci line is. If this 1st resistance line is broken, expect the price to head towards the 2nd resistance at 0.69161, where the previous swing high is. In an alternative scenario, price could possibly head back down to retest the 1st support line at 0.65849 where the 38.2% Fibonacci line is.
Areas of consideration
- H4, 1st resistance at 0.67711
- H4, 2nd resistance at 0.69161
- H4, 1st support at 0.65849
NZD/USD:
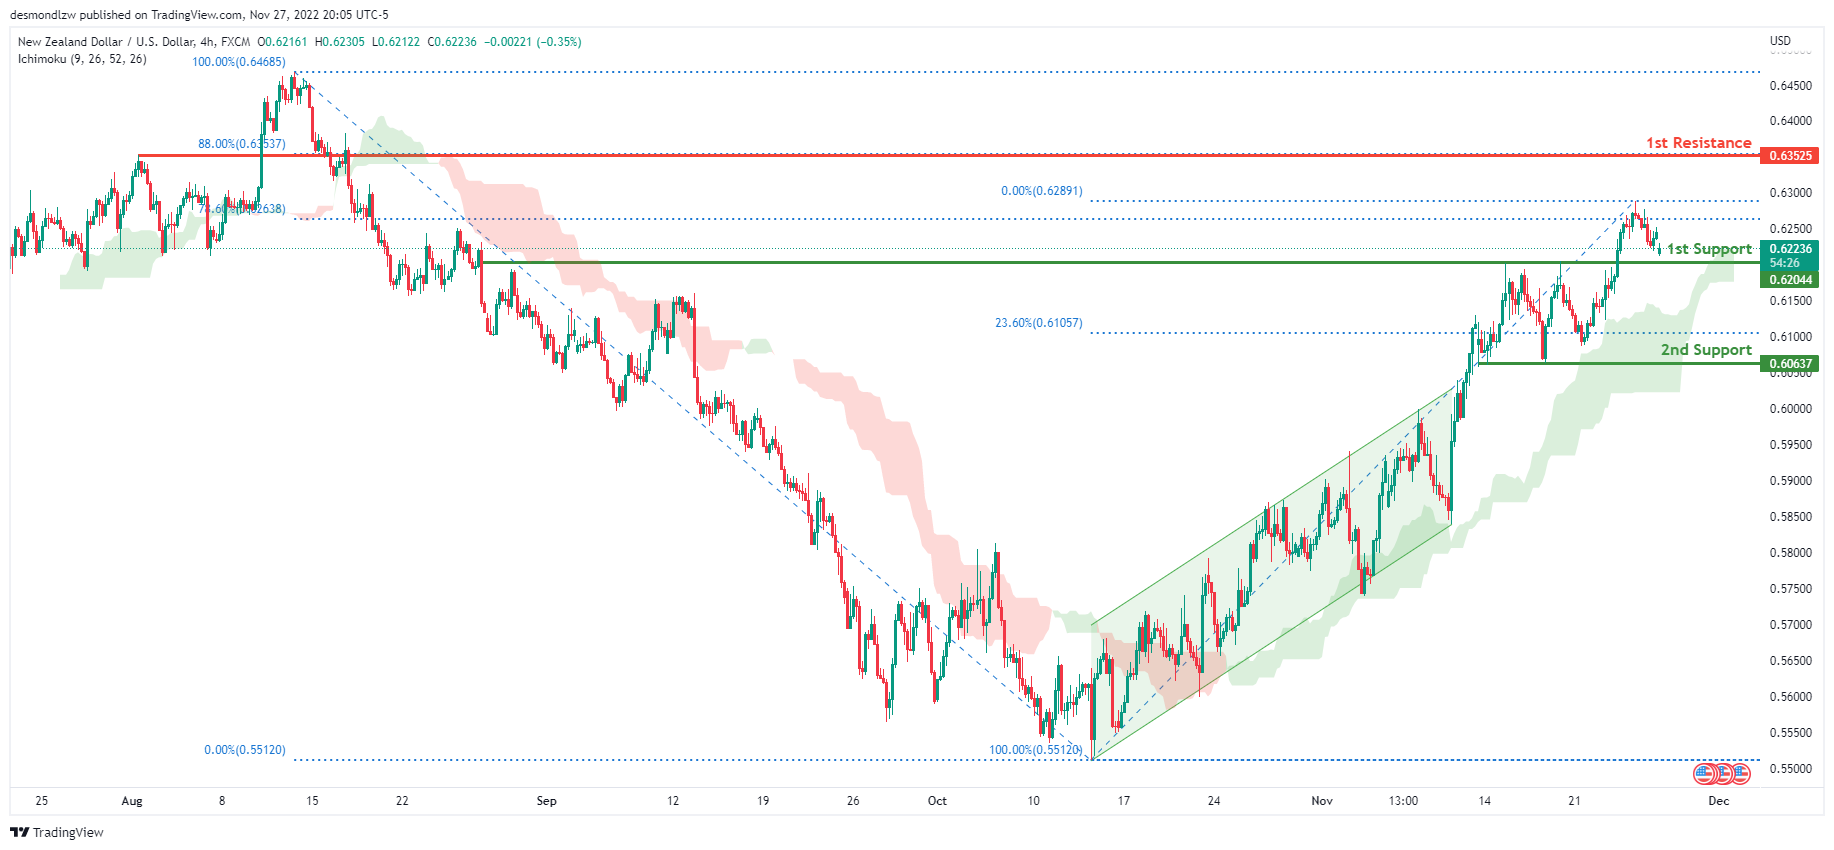
On the H4 chart, we have a bullish bias with the price moving above the Ichimoku cloud and has broken out of the ascending channel. If this bullish momentum continues, expect the price to continue heading towards the 1st resistance line at 0.63525, where the 88% Fibonacci line is. Alternatively, the price may head back down and retest the 1st support at 0.62044, slightly below where the 78.6% Fibonacci line is.
Areas of consideration:
- H4 time frame, 1st resistance at 0.63525
- H4 time frame, 1st support at 0.62044
USD/CAD:
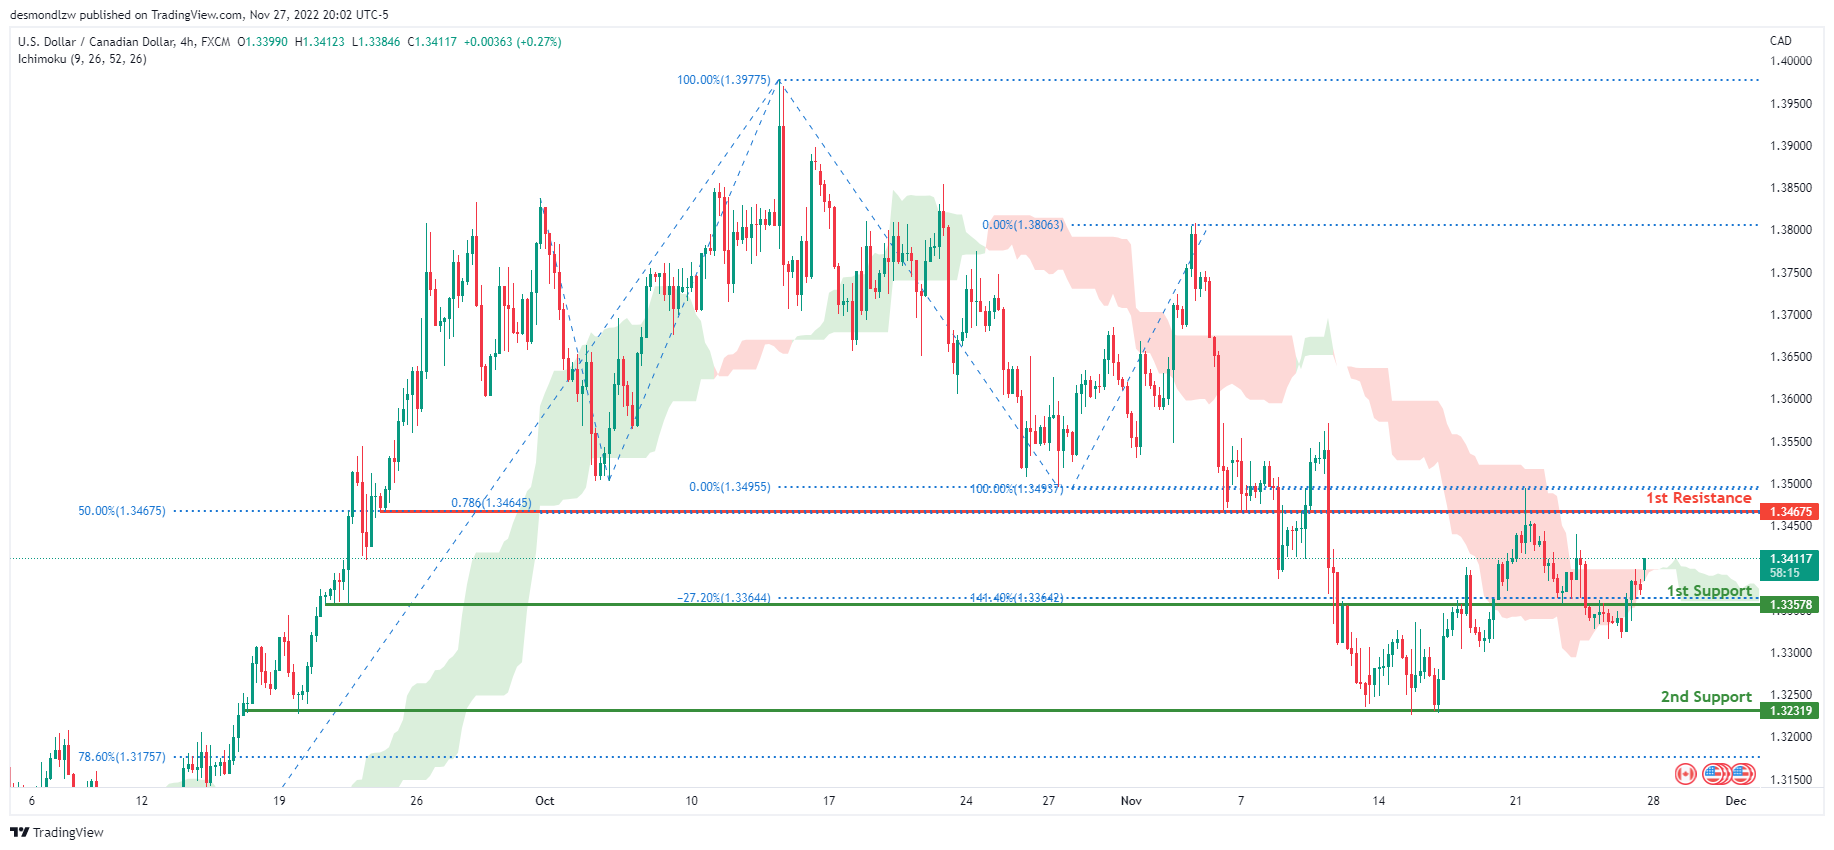
On the H4 chart, the overall bias for USDCAD is bearish. To add confluence to this, the price is crossing below the Ichimoku cloud which indicates a bearish market. If this bearish momentum continues, expect the price to continue heading towards the 1st support line at 1.33578, where the -27.2% Fibonacci expansion line and 141.4% Fibonacci line is. In an alternative scenario, price could head back up to retest the 1st resistance line at 1.34675, where the 50% Fibonacci line and 78.6% Fibonacci projection line are located.
Areas of consideration:
- H4 time frame, 1st resistance at 1.34675
- H4 time frame, 1st support at 1.33578
OIL:
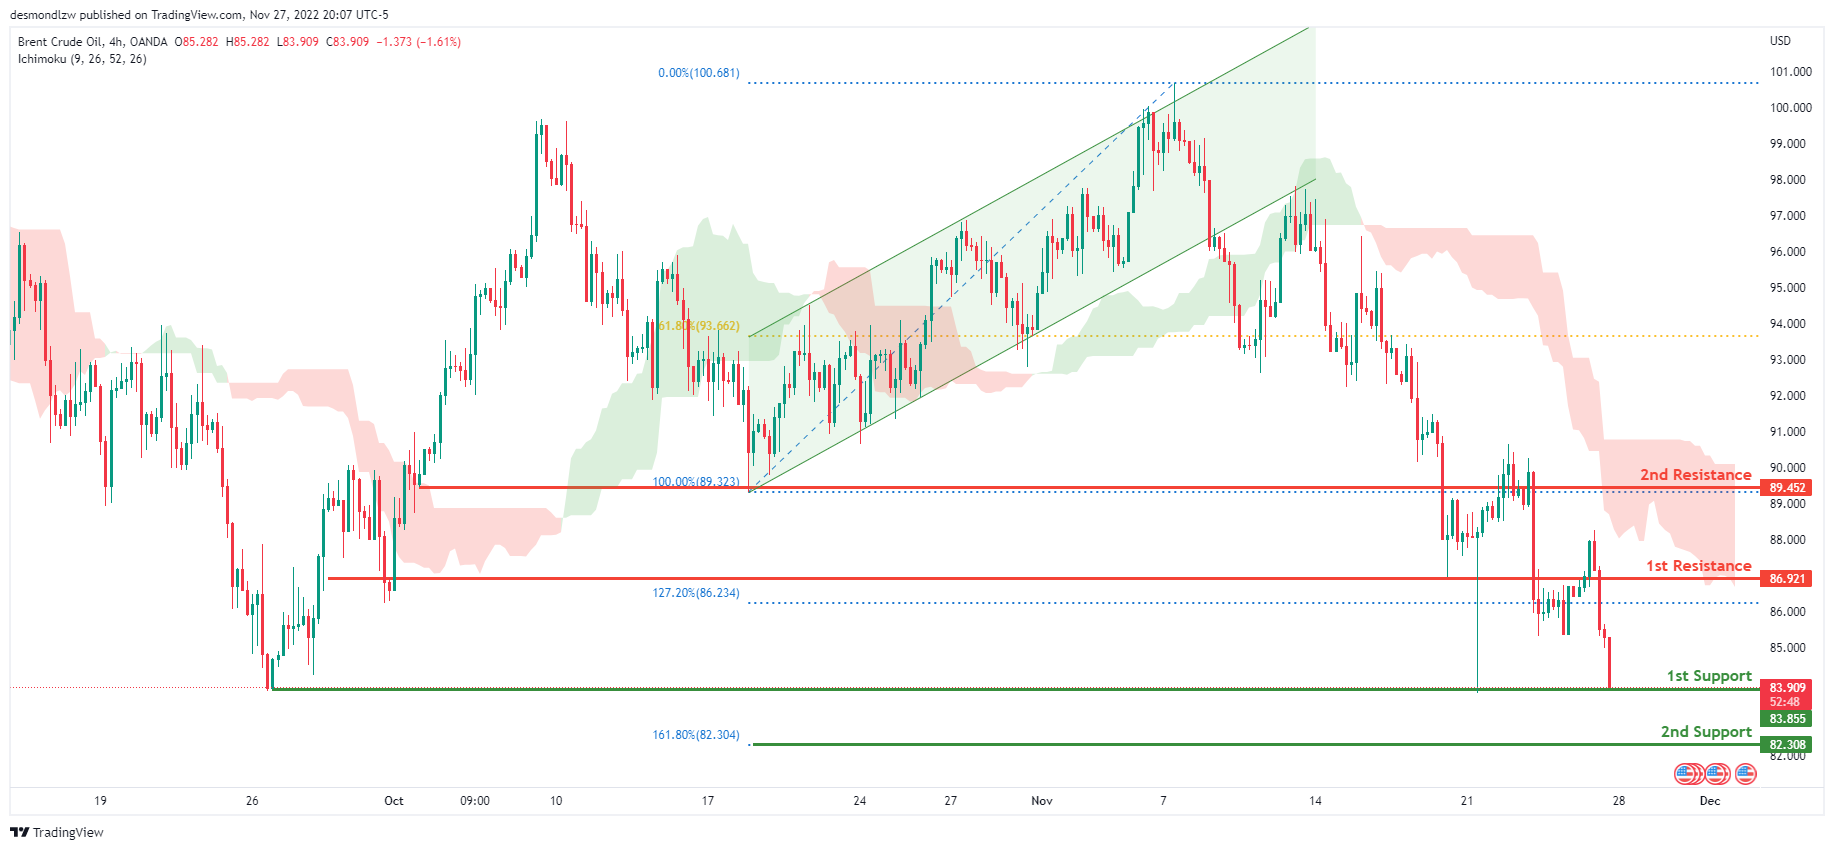
Looking at the H4 chart, my overall bias for BCOUSD is bearish due to the current price being below the Ichimoku cloud, indicating a bearish market. If this bearish momentum continues, expect price to possibly break the 1st support at 83.855, where the previous swing low is located, before heading towards the 2nd support at 82.308, where the 161.8% Fibonacci extension line is. In an alternate scenario, price could possibly head back up to retest the 1st resistance level at 86.921, where the 127.2% Fibonacci extension line is located. If this 1st resistance line is broken, expect the price to head towards the 2nd resistance line at 89.452, where the previous swing low is.
Areas of consideration:
- H4 time frame, 1st resistance at 86.921
- H4 time frame, 2nd resistance at 89.452
- H4 time frame, 1st support at 83.855
- H4 time frame, 2nd support at 82.308
Dow Jones Industrial Average:
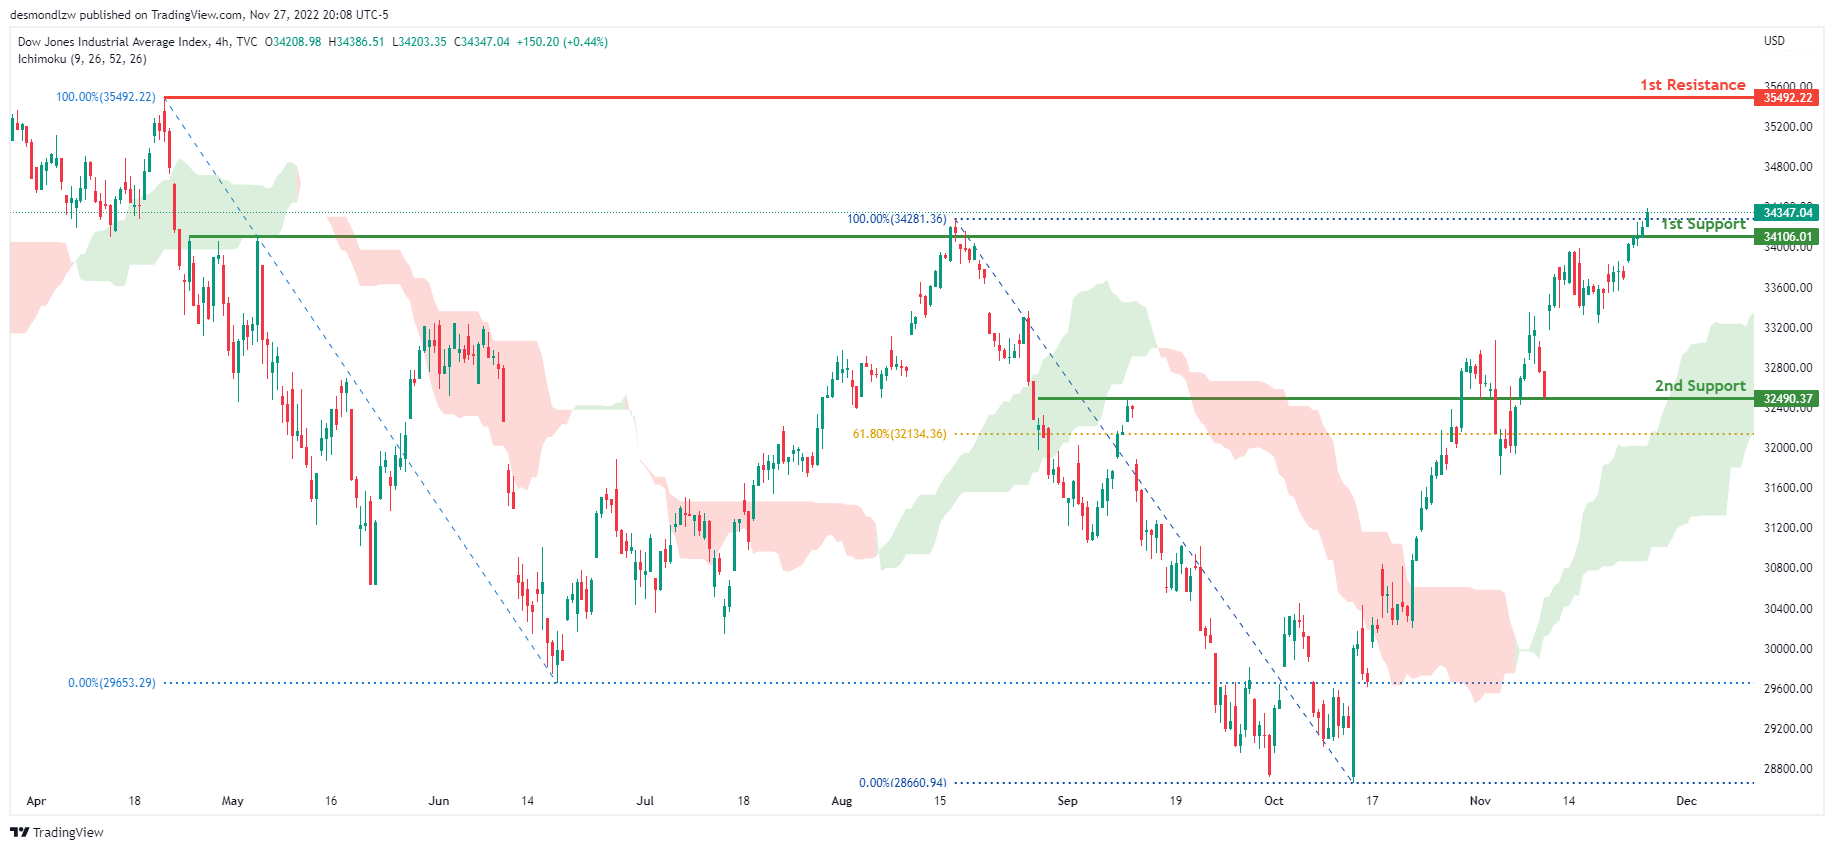
On the H4 chart, the overall bias for DJI is bullish. To add confluence to this, the price is above the Ichimoku cloud which indicates a bullish market. If this bullish momentum continues, expect the price to continue heading towards the 1st resistance line at 35492.22, where the previous swing high is. In an alternative scenario, price could head back down breaking the 1st support line at 34106.01, where the previous swing high is before heading towards the 2nd support at 32490.37, where the 61.8% Fibonacci line is.
Areas of consideration:
- H4 time frame, 1st support at 34106.01
- H4 time frame, 2nd support at 32490.37
- H4 time frame, 1st Resistance at 35492.22
DAX:
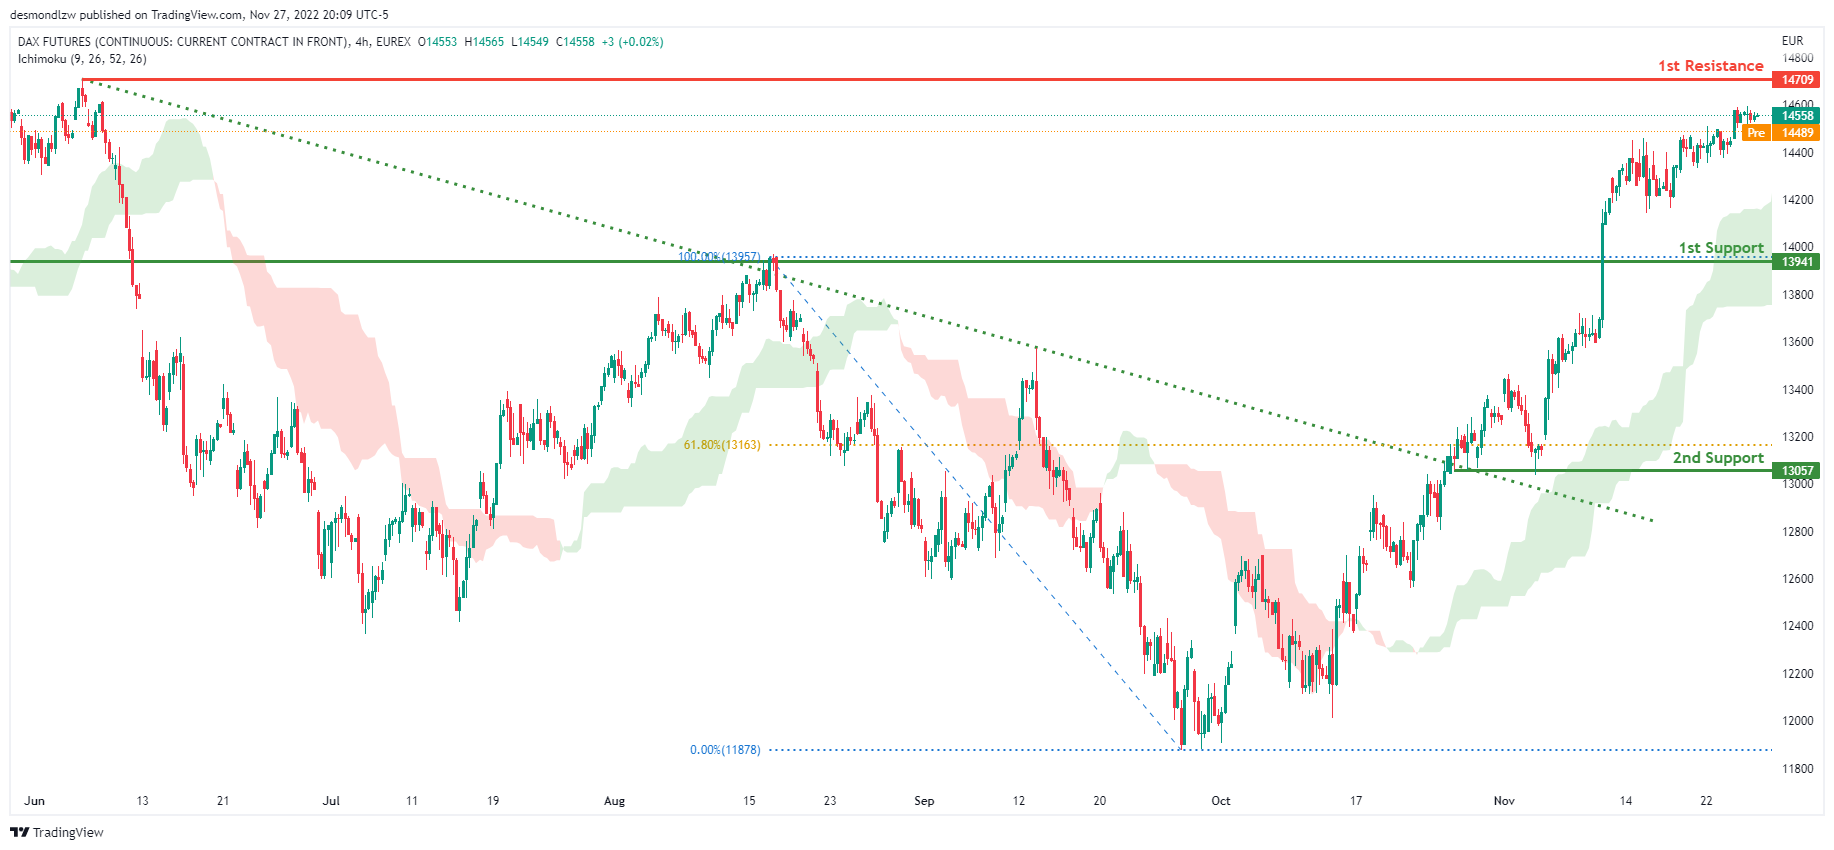
The H4 chart shows a bullish bias, with price breaking through the descending trendline and rising above the Ichimoku cloud. Price is expected to maintain its bullish momentum and rise to the first resistance level at 14709, where the previous swing high is located. Alternatively, the price could fall to the first support level at 13941, where the previous swing high was.
Areas of consideration:
- H4 time frame, 1st resistance is at 14709
- H4 time frame, 1st support is at 13941
ETHUSD:
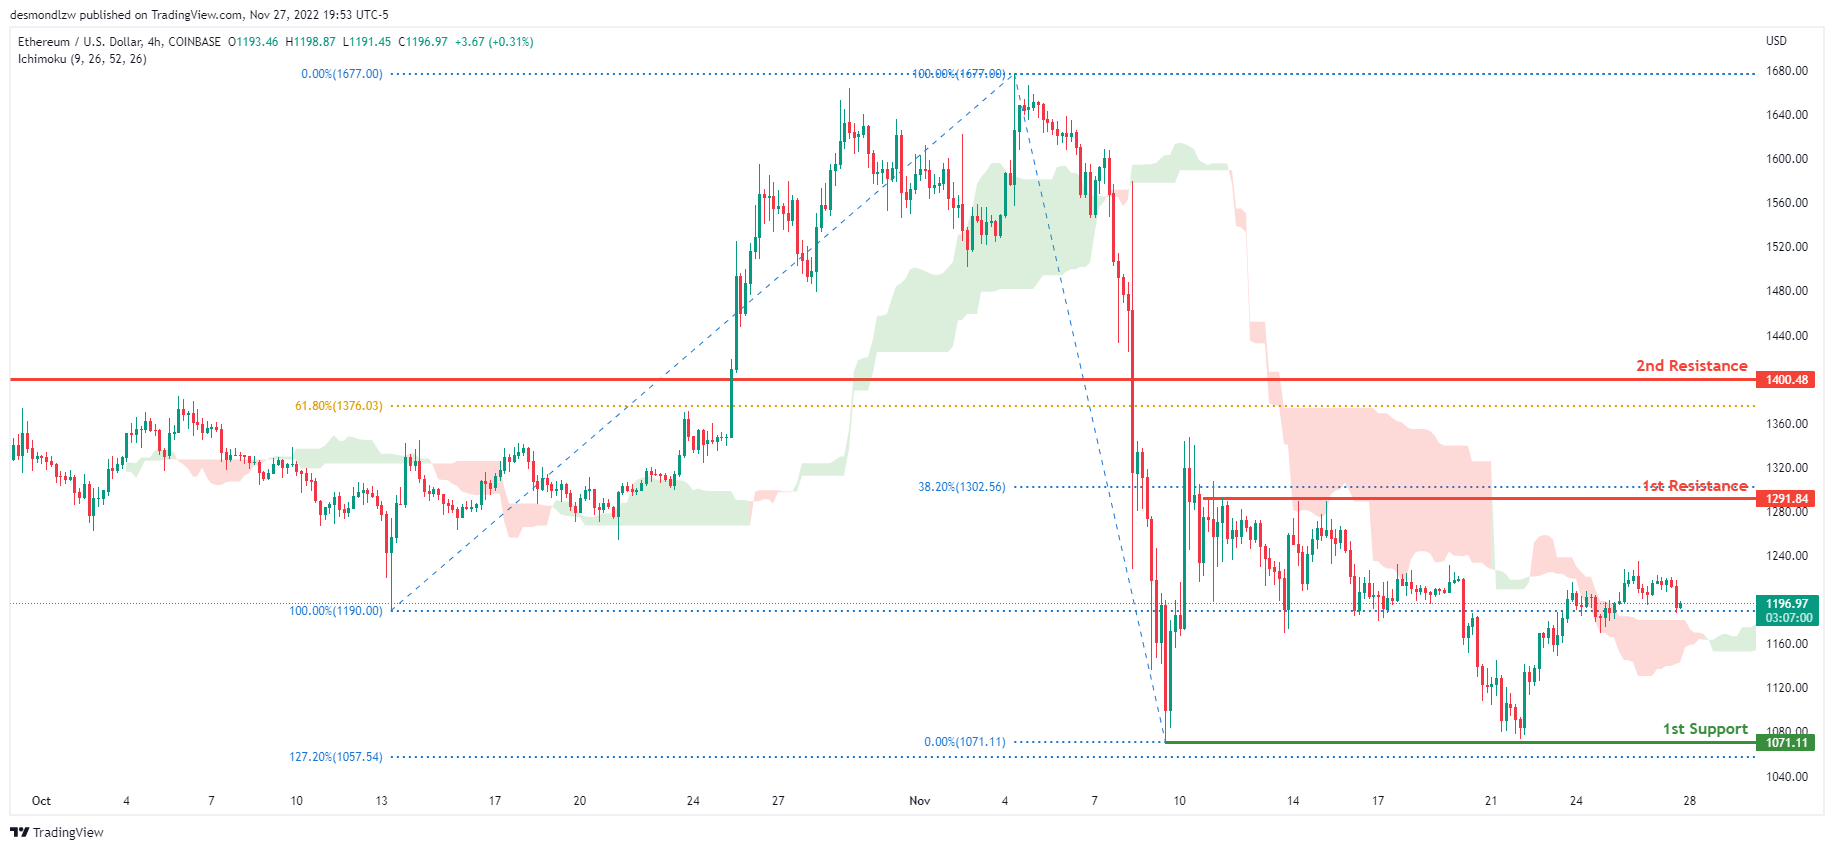
Looking at the H4 chart, my overall bias for ETHUSD is bearish due to the current price being below the Ichimoku cloud, indicating a bearish market .If this bearish momentum continues, expect price to possibly head towards the 1st support at 1071.11, where the -previous swing low is located. In an alternate scenario, price could possibly head back up towards the 1st resistance level at 1291.84, where the 38.2% Fibonacci line is located.
Areas of consideration:
- H4 time frame, 1st resistance of 1291.84
- H4 time frame, 1st support at 1071.11
BTCUSD:
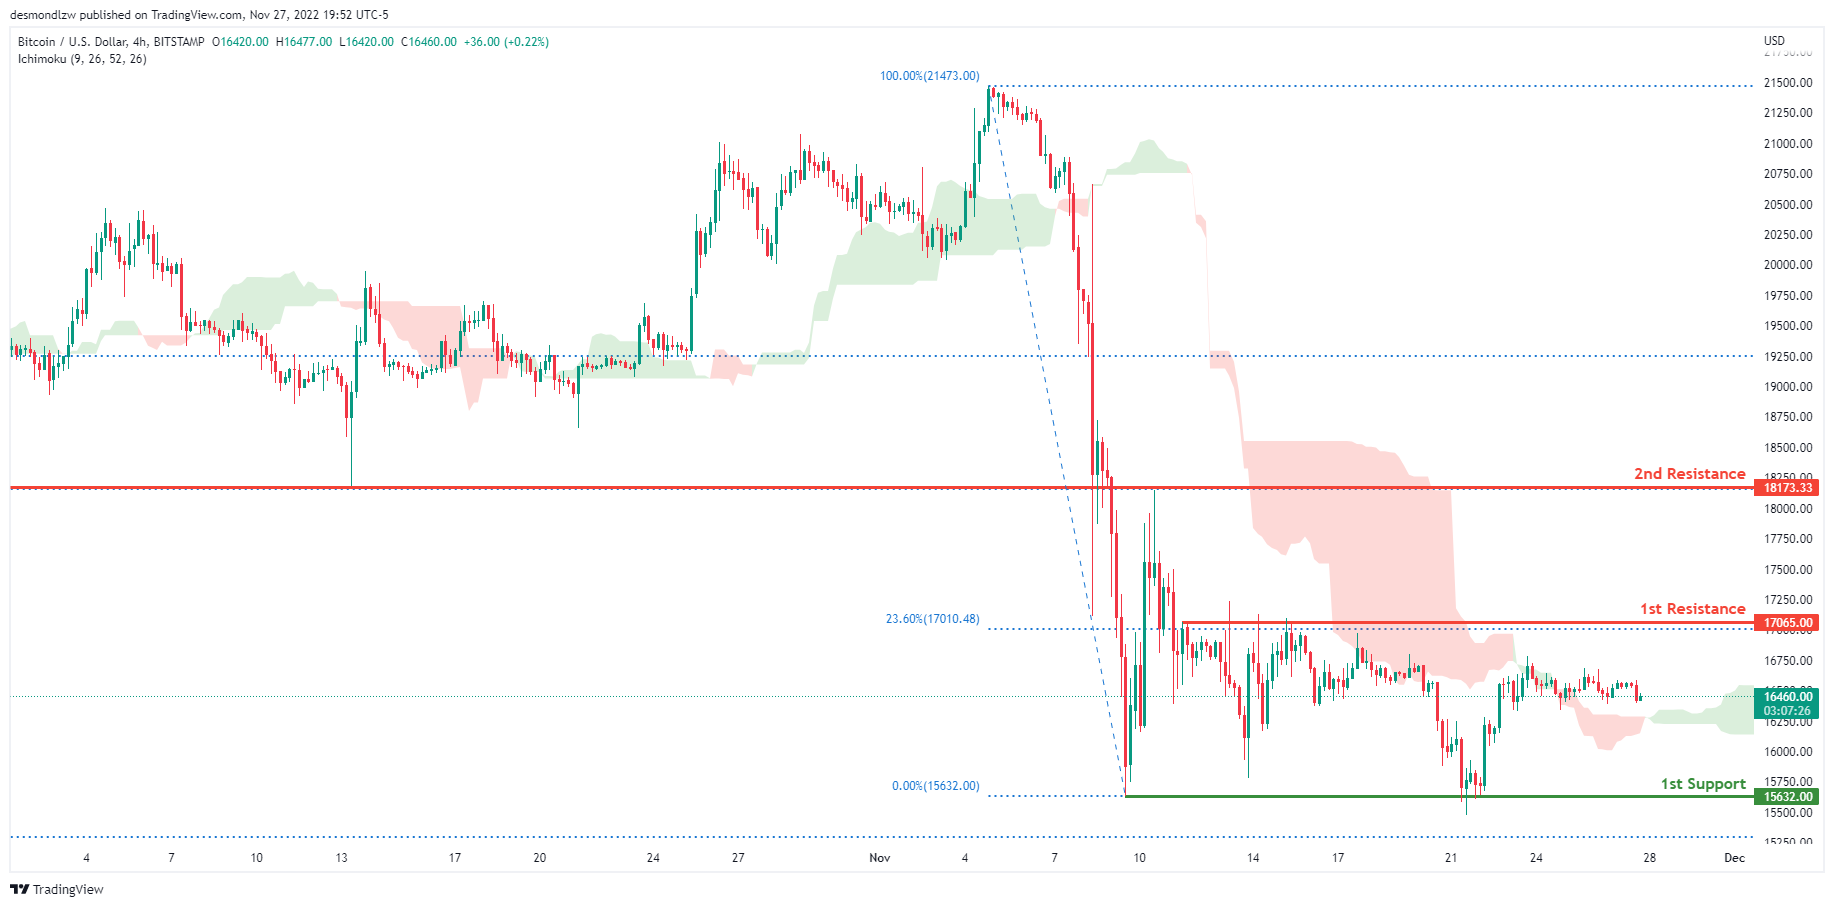
On the H4 chart, the overall bias for BTCUSD is bearish. To add confluence to this, the price is below the Ichimoku cloud which indicates a bearish market. If this bearish momentum continues, expect the price to head towards the 1st support line at 15632.00, where the previous swing low is located. In an alternative scenario, price could head back up to retest the 1st resistance line at 17065.00, where the 23.6% Fibonacci line is located.
Areas of consideration:
- H4 time frame, 1st resistance 17065.00
- H4 time frame, 1st support at 15632.00
S&P 500:
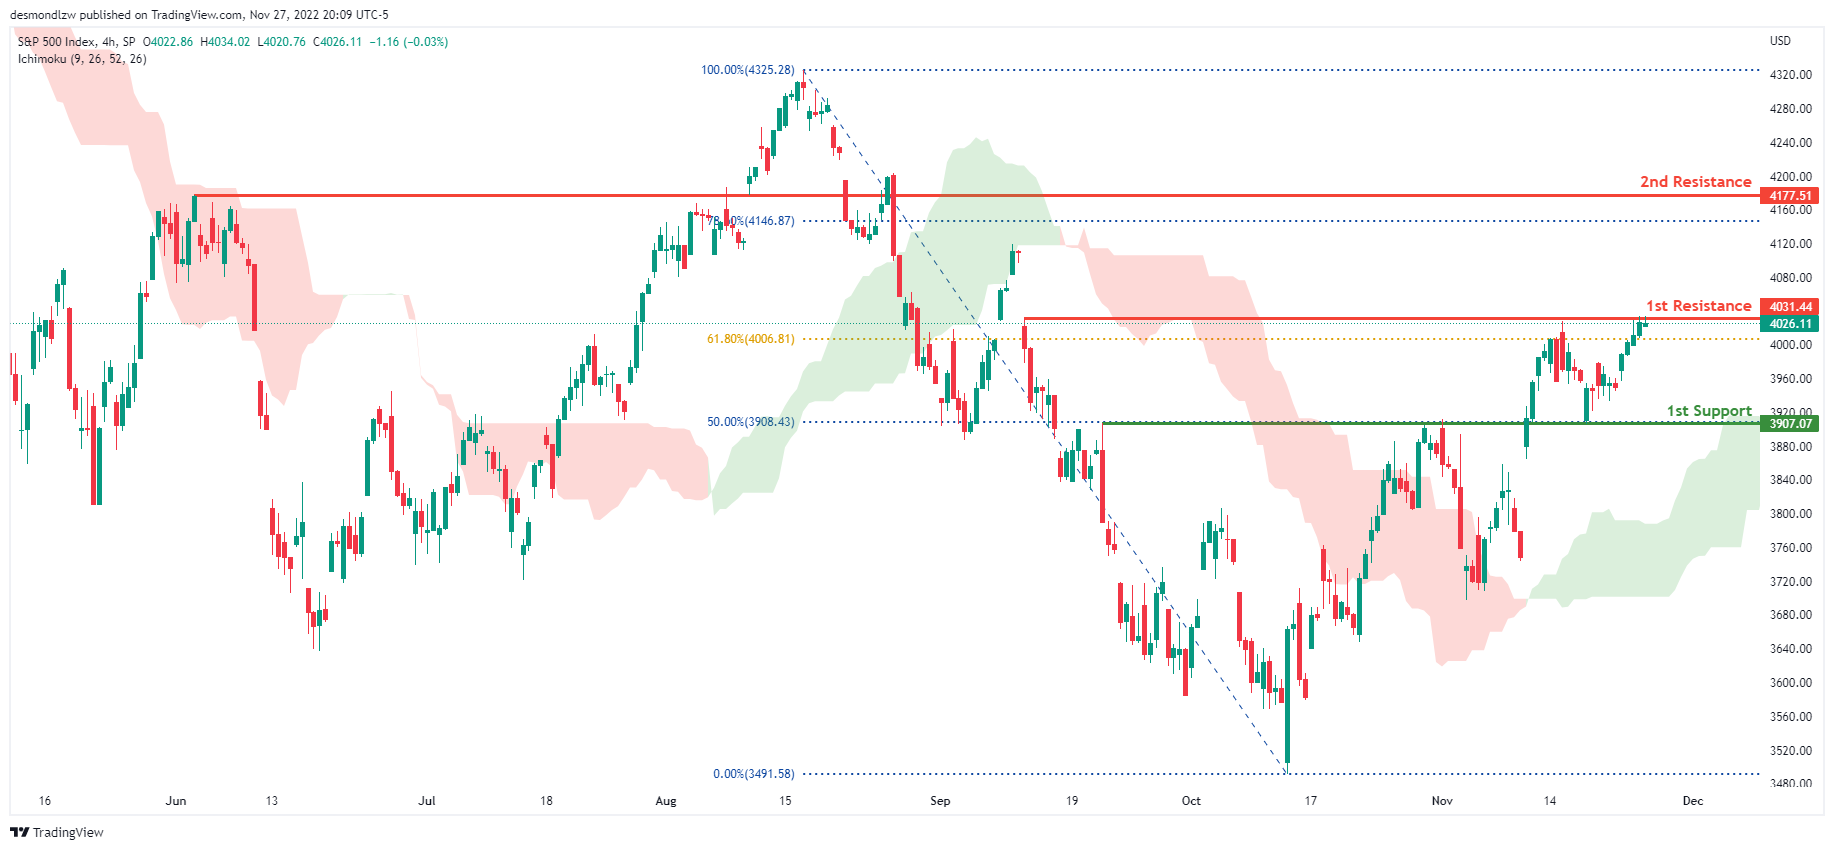
The overall bias for the S&500 on the H4 chart is bullish, with prices above the Ichimoku cloud. If the bullish momentum continues, the price will rise to the first resistance line at 4031.44, where the 61.8% Fibonacci line is located. If the first resistance line is broken, the second resistance line is at 4119.28, which is the previous swing high and the 78.6% Fibonacci line. In an alternate scenario, price could return to the first support line at 3907.07, where the 50% Fibonacci line is located.
Areas of consideration:
- H4 time frame, 1st support at 3907.07
- H4 time frame, 1st resistance at 4031.44
- H4 time frame, 2nd resistance at 4119.28
EUR/USD Could Resume Upside, Oil Price Turns Red
Key Highlights
- EUR/USD is showing positive signs above the 1.0280 support.
- It traded above a major contracting triangle with resistance near 1.0315 on the 4-hours chart.
- Crude oil price is accelerating losses below the $80 support.
- Gold price is still holding gains above the $1,720 level.
EUR/USD Technical Analysis
The Euro started a downside correction from 1.0480 against the US Dollar. EUR/USD declined towards 1.0220, where it found support and started a fresh increase.
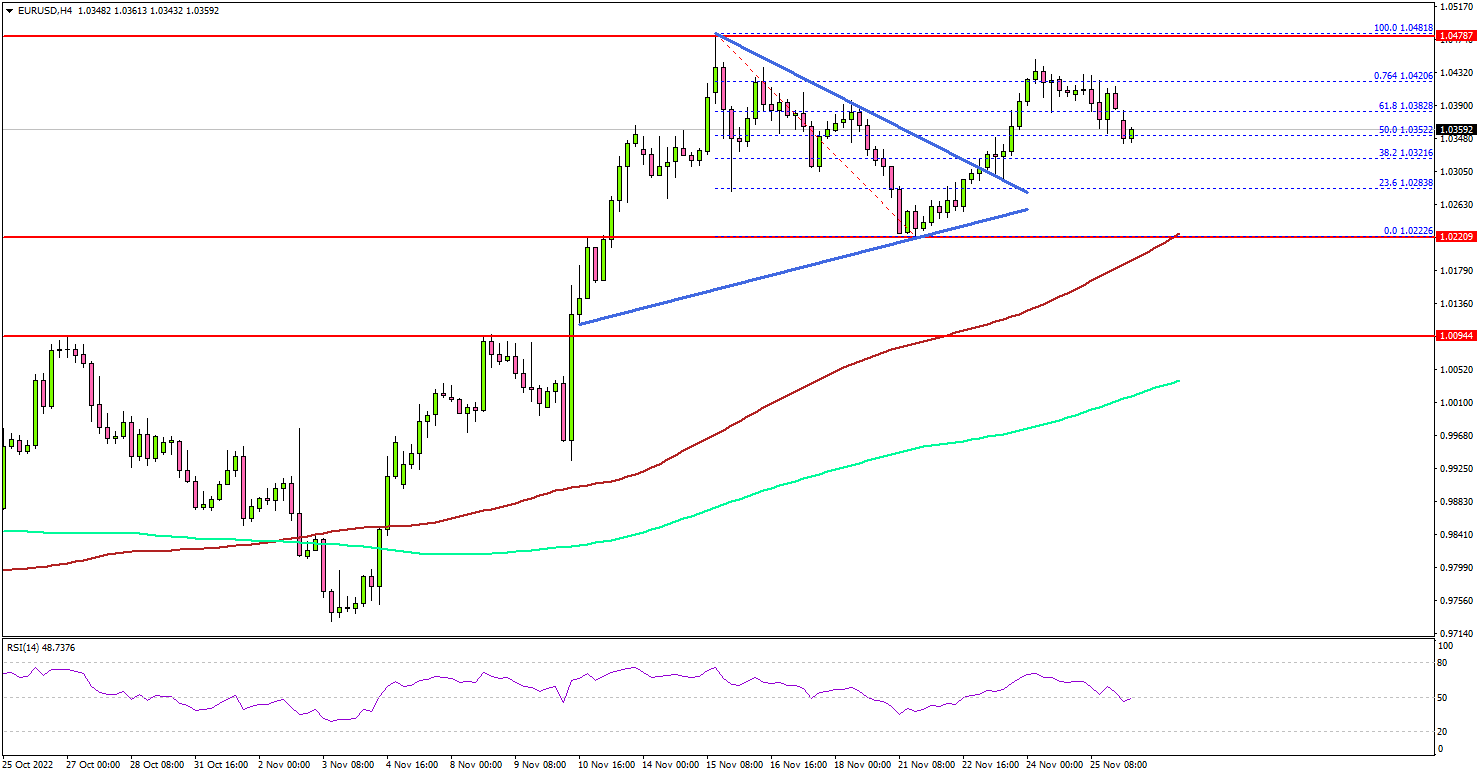
Looking at the 4-hours chart, the pair traded as low as 1.0222. The pair seems to be forming a base above the 1.0200 level, the 100 simple moving average (red, 4-hours) plus the 200 simple moving average (green, 4-hours).
There was a fresh increase above the 1.0280 and 1.0300 resistance levels. There was also a break above a major contracting triangle with resistance near 1.0315 on the same chart.
The pair is now trading above the 1.0350 level. On the upside, an immediate resistance is near 1.0435 level. The next major resistance may perhaps be near 1.0480. Any more gains could set the pace for a move towards the 1.0550 resistance zone.
An initial support is near the 1.0350 level. The next major support is near the 1.0320 zone, below which the pair might revisit the key 1.0220 support zone.
If the bulls fail to protect the 1.0220 support zone, there is a risk of a more downsides. In the stated case, EUR/USD may perhaps test the 1.0100 support. Any more losses might send the pair towards the 1.0000 support.
Looking at gold price, there is a decent support base forming above the $1,720 level and there could be more upsides in the coming sessions.
Economic Releases
- Dallas Fed Manufacturing Business Index for Nov 2022 – Forecast -18.3, versus -19.4 previous.
EURJPY Found Sellers After Elliott Wave Double Three Pattern
Hello fellow traders. In this technical article we’re going to take a look at the Elliott Wave charts charts of EURJPY published in members area of the website. As our members know EURJPY forex pair ended the cycle from the August low at 148.38 peak and now giving as correction. Recently EURJPY made short term recovery against the 148.38 peak that has unfolded as Elliott Wave Double Three Pattern. It made clear 7 swings from the lows and complete at the extreme zone. In further text we’re going to explain the Elliott Wave pattern and forecast
Before we take a look at the real market example, let’s explain Elliott Wave Double Three pattern.
Elliott Wave Double Three Pattern
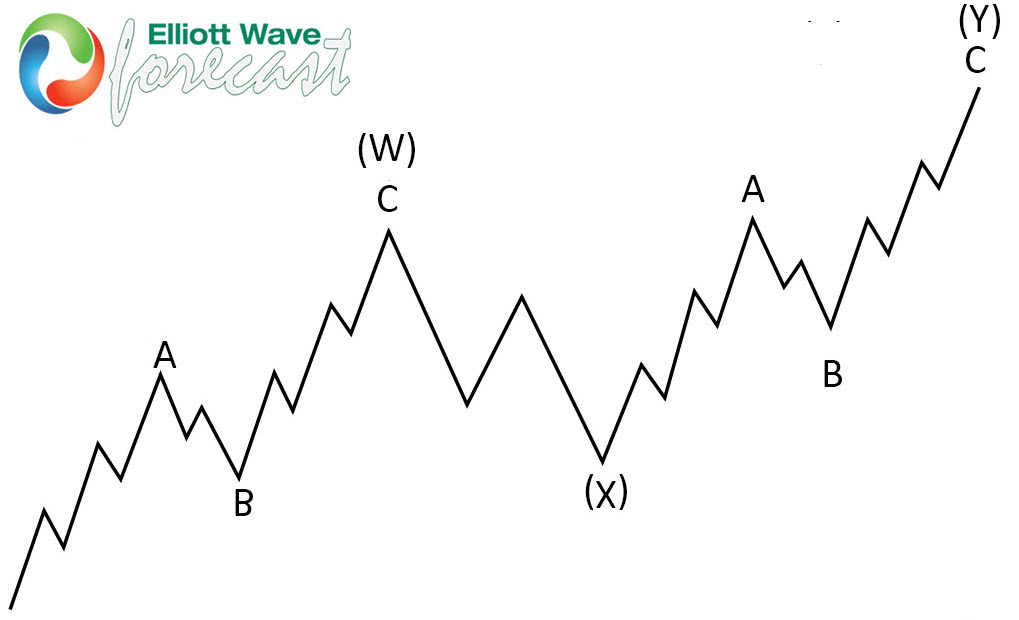
Double three is the common pattern in the market , also known as 7 swing structure. It’s a reliable pattern which is giving us good trading entries with clearly defined invalidation levels.
The picture below presents what Elliott Wave Double Three pattern looks like. It has (W),(X),(Y) labeling and 3,3,3 inner structure, which means all of these 3 legs are corrective sequences. Each (W) and (Y) are made of 3 swings , they’re having A,B,C structure in lower degree, or alternatively they can have W,X,Y labeling.
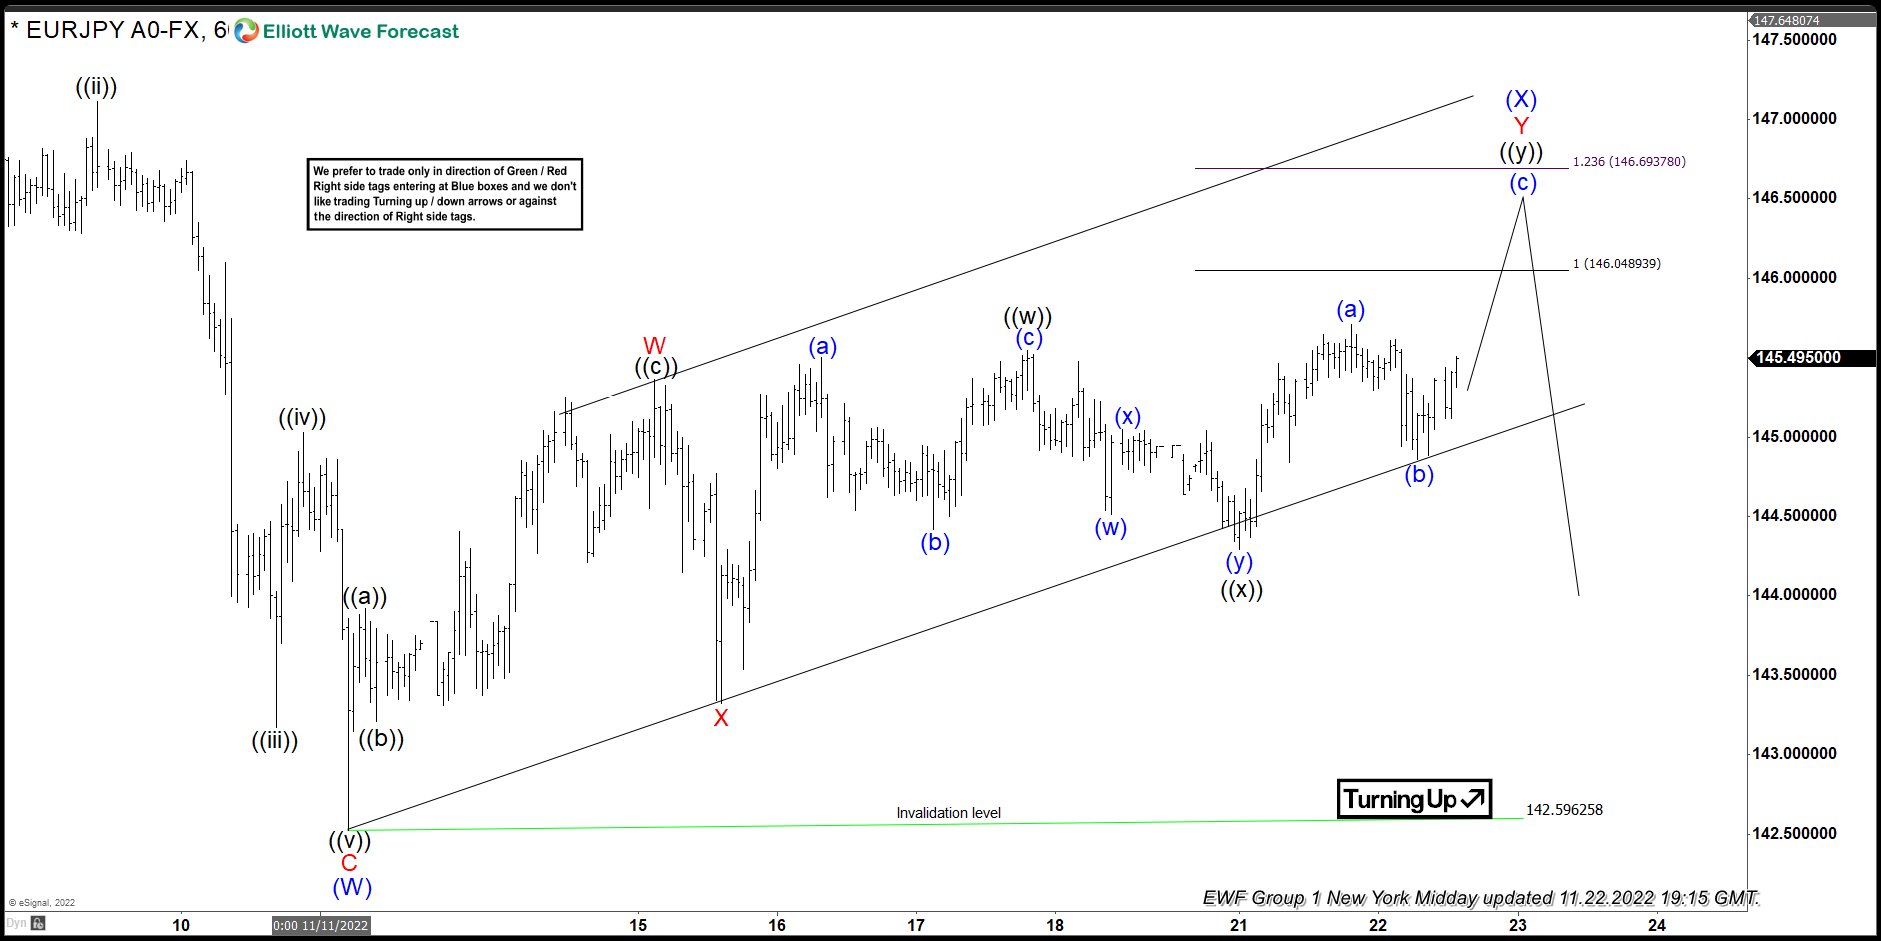
EURJPY 1h Hour Elliott Wave Analysis 11.22.2022
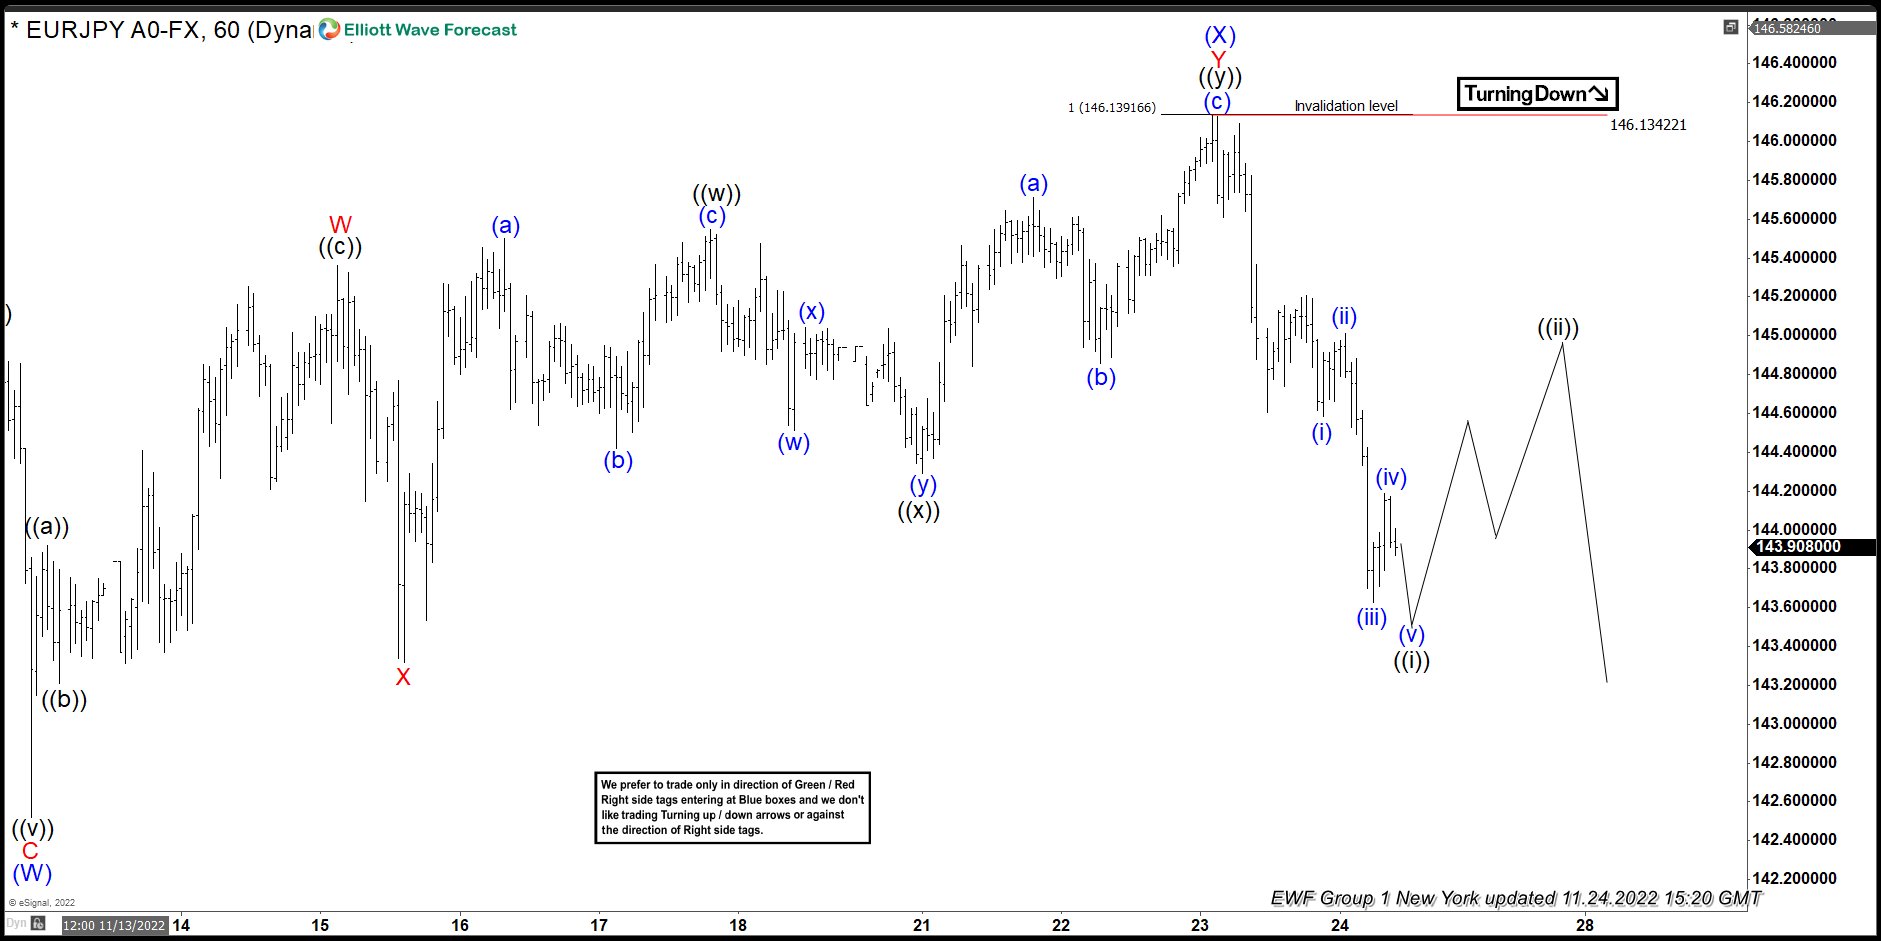
EURJPY is giving us (X) blue recovery that is unfolding as Elliott Wave Double Three Pattern. Correction has WXY red inner labeling. If we take a close look , we can see that price structure is still incomplete. We are missing another leg up tpward 146.048-146.693 to complete proposed correction. At that zone buyers should be ideally taking profits and sellers can appear again. Consequently , we expect to see reaction from the marked area. From mentioned zone we can get either decline toward new lows or larger 3 waves pull back at least.
EURJPY 1h Hour Elliott Wave Analysis 11.24.2022
Sellers appeared right at the marked extreme zone : 146.048-146.693 and we got good reaction. Current view suggests (X) blue connector completed at 146.134 high. We are about to complete short term cycle from the mentioned peak and expecting to see 3 waves bounce. The price now must hold below 146.13 peak in order to keep proposed view intact, otherwise larger correction can be taking place.
EUR/USD Weekly Outlook
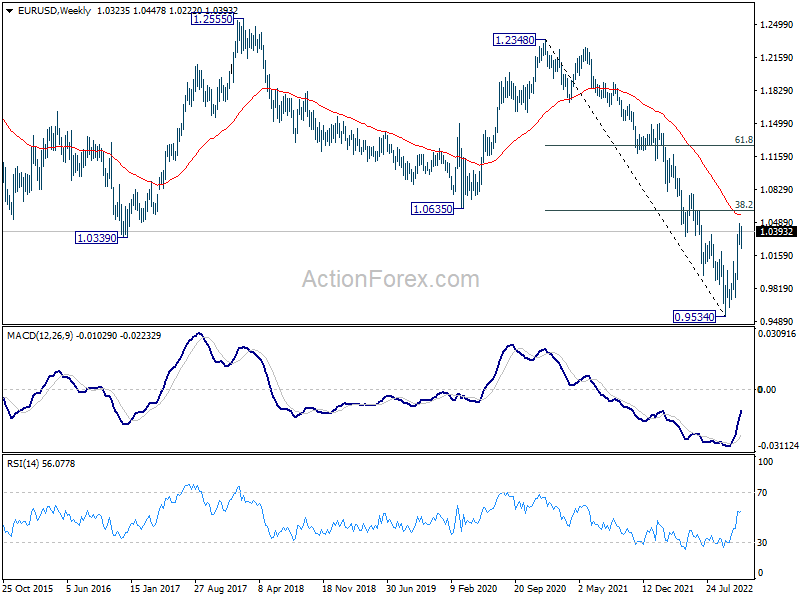
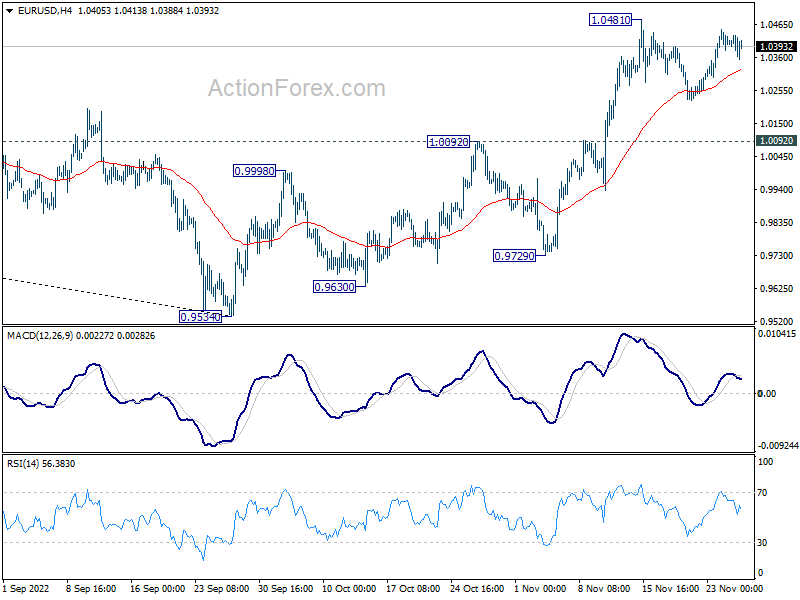
EUR/USD stayed in consolidation from 1.0481 last week and outlook is unchanged. Initial bias remains neutral this week first. As long as 1.0092 resistance turned support holds, further rally is expected. On the upside, break of 1.0481 will resume the rise from 0.9534 and target 1.0609 fibonacci level. However, sustained break of 1.0092 will argue that rebound from 0.9534 has completed, and turn bias back to the downside.
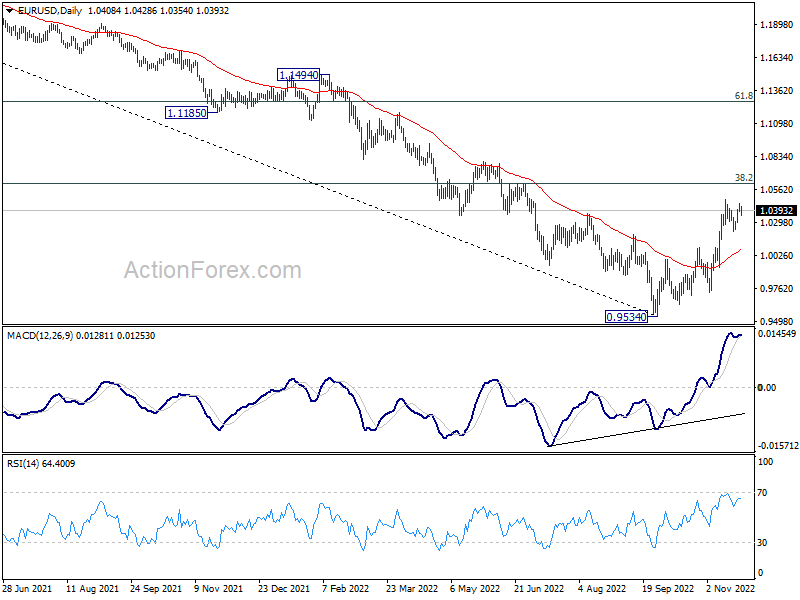
In the bigger picture, a medium term bottom was in place at 0.9534, on bullish convergence condition in daily MACD. Even as a corrective rise, rally from 0.9534 should target 38.2% retracement of 1.2348 (2021 high) to 0.9534 at 1.0609. Sustained trading above 55 week EMA (now at 1.0566) will raise the chance of trend reversal and target 61.8% retracement at 1.1273. This will now remain the favored case as long as 1.0092 resistance turned support holds.
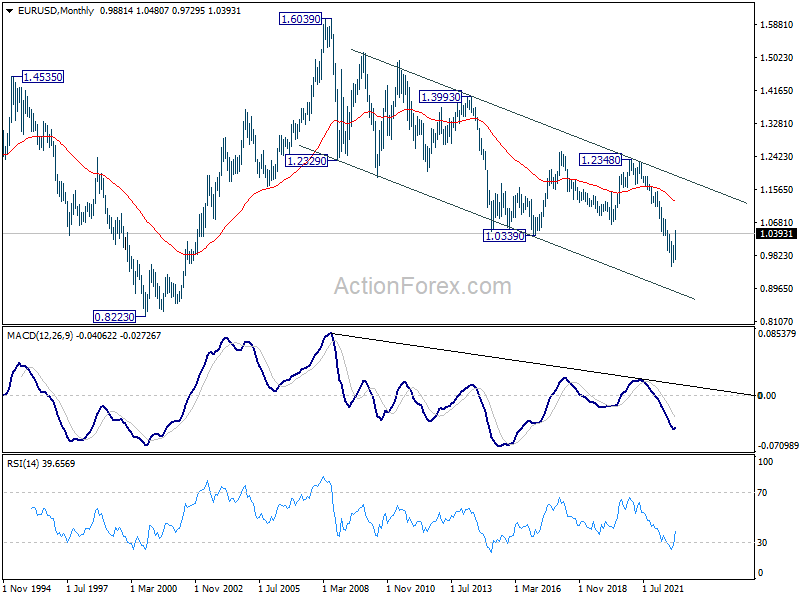
In the long term picture, as long as 1.0635 support turned resistance holds (2020 low), long term down trend from 1.6039 (2008) could still extend through 0.9534 at a later stage. However, sustained break of 1.0635 will confirm bottoming and at least turn long term outlook neutral.