Sample Category Title
USD/JPY Rises in Subdued Trading
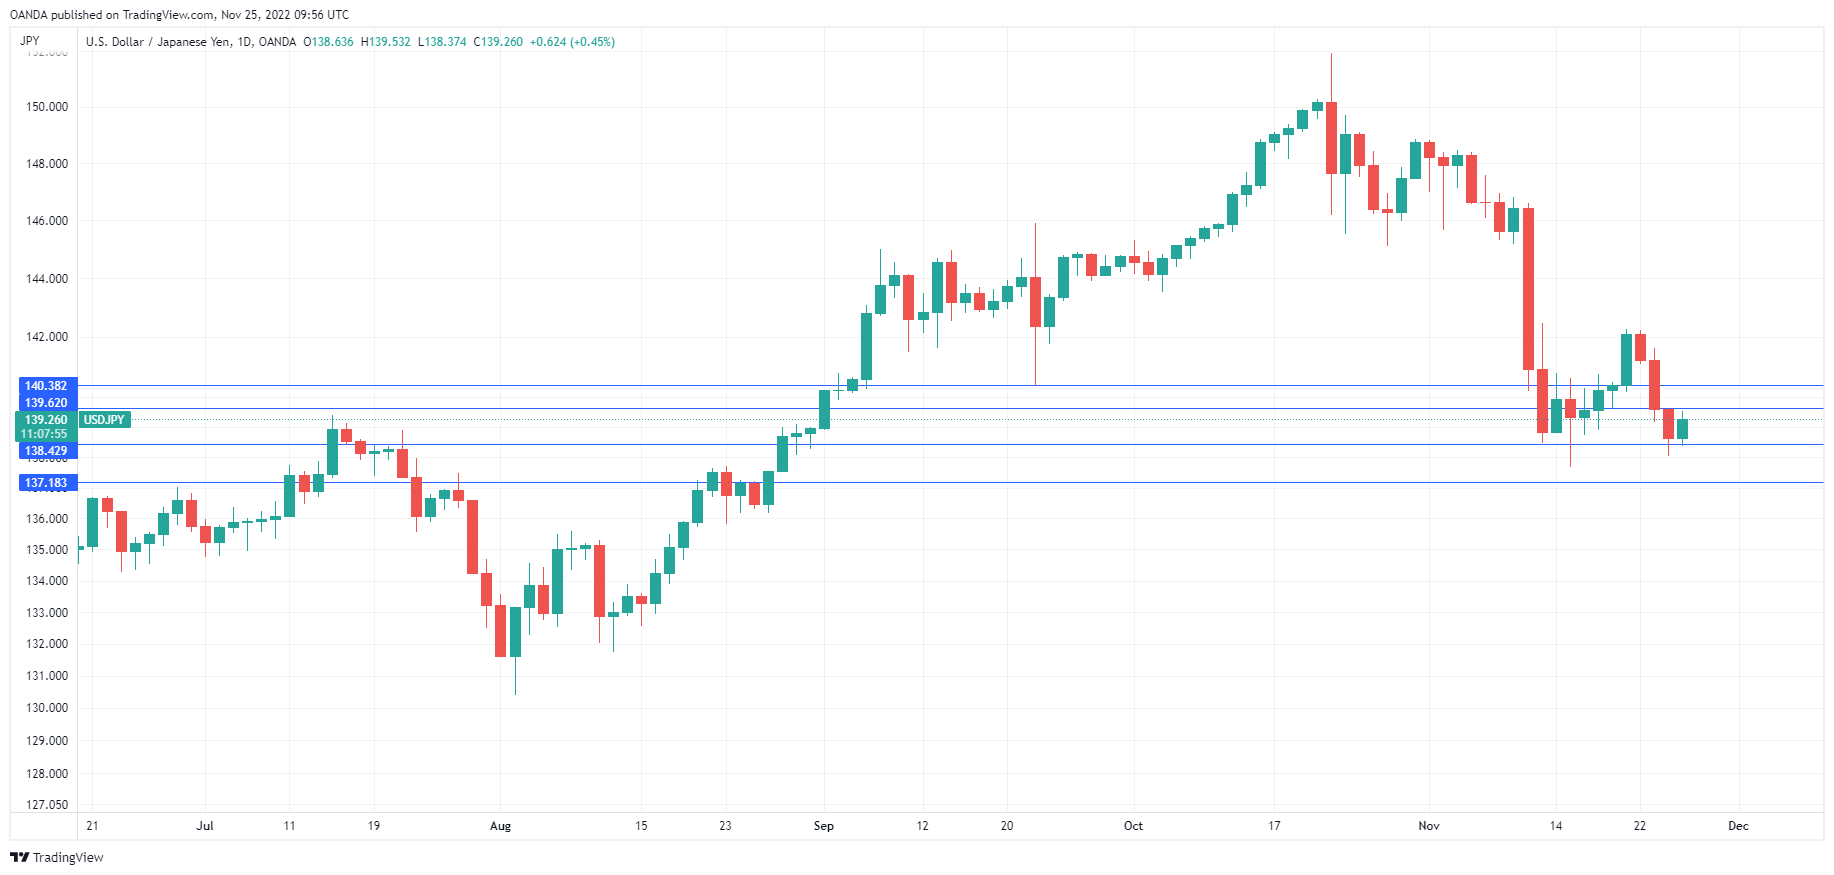
USD/JPY has reversed directions and posted gains on Friday, after three straight losing sessions. The yen is trading at 139.39, up 0.54% on the day. US markets are open for limited hours due to the Thanksgiving holiday, and there are no US releases on the schedule.
Tokyo inflation hits 40-year high
The caption above may sound dramatic, but inflation in Japan is far from the levels we’re seeing elsewhere, such as double-digits in the UK and the eurozone. Still, Japan finds itself dealing with rising inflation, after decades where deflation seemed a permanent part of the economic landscape. Tokyo Core CPI rose to 3.6% in November, nudging above the consensus of 3.5% and the consensus of 3.4%. This marked the highest reading since April 1982.
There’s no arguing that core inflation isn’t accelerating – Tokyo Core CPI has strengthened for six straight months and BOJ Core CPI for ninth consecutive months. This extended uptrend belies BOJ Governor Kuroda’s insistence that cost-push inflations is only temporary and that an ultra-accommodative policy is needed to ensure that inflation becomes sustainable. The BOJ is not showing any inclination to change policy and the recent improvement in the yen means one less headache, as the need for a currency intervention has diminished. It’s likely to be business as usual for the BOJ until the spring of 2023, with two key developments on the calendar – wage negotiations and a new governor for the central bank.
The Federal Reserve remains in a hawkish mode, sort of. The Fed’s stance, reiterated in this week’s minutes, remains somewhat mixed. On the one hand, the Fed has signalled that it will reduce the size of rate hikes “soon”, and the markets have priced in a ‘modest’ 50 bp hike in December after four consecutive 75-bp increases. At the same time, some Fed members are projecting that the terminal rate will be higher than previously expected. This mixed message has created uncertainty about what it means for the US dollar – will “lower for longer” raise risk sentiment and weigh on the dollar, or will investors view the Fed as remaining hawkish and stick with the US dollar? We’ll have to wait and see how the markets answer this question.
USD/JPY Technical
- USD/JPY faces resistance at 139.62 and 140.37
- There is support at 138.43 and 137.19
China PBoC cuts RRR, USD/CNH range bound
China's central bank PBoC announced to lower the reserve requirement ratio (RRR) by 0.25%, effect December 5. That's the second cut this year, last being in April. The move is expected to released around CNY 500B in long-term liquidity to support the economy.
PBoC sad in a statement the the cut is aimed at "keeping liquidity reasonably ample" and "increasing the support for the real economy." It will also help banks support industries troubled by the pandemic.
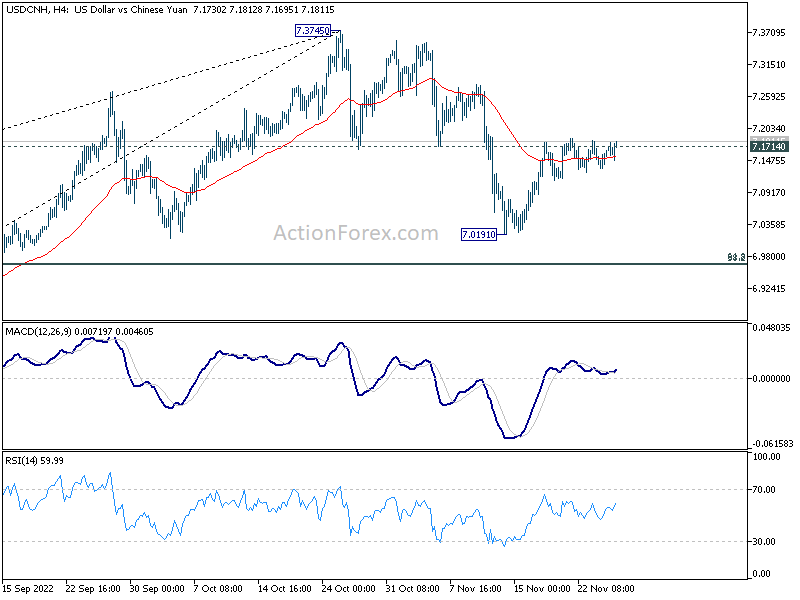
USD/CNH is staying in tight range after the announcement. Current development suggests that correction from 7.3745 might have completed at 7.0191 already, ahead of 7.0000 psychological level. Sustained break of 7.1714 support turned resistance will affirm this case, and bring stronger rise back to retest 7.3745 high.
Elliott Wave Aanalysis: Crude Oil Can Stabilze at $67-$72
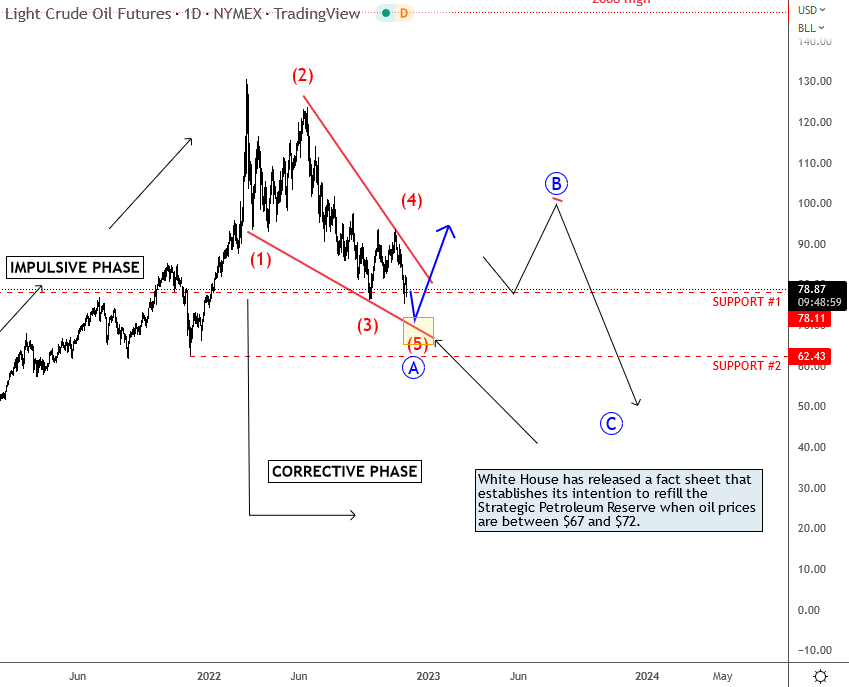
Markets are slow as most of traders will stay aside today after Thanksgiving yesterday in the US. So we think there will be no real changes in the price action and that market will stay in risk-on mode, at least from a technical perspective. The only thing that can shake the markets a bit going into a next week are potential new COVID restrictions in China after more cases were reported recently. Lower energy prices can also cause some volatility on CAD, NOK, and MXN after Saudi and Iraqi energy ministers said that they will introduce additional measures to ensure stability in the oil market. We see the energy coming down into the fifth wave of decline with some support seen at 72 area where the price may stabilize, at the lower side of a wedge pattern; a leading diagonal in wave A. In fact, weeks back the White House has released a fact sheet that establishes its intention to refill the Strategic Petroleum Reserve when oil prices are between $67 and $72, so yes, the downside can be limited.
EURGBP Wave Analysis
- EURGBP reversed from support level 0.8590
- Likely to rise to resistance level 0.8700
EURGBP just recently reversed up from the pivotal support level 0.8590 (that has been repeatedly reversing this currency pair from the middle of July, as can be seen below), standing near the daily Bollinger Band and by the 61.8% Fibonacci correction of the upward impulse from March
The upward reversal from the support level 0.8590 stopped the previous intermediate ABC correction (2) from the start of November.
EURGBP can be expected to rise further in the active impulse wave (3) toward the next resistance level 0.8700.
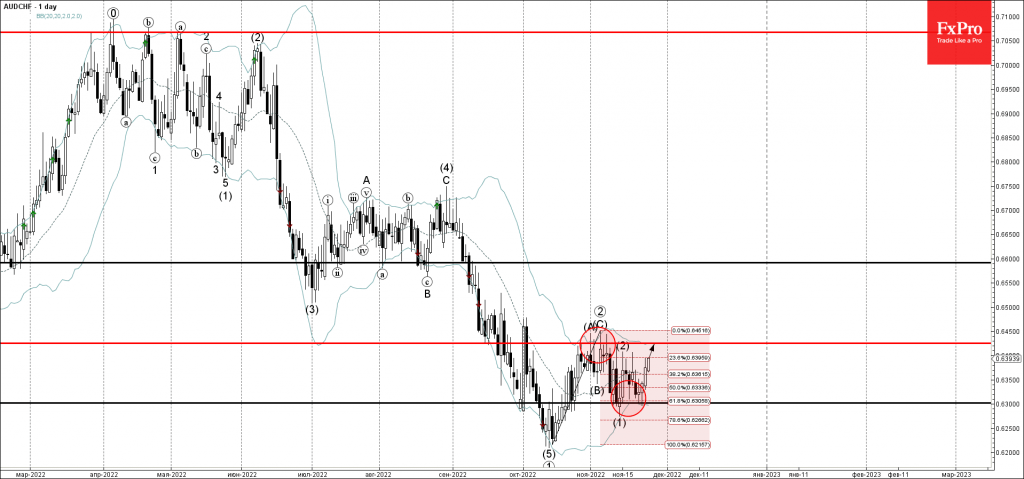
USDCHF Wave Analysis
- USDCHF reversed from support level 0.9380
- Likely to rise to resistance level 0.9500
USDCHF recently reversed up once again from the key support level 0.9380 (former resistance from March and the multi-month low from August).
The upward reversal from the support level 0.9380 created the daily candlesticks pattern Doji.
Given the oversold Stochastic, USDCHF can be expected to rise further toward the next resistance level 0.9500 (former monthly low from September).
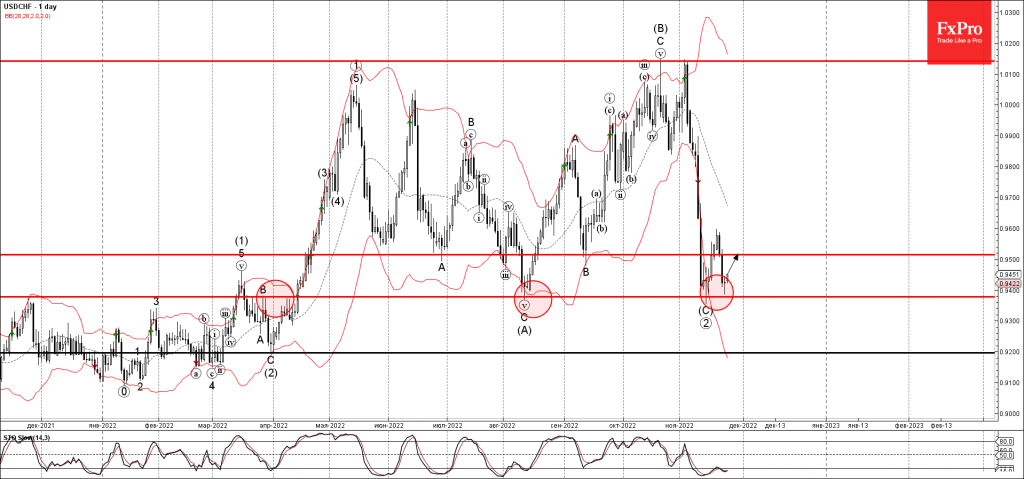
AUDCHF Wave Analysis
- AUDCHF reversed from support level 0.6300
- Likely to rise to resistance level 0.6425
AUDCHF recently reversed up from the strong support level 0.6300 (which stopped wave (1) with the daily Morning Star from the start of November).
The support level 0.6300 was further strengthened by the lower daily Bollinger Band and by the 61.8% Fibonacci correction of the upward correction from October.
Given the oversold Stochastic, AUDCHF can be expected to rise further toward the next resistance level 0.6425 (which has been reversing the price from October).
NZD/USD Down Despite Rise in Retail Sales
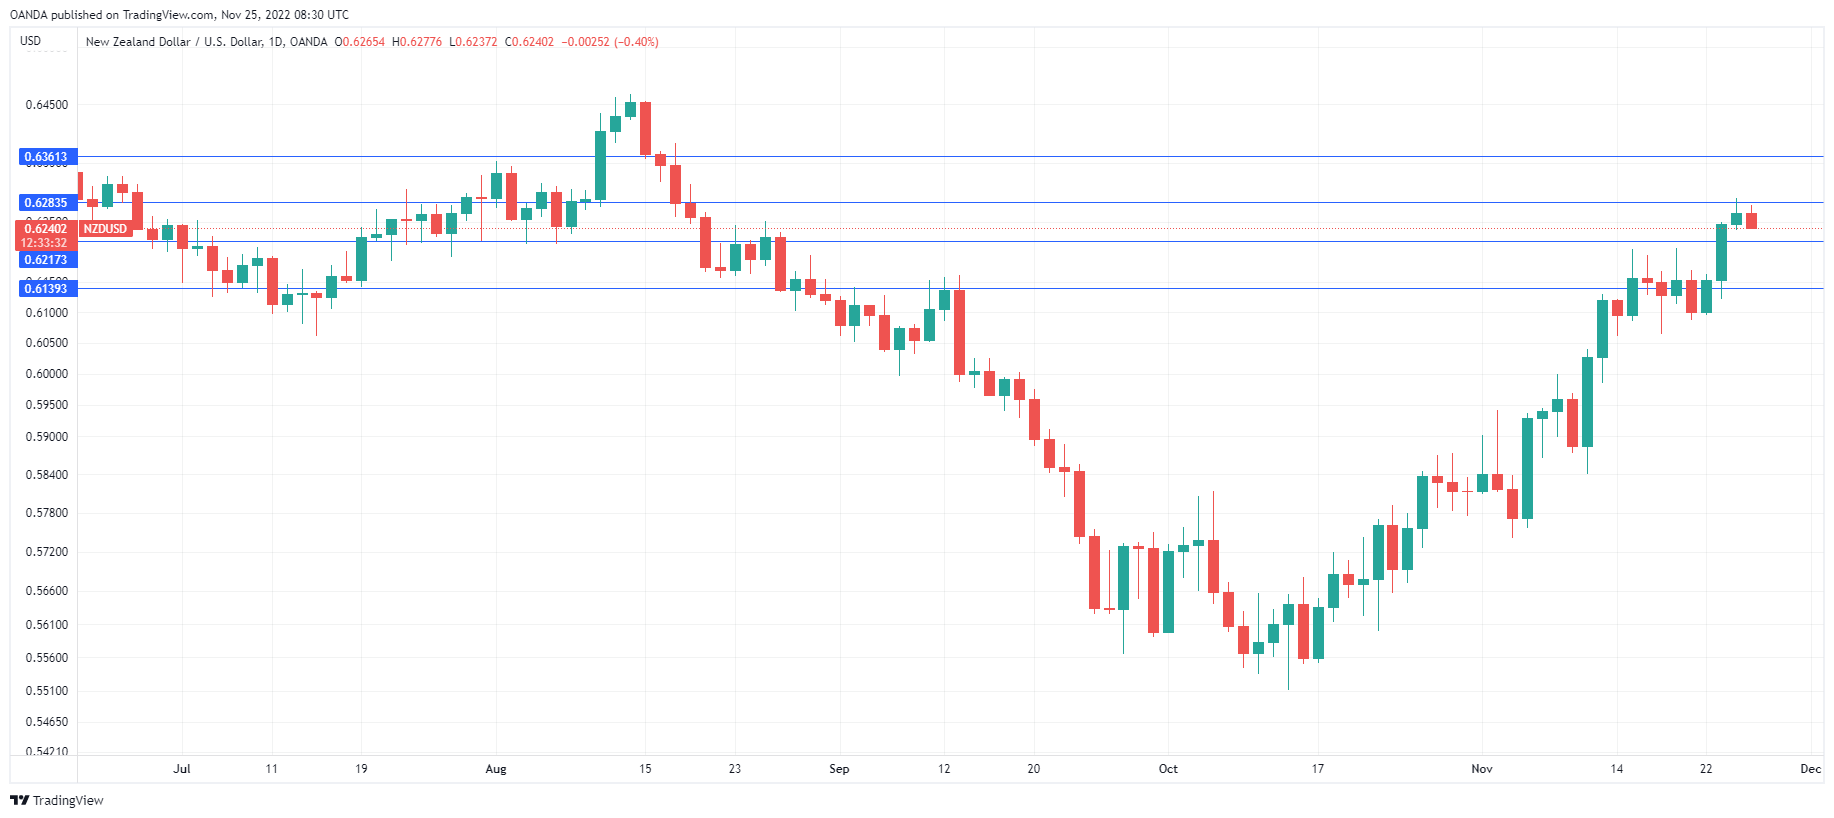
The New Zealand dollar has edged lower on Friday. In the European session, NZD/USD is trading at 0.6244, down 0.33%.
Retail sales post modest gain
It wasn’t a spectacular rebound by any means, but New Zealand’s retail sales showed a gain in Q3. Headline and core retail sales both rose a modest 0.4% QoQ. This follows a soft Q2, when headline retail sales came in at -2.2% and the core release at -1.5%. The reaction of NZD/USD was subdued, likely a result of the Thanksgiving holiday, with US markets open for limited hours today.
Retail sales data may not be as positive in Q4, with the Reserve Bank of New Zealand hiking rates by a massive 0.75% this week. The RBNZ has signalled that household spending will have to drop in order to curb inflation, and with more rate hikes still to come, it’s clear that household spending will come down during the current rate-hike cycle.
The Federal Reserve has telegraphed to the markets that it will continue to raise rates, despite the last inflation report, which was softer than expected. The Fed’s message, reiterated in this week’s minutes, remains somewhat mixed. On the one hand, the Fed has signalled that the pace of rates will be easing, and the markets have priced in a ‘modest’ 50 bp hike in December after four consecutive 75-bp increases. At the same time, some Fed members are projecting that the terminal rate will be higher than previously expected. There is uncertainty as to whether this “lower for longer” stance is bullish or bearish for the US dollar, a question we’ll have to wait for market participants to answer.
NZD/USD Technical
- NZD/USD faces resistance at 0.6283 and 0.6361
- There is support at 0.6217 and 0.6139
GBPJPY Maintains Weak Bias in Near-term; Broader Trend is Bullish
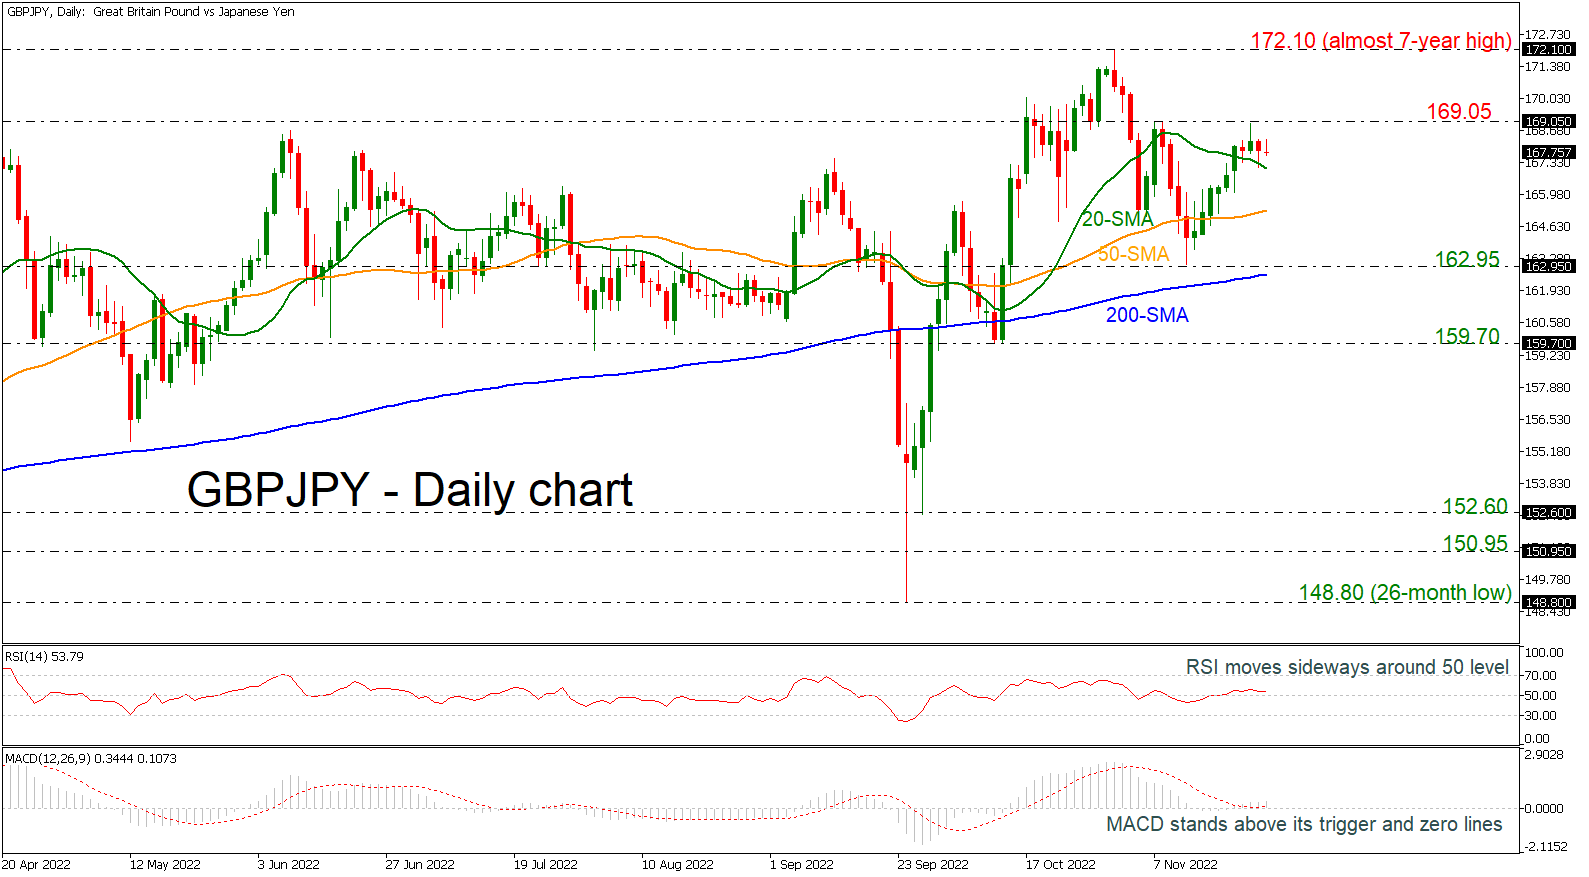
GBPJPY is retreating somewhat above the downward sloping short-term simple moving averages (SMAs). The rebound off the 162.95 support level lasted until the 169.05 resistance level, with the technical oscillators confirming the recent sideways move. The RSI is flattening above the neutral threshold of 50, while the MACD is standing above its trigger line in the positive region, but the momentum is very weak.
Should prices reverse lower, immediate support could come from the 20-day SMA at 167.10 ahead of the 50-day SMA at 165.27. A drop below this area would take the pair closer to the 162.95 barrier and the 200-day SMA currently at 162.60. Further losses would open the way towards the 159.70 bottom, while a breach of this level would shift the outlook from positive to neutral.
To the upside, there is immediate resistance just above the 169.00 psychological mark, while above that, the next major resistance to watch is the almost seven-year peak of 172.10. If there are further advances, the bulls may extend the upside move towards the inside swing low from April 2015 at 175.00.
To summarize, GBPJPY has been in an ascending movement since March 2020 in the long-term timeframe; however, the short-term picture is lacking a clear direction. Any climbs above the multi-year peak would endorse the broader outlook again.
EUR/USD Pair is Now Rising and Trading above 1.0400
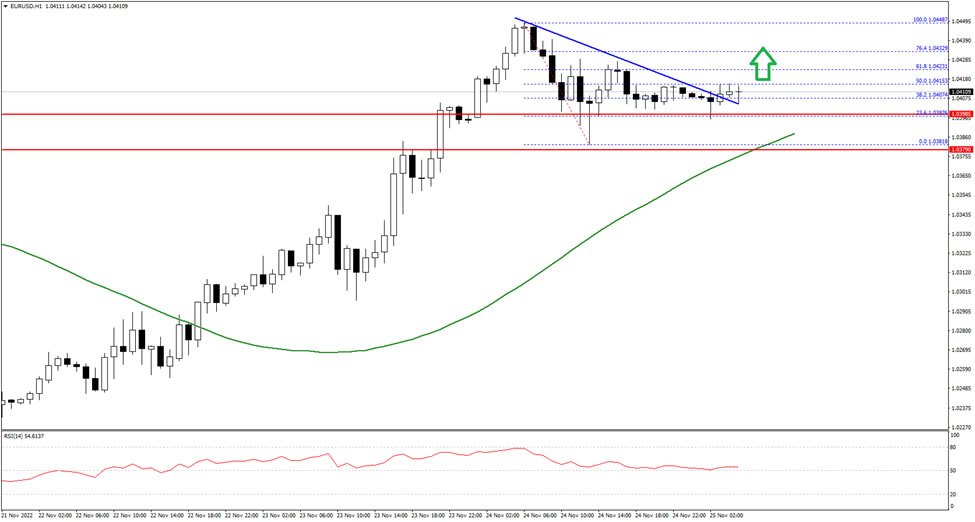
The Euro started a steady increase above the 1.0300 and 1.0320 resistance levels against the US Dollar. The EUR/USD pair gained pace above the 1.0380 level to move into a positive zone.
It tested the 1.0450 zone before there was a correction towards 1.0380. The pair is now rising and trading above the 1.0400 level and the 50 hourly simple moving average. It seems to be facing resistance near the 1.0415 on FXOpen.
The first major resistance is near the 1.0432 level. A break above the 1.0432 resistance level could start a fresh upward wave. In the stated case, it could even climb above 1.0450.
Conversely, the pair might start a fresh drop below 1.0385. The next key support is near 1.0350, below the pair could drop towards the 1.0320 level. Any more losses might send the pair towards the 1.0300 level in the coming sessions.
Elliott Wave View: GBPUSD Near Term Remains Bullish
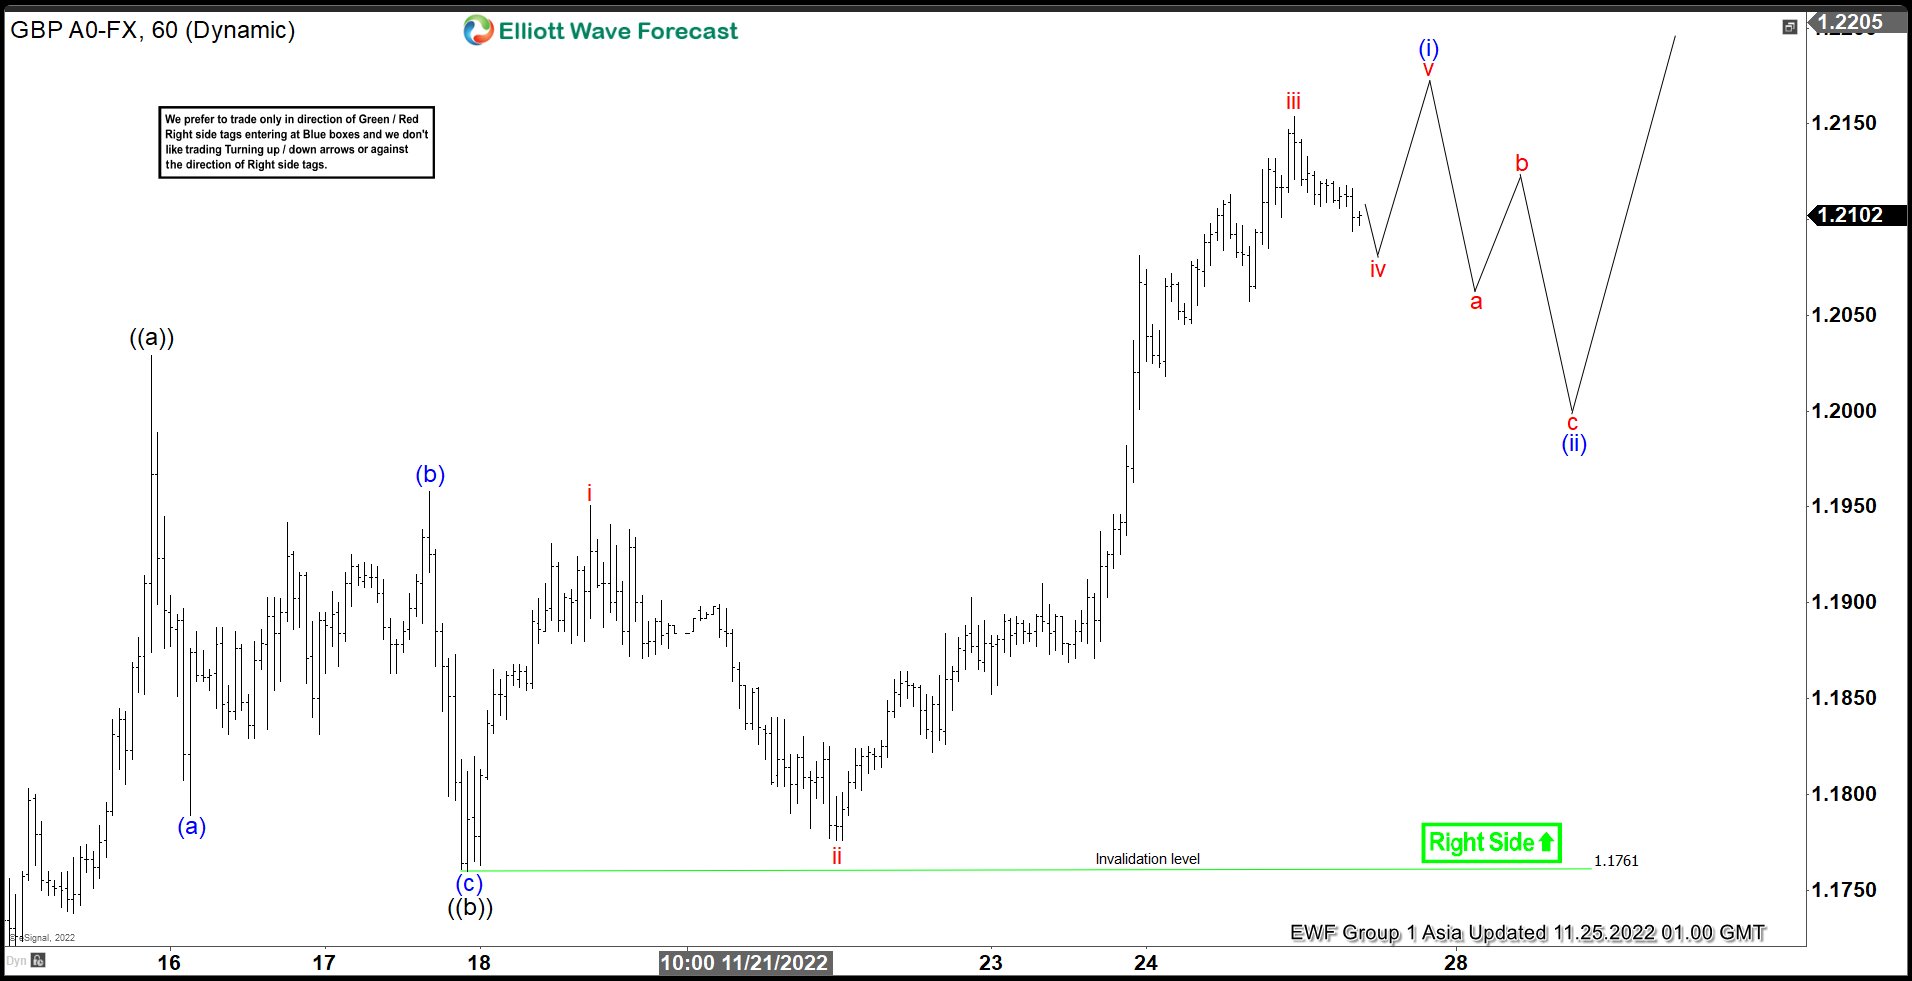
Short term Elliott Wave View in GBPUSD suggests that the cycle from 11.4.2022 low is unfolding as a zigzag Elliott Wave structure. Up from 11.4.2022 low, wave ((a)) ended at 1.2029. Pullback in wave ((b)) unfolded as a zigzag structure in lesser degree. Down from wave ((a)), wave (a) ended at 1.1789 and rally in wave (b) ended at 1.1958. Wave (c) lower ended at 1.176 which completed wave ((b)). Wave ((c)) higher is currently in progress as a 5 waves impulse structure.
Up from wave ((b)), wave i ended at 1.1951 and dips in wave ii ended at 1.1776. Pair extends higher in wave iii towards 1.2154. Expect pair to pullback in wave iv then rally again in wave v to end larger degree wave (i). Afterwards, it should pullback in wave (ii) to correct cycle from 11.17.2022 low before the rally resumes in wave (iii). Near term, as far as 11.17.2022 pivot at 1.1761 low stays intact, expect dips to find support in 3, 7, or 11 swing for further upside. Potential target higher is 100% – 161.8% Fibonacci extension from 11.4.2022 low which comes at 1.264 – 1.318 area.
GBPUSD 60 Minutes Elliott Wave Chart