

Sample Category Title
AUD/USD Daily Report
Daily Pivots: (S1) 0.6735; (P) 0.6756; (R1) 0.6786; More...
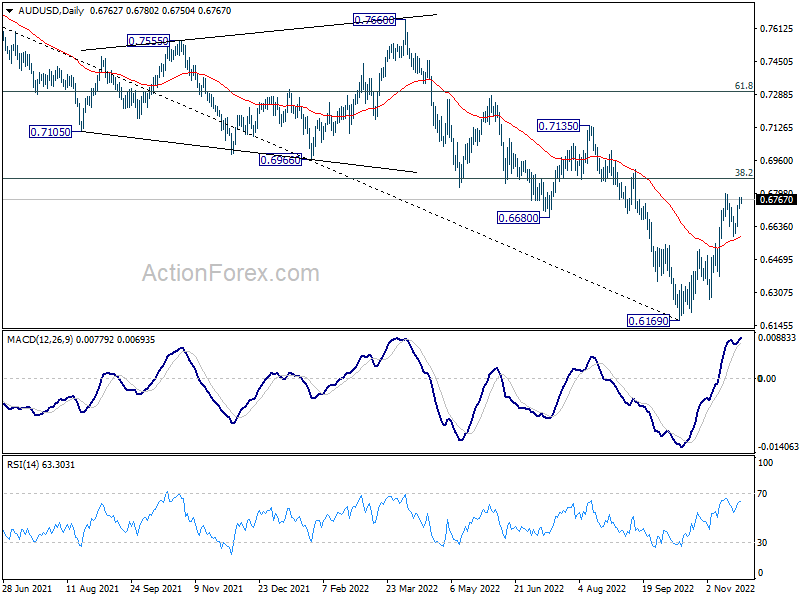
Intraday bias in AUD/USD remains neutral and outlook is unchanged. Further rise is expected as long as 0.6521 resistance turned support holds. On the upside, break of 0.6796 will resume the rise from 0.6169 to 0.6871 fibonacci level. However, sustained break of 0.6521 will argue that whole rebound from 0.6169 is over, and bring deeper fall to retest this low.
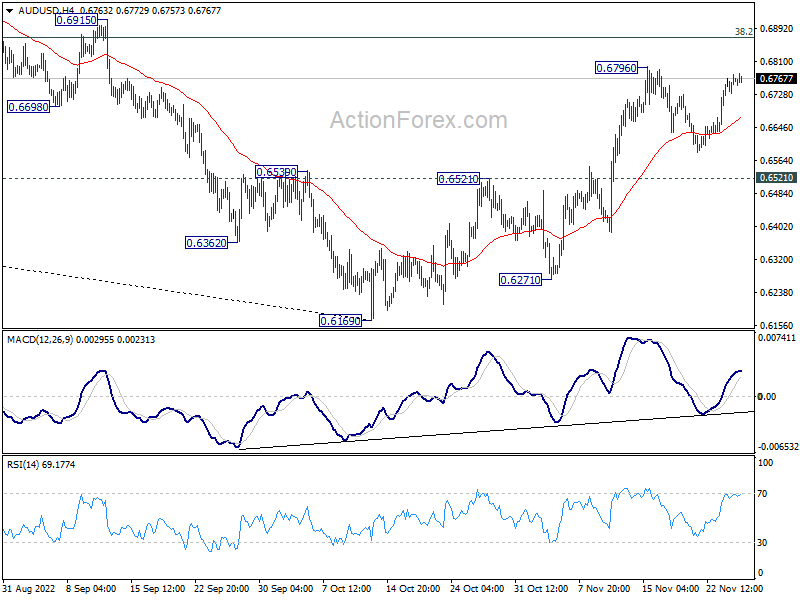
In the bigger picture, a medium term bottom is in place at 0.6160 already. But it's too early to call for trend reversal. Nevertheless, even as a corrective move, rise from 0.6169 should target 38.2% retracement of 0.8006 to 0.6169 at 0.6871. Sustained trading above 55 week EMA (now at 0.6923) will raise the chance of the start of a bullish up trend. This week now remain the favored case as long as 0.6521 resistance turned support holds.
USD/CAD Daily Outlook
Daily Pivots: (S1) 1.3316; (P) 1.3339; (R1) 1.3361; More....
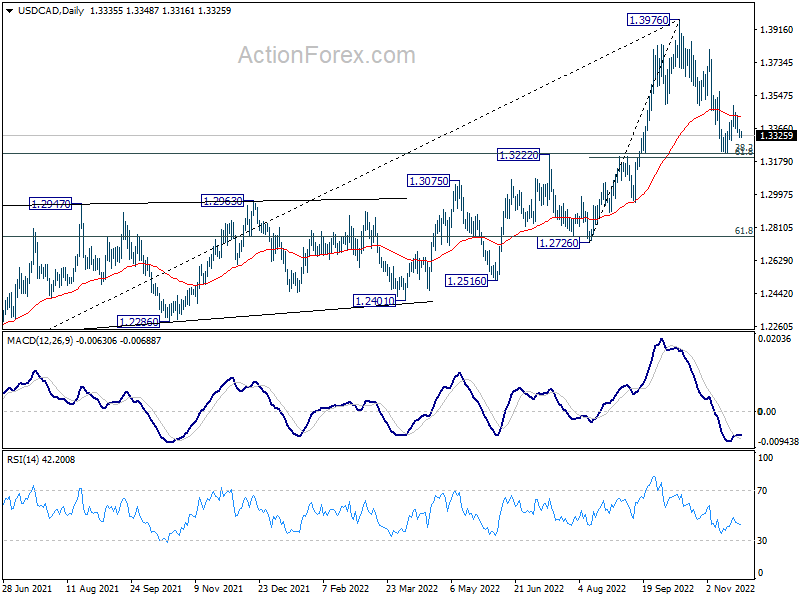
Intraday bias in USD/CAD remains neutral and outlook is unchanged. On the upside, firm break of 1.3494 will indicate that correction from 1.3976 has completed at 1.3224, ahead of 1.3207 cluster support (61.8% retracement of 1.2726 to 1.3976 at 1.3204). Intraday bias will be turned back to the upside for 1.3807/3976 resistance zone. However, on the downside, sustained break of 1.3204/7 will carry larger bearish implication and target 1.2952 support next.
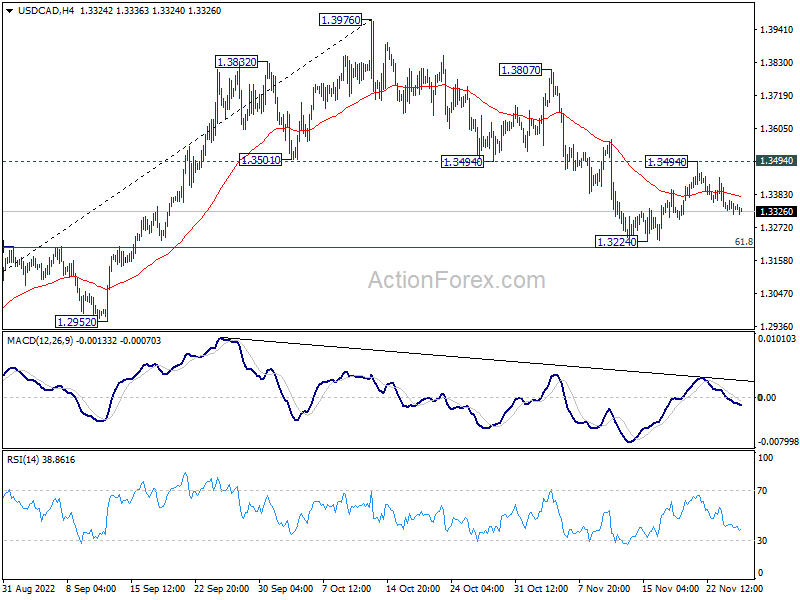
In the bigger picture, as long as 1.3222 cluster support (38.2% retracement of 1.2005 to 1.3976 at 1.3223) holds, larger up trend from 1.2005 (2021 low) is still expected to resume through 1.3976 high at a later stage. . However, firm break of 1.3222/3 will indicate that the trend might have reversed. Deeper fall would be seen to next cluster support at 1.2726 (61.8% retracement at 1.2758).
GBP/JPY Daily Outlook
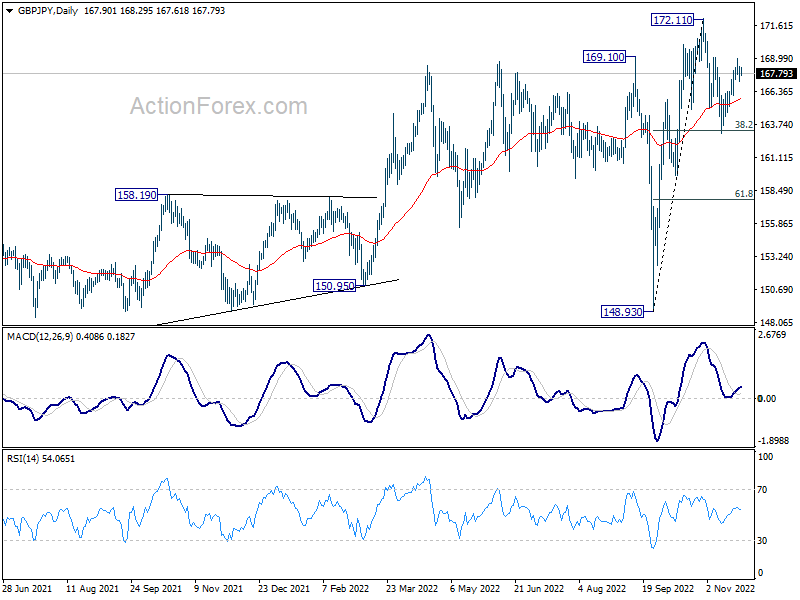
Daily Pivots: (S1) 167.30; (P) 167.80; (R1) 168.44; More...
Intraday bias in GBP/JPY stays neutral for the moment. In the upside, break of 169.07 resistance will argue that larger up trend is ready to resume through 172.11 high. However, break of 166.08 minor support will turn bias back to the downside to extend the corrective pattern from 172.11 with another fall.
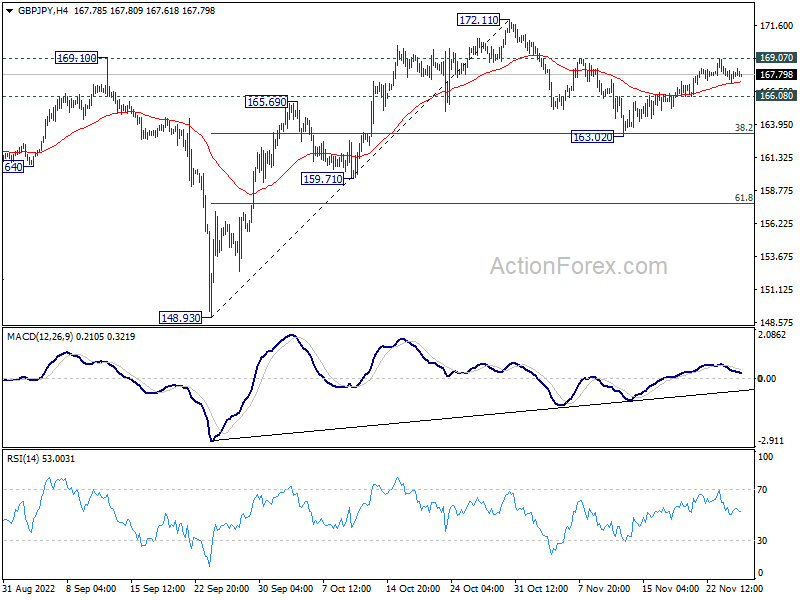
In the bigger picture, there is no clear sign of medium term topping yet. Up trend from 123.94 (2020 low) could still resume through 172.11 high at a later stage. However, firm break of 159.71 support will argue that it's already in correction to the up trend from 123.94, and deeper decline would be seen back towards 148.93 support.
EUR/JPY Daily Outlook
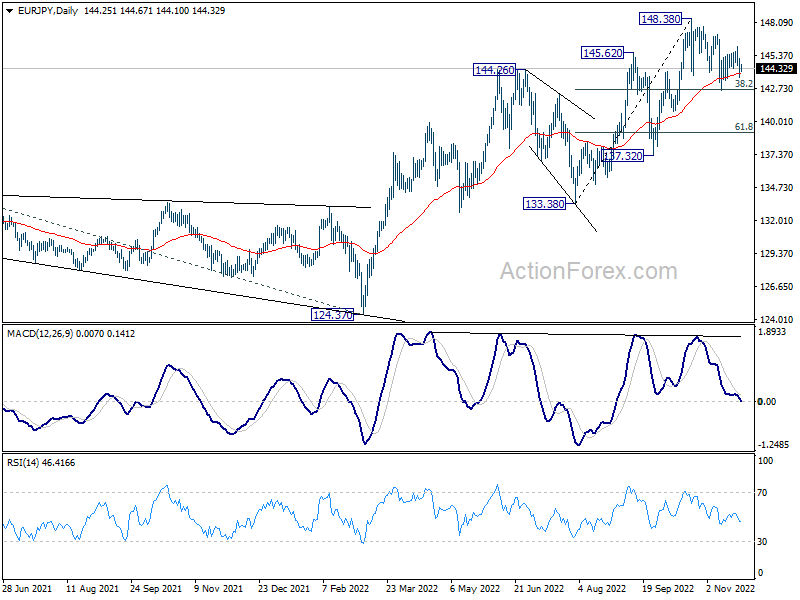
Daily Pivots: (S1) 143.61; (P) 144.40; (R1) 145.14; More....
Intraday bias in EUR/JPY is back on the downside with break of 144.32 minor support. Corrective pattern from 148.38 is extending with another falling leg. Deeper decline would be seen to 142.54 support next. For now, risk will stay on the downside as long as 146.12 resistance holds, in case of recovery.
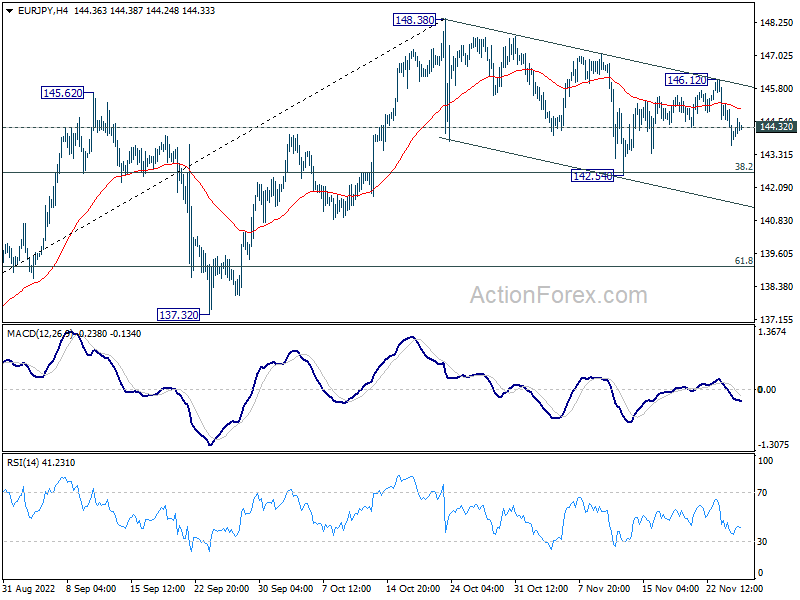
In the bigger picture, there is no clear sign of medium term topping yet. Up trend from 114.42 (2020 low) could still resume through 148.38 to 149.76 (2014 high). However, break of 137.32 support argue that a medium term correction has already started to correct the whole up trend from 114.42.
EUR/GBP Daily Outlook
Daily Pivots: (S1) 0.8566; (P) 0.8601; (R1) 0.8629; More...
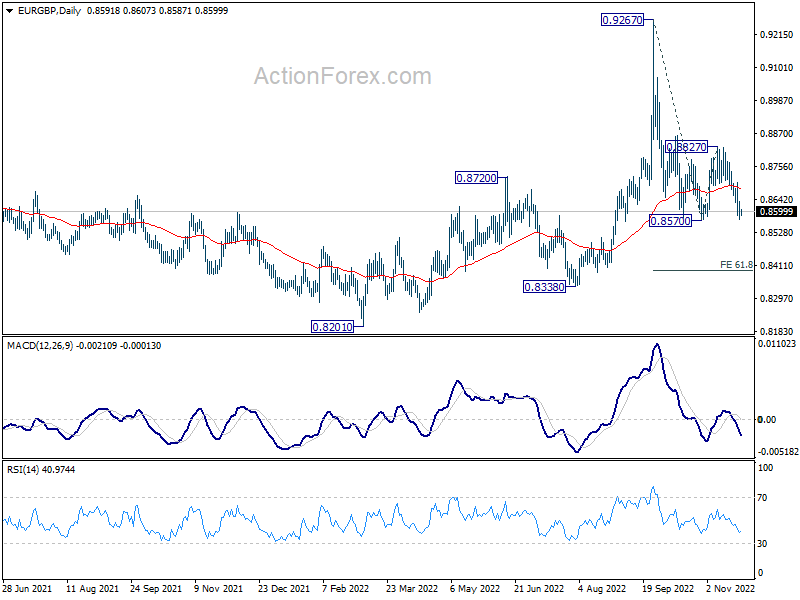
Immediate focus is now on 0.8570 support in EUR/GBP. Firm break there will resume the decline from 0.9267. Next target is 61.8% projection of 0.9267 to 0.8570 from 0.8827 at 0.8369. For now risk will stay on the downside as long as 0.8827 resistance holds, in case of recovery.
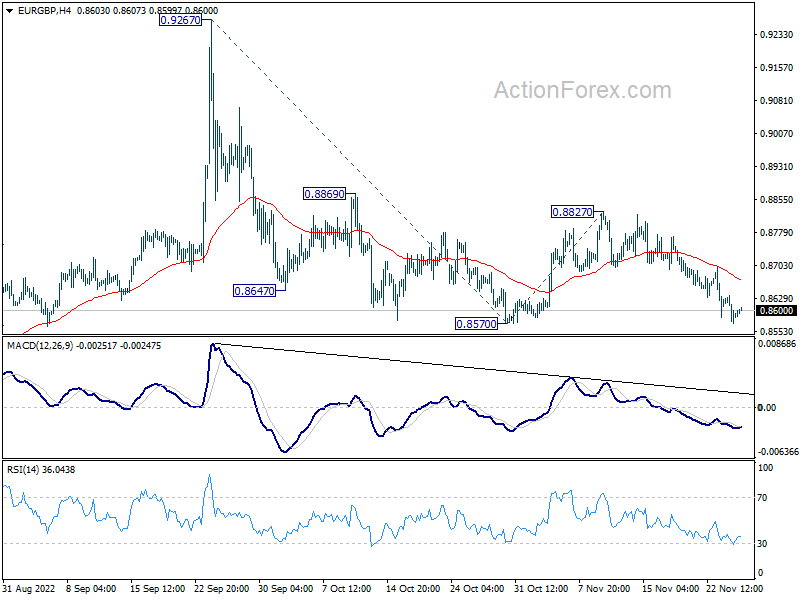
In the bigger picture, current development suggests that fall from 0.9267 is a down leg inside long term range pattern. Deeper fall could be seen towards 0.8201/8338 support zone. But strong support should be seen there to bring reversal. Nevertheless, firm break of 0.8869 resistance will turn favor to the case that such decline is merely a correction in the up trend from 0.8201. That is, further rally would be seen at a later stage through 0.9267.
EUR/AUD Daily Outlook
Daily Pivots: (S1) 1.5351; (P) 1.5406; (R1) 1.5445; More...
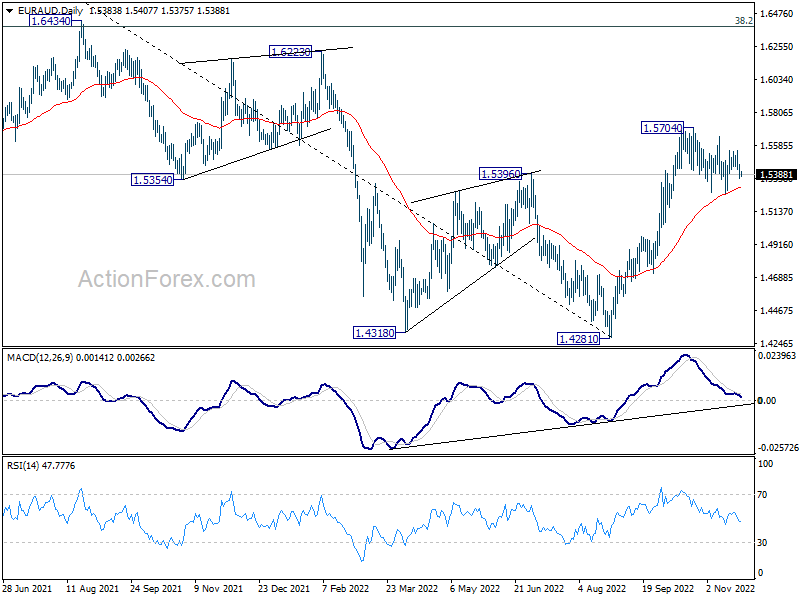
EUR/AUD is still extending the consolidation from 1.5704 and intraday bias remains neutral. In case of deeper fall, downside should be contained by 55 day EMA (now at 1.5301) to bring rebound. On the upside, decisive break of 1.5704 will resume larger rise from 1.4281. However, sustained trading below 55 day EMA will bring deeper correction towards 1.4965 resistance turned support.
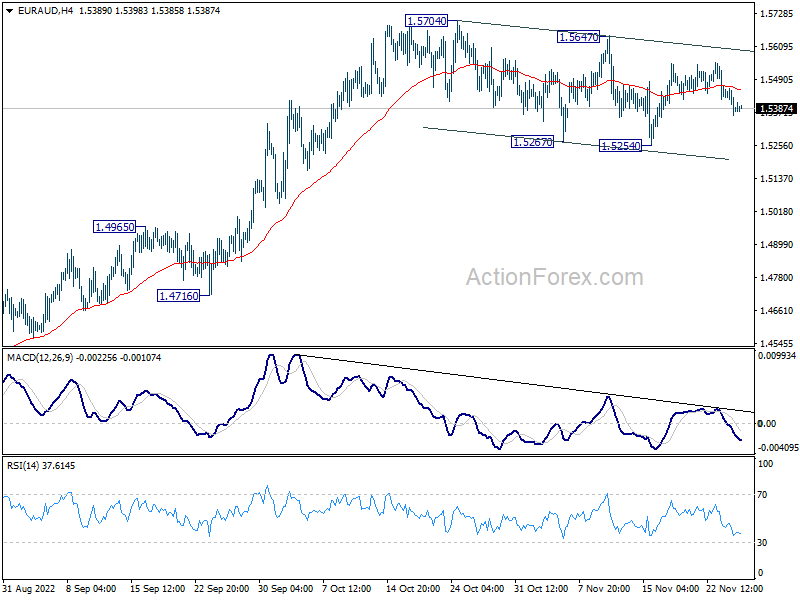
In the bigger picture, a medium term bottom should be in place at 1.4281, on bullish convergence condition in daily MACD. Further rise would be seen back to 1.6434 key resistance next. Break of 1.4965 resistance turned support is needed to indicate reversal. Otherwise, further rally will remain in favor.
EUR/CHF Daily Outlook
Daily Pivots: (S1) 0.9800; (P) 0.9818; (R1) 0.9841; More....
Intraday bias in EUR/CHF remains neutral at this point as consolidation from 0.9953 is extending. On the upside, firm break of 0.9953 resistance will resume larger rally from 0.9407 to 1.0072 fibonacci level. However, break of 0.9720 will extend the decline from 0.9953 to 61.8% retracement of 0.8407 to 0.9953 at 0.9616.
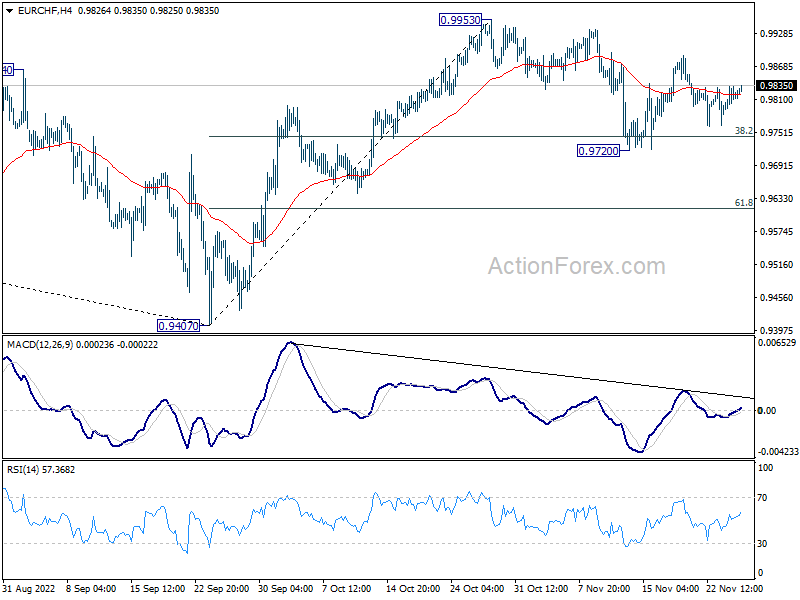
In the bigger picture, rejection by 0.9970 support turned resistance retains medium term bearishness. That is, while 0.9407 is a medium term bottom, price actions from there would develope into a corrective pattern rather than a reversal. Down trend resumption through 0.9407 is mildly favored at a later stage. This will remain the favored case now, as long 38.2% retracement of 1.1149 to 0.9407 at 1.0072 holds.
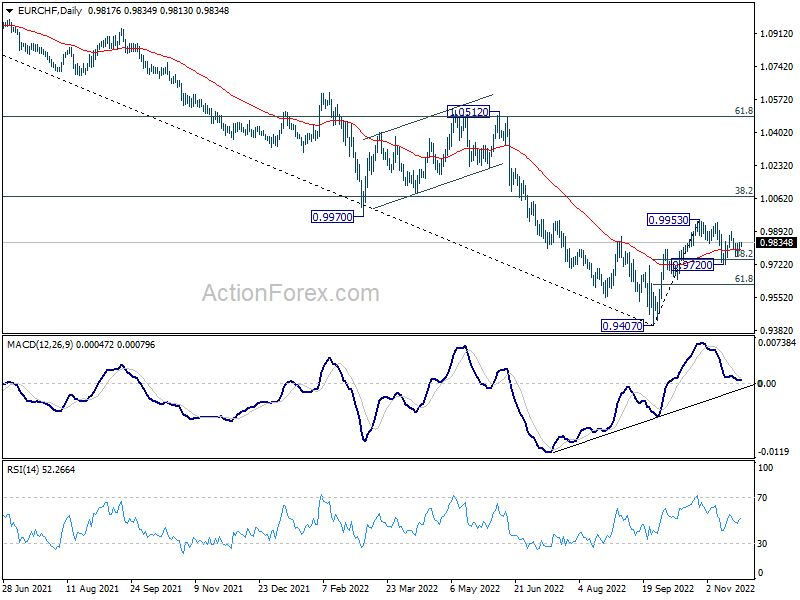
NZ retail sales volume rose 0.4% qoq in Q3, value rose 2.5% qoq
New Zealand retail sales volume rose 0.4% qoq to NZD 26B in Q3, slightly below expectation of 0.5% qoq. Sale value rose 2.5% qoq to NZD 30B. Comparing with Q3 2021, sales volume rose 4.9% yoy and sales value rose 15% yoy.
StatsNZ said, "The volume of sales in the food and beverage services industry (which includes cafes, restaurants, bars, and takeaways), increased 30 percent in the September 2022 quarter compared with the September 2021 quarter, helping to drive the rise in total retail sales."
Technical Outlook and Review
USD/JPY:
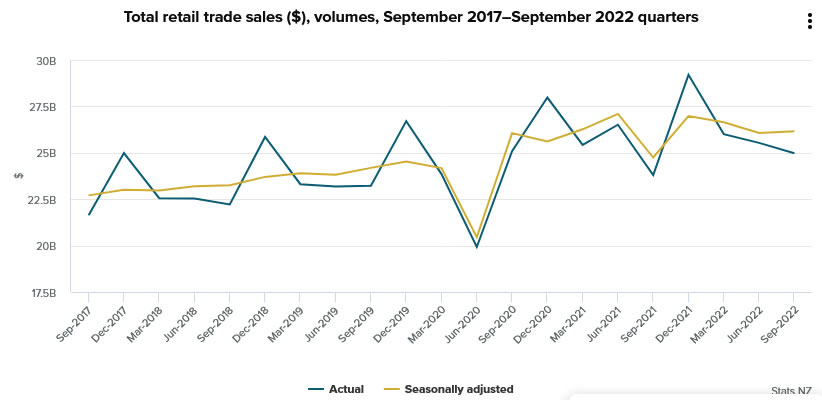
The current general bias for USDJPY on the H4 chart is bearish. To add confluence to this, the price is under the Ichimoku cloud which indicates a bearish market. If the bearish momentum continues, expect USDJPY to head towards the 1st support line at 138.091, where the –27.2% Fibonacci expansion line is located. In an alternative scenario, price could go up to retest the 1st resistance line at 140.356, where the -61.8% Fibonacci expansion line and previous low are located.
Areas of consideration:
- H4 time frame, 1st resistance at 140.356
- H4 time frame, 1st support at 138.091
DXY:
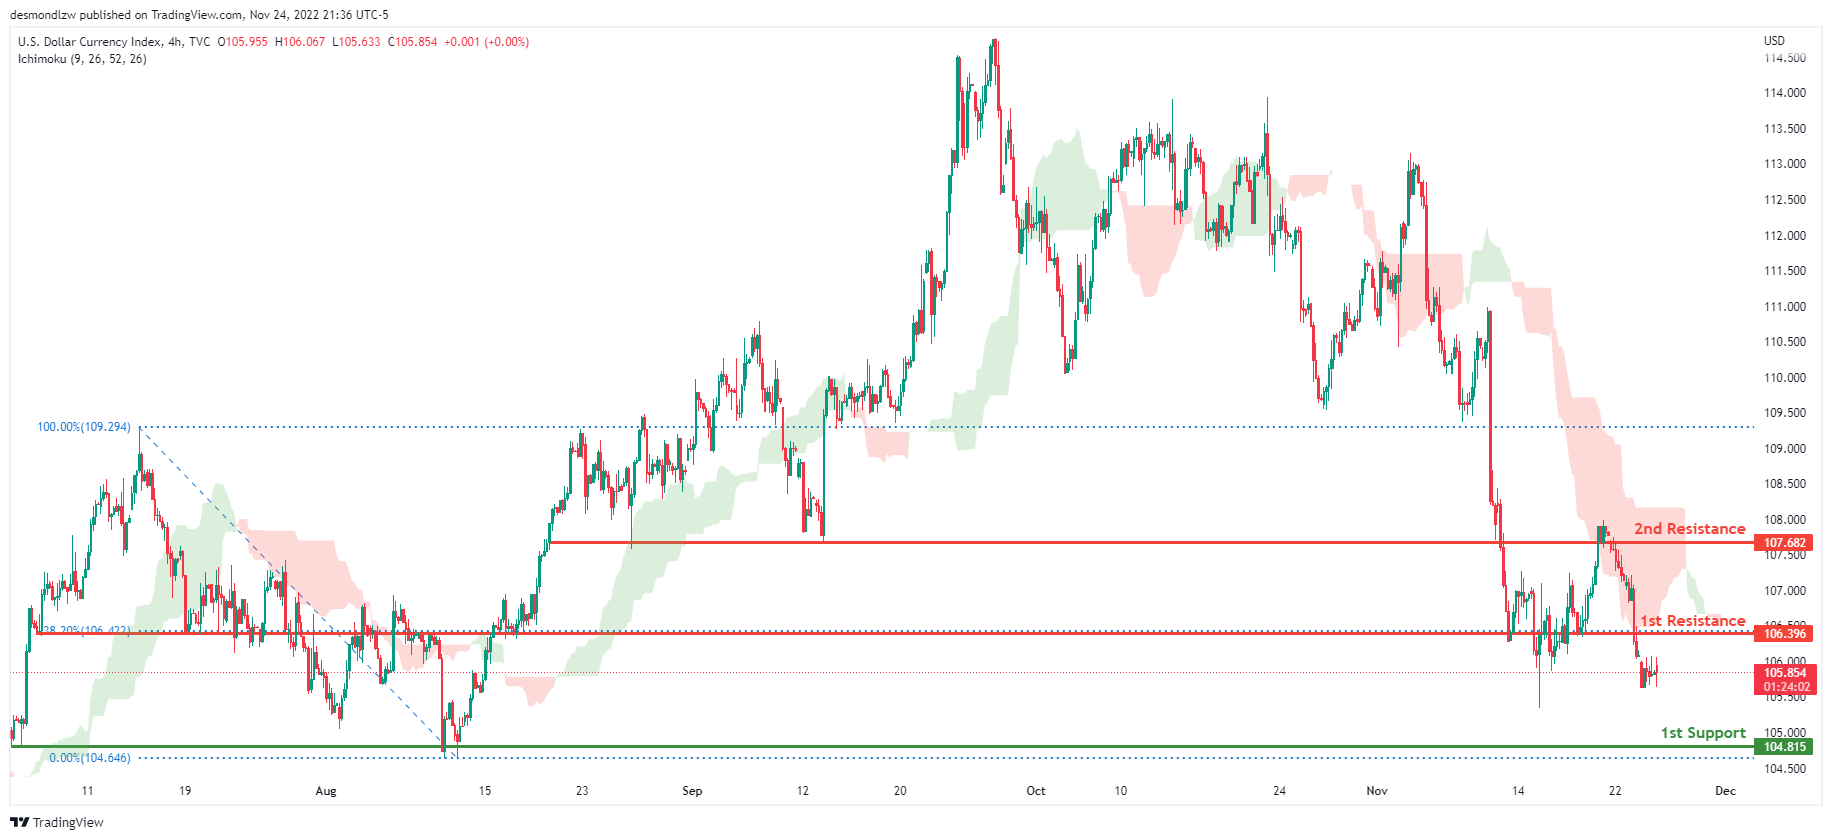
On the H4 chart, the overall bias for DXY is bearish. To add confluence to this, the price is crossing below the Ichimoku cloud which indicates a bearish market. If this bearish momentum continues, expect the price to head towards the 1st support line at 104.815 where the previous low and the 0% Fibonacci line are located. In an alternative scenario, price could head back up and retest the 1st resistance line at 106.396 where the 38.2% fibonacci line is located.
Areas of consideration:
- H4 time frame, 1st resistance at 106.396
- H4 time frame, 1st support at 104.815
EUR/USD:
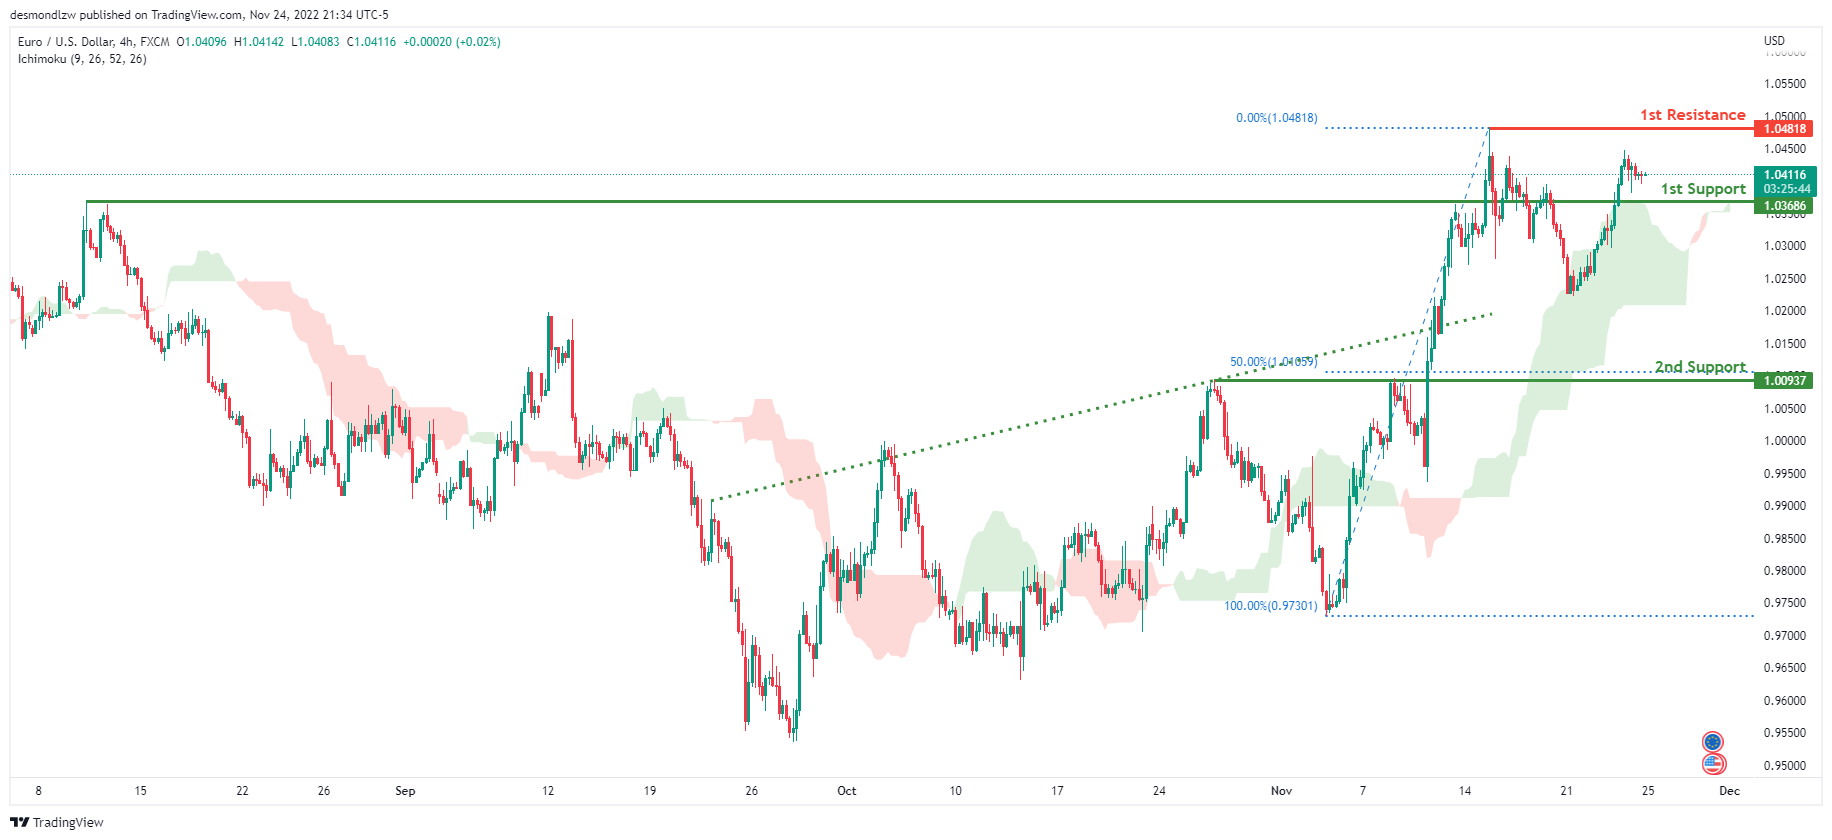
Looking at the H4 chart, my overall bias for EURUSD is bullish due to the current price being above the Ichimoku cloud, indicating a bullish market. To add confluence to this bias, price has also broken above the ascending trend line. If this bullish momentum continues, expect the price to possibly head towards the 1st resistance at 1.04818, where the previous swing high is located. In an alternate scenario, price could possibly head back down towards the 1st support level at 1.03686, where the previous swing high is located.
Areas of consideration :
- H4 1st resistance at 1.04818
- H4 1st support at 1.03686
GBP/USD:
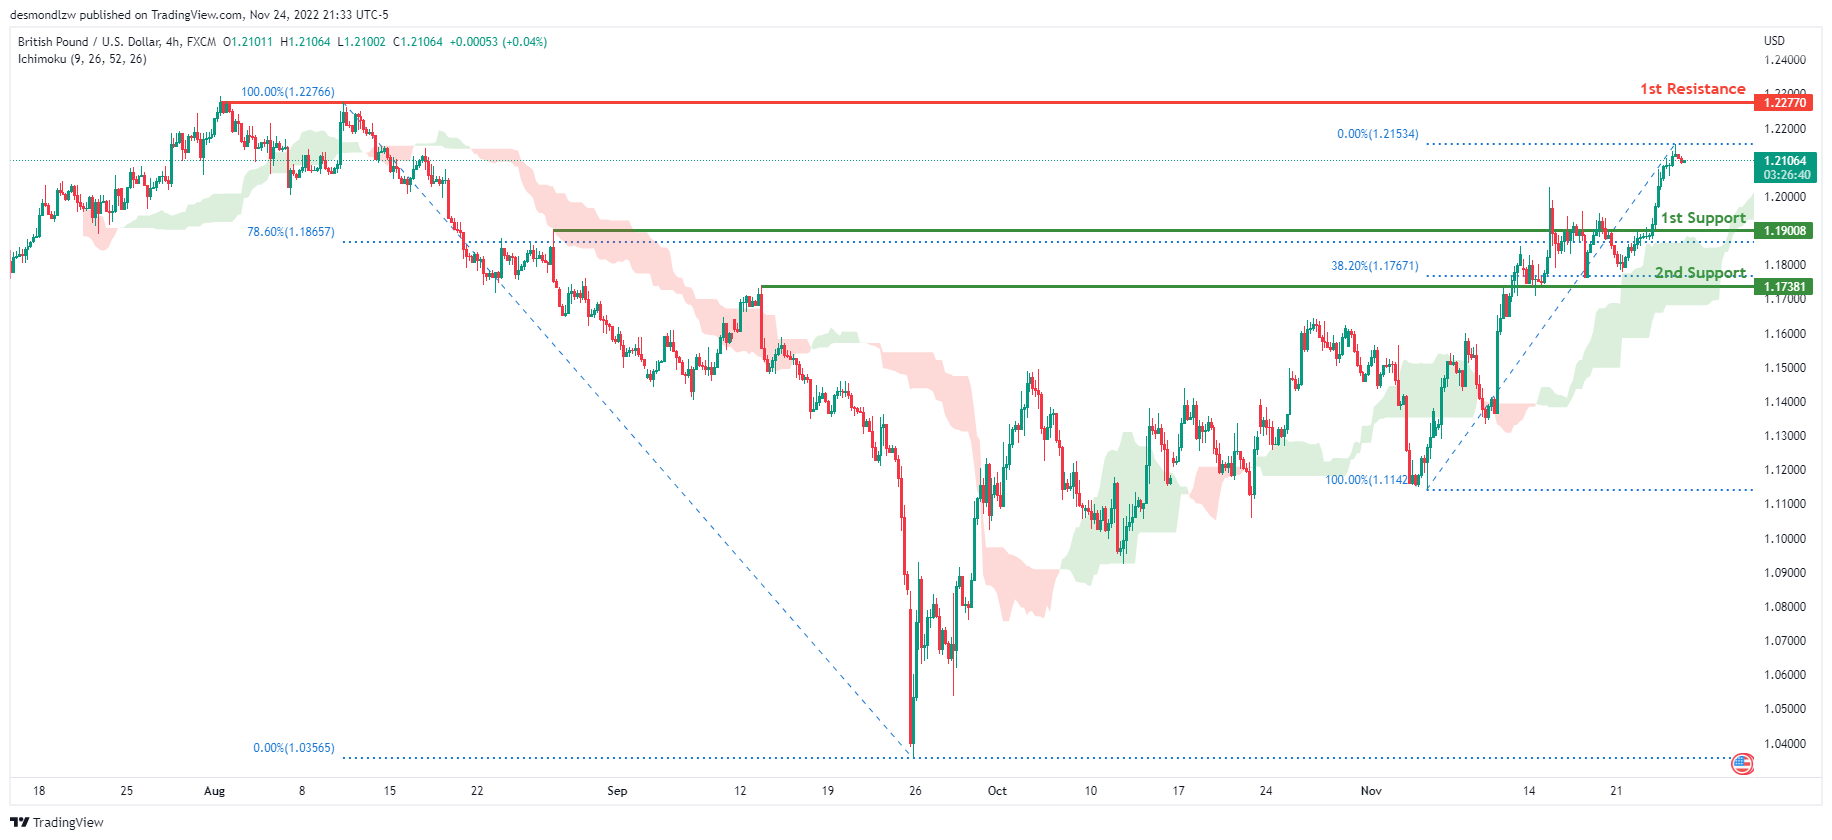
Looking at the H4 chart, my overall bias for GBPUSD is bullish due to the current price being above the Ichimoku cloud, indicating a bullish market. Expecting price to possibly head towards the 1st resistance line at 1.22770, where the previous swing high is. In an alternative scenario, price could possibly head back down to retest the 1st support line at 1.19008, where the 78.6% Fibonacci line is.
Areas of consideration:
- H4 1st resistance at 1.22770
- H4 1st support at 1.19008
USD/CHF:
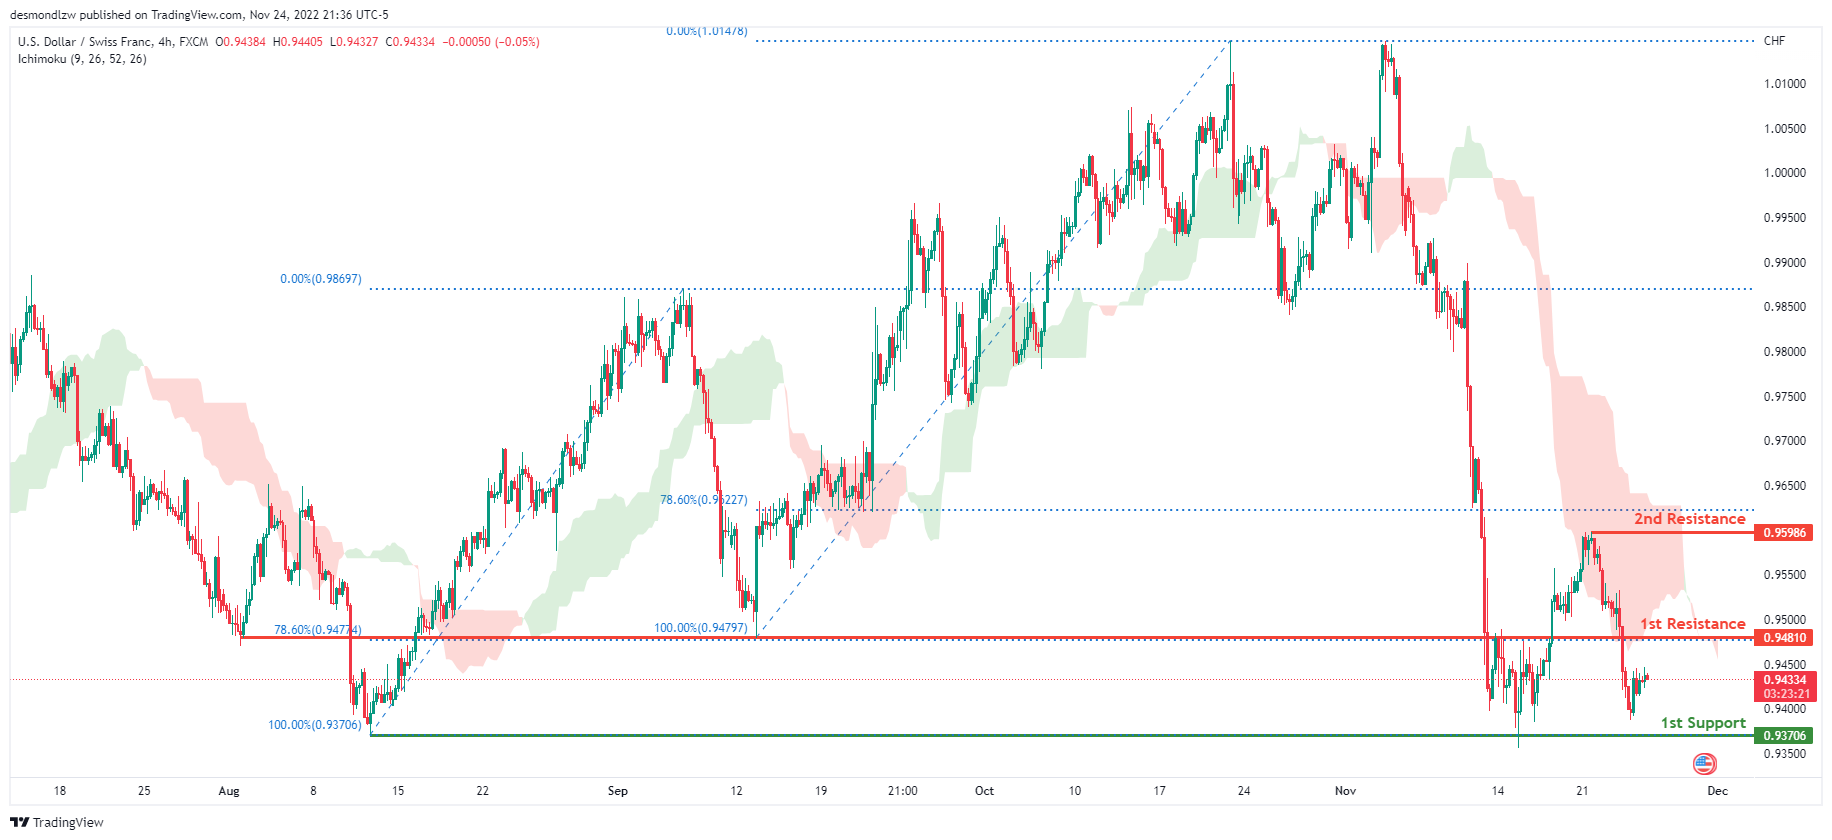
The overall bias for USDCHF on the H4 chart is bearish. In addition, the price is crossing below the Ichimoku cloud, indicating a bearish market. If the current bearish trend continues, expect price to continue heading towards the 1st support line at 0.93706, where the previous swing low is. In an alternate scenario, price could rise towards the 1st resistance line at 0.94810, where the 78.6% Fibonacci line is.
Areas of consideration
- H4 1st support at 0.93706
- H4 1st resistance at 0.94810
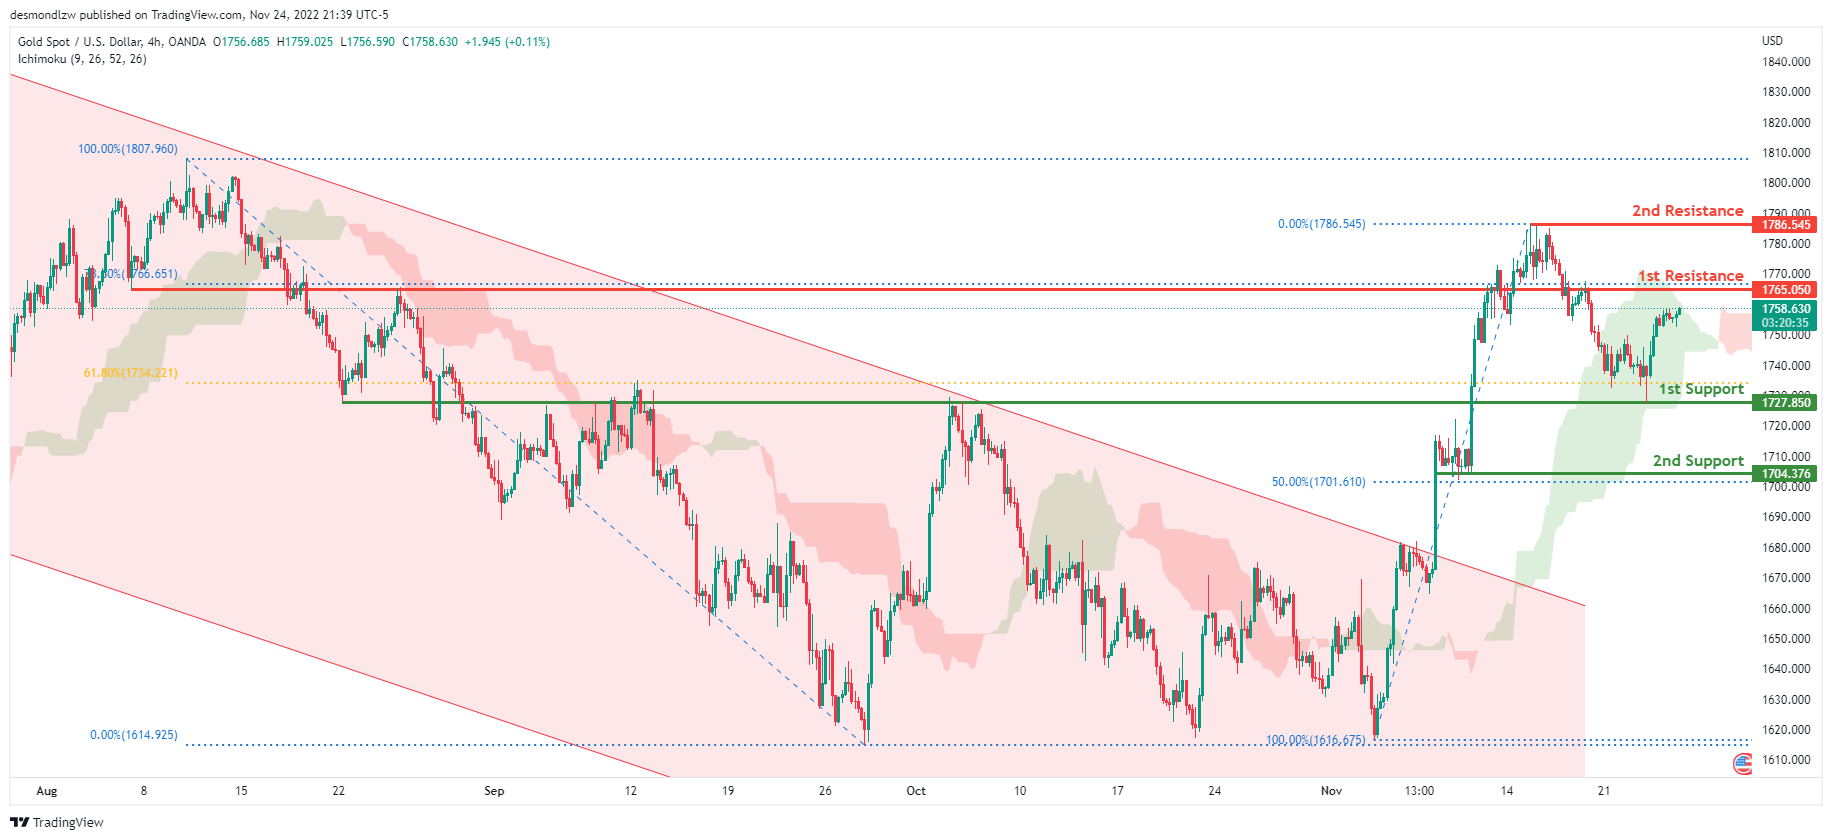
XAU/USD (GOLD):
Looking at the H4 chart, my overall bias for XAUUSD is bullish due to the current price crossing above the Ichimoku cloud, indicating a bullish market. If this bullish momentum continues, expect the price to possibly head back up towards the 1st resistance at 1765.050, where the 78.6% Fibonacci line is located. In an alternate scenario, price could possibly head back down towards the 1st support level at 1727.850, where the 38.2% and 61.8% Fibonacci lines are located.
Areas of consideration:
- H4 time frame, 1st resistance at 1765.483
- H4 time frame, 1st support at 1727.850
AUD/USD:
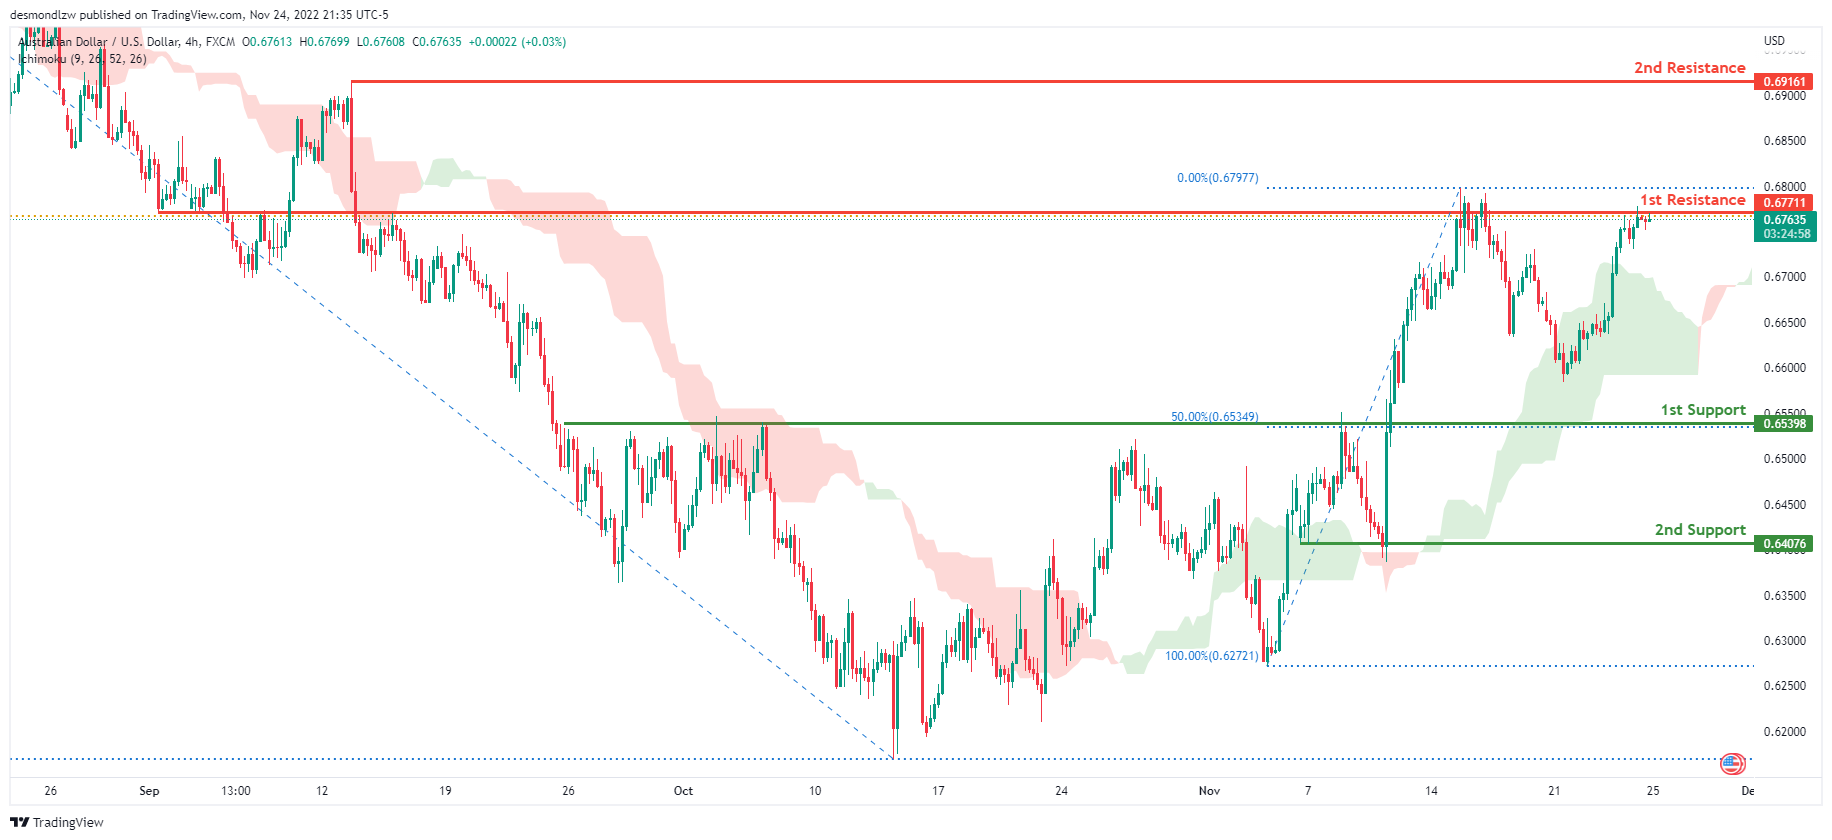
Looking at the H4 chart, my overall bias for ADUSD is bullish due to the current price being above the Ichimoku cloud, indicating a bullish market. Expecting price to continue heading towards the 1st resistance at 0.67711 where the 61.8% Fibonacci line is. If this 1st resistance line is broken, expect price to head towards the 2nd resistance at 0.69161, where the previous swing high is. In an alternative scenario, price could possibly head back down to retest the 1st support line at 0.65398 where the 50% Fibonacci line is.
Areas of consideration
- H4, 1st resistance at 0.67711
- H4, 2nd resistance at 0.69161
- H4, 1st support at 0.65398
NZD/USD:
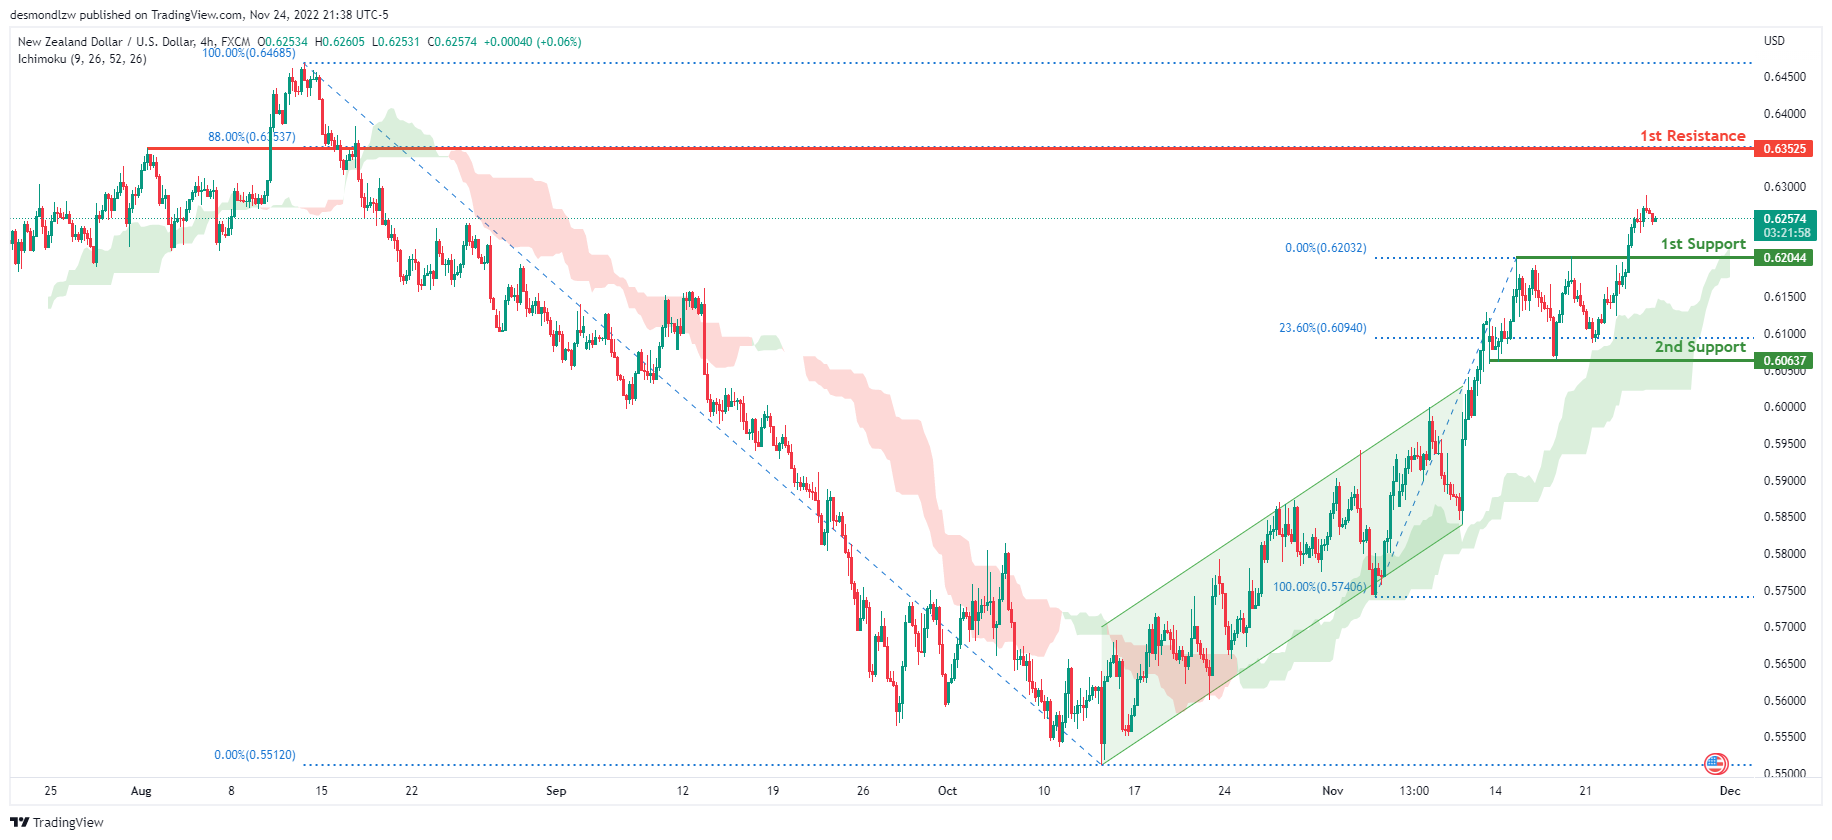
On the H4 chart, we have a bullish bias with the price moving above the Ichimoku cloud and has broken out of the ascending channel. If this bullish momentum continues, expect the price to continue heading towards the 1st resistance line at 0.63525, where the 88% Fibonacci line is. Alternatively, the price may head back down and retest the 1st support at 0.62044, where the previous swing high is located.
Areas of consideration:
- H4 time frame, 1st resistance at 0.63525
- H4 time frame, 1st support at 0.62044
USD/CAD:
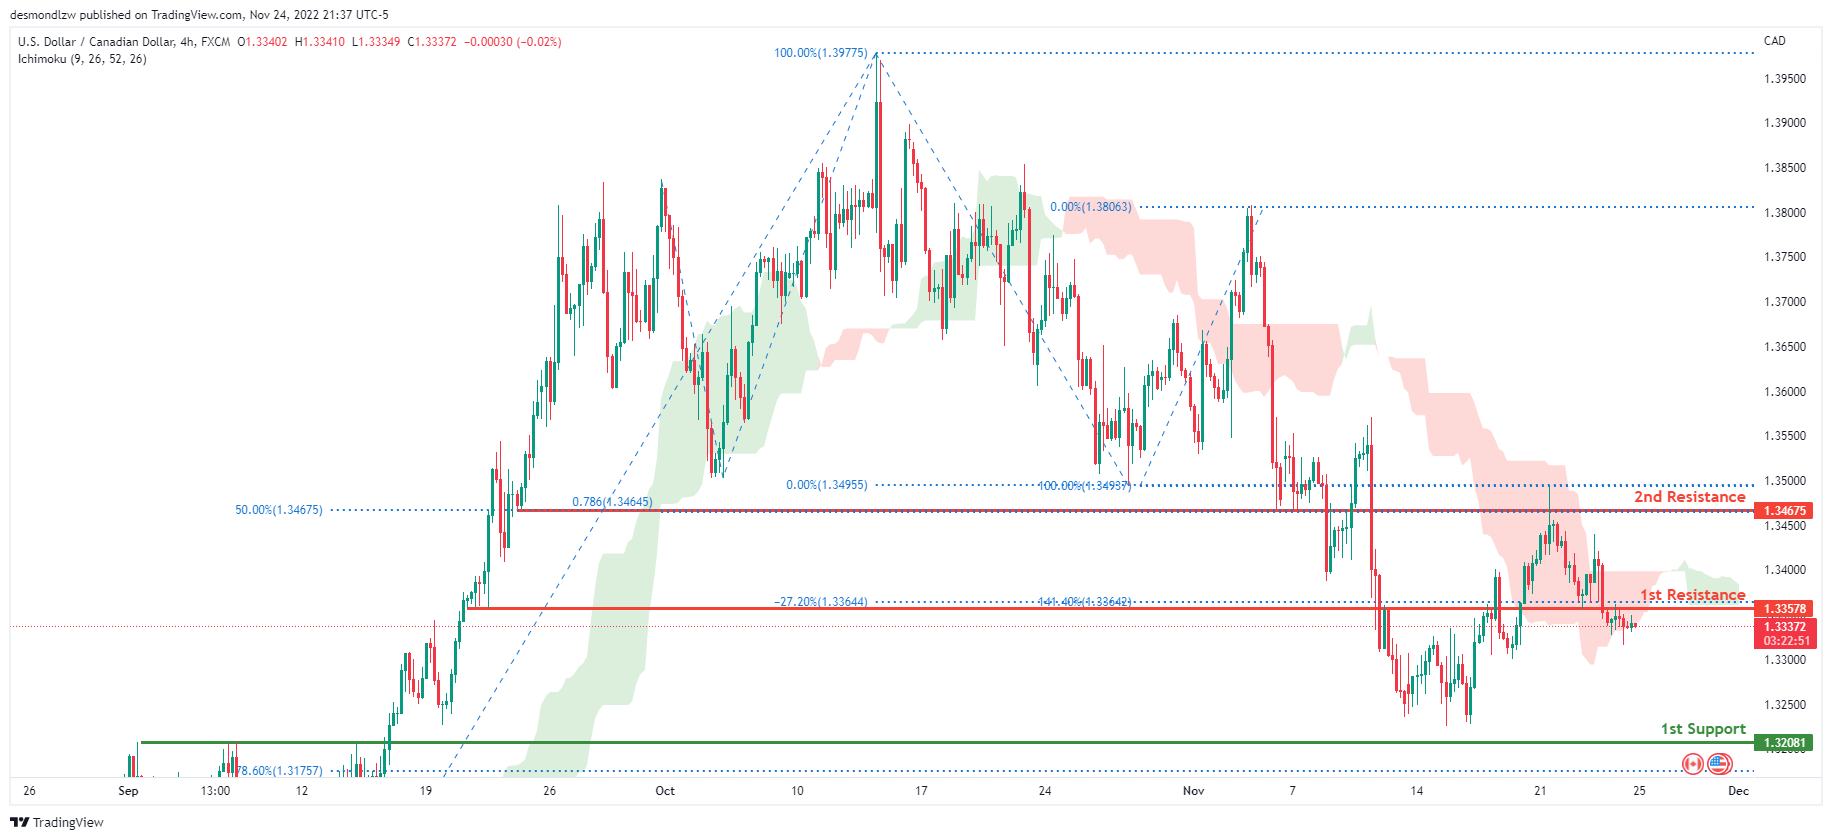
On the H4 chart, the overall bias for USDCAD is bearish. To add confluence to this, the price is crossing below the Ichimoku cloud which indicates a bearish market. If this bearish momentum continues, expect the price to continue heading towards the 1st support line at 1.32081 where the 78.6% Fibonacci line is located. In an alternative scenario, price could head back up to retest the 1st resistance line at 1.33578, where the -27.2% Fibonacci expansion line and 141.4% Fibonacci line is.
Areas of consideration:
- H4 time frame, 1st resistance at 1.33578
- H4 time frame, 1st support at 1.32081
OIL:
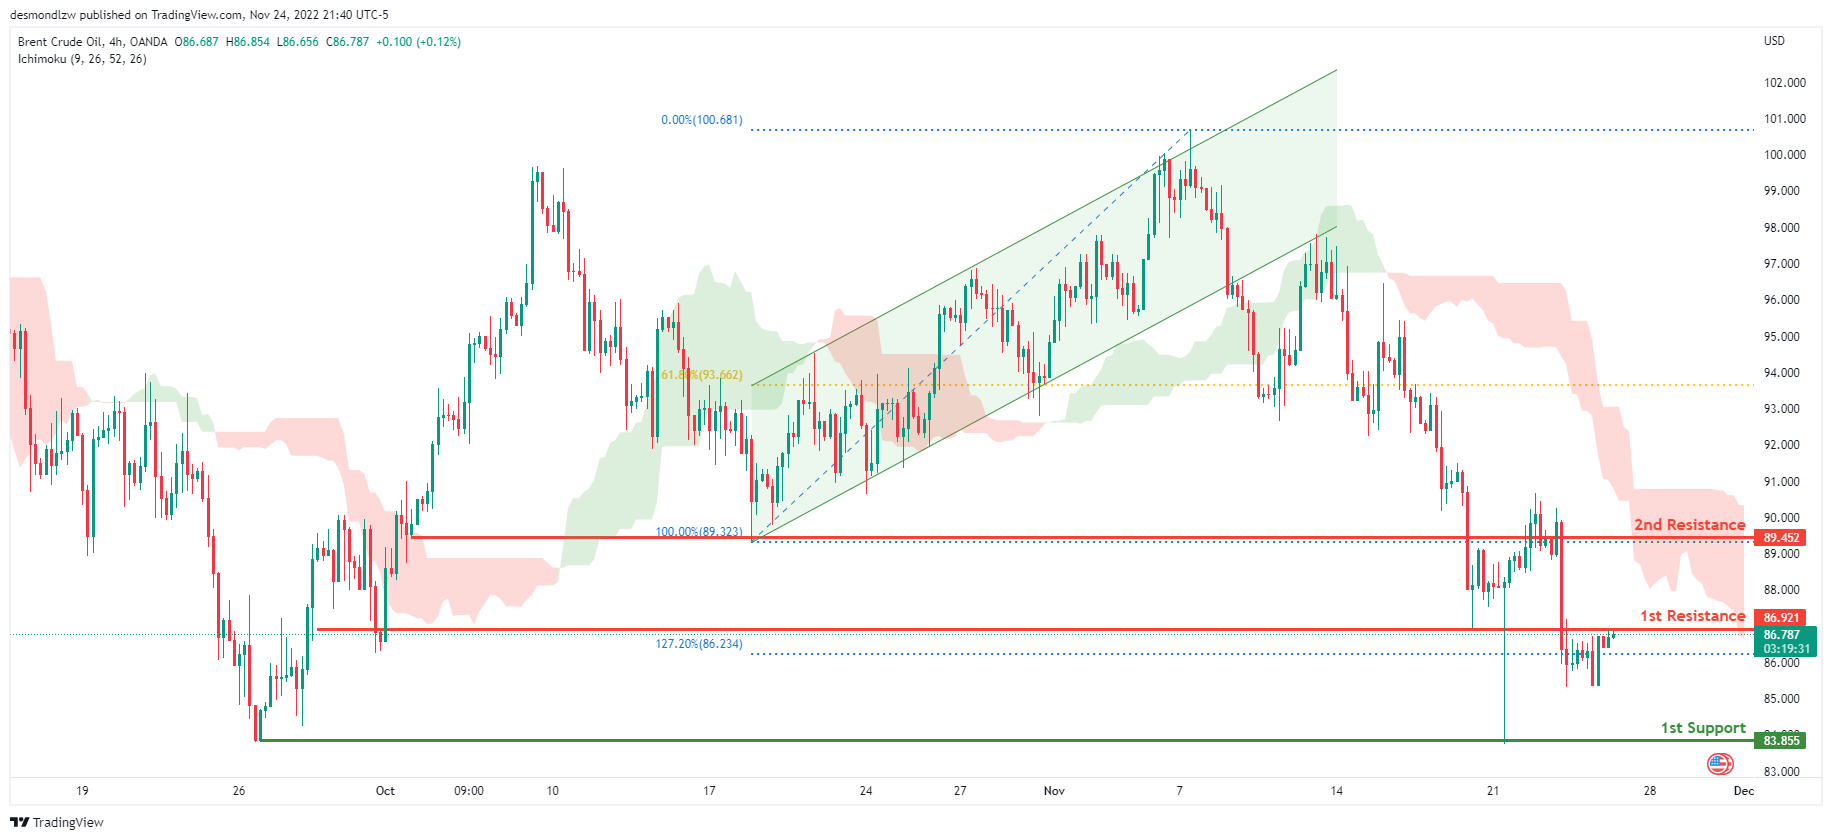
Looking at the H4 chart, my overall bias for BCOUSD is bearish due to the current price being below the Ichimoku cloud, indicating a bearish market. If this bearish momentum continues, expect price to possibly head towards the 1st support at 83.855, where the previous swing low is located. In an alternate scenario, price could possibly head back up to retest the 1st resistance level at 86.921, where the 127.2% Fibonacci extension line is located. If this 1st resistance line is broken, expect price to head towards the 2nd resistance line at 89.452, where the previous swing low is.
Areas of consideration:
- H4 time frame, 1st resistance at 86.921
- H4 time frame, 2nd resistance at 89.452
- H4 time frame, 1st support at 83.855
- H4 time frame, 2nd support at 89.452
Dow Jones Industrial Average:
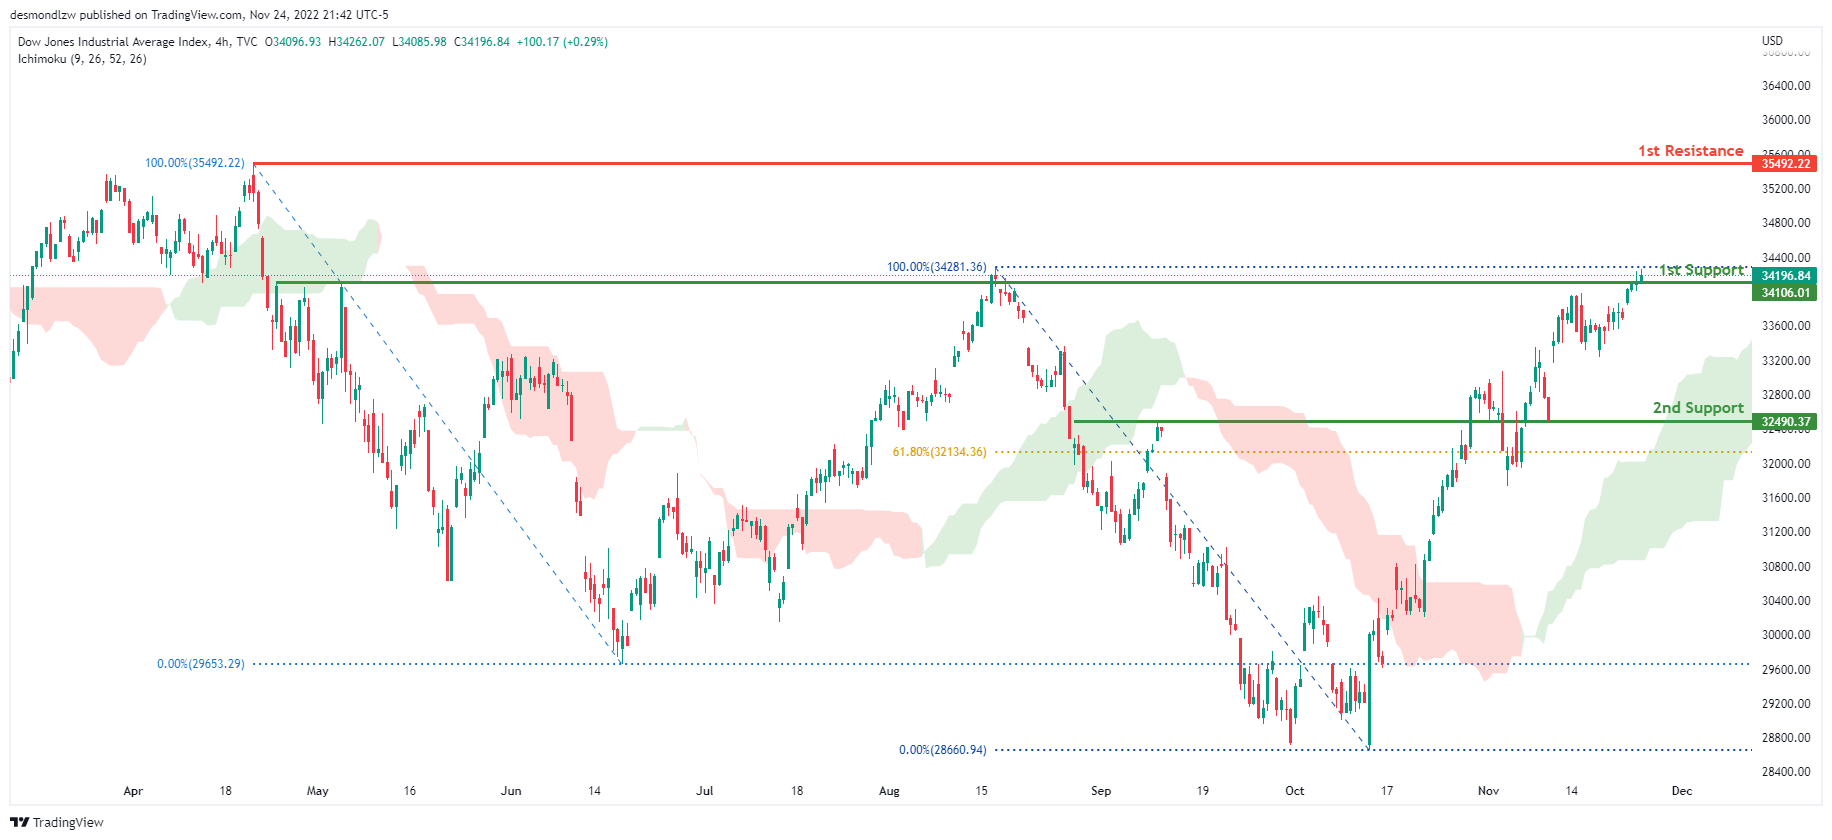
On the H4 chart, the overall bias for DJI is bullish. To add confluence to this, the price is above the Ichimoku cloud which indicates a bullish market. If this bullish momentum continues, expect the price to continue heading towards the 1st resistance line at 35492.22, where the previous swing high is. In an alternative scenario, price could head back down breaking the 1st support line at 34106.01, where the previous swing high is before heading towards the 2nd support at 32490.37, where the 61.8% Fibonacci line is.
Areas of consideration:
- H4 time frame, 1st support at 34106.01
- H4 time frame, 2nd support at 32490.37
- H4 time frame, 1st Resistance at 35492.22
DAX:
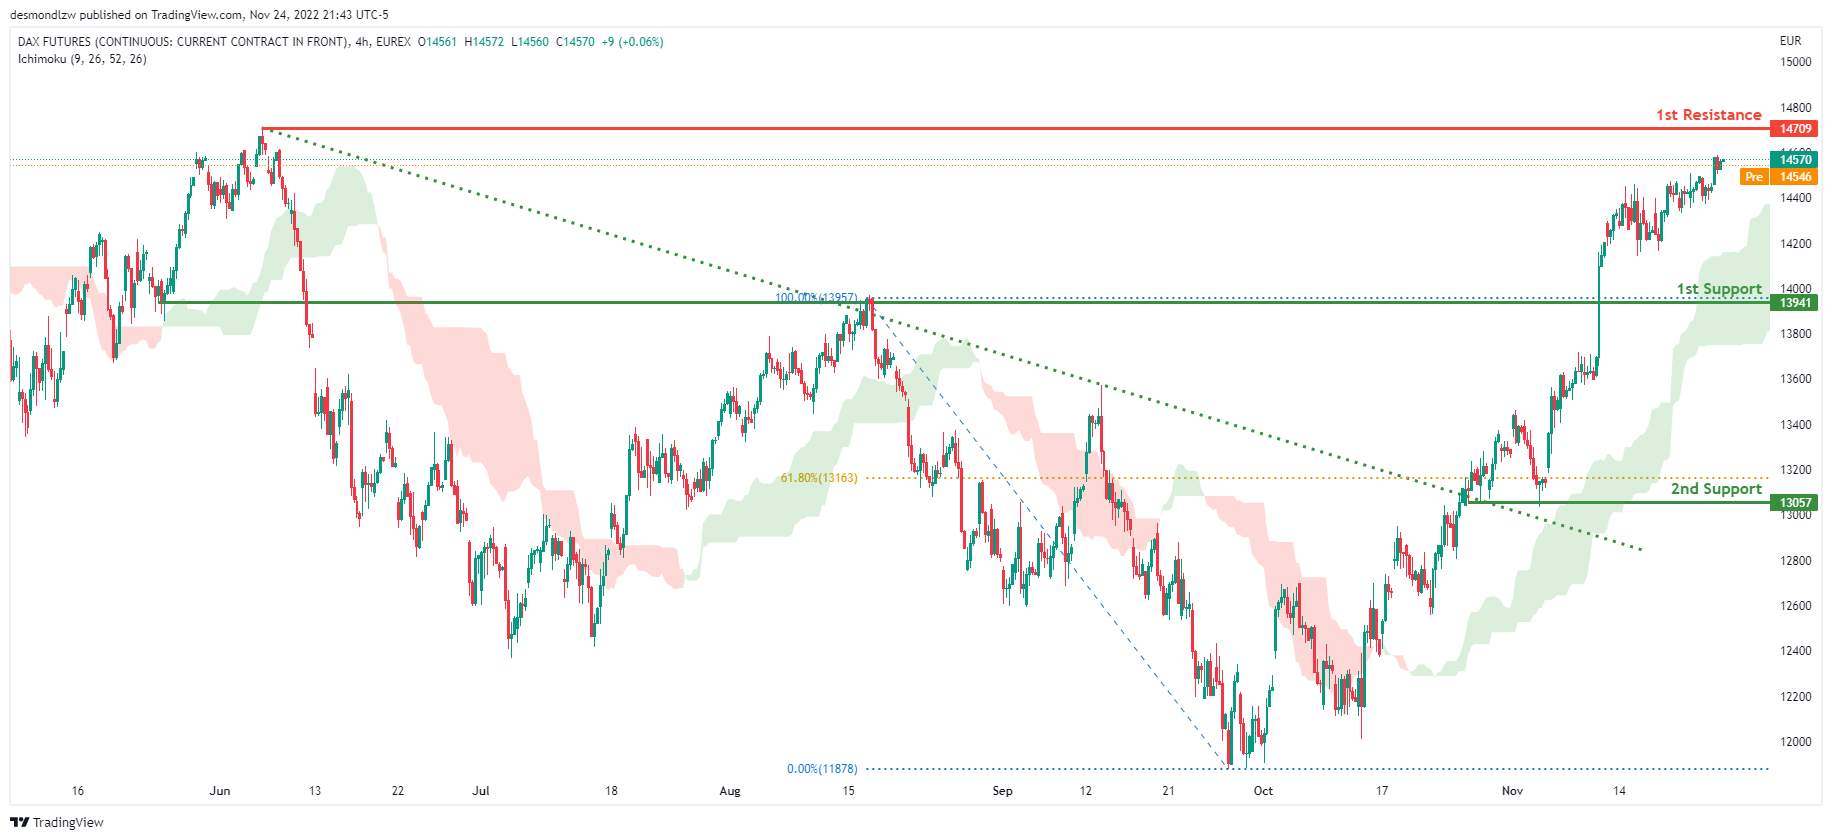
The H4 chart shows a bullish bias, with price breaking through the descending trendline and rising above the Ichimoku cloud. Price is expected to maintain its bullish momentum and rise to the first resistance level at 14709, where the previous swing high is located. Alternatively, the price could fall to the first support level at 13941, where the previous swing high was.
Areas of consideration:
- H4 time frame, 1st resistance is at 14709
- H4 time frame, 1st support is at 13941
ETHUSD:
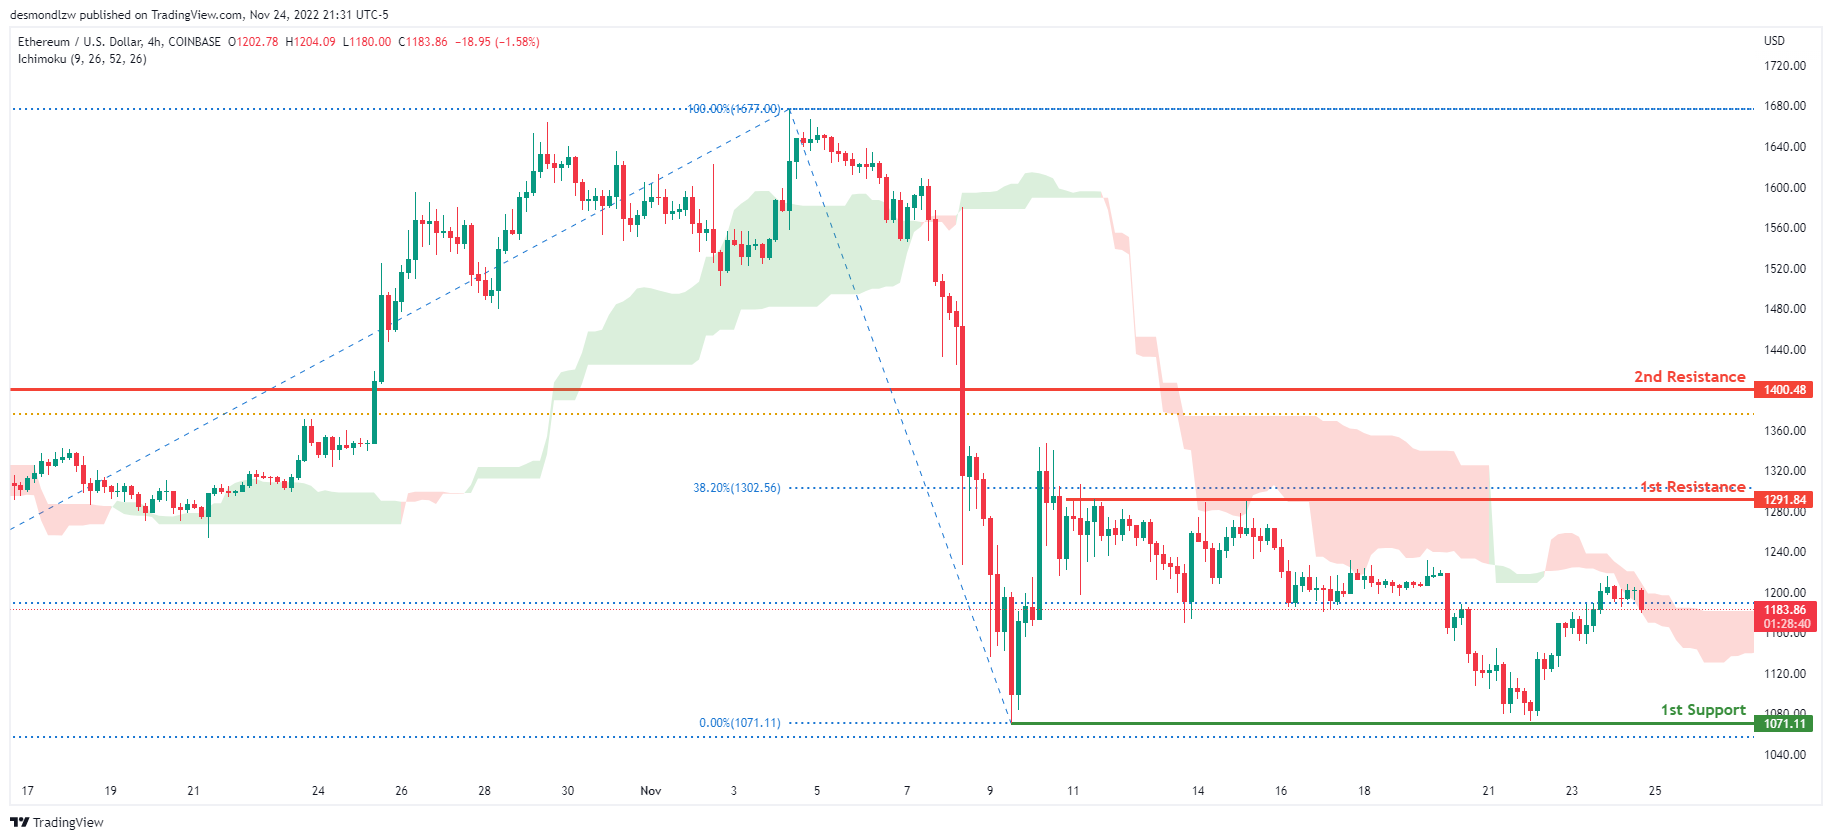
Looking at the H4 chart, my overall bias for ETHUSD is bearish due to the current price being below the Ichimoku cloud, indicating a bearish market .If this bearish momentum continues, expect price to possibly head towards the 1st support at 1071.11, where the -previous swing low is located. In an alternate scenario, price could possibly head back up towards the 1st resistance level at 1291.84, where the 38.2% Fibonacci line is located
Areas of consideration:
- H4 time frame, 1st resistance of 1291.84
- H4 time frame, 1st support at 1071.11
BTCUSD:
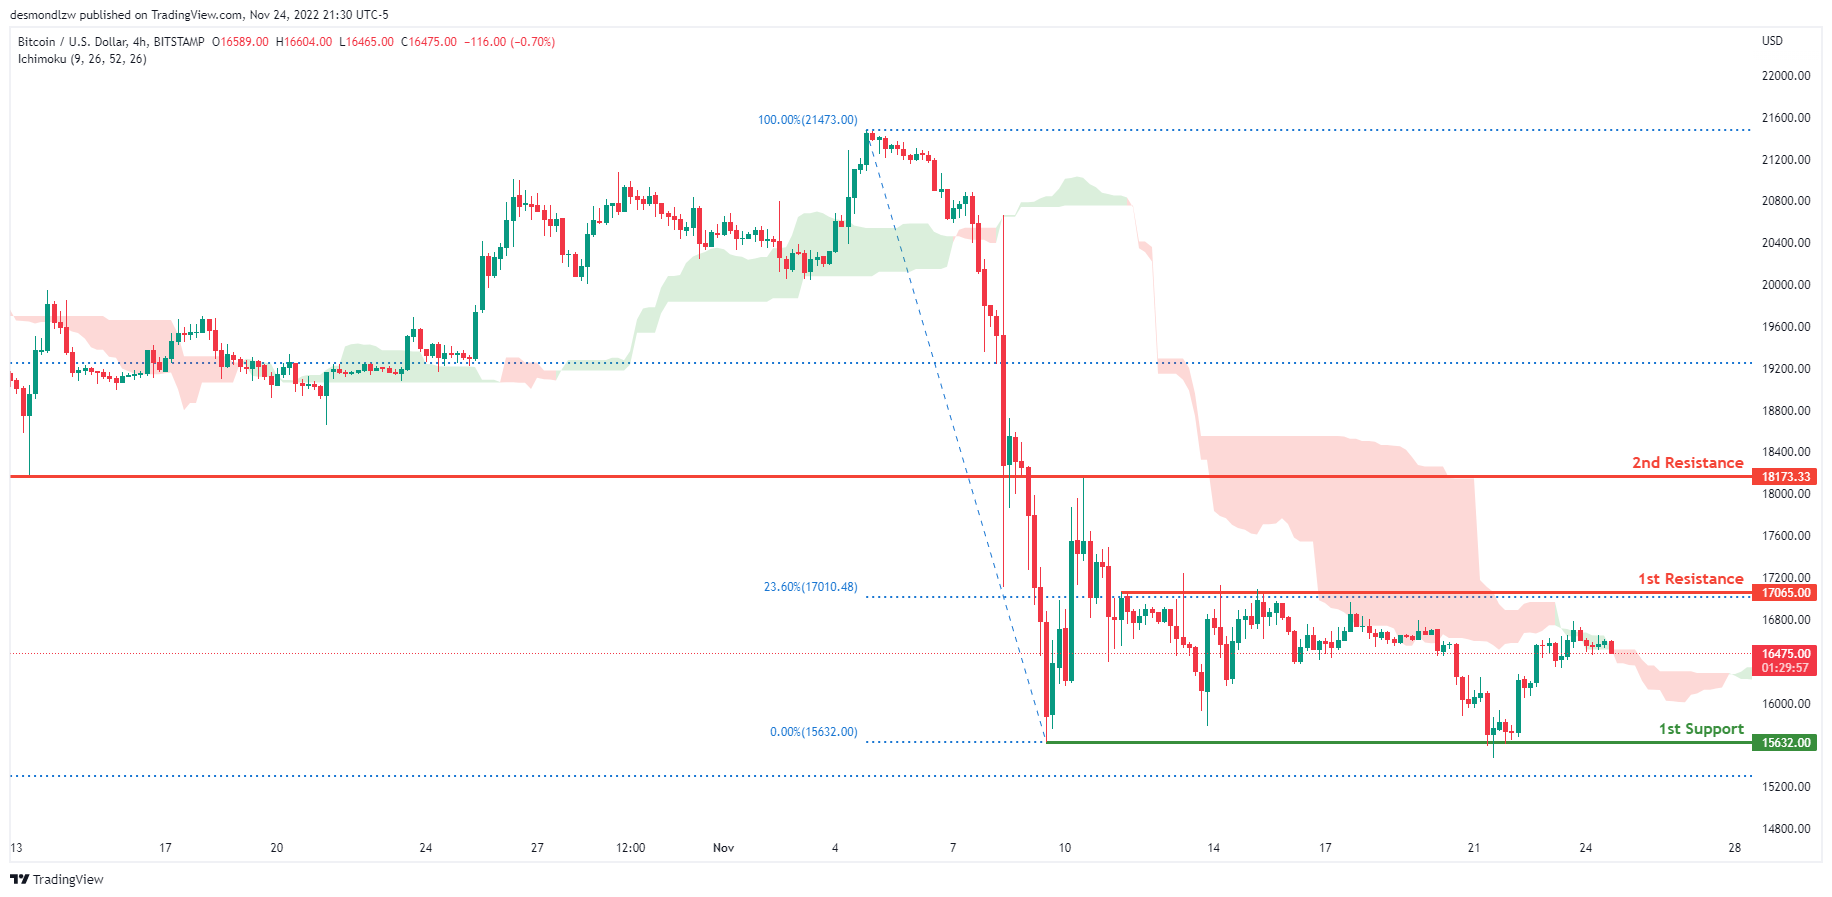
On the H4 chart, the overall bias for BTCUSD is bearish. To add confluence to this, the price is below the Ichimoku cloud which indicates a bearish market. If this bearish momentum continues, expect the price to head towards the 1st support line at 15632.00, where the previous swing low is located. In an alternative scenario, price could head back up to retest the 1st resistance line at 17065.00, where the 23.6% Fibonacci line is located.
Areas of consideration:
- H4 time frame, 1st resistance 17065.00
- H4 time frame, 1st support at 15632.00
S&P 500:
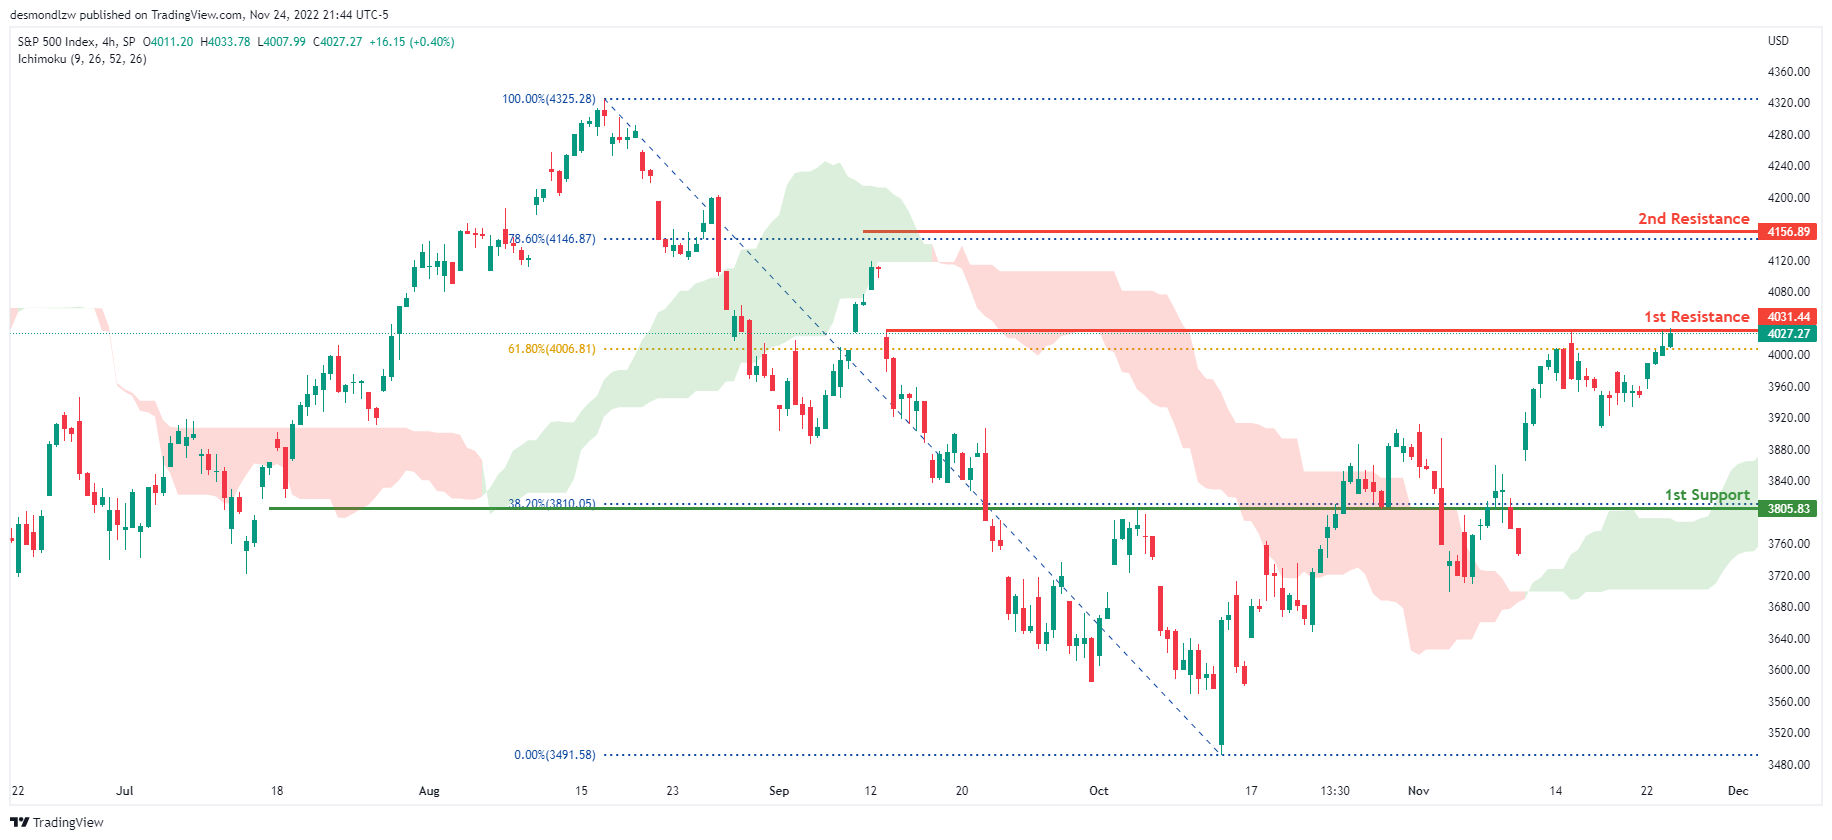
The overall bias for the S&500 on the H4 chart is bullish, with prices above the Ichimoku cloud. If the bullish momentum continues, the price will rise to the first resistance line at 4011.74, where the 61.8% Fibonacci line is located. If the first resistance line is broken, the second resistance line is at 4119.28, which is the previous swing high and the 78.6% Fibonacci line. In an alternate scenario, price could return to the first support line at 3805.83, where the 38.2% Fibonacci line is located.
Areas of consideration:
- H4 time frame, 1st support at 3805.83
- H4 time frame, 1st resistance at 4011.74
- H4 time frame, 2nd resistance at 4119.28
USD/JPY At Risk of More Downsides Below 138
Key Highlights
- USD/JPY started a fresh decline from the 142.25 resistance.
- It traded below a key bullish trend line with support near 141.00 on the 4-hours chart.
- Gold price is eyeing a fresh increase towards the $1,785 resistance.
- Bitcoin price might resume its decline below the $16,000 support.
USD/JPY Technical Analysis
The US Dollar attempted a fresh increase above the 140.00 level against the Japanese Yen. However, USD/JPY failed to clear the 142.25 zone and started another decline.
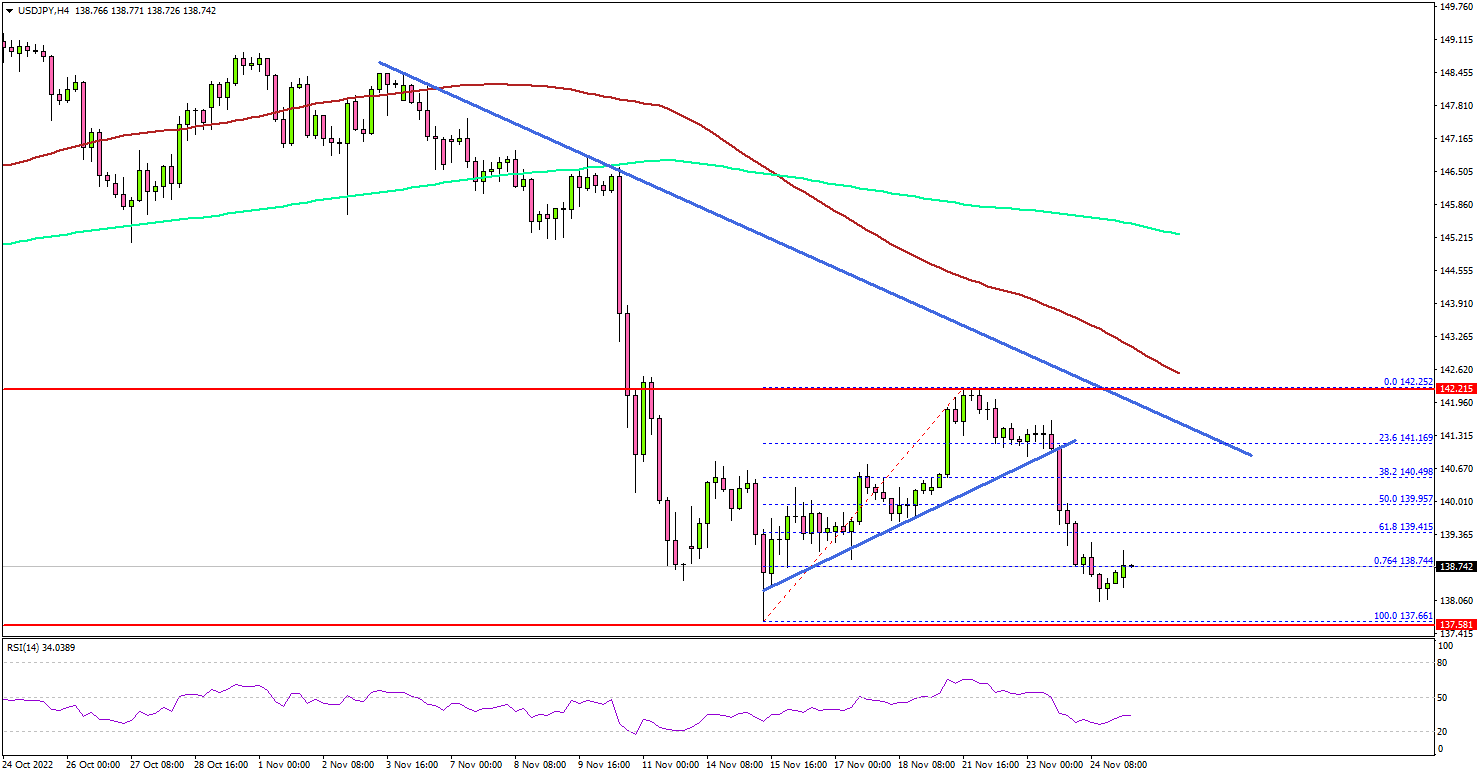
Looking at the 4-hours chart, the pair declined below the 141.50 support level. It even settled below the 140.00 support, the 100 simple moving average (red, 4-hours) plus the 200 simple moving average (green, 4-hours).
During the decline, the pair traded below a key bullish trend line with support near 141.00 on the same chart. There was a clear move below the 61.8% Fib retracement level of the upward move from the 137.66 swing low to 142.25 high.
An initial support is near the 137.65 level. The next major support is near the 136.80 zone, below which the pair might accelerate lower.
In the stated case, USD/JPY may perhaps test the 135.00 support. Any more losses might send the pair towards the 132.00 support. On the upside, an immediate resistance is near 139.40 level.
The next major resistance may perhaps be near 140.50 and a connecting bearish trend line on the same chart. Any more gains could set the pace for a move towards the 142.25 resistance zone.
Looking at gold price, there was a strong buying interest near the $1,720 zone and the price might start a move towards the $1,785 resistance.
Economic Releases
- German Gross Domestic Product for Q3 2022 (YoY) – Forecast 1.2%, versus 1.2% previous.
- German Gross Domestic Product for Q3 2022 (QoQ) – Forecast 0.3%, versus 0.3% previous.