

Sample Category Title
EUR/AUD Daily Outlook
Daily Pivots: (S1) 1.5187; (P) 1.5257; (R1) 1.5345; More...
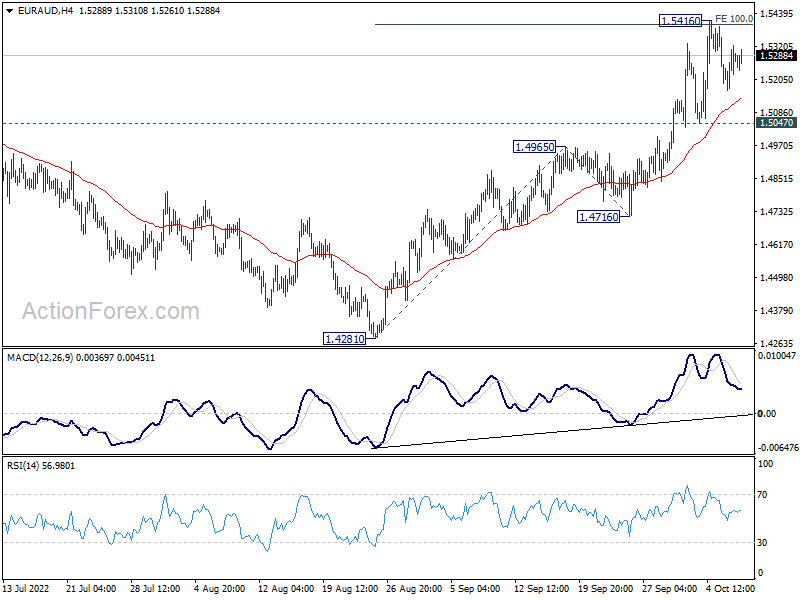
Intraday bias in EUR/AUD remains neutral at this point. For now, further rally is in favor as long as 1.5047 support holds. Firm break of 1.5416 will carry larger bullish implication. Next target is 161.8% projection of 1.4281 to 1.4965 from 1.4716 at 1.5823. However, break of 1.5047 will turn bias back to the downside for 55 day EMA (now at 1.4866).
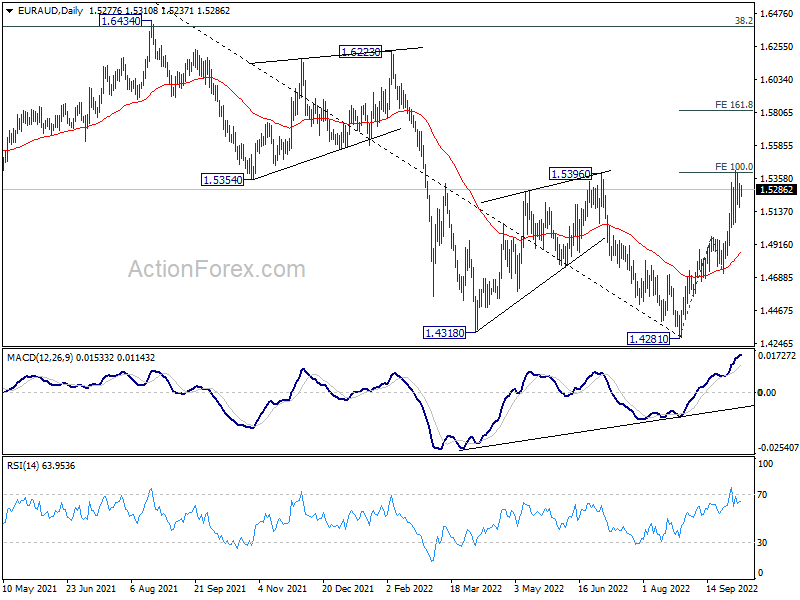
In the bigger picture, current development raises the chance of medium term bottoming at at 1.4281, on bullish convergence condition in daily MACD. Firm break of 1.5396 will bring stronger rally back to 1.6434 key resistance next. Nevertheless, rejection by 1.5396 will maintain medium term bearishness for another fall through 1.4281 at a later stage.
EUR/CHF Daily Outlook
Daily Pivots: (S1) 0.9682; (P) 0.9710; (R1) 0.9728; More....
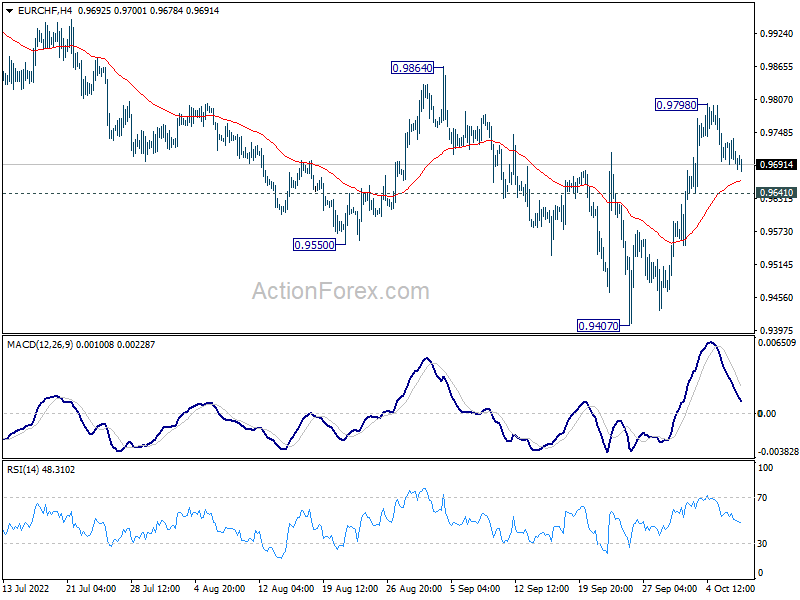
Intraday bias in EUR/CHF remains neutral at this point. On the upside, above 0.9798 will resume the rebound to 0.9864 resistance. Firm break there will solidify the case of medium term bottoming at 0.9407, and target 38.2% retracement of 1.1149 to 0.9407 at 1.0072. On the downside, below 0.9641 minor support will turn bias back to the downside for retesting 0.9407 low instead.
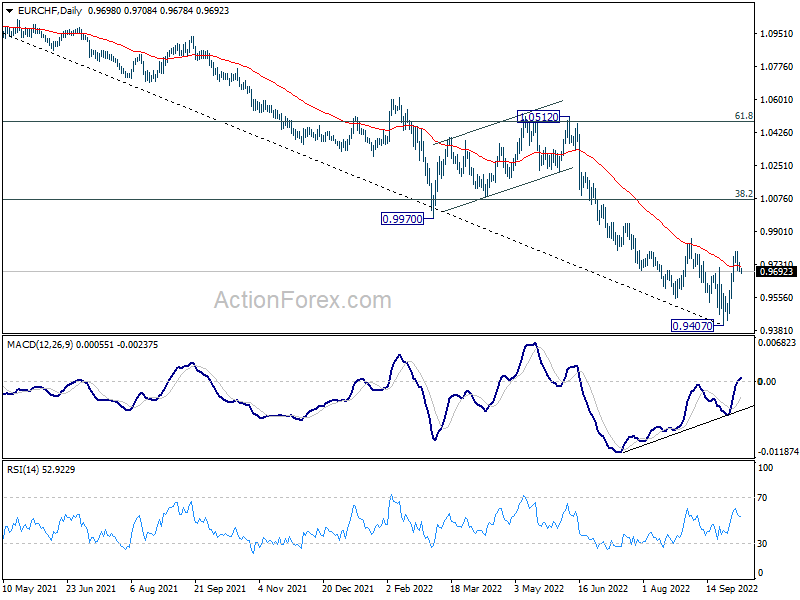
In the bigger picture, as long as 0.9864 resistance holds, long term down trend from 1.2004 (2008 high) is expected to continue. Next target is 138.2% projection of 1.2004 to 1.0505 to 1.1149 at 0.9033. However, firm break of 0.9864 will confirm medium term bottoming, on bullish convergence condition in daily MACD. Stronger rally would then be seen back to 55 week EMA (now at 1.0188), even as a corrective rebound.
EUR/USD Daily Outlook
Daily Pivots: (S1) 0.9745; (P) 0.9835; (R1) 0.9883; More...
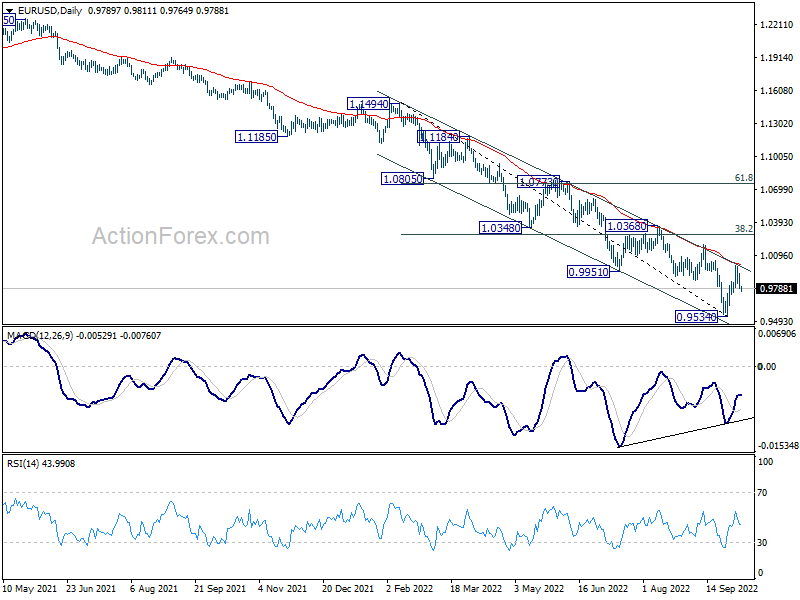
Intraday bias in EUR/USD remains neutral for the moment. On the downside, break of 0.9734 minor support will suggest rejection by 55 day EMA, and medium term falling channel. Bias will be turned back to the downside for retesting 0.9534 low and then resume down trend. Nevertheless, considering bullish convergence condition in daily MACD, sustained break of 55 day EMA (now at 1.0019) will raise the chance of medium term bottoming at 0.9534. Further rally should then be seen to 38.2% retracement of 1.1494 to 0.9534 at 1.0283.
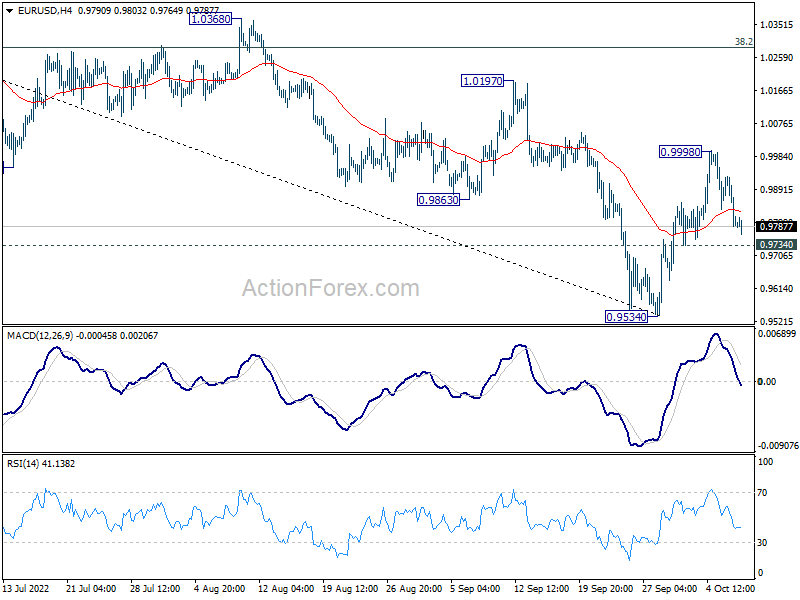
In the bigger picture, down trend from 1.6039 (2008 high) is still in progress. Next target is 100% projection of 1.3993 to 1.0339 from 1.2348 at 0.8694. In any case, break of 1.0197 resistance is needed to be the first sign of medium term bottoming. Otherwise, outlook will stay bearish even with strong rebound.
GBP/USD Daily Outlook
Daily Pivots: (S1) 1.1054; (P) 1.1219; (R1) 1.1323; More...
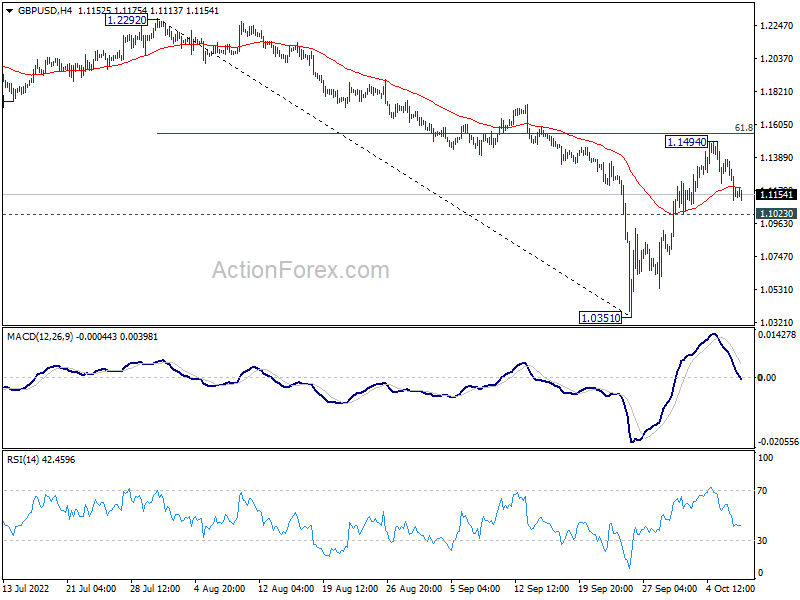
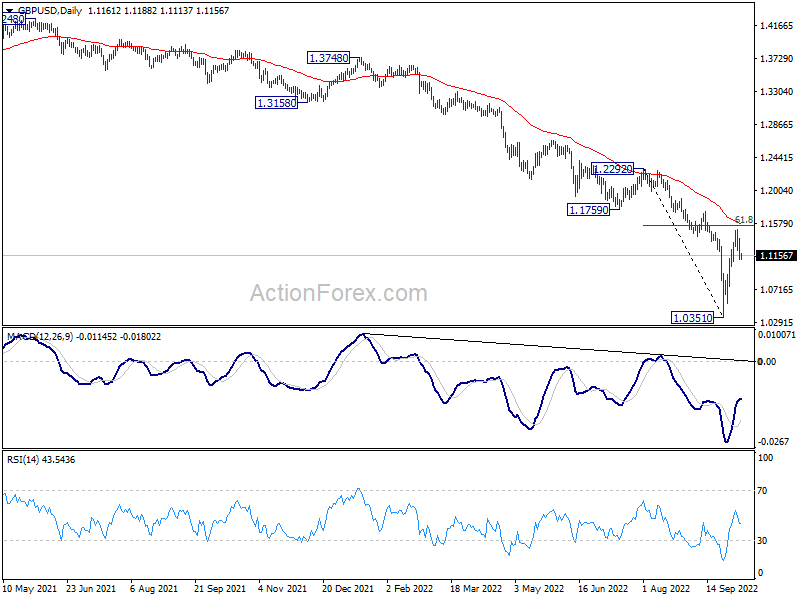
Intraday bias in GBP/USD remains neutral and outlook is unchanged. On the downside, break of 1.1023 minor support will indicate that rebound from 1.0351 is over. Intraday bias will be back on the downside for retesting 1.0351. On the upside, firm break of 61.8% retracement of 1.2292 to 1.0351 at 1.1551 will pave the way to 1.2292 resistance.
In the bigger picture, fall from 1.4248 (2018 high) is resuming long term down trend from 2.1161 (2007 high). Next target is 100% projection of 2.1161 to 1.3503 from 1.7190 at 0.9532. There is no scope of a medium term rebound as long as 1.1759 support turned resistance holds.
USD/CHF Daily Outlook
Daily Pivots: (S1) 0.9819; (P) 0.9867; (R1) 0.9952; More...
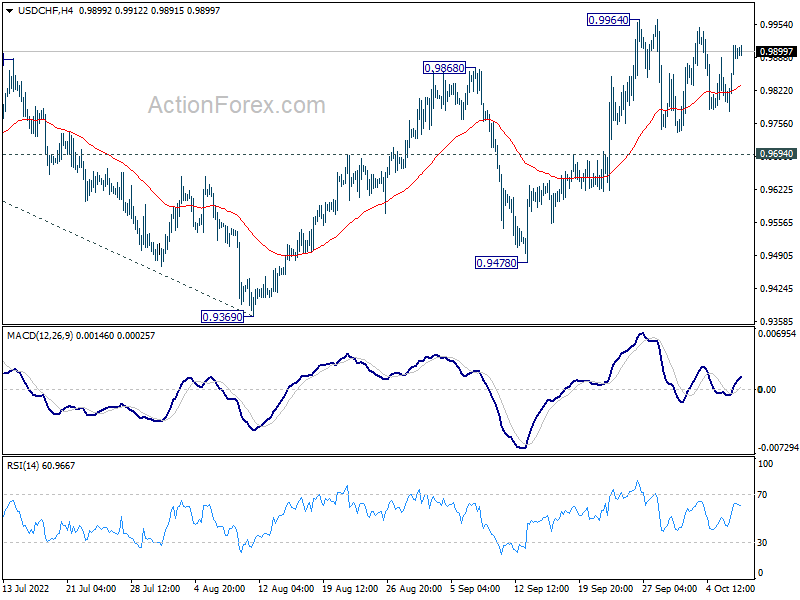
Intraday bias in USD/CHF remains neutral for the moment. Consolidation from 0.9964 could extend but further rally is in favor as long as 0.9694 support holds. On the upside, above 0.9964 will resume the rally from 0.9369 to retest 1.0063 high. On the downside, however, break of 0.9694 support will extend the corrective pattern from 1.0063 with another falling leg, towards 0.9478 support first.
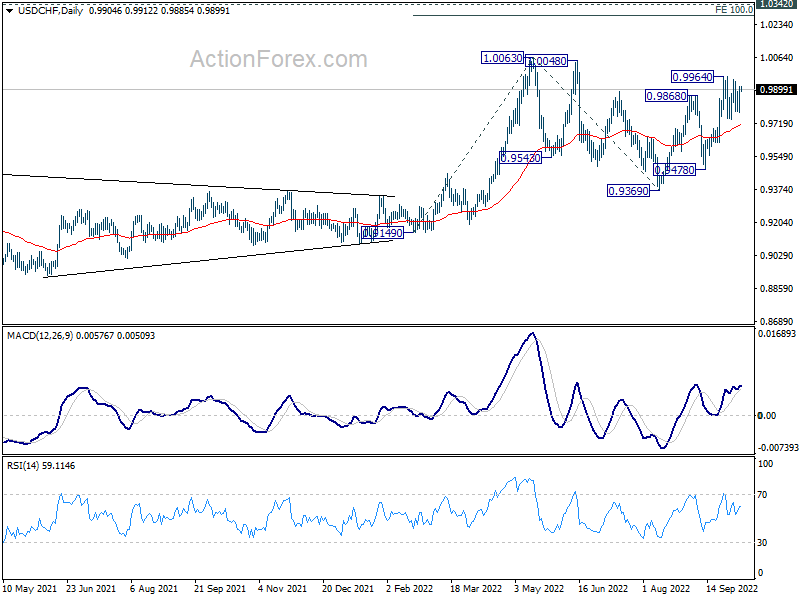
In the bigger picture, current development suggests that up trend from 0.8756 (2021 low) is still in progress. Sustained break of 1.0063 will target 100% projection of 0.9149 to 1.0063 from 0.9369 at 1.0283, and then 1.0342 (2016 high). For now, this will remain the favored case as long as 0.9369 support holds, even in case of deep pull back.
USD/JPY Daily Outlook
Daily Pivots: (S1) 144.64; (P) 144.89; (R1) 145.39; More...
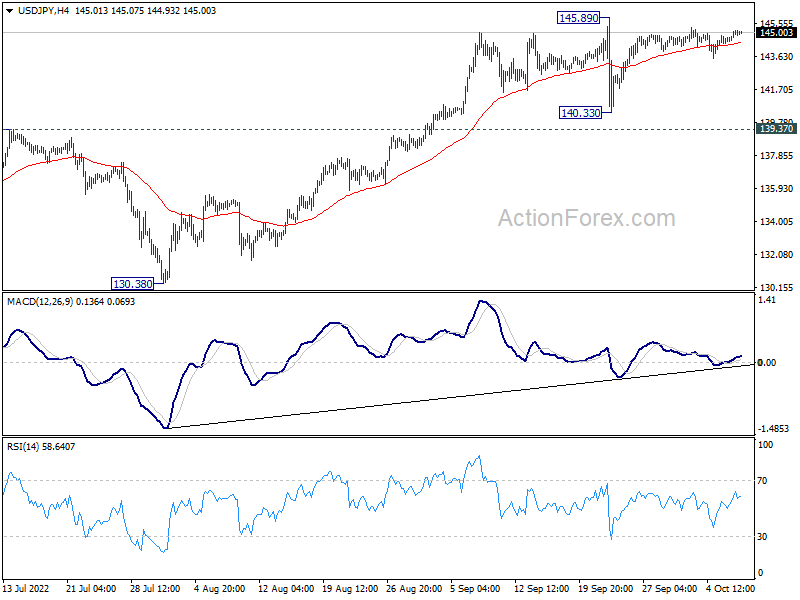
Range trading continues in USD/JPY as consolidation form 145.89 extends. Intraday bias stays neutral and further rally is expected as long as 139.37 resistance turned support holds. Break of 145.89 will target 147.68 long term resistance. On the downside, however, decisive break of 139.37 will confirm short term topping. Deeper decline would be seen back towards 130.38 support.
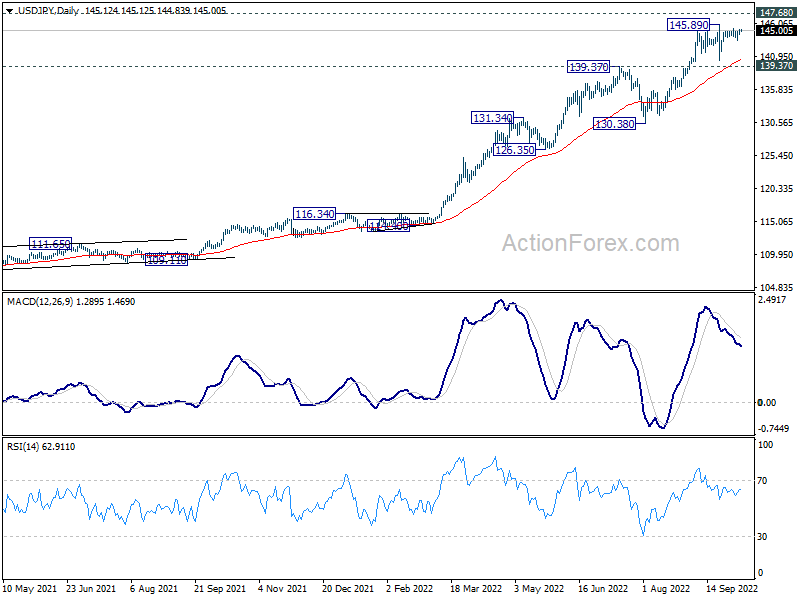
In the bigger picture, up trend from 101.18 is still in progress, as part of the whole up trend from 75.56 (2011 low). Further rise should be seen to 147.68 (1998 high). For now, break of 130.38 support is needed to be the first indication of medium term topping. Otherwise, outlook will stay bullish even in case of deep pull back.
USD/CAD Daily Outlook
Daily Pivots: (S1) 1.3518; (P) 1.3607; (R1) 1.3710; More...
Intraday bias in USD/CAD stays neutral for the moment and consolidation from 1.3832 could extend further. On the upside, break of 1.3832 will resume larger up trend to 161.8% projection of 1.2005 to 1.2947 from 1.2401 at 1.3925. In case of another fall, downside should be contained by 1.3051 support to bring rebound.
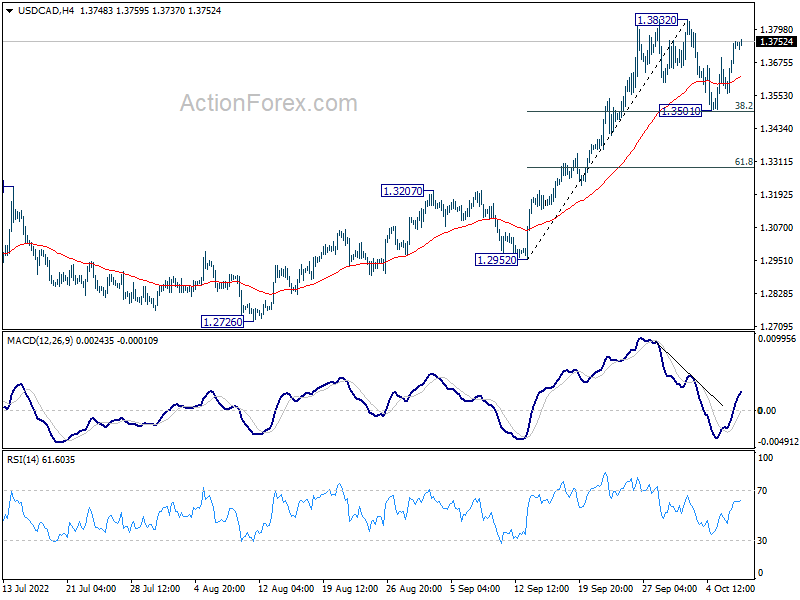
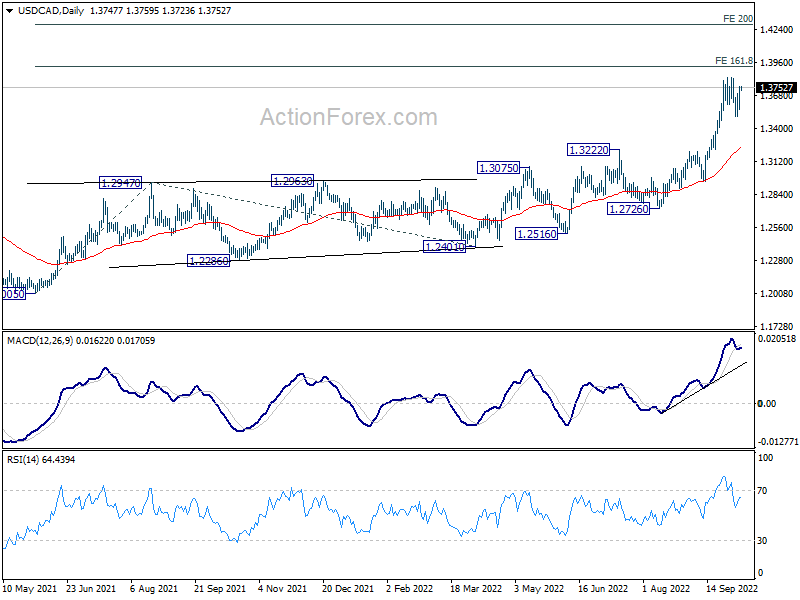
In the bigger picture, up trend from 1.2005 (2021 low) is still in progress. Based on current impulsive momentum, it could be resuming long term up trend from 0.9056 (2007 low). Whether it is or it isn't, retest of 1.4689 (2016 high) should be seen next. This will now remain the favored case as long as 1.3222 resistance turned support holds.
USDCAD Reacting Higher From The Equal Legs Area
In this technical blog, we will look at the past performance of 1-hour Elliott Wave Charts of USDCAD. In which, the rally from 11 August 2022 high is unfolding as an impulse sequence and showed a higher high sequence. Therefore, we knew that the structure in USDCAD is incomplete to the upside & should see more upside. So, we advised members to buy the dip in 3, 7, or 11 swings at the extreme areas. We will explain the structure & forecast below:
USDCAD 1-Hour Elliott Wave Chart
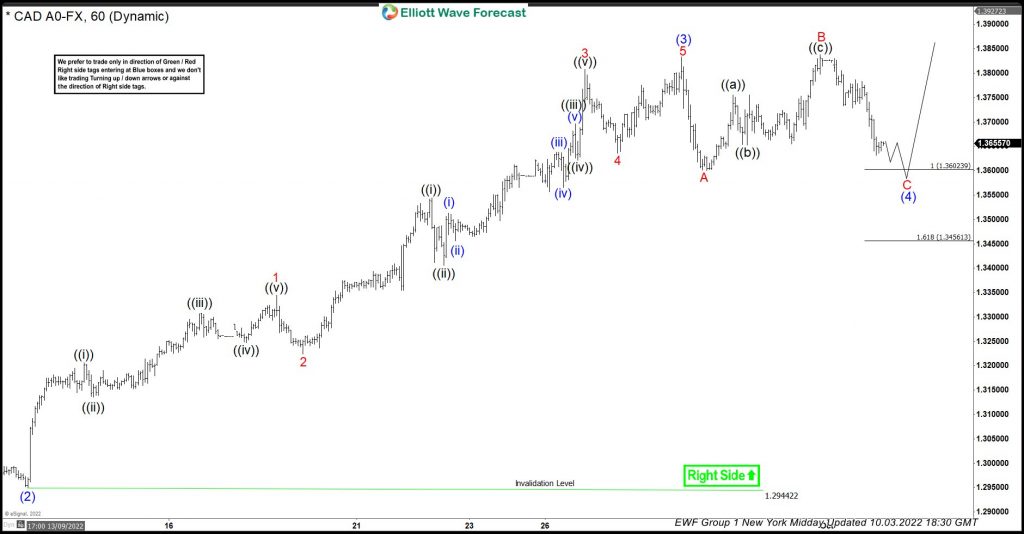
Here’s the Elliott wave Chart from the 10/03/2022 New York Midday update. In which, the rally to $1.3833 high ended the cycle from the 13 September 2022 low in wave (3) & made a pullback in wave (4). The internals of that pullback unfolded as Elliott wave flat structure where wave A ended at $1.3600 low. Then a bounce to $1.3838 high ended wave B & started the next leg lower in wave C towards $1.3602- $1.3456 equal legs area. From there, buyers were expected to appear looking for new highs ideally or for a 3 wave bounce minimum.
USDCAD Latest 1-Hour Elliott Wave Chart
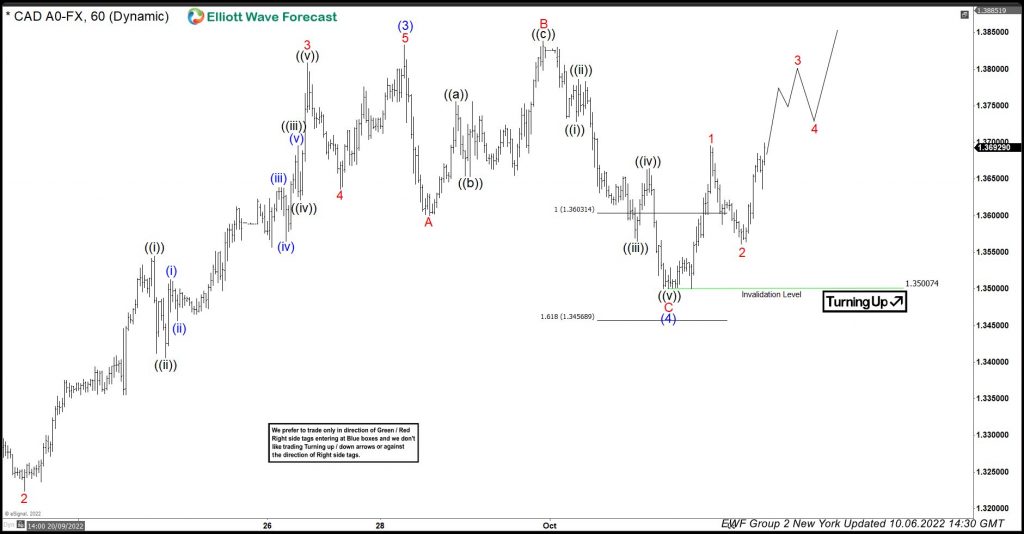
Above is the latest Elliott wave Chart from the 10/06/2022 New York update. In which the pair is showing a reaction higher taking place from the equal legs area. Right after ending the flat correction. Allowed members to create a risk-free position with the minimum reaction higher towards 50%- 61.8% Fibonacci retracement from the wave B peak at $1.3669- $1.3709 area. However, a break above $1.3838 high is still needed to confirm the next extension higher & avoid a double correction lower.
What Would be a Delicious Jobs Data Cocktail?
Equities retreated, the US yields and the US dollar rebounded as more Federal Reserve (Fed) members threw hawkish comments to defend their fight against inflation.
Neel Kashkari, who used to be a dovish Fed member said that the Fed is ‘quite a ways away’ from pausing its rate hike cycle, while the US Treasury Secretary, and ex-Fed head Janet Yellen urged central banks to keep fighting inflation, though she mentioned the potential risks to the global economy.
The S&P500 closed 1% lower, while Nasdaq slid 0.68% despite being more sensitive to rate hikes. The US short-term yields rose, and the dollar index gained.
Gold bounced lower from the 50-DMA on the back of rising US yields, whereas the barrel of US crude drilled – though very slowly – above its own 50-DMA and is now above the summer down trending channel top.
Yet the rising oil prices fuel inflation and Fed expectations and certainly don’t do good to the overall market mood.
Shell warning didn’t prevent US oil stocks from rallying
Shell warned investors that the Q3 results won’t be as breathtaking as the Q2, as the weaker gas trading and weaker refining will be reflected in the latest quarter earnings. Shell dropped up to 5% yesterday and closed the session a bit less than a 3% loss. It pulled BP lower along with it, but BP managed to close flat.
Across the Atlantic, the oil stock investors didn’t want to hear anything. Exxon Mobil jumped 3%, while a Warren Buffet favourite Occidental Petroleum ticked 4% higher.
US jobs data ahead
The US will announce its latest jobs data in a tense and volatile environment of energy crisis, persistent inflation, Fed members insisting that what they are doing is right, and markets crying that what they are doing is maybe a bit too much.
Bloomberg highlights that the Fed officials have failed to predict how high the joblessness would rise during, or after, almost every recession over the past 50 years. They say that the unemployment as a result of tightening topped the Fed projections by 1 percentage point or more, three times. That’s not because the Fed is uncapable of making good projections, but their models are.
So, investors are not totally wrong betting that the Fed may have to slowdown, and even reverse policy, if they go too far. And this is why the jobs data is gaining importance, yet again.
If inflation is decisive for the direction the Fed will follow, employment data will determine the pace it will travel.
What would be a delicious jobs data cocktail?
Investors will be watching three main elements. The NFP data, the unemployment and participation rates, and the wages growth.
The most ideal mix would be a softer NFP data compared to previous months, but not too soft either. Because the softer data would mean that the US jobs market is cooling as the Fed wants, but a too soft data would mean that the economy may not be doing fine for a soft landing. A number around 200’000 should be ok to both satisfy the idee that the jobs market is cooling, but remains robust. Combined with the decline in job openings, that would mean that the Fed is getting a tighter employment market without however rocking the boat… just yet.
On the unemployment rate front, an uptick would be welcome due to an uptick in participation rate. That would mean that unemployment is higher not necessarily because people are losing their jobs, but rather because more people are willing to work.
And finally, a reasonable wages growth, like around 0.1-0.2% should be the cherry on top, as a too strong wages growth is a threat for inflation. Expectation for today is a NFP read of around 250K, unemployment rate at 3.7%, and wages growth of around 0.3% over the month.
A mix of soft data will likely see a bullish knee-jerk reaction, as investors are turning more concerned about the aggressive Fed tightening and are ready to bet that the rate hikes would slow down in the next few meetings and even stop, while a strong data could trigger a further selloff, as it would fail to keep the aggressive Fed hawks at bay.
It’s NFP Time
Market movers today
Today's highlight will be the US jobs report. Consensus is looking for some easing in employment growth (NFP +250k), but given the strength of the recent leading indicators, we continue to see modest upside risks to this (280k). Focus also on labour force participation and wage inflation.
German industrial production for August is expected to show contraction for a second month in a row. IP statistics are also due for Denmark and Norway, and the latter publishes GDP data for August. After surprisingly weak numbers over the summer, we anticipate a moderate improvement in August, with mainland GDP growing 0.4% m/m, thanks partly to slightly stronger growth in consumption.
Also, the energy crunch and its impact on the region's economy as well as Russia's war in Ukraine are set to be top issues at an informal meeting of EU leaders in Prague today.
The 60 second overview
Fed: Fed officials all voiced hawkish views yesterday, with Kashkari, Cook and Waller indicating that they are some time away from pausing rate hikes. Evans said they will probably be at 4.5-4.75% by next spring. Bank of Canada said similar things as 'more to be done' to address the inflation pressure and that they are not ready for a 'more fine balanced' rate policy.
ECB minutes did not contain new policy signals, although the minutes were slightly on the dovish side compared to recent communication. Most interestingly, 'some' members expressed preference for 50bp. 25bp was clearly insufficient. 'All members joined a consensus' 75bp. There was no commitment to a 75bp hike at the October meeting, as we expect and markets largely price, yet the data-dependent and meeting-by-meeting approach was stressed.
China: We are hosting a webinar on 9 November on the main takeaways from the China's 20th CPC Congress, which will be held on 16 October and last for about a week. We will look into political as well as economic take-aways from the Congress and not least whether there is any indication of when China will move away from the zero-covid policy.
Euro area retail sales were down 0.3% m/m in August and the July figure was also revised lower. Overall, real spending continues to trend down, especially for food products. At the same time, consumption is still showing some resilience - despite record-high inflation pressures - and is not falling off a cliff as consumer confidence might have suggested. That is probably also due to fiscal support measures and some households still not yet having received their higher energy bills.
Equities: Equities retreated on Thursday in an uneventful session. However, investors did not shift back to risk-off: Instead, the cyclical- and growth/quality preference continued. Communications, consumer discretionary and tech outperformed, but nothing like energy that rallied another 2%. S&P500 -1%, Dow -1.2%, Nasdaq -0.7% and Russell 2000 -0.6%. US futures slightly lower this morning too.
FI: For once, European markets saw relatively muted price action yesterday compared to the past two weeks with Bunds only trading in a 10.8bp low/high range. ECB minutes did not contain significant policy signals. Spreads were trading in a tight range as well. BoE resumed its purchases (albeit of just GBP 154m) after two days of not buying as part of their temporary QE. Gilts have been under pressure, however the pace of the sell-off is not as concerning as last week's. Fitch confirmed UK's rating at AA but revised its outlook to negative from stable.
FX: USD continues to re-gain ground as the positive cross-asset momentum fades and yields rebound higher. Equally, NOK negative news flows should contribute to keeping NOK under pressure in Q4 - not least if we are right in a global environment characterised by tighter financial conditions. For EUR/CHF, data showed a substantial drop in CHF sight deposits but we do not view this as SNB intervening in favour of CHF.
Credit: Following a period of very large moves in spreads, volatility declined yesterday where iTraxx Xover widened 6bp while Main widened less than 1bp.
Nordic macro
In Sweden, the September budget balance is due to be released today. A small deficit of SEK 2.5bn is projected by the Debt Office. However, since the May forecast the outcome has been SEK 30bn better than expected, probably mainly due to the soaring electricity capacity fees pouring into the national grid operator. Hence, in our view it would not be a surprise to see another significant surplus outcome.
After surprisingly weak numbers over the summer, we expect a moderate improvement in mainland GDP in August, up 0.4% m/m. The risk is actually tilted to the upside, but leading indicators nevertheless clearly point to a slowdown going forward.