Sample Category Title
USD/JPY Eyes US Nonfarm Payrolls
USD/JPY has been hovering close to the 145 line most of the week, and the trend has continued today. In the European session, USD/JPY is trading at 144.81, down 0.21%.
The US releases nonfarm payrolls later today. The release once received massive coverage and was usually a market-move, but the new era of high inflation and global tightening has stolen much of NFP’s thunder. Still, the indicator is an important bellwether of the health of the US economy and could provide insights into future rate moves from the Federal Reserve.
The consensus for the September nonfarm payrolls stands at 250,000, lower than the 315,000 recorded in August. The US labour market has been very robust, and investor reaction will likely be muted if the consensus is not wide of the mark. The markets will be more focussed on hourly earnings and the participation rate – soft readings would raise speculation that the Fed could ease up sooner rather than later, which would be bearish for the US dollar. Conversely, hot readings would support the Fed remaining hawkish, which would give the US dollar a boost.
Will the Ministry of Finance intervene again?
Japan will also be keeping a close eye on today’s US jobs reports. The Ministry of Finance (MOF) has shown that is willing to intervene to prop up the Japanese yen, and a stronger-than-expected NFP could be the trigger for another round of intervention. Since the dramatic intervention on September 22nd, the yen has moved only slightly above the 145 level, which could well be a ‘line in the sand’ for the MOF. The MOF intervention, which was meant as a warning against speculators, likely cost 2.84 trillion yen. The move led to Japan’s foreign currency reserves falling to their lowest level since 2017. With the Bank of Japan capping JGB yields and the Fed continuing to deliver oversize rate hikes, the US/Japan rate differential is widening, which means the yen will likely continue to lose ground, barring another currency intervention by the MOF.
USD/JPY Technical
- There is resistance at 145.36 and 145.97
- USD/JPY has support at 144.29 and 143.68
Dollar Index: Dollar Index Keeps Firm Tone ahead of Key US Jobs Data
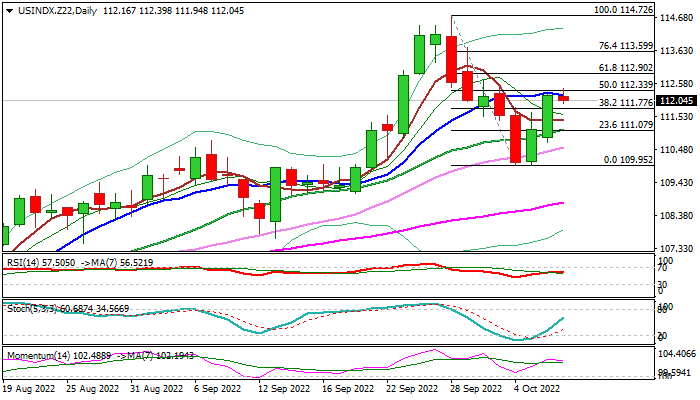
The dollar index is holding within a narrow consolidation in early Friday, following strong rally in past two days (up almost 2%) which retraced 50% of 114.72/109.95 pullback, adding to signals that corrective phase from new 20-year high might be over.
Daily studies returned to bullish setup and a bear-trap under 110.81 (Fibo 38.2% of 104.49/114.73) contribute to positive near-term outlook, with today’s close above 112.33 pivot (50% retracement of 114.72/109.95 / daily Tenkan-sen) to boost bullish signals.
Markets focus on US labor data as a key event today, with solid numbers to add to positive dollar’s sentiment, strongly underpinned by signals that the Fed remains on track for aggressive policy tightening.
US unemployment is expected to remain unchanged at 3.7% in September (close to the lowest since 2019) while non-farm payrolls are forecasted at 250K, down from August’s 315K, but seen positive while holding above 200K.
Only a shock from significantly weaker than expected US labor figures would derail dollar bulls.
Res: 112.33; 112.66; 112.90; 113.59.
Sup: 111.94; 111.77; 111.40; 111.18.
USDCAD Seems to Return to Gains; Nearby Resistance Eyed for Confirmation
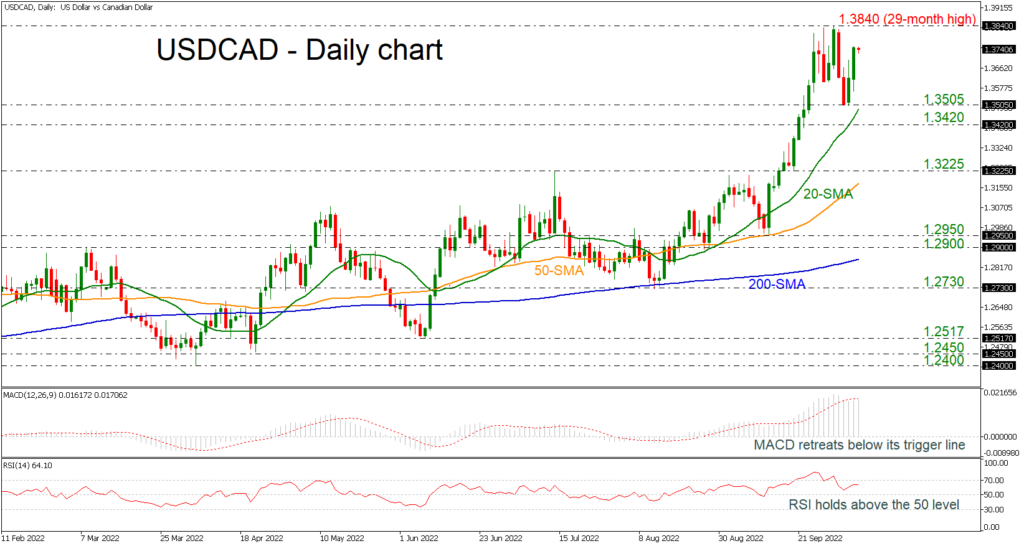
USDCAD is gaining sustainable ground, finding support at the 1.3505 barrier. The 20- and 50-day simple moving averages (SMAs) are following the upward movement; however, the technical oscillators are weakening their momentum. The MACD is standing beneath its trigger line in the positive area, while the RSI is flattening above the neutral threshold of 50.
Traders would be more eager to engage in buying activities if the price manages to surpass the nearby resistance at 1.3840, where the 29-month high is placed. If this is successfully breached, then the rally may next rest somewhere near the 1.4170 resistance, taken from the highs in March 2020.
On the flipside, the selling pressure could accelerate if the market deteriorates below the 1.3505 former strong support area, which stands near the 20-day SMA. Such a move could next bring the 1.3420 barrier under the spotlight, which if violated could trigger sharper losses probably towards the 1.3225 line.
In the long-term timeframe, the pair is in a bullish trend and only a move beneath the 200-day SMA would put the market in a sideways path.
USD/CNH: We Expect a Second Rise to the Maximum of 7.268
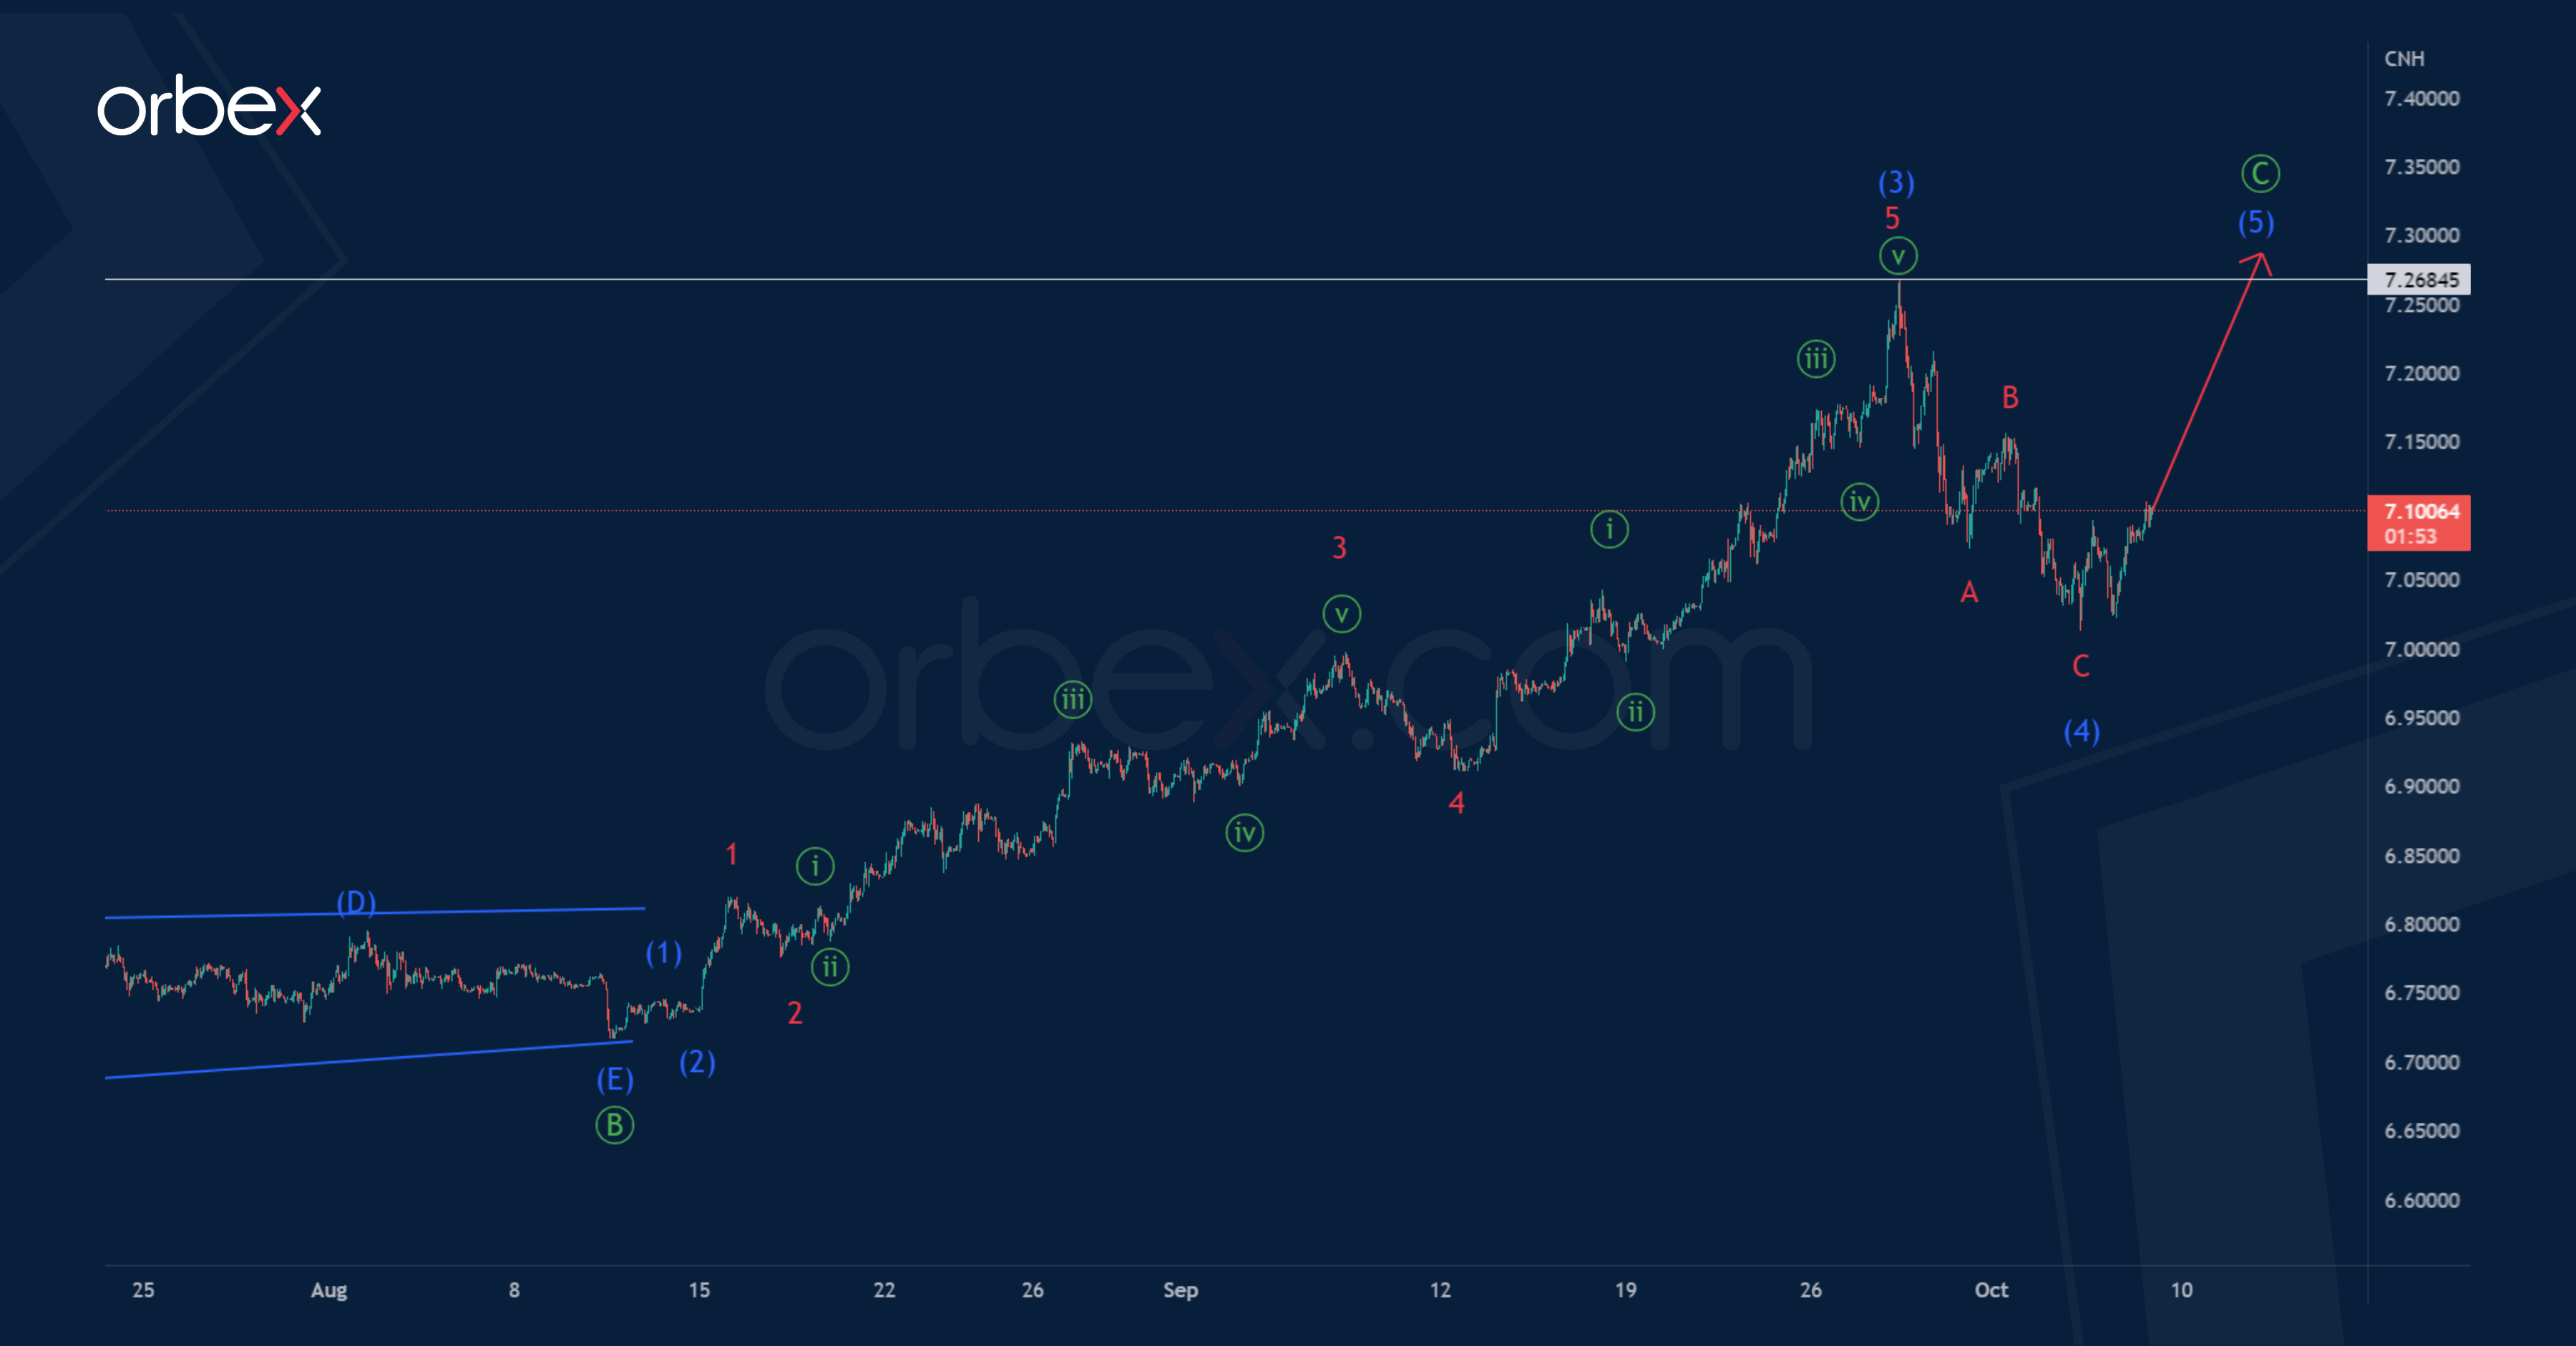
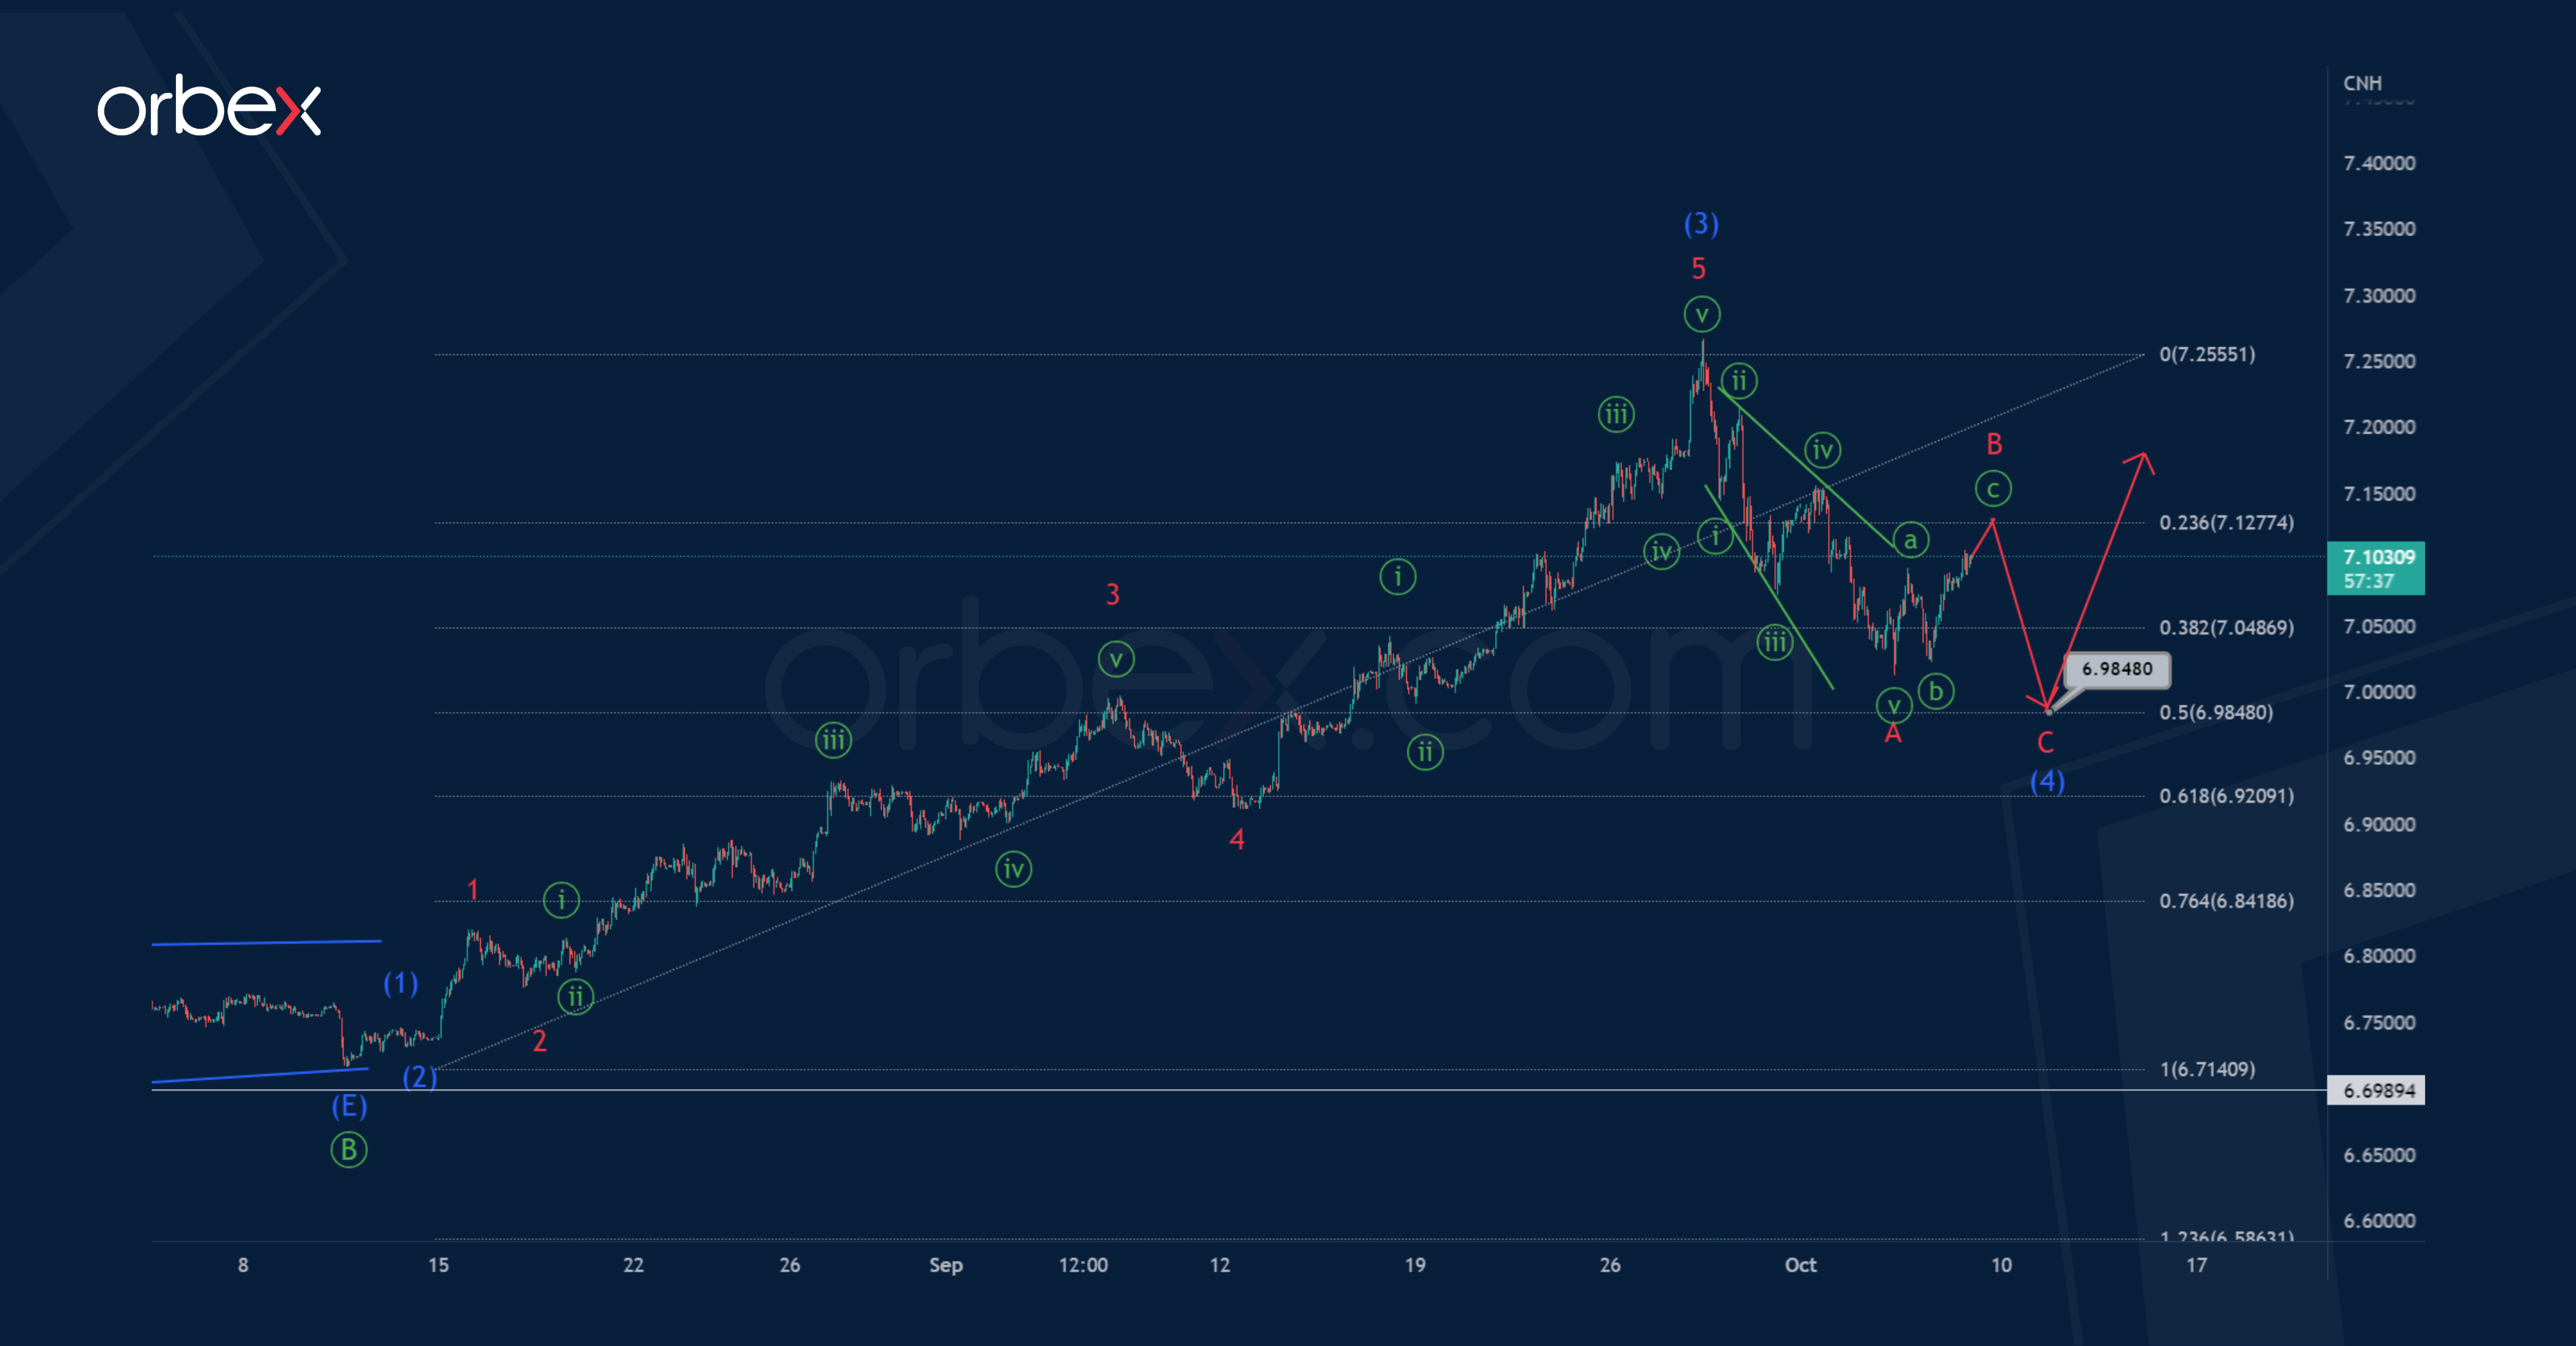
The current chart of the USDCNH currency pair shows the development of the correction pattern - the primary zigzag Ⓐ-Ⓑ-Ⓒ. This primary construction today looks completed in two parts out of three.
The last bullish wave Ⓒ seems to take the form of an intermediate 5-wave impulse (1)-(2)-(3)-(4)-(5).
It is possible that the last intermediate wave (5) is currently under development. It may take an impulse form, or the form of an ending diagonal. The growth in this wave is likely to continue to 7.268.
The indicated level is the maximum, which was marked by the previous impulse sub-wave (3).
An alternative scenario shows that the currency pair may continue the correction wave (4) of the intermediate degree. It is assumed that it will take the form of a standard minor zigzag A-B-C, where wave A is the leading diagonal.
Using the Fibonacci line tool, we can predict the end of wave (4). Most likely, it will be at 50% of bullish impulse wave (3), which, according to statistics, is most often found in impulse patterns. Therefore, its end can be expected near 6.984.
An approximate scheme of possible future movement is shown on the chart.
S&P 500 Attempts to Bounce
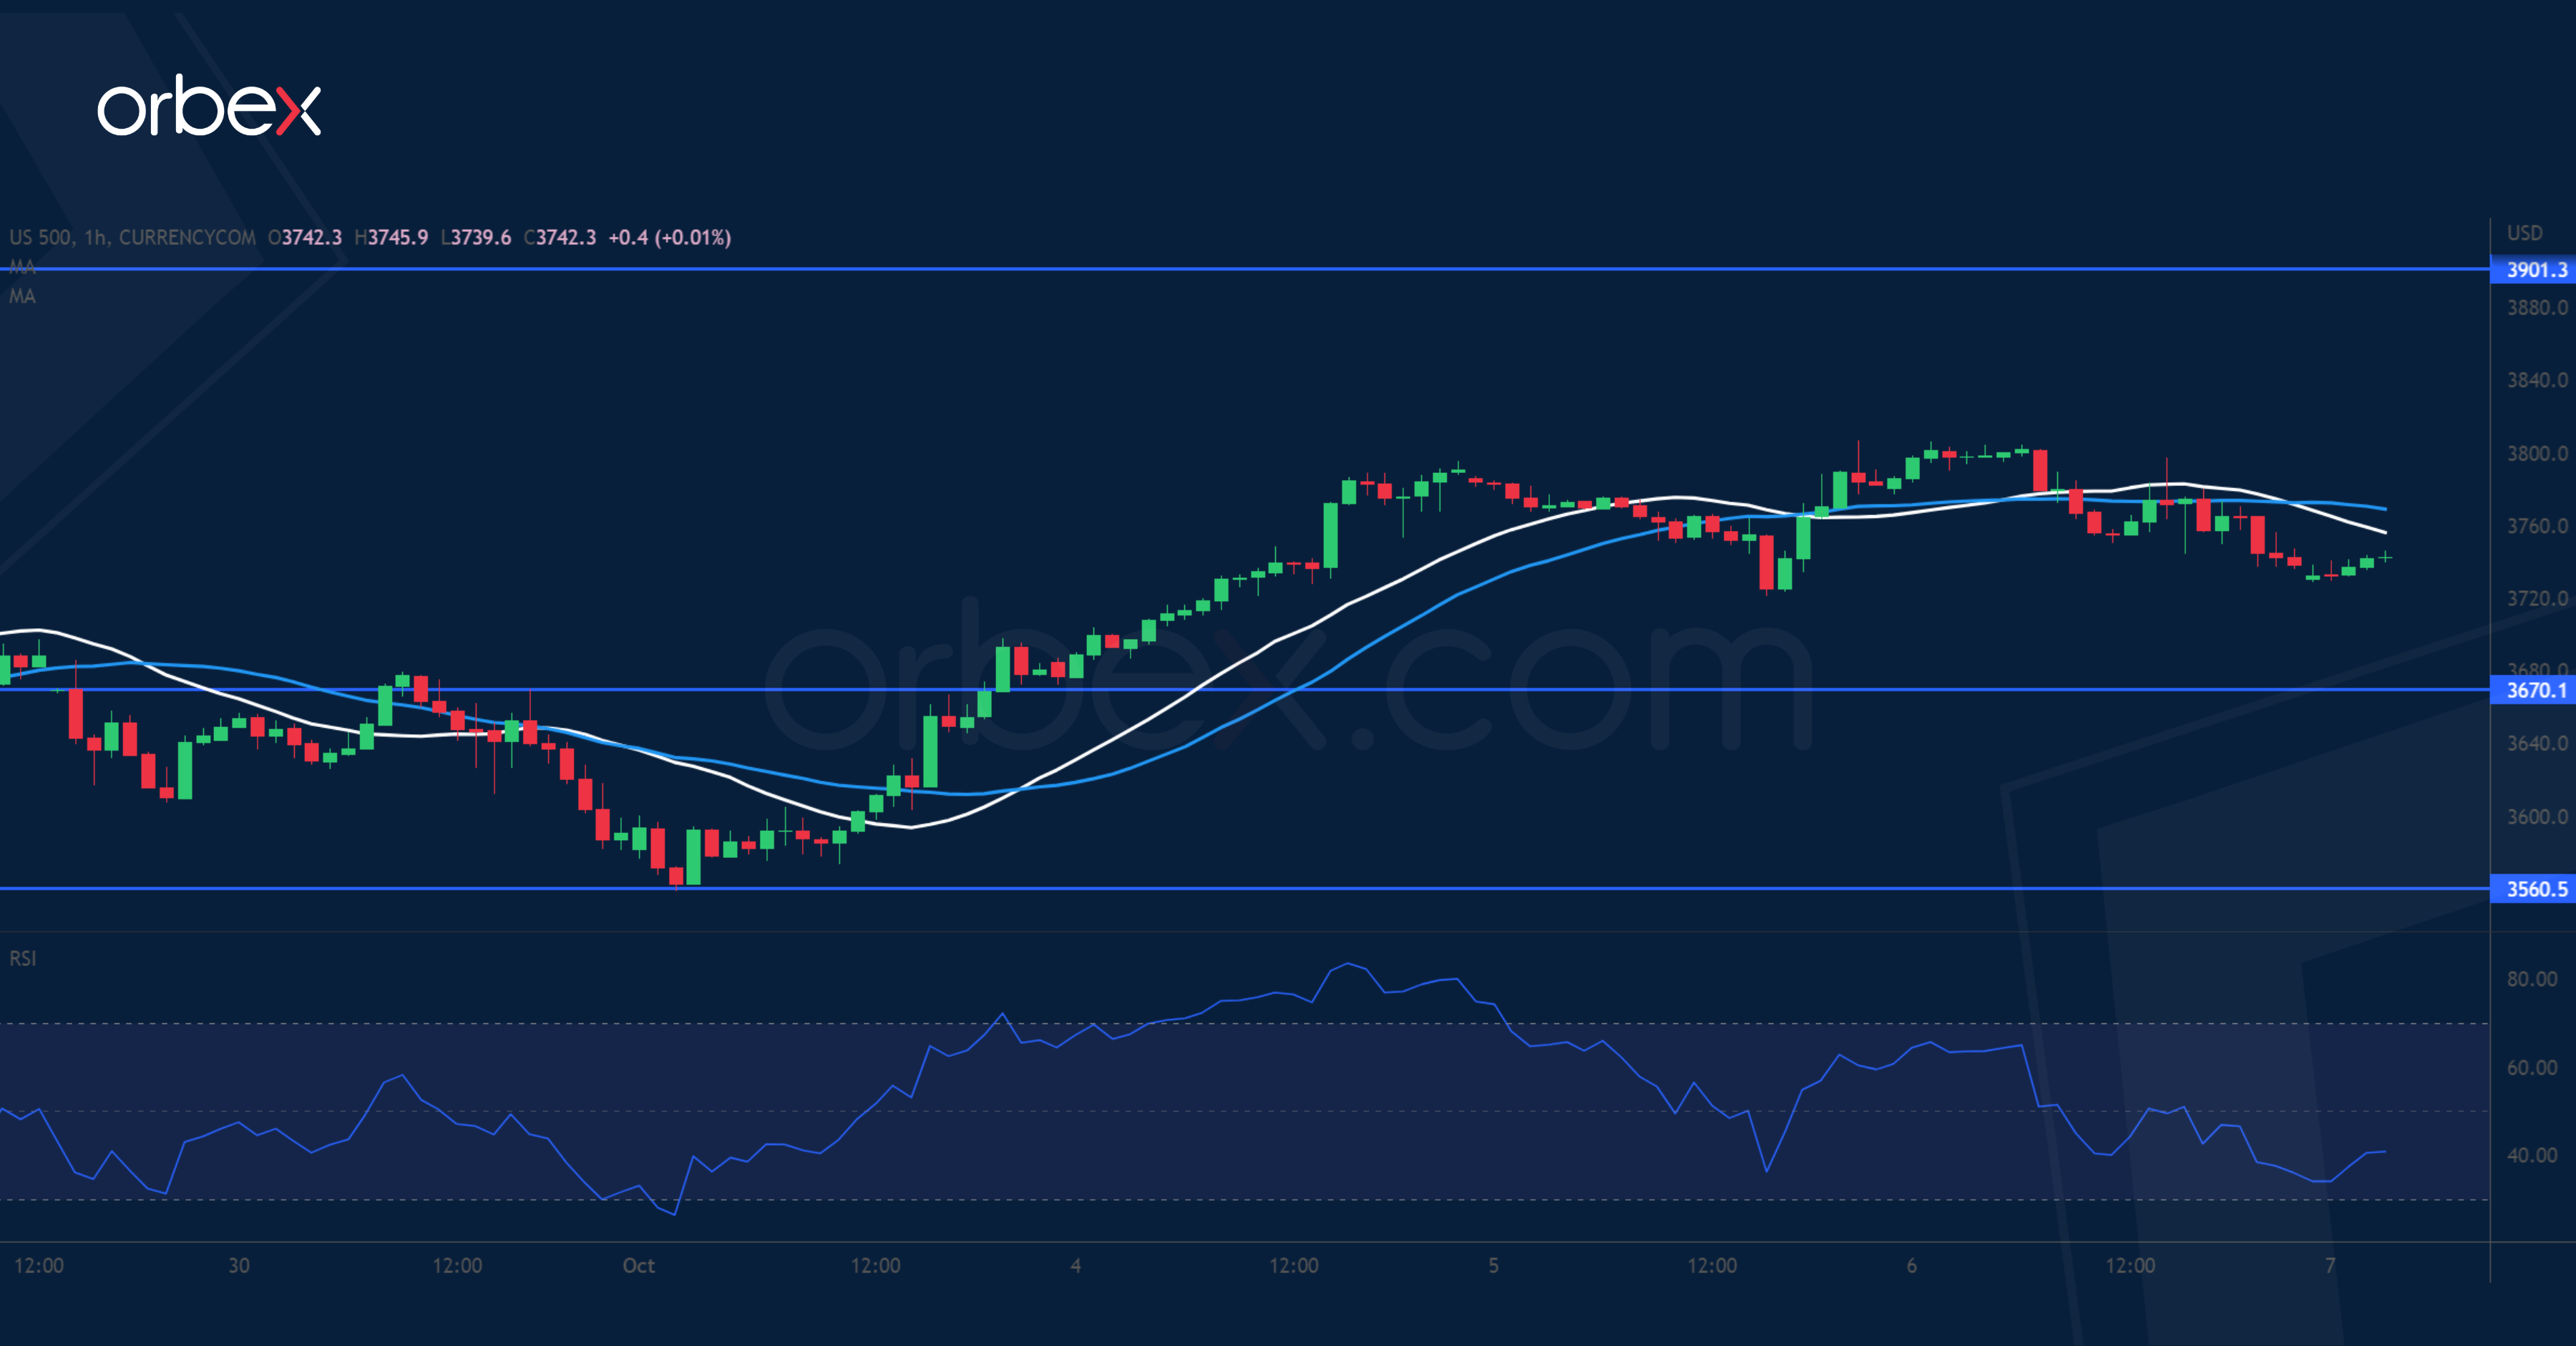
The S&P 500 treads water ahead of the nonfarm payrolls report in September. The index has been looking to claw back some losses after its drop below the critical floor at 3750. Sentiment remains downbeat though there could be short-term opportunities in the current recovery. A rally above 3670 has eased the selling pressure, turning it into a fresh support. 3900 is a major hurdle where the bears could be expected to double down. The bulls will need to clear this supply area before a rebound could gain traction.
EUR/JPY Seeks Support
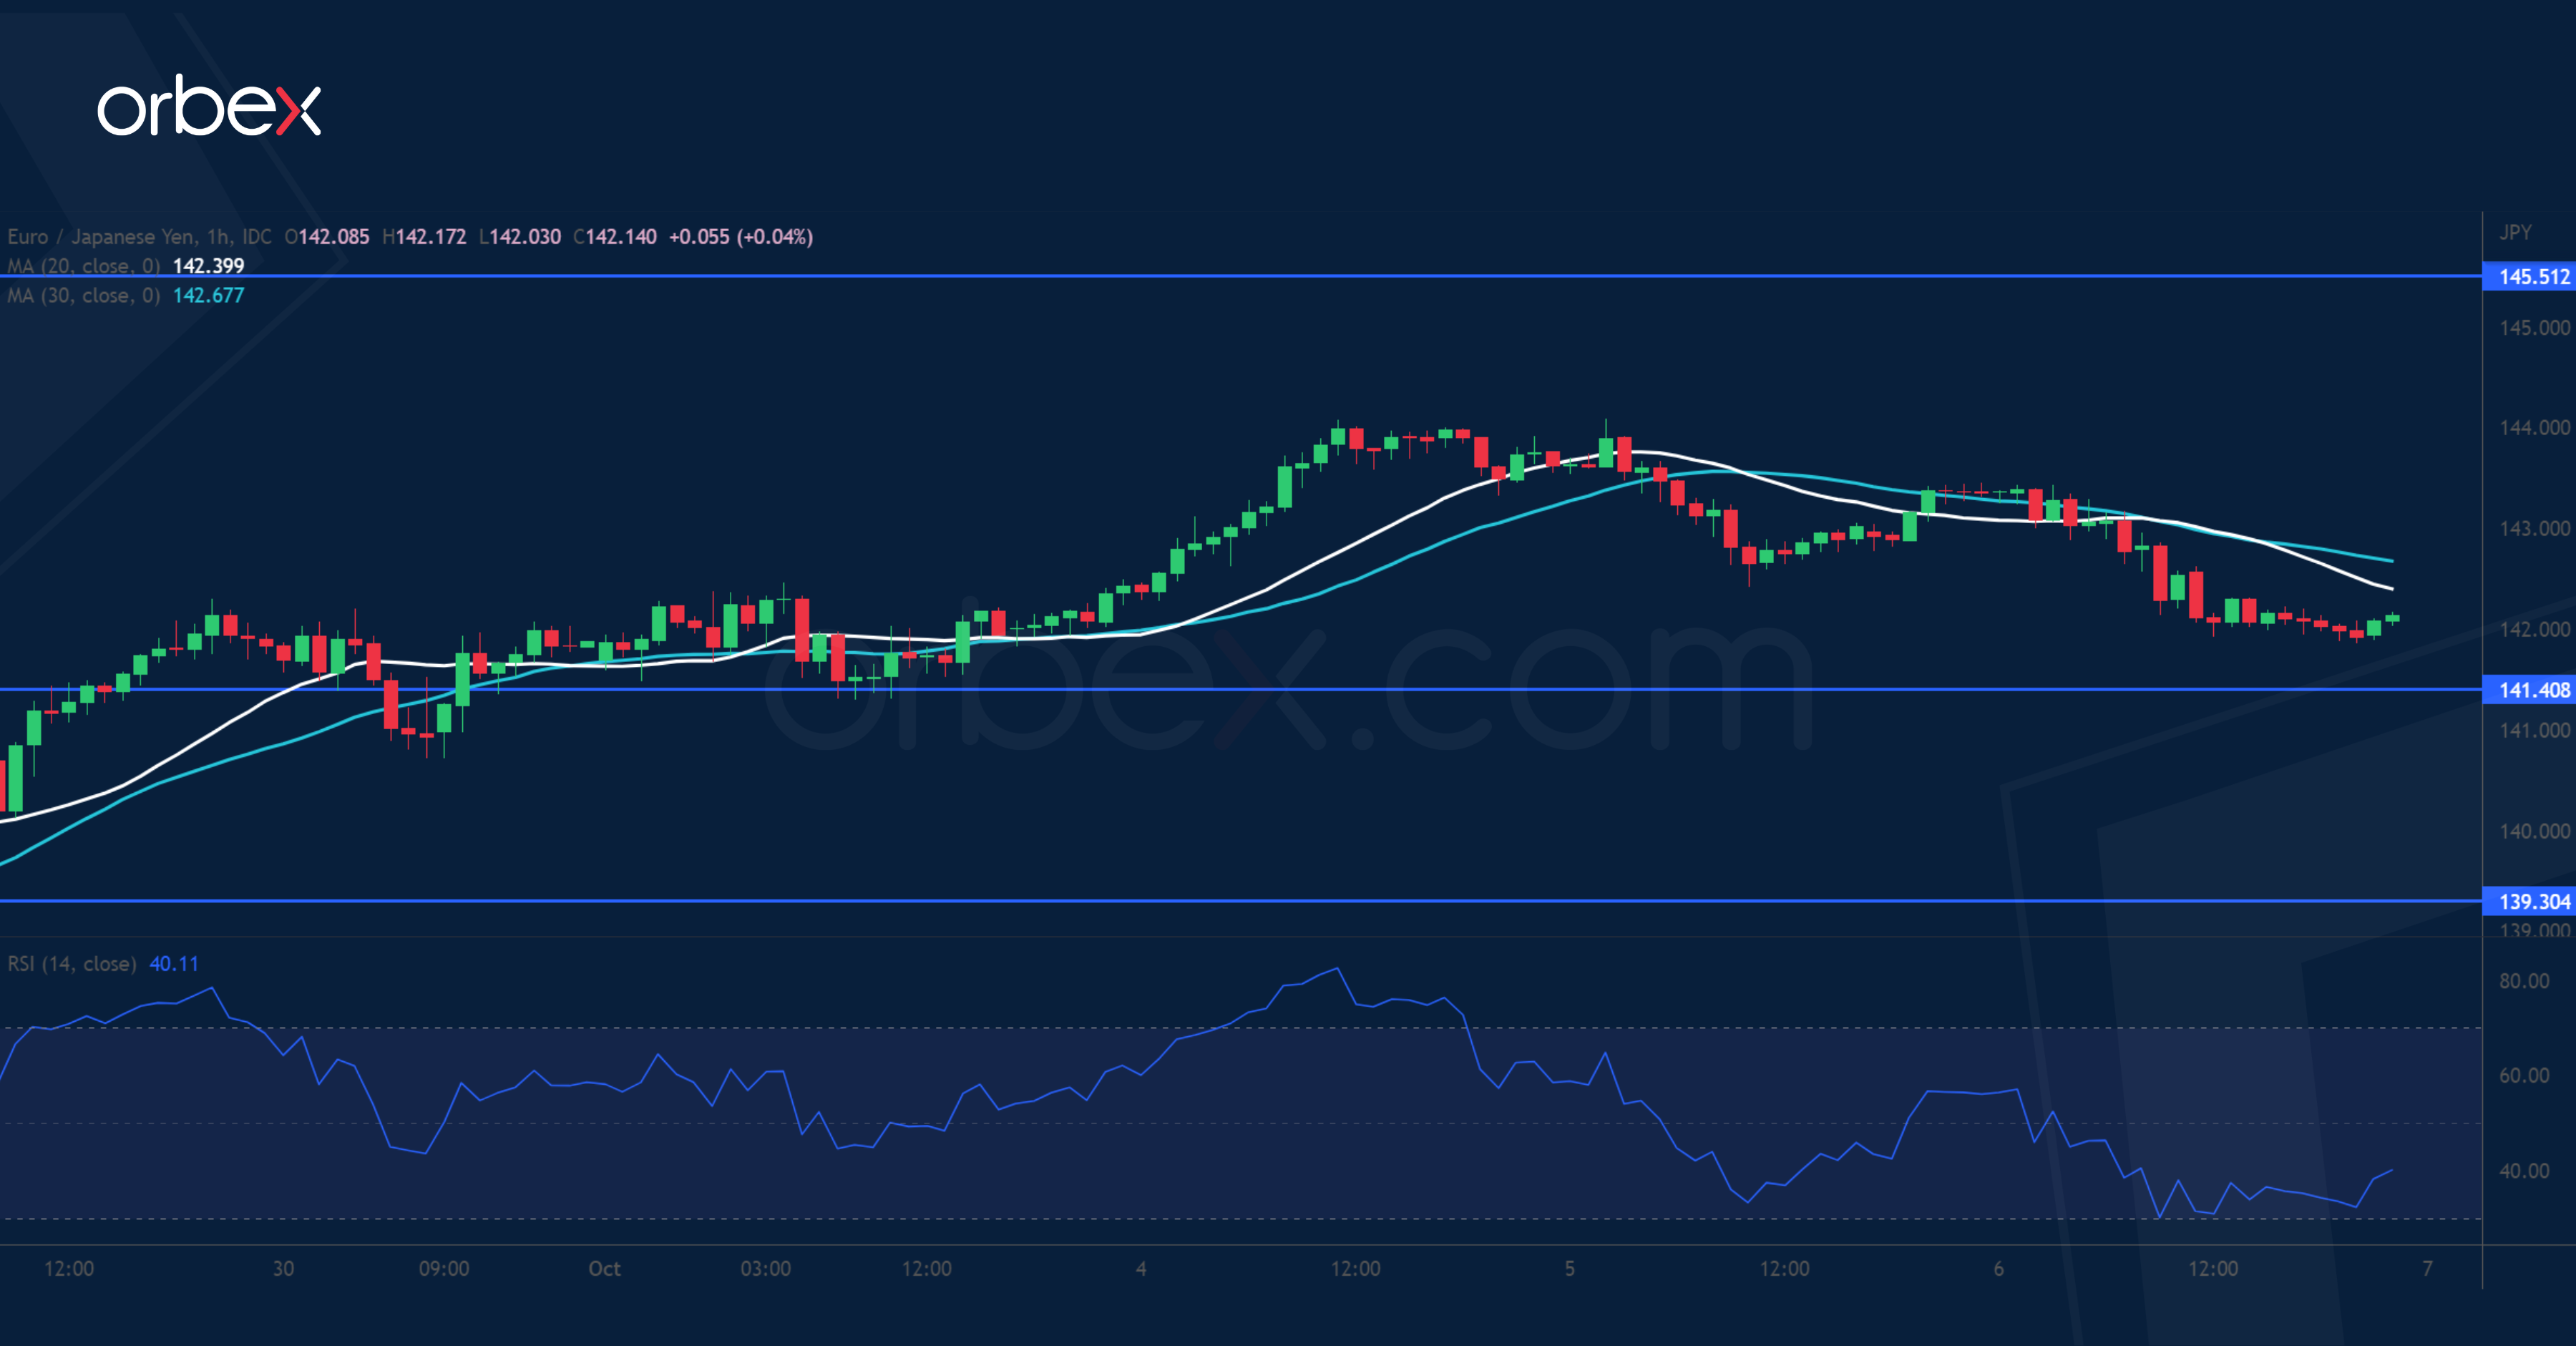
The euro weakened after the ECB minutes showed that a recession was "increasingly likely". A break above 143.50 the origin of a previous liquidation has prompted sellers to cover their bets. This is an indication of strong interest in maintaining the euro’s lead. As the RSI drops back to the neutral area, the former supply zone around 141.40 is the first level to gauge follow-up bids. A bounce would carry the single currency to the recent peak at 145.50. Otherwise, the pair may drift towards 139.30.
USD/CHF Awaits Breakout
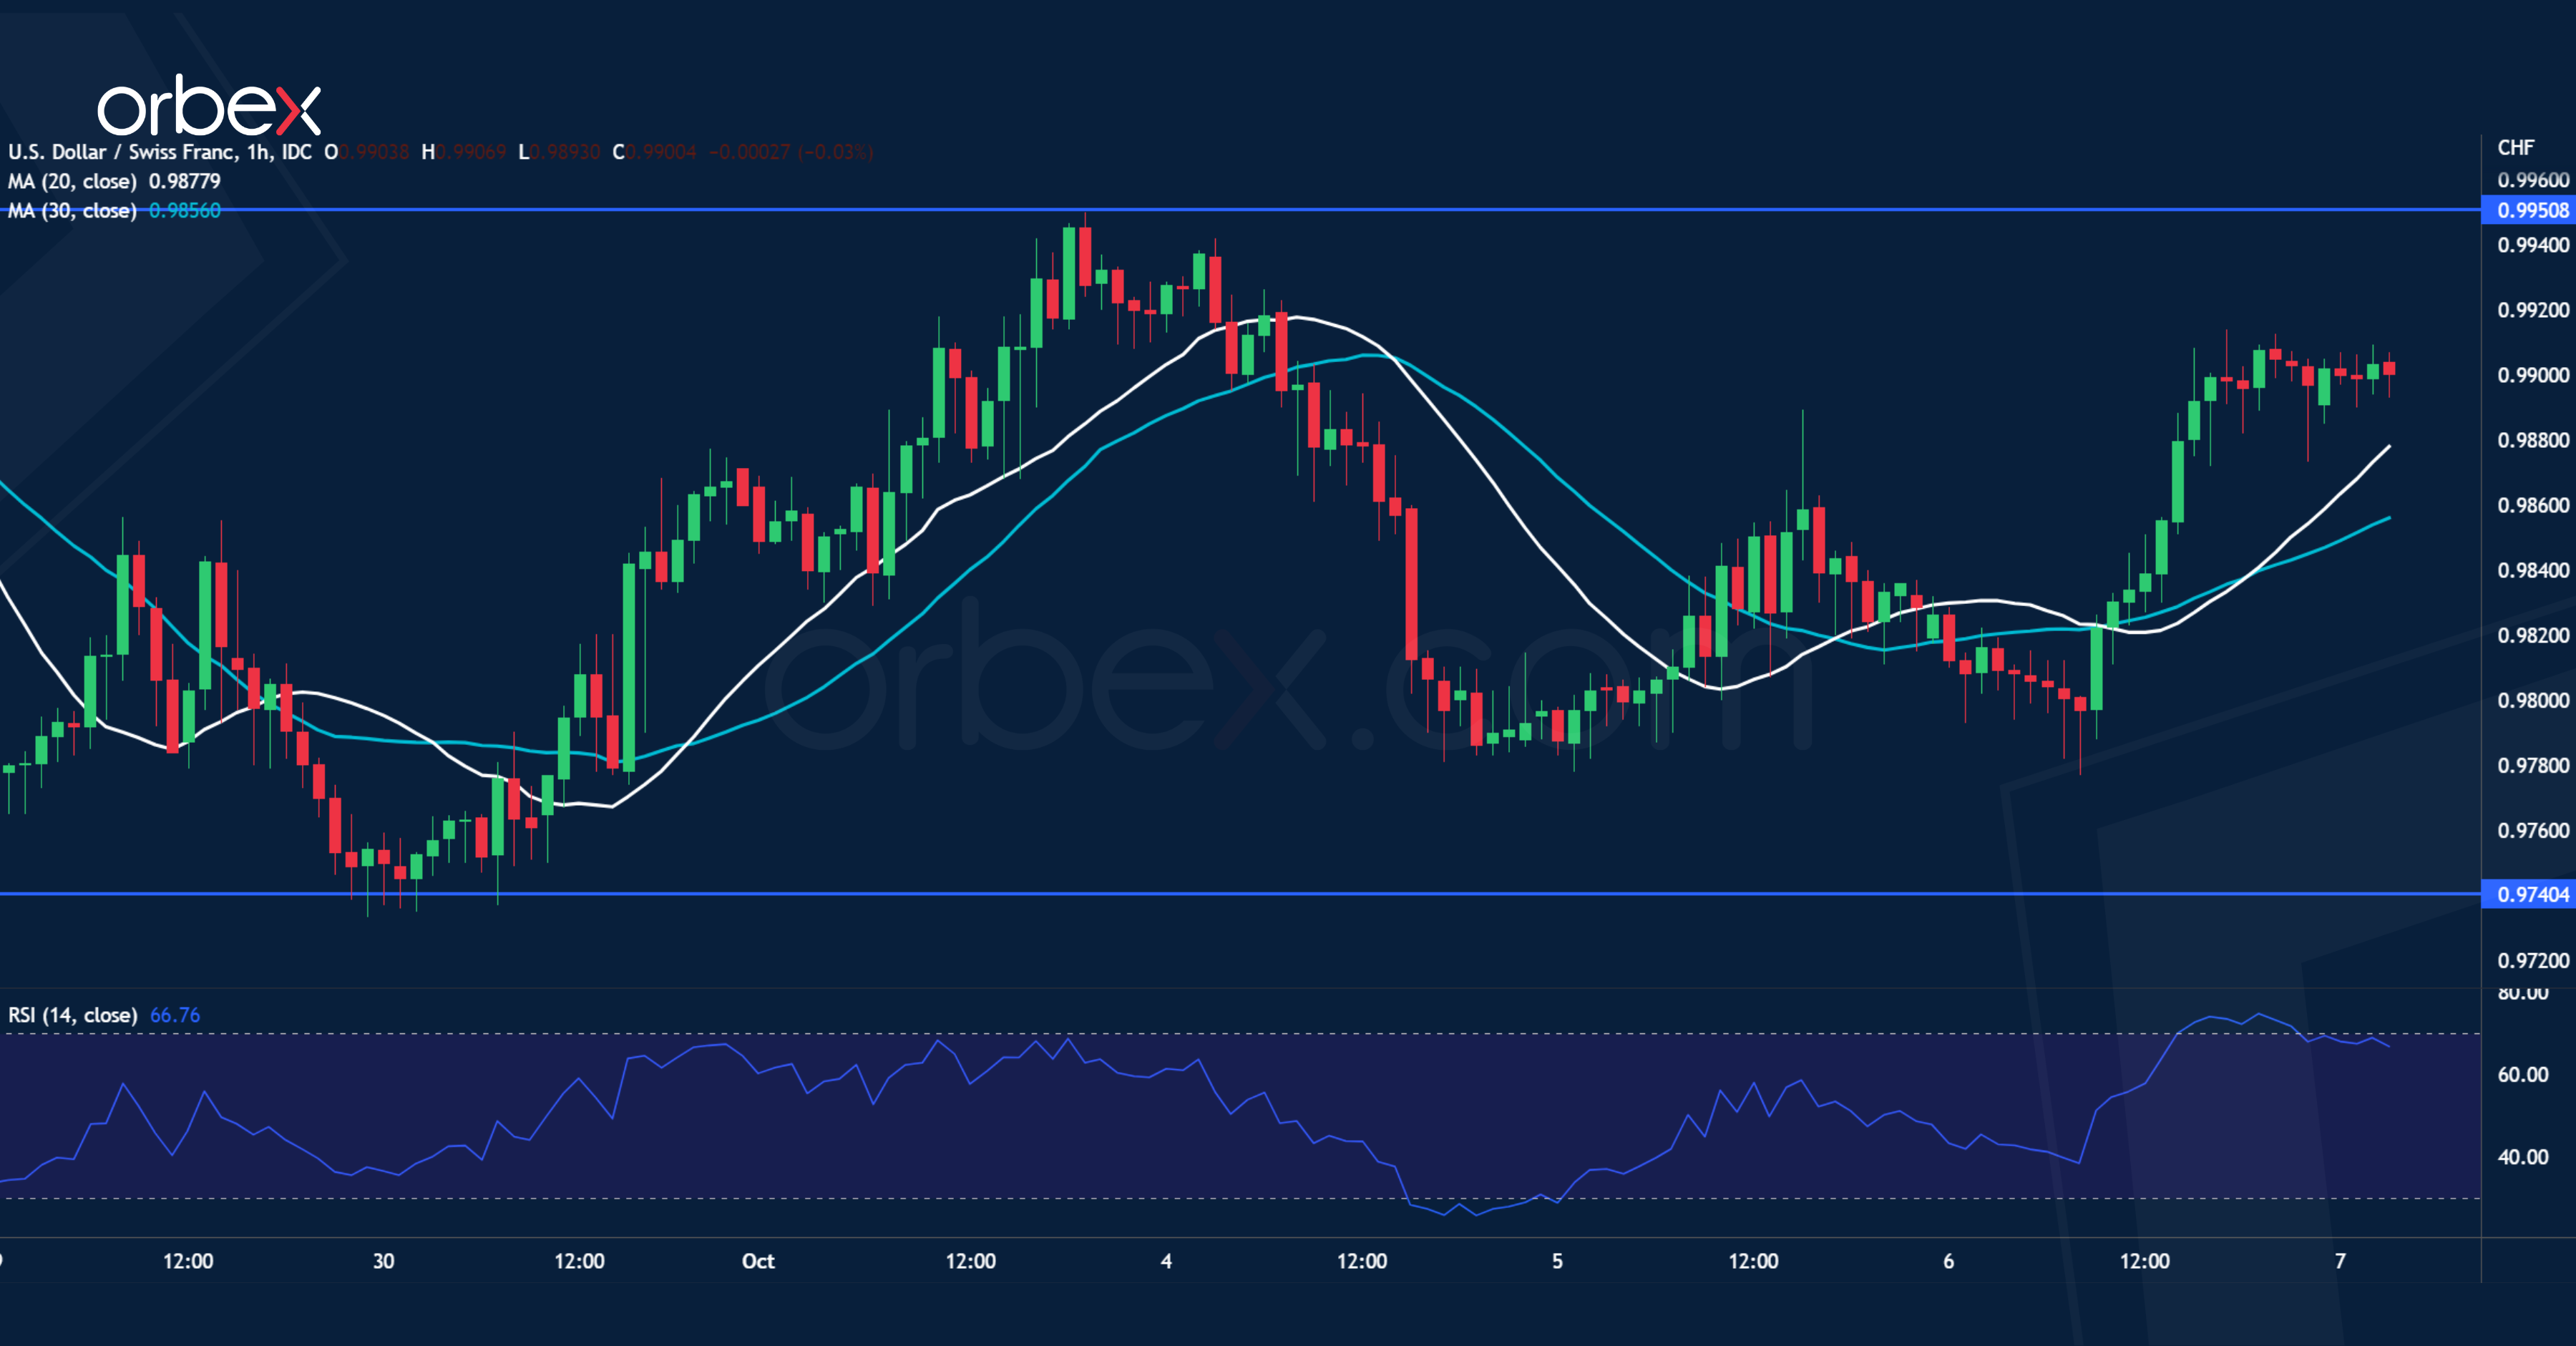
The US dollar bounces higher as traders bet on the Fed to stay on an aggressive tightening course. With the double top (0.9860) now out of the picture, the directional bias remains up as the greenback consolidates its gains over the 20-day moving average. The narrowing range between 0.9740 and 0.9950 could be a sign of accumulation. A bullish breakout would lift offers back to June’s high at 1.0040, a step closer to resume the uptrend in the medium-term. However, a deeper correction would bring the pair to 0.9620.
GBP/JPY Daily Outlook
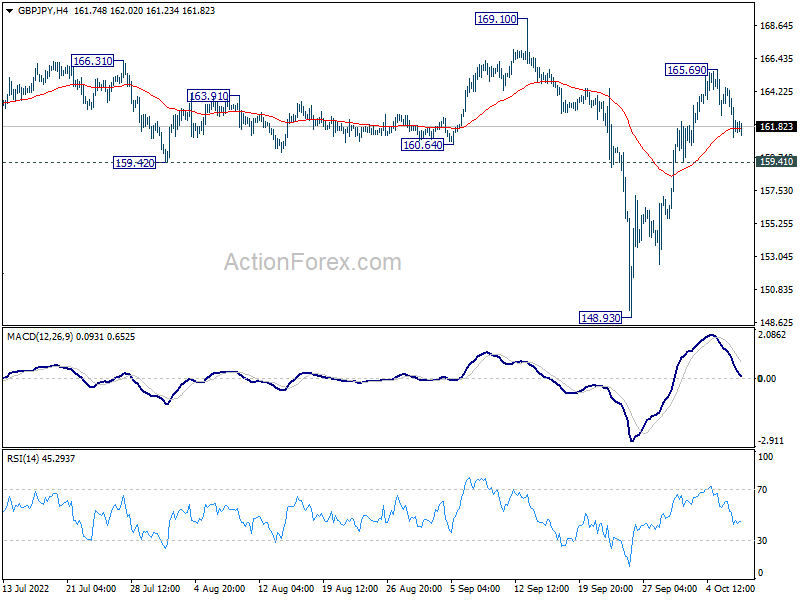
Daily Pivots: (S1) 160.58; (P) 162.52; (R1) 163.92; More...
Intraday bias in GBP/JPY remains neutral first. While further rise could be seen, strong resistance might be seen from 169.10 high to limit upside, at least on first attempt. On the downside, below 159.41 minor support will turn bias back to the downside for 148.93 again. However, firm break of 169.10 will confirm resumption of larger up trend.
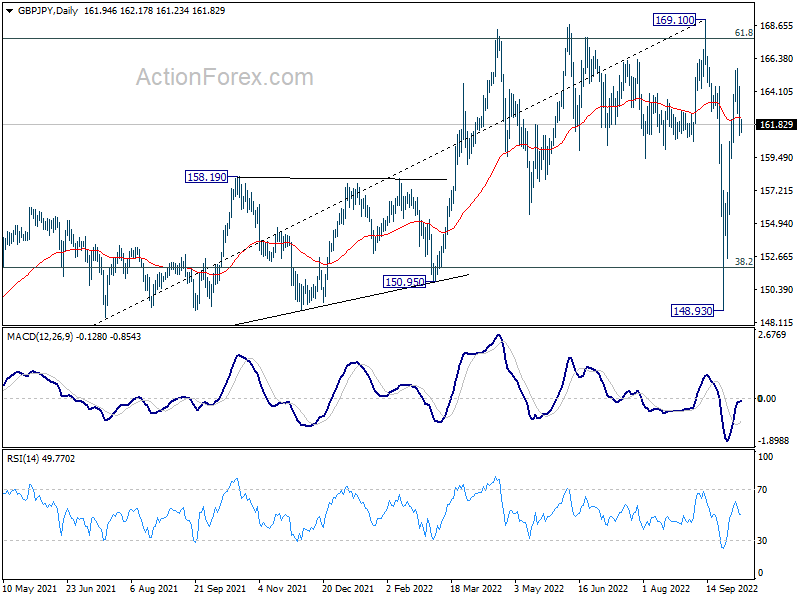
In the bigger picture, strong support from 38.2% retracement of 123.94 to 169.10 at 151.84 suggests that price actions from 169.10 are developing into a corrective pattern only. That is, rise from 123.94 (2020 low) should resume at a later stage. This will now remain the favored case as long as 148.93 support holds.
EUR/JPY Daily Outlook
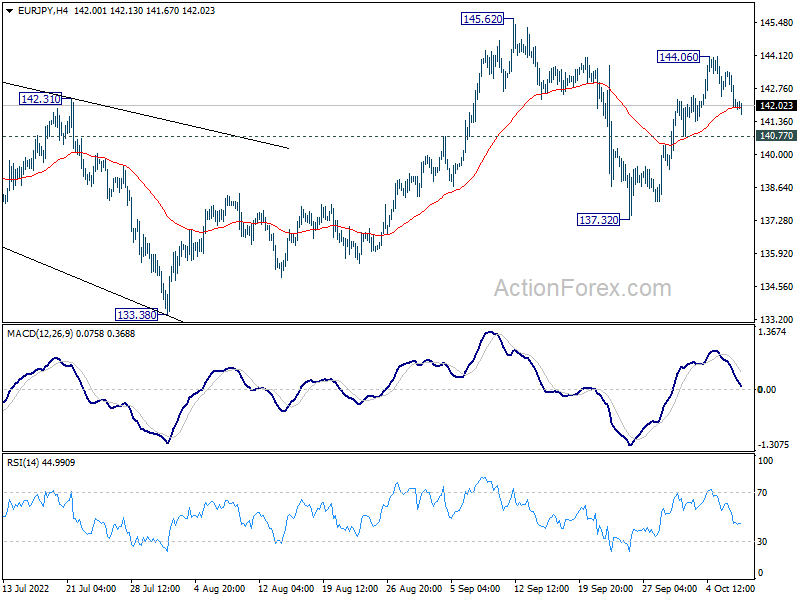
Daily Pivots: (S1) 141.55; (P) 142.51; (R1) 143.05; More....
Intraday bias in EUR/JPY remains neutral for the moment. On the upside, firm break of 145.62 resistance will resume larger up trend. However, break of 140.77 minor support will turn bias back to the downside, to extend the corrective pattern from 145.62 with another falling leg.
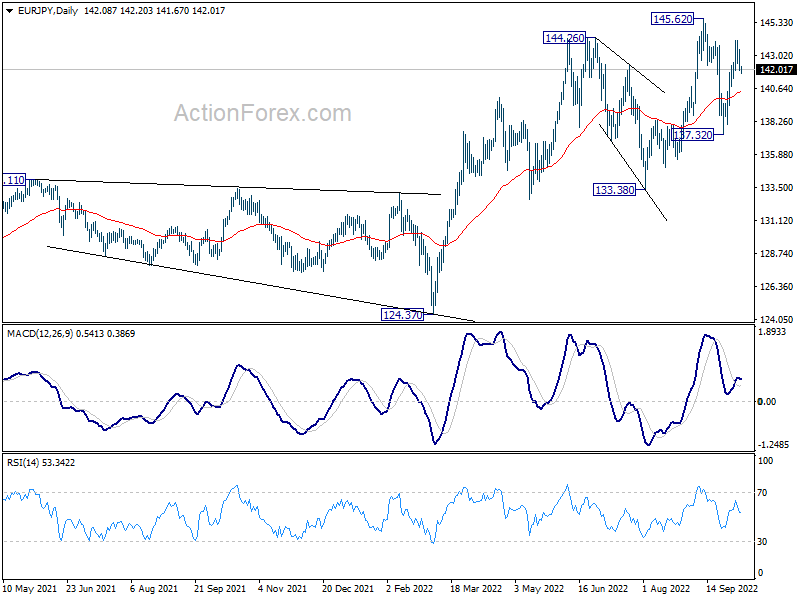
In the bigger picture, as long as 133.38 support holds, the up trend from 114.42 (2020 low) could still extend through 145.62 high. In that case, next target is 149.76 (2015 high). However, sustained break of 133.38 will be a sign of medium term bearish reversal and bring deeper fall to 124.37 support first.
EUR/GBP Daily Outlook
Daily Pivots: (S1) 0.8721; (P) 0.8769; (R1) 0.8821; More...
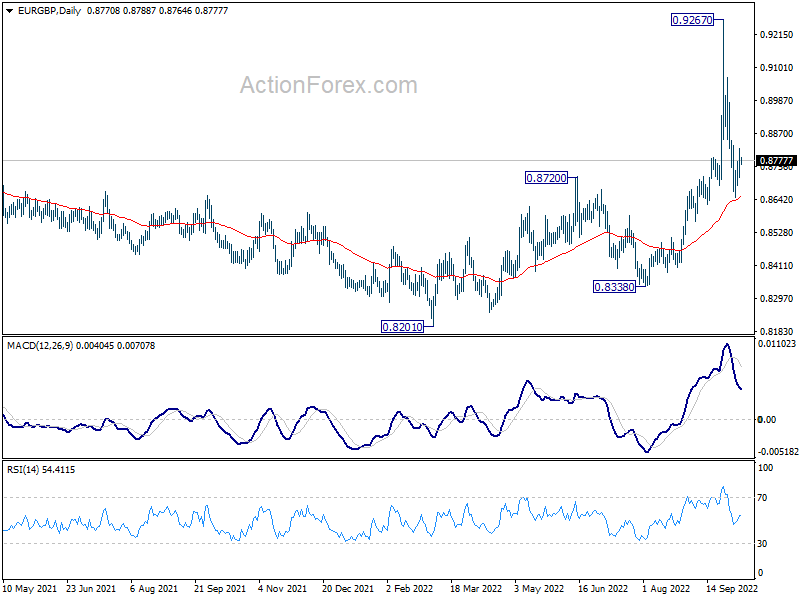
Intraday bias in EUR/GBP remains neutral at this point, and deeper decline is in favor with 0.8848 minor resistance intact. Rise from 0.8201 could have completed at 0.9267 in three-wave corrective pattern. Sustained break of 55 day EMA (now at 0.86426) will target 0.8201/8338 support zone. On the upside, above 0.8848 minor resistance will turn bias back to the upside for recovery instead.
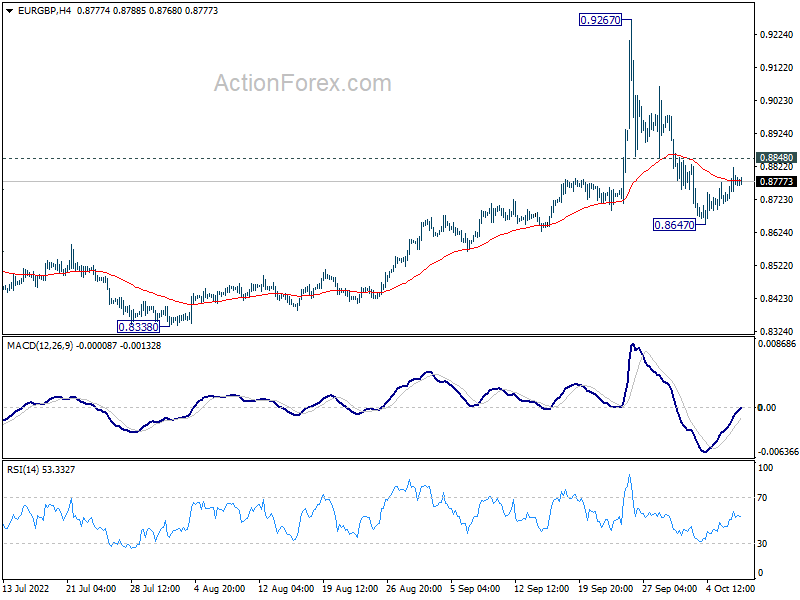
In the bigger picture, as long as 0.8720 resistance turned support holds, rise from 0.8201 is seen as resuming larger up trend from 0.6935 (2015 low). Break of 0.9499 (2020 high) should be seen at a later stage. However, firm break of 0.8720 will argue that sideway pattern from 0.9499 is extending with another falling leg instead.