Sample Category Title
US: Strong Demand Pushes ISM Services Higher
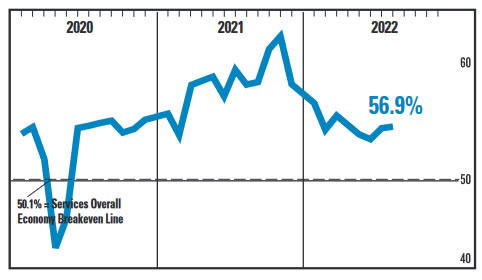
The ISM Services Index improved in August, adding 0.2 percentage points (ppts) with a reading of 56.9– higher than the 54.9 expected by the consensus.
Demand factors added 0.7 ppts to the overall index. Both the business activity and the new orders subindexes rose above 60 for the first time since December and March, respectively. The biggest contributor was the new orders subindex, which rose by 1.9 ppts to 61.8, while business activity subindex added 1.0 ppts with a reading of 60.9.
Supplier deliveries subtracted 0.8 ppts from the headline, easing to 54.5 – the lowest level since the beginning of the pandemic.
Employment activity moved out of contractionary territory, gaining 1.1 ppts to reach 50.2 – another signal of easing supply.
The backlog of orders subindex (which doesn't have a weight in the aggregate measure, but is a good gauge of supply-demand imbalances) declined 4.4 ppts to 53.9.
The prices paid component declined further, easing by 0.8 ppts to 71.5.
Fourteen industries expanded in August. The two industries reporting a decrease in the month of August are: Agriculture, Forestry, Fishing & Hunting; and Arts, Entertainment & Recreation.
Key Implications
Services continued to expand at a faster pace than the previous month and slightly above the second quarter average. Importantly, demand factors – such as business activity, new orders and new export orders – are accelerating.
Meanwhile, there is more evidence that supply challenges are normalizing. The gap between the supplier deliveries time and the rest of the index's drivers continued to narrow with today's reading just two percentage points above its pre-pandemic average. This seems to have contributed to a decline in the prices paid component, which should help ease the inflationary pressure and soothe consumer sentiment.
Easing supply-chain challenges and lower prices is good news for the Fed. Still, a higher than expected reading may reinforce bets for a supersized hike later this month. As this is one of the last data releases before the Fed enters a black-out period on Saturday, all eyes now turn Chair Powell and other FOMC speakers as they deliver their addresses this week.
Sunset Market Commentary
Markets
Interest rate markets show quite a divergent pattern. US markets reopened after enjoying a long weekend. Yesterday’s bearish price action in Europa, notably in a risk-off market, made clear that markets are more than ever embracing the idea of CB font-loading to bring inflation (expectations) back under control. Friday’s post-payroll/pre-long weekend short covering on US Treasuries didn’t fit in this narrative. US yields rebound sharply with yields at the belly of the curve gaining 12 bps (5/10-y), the wings rising 9/10 bps. The ISM services (56.9) confirms recent evidence that there is no reason for the Fed to ease its anti-inflation campaign. European interest rates took a breather after yesterday’s remarkable rise. Indeed, there were headlines from dovish ECB members (Centeno and Stournaras) advocating a gradual approach. Even ECB’s Kazaks gave some more balanced comments on the pace of tightening in a context of a protracted recession. However, we don’t think this applies to this week’s meeting. After easing temporarily, EMU swap yields currently are trading little changed (2-y) to still marginally higher (5-y +2.5 bps). Oil and the European gas benchmark contracting again, ceding ground despite the closure of Nord stream 1 and yesterday’s OPEC production cut, maybe created some breathing space too. Price action on UK interest rate markets is interesting too. The new UK government is said to prepare a package of up to £130 bln to mitigate consumers’ energy bill and at the same time might prepare measures worth up to £40 bln to ease the burden of higher energy costs for businesses. Quite an impressive fiscal stimulus in an environment where central bankers try to cool inflation via a moderation in global demand. With the 2-y gilt yield is easing 2 bps, markets are apparently cautious to expect a forceful recalibration of BoE policy. At the same time yields at longer maturities are jumping sharply (30-y + 18 bps!). Equities are ceding modest gains on the sharp intra-day rise in yields during the USD trading session.
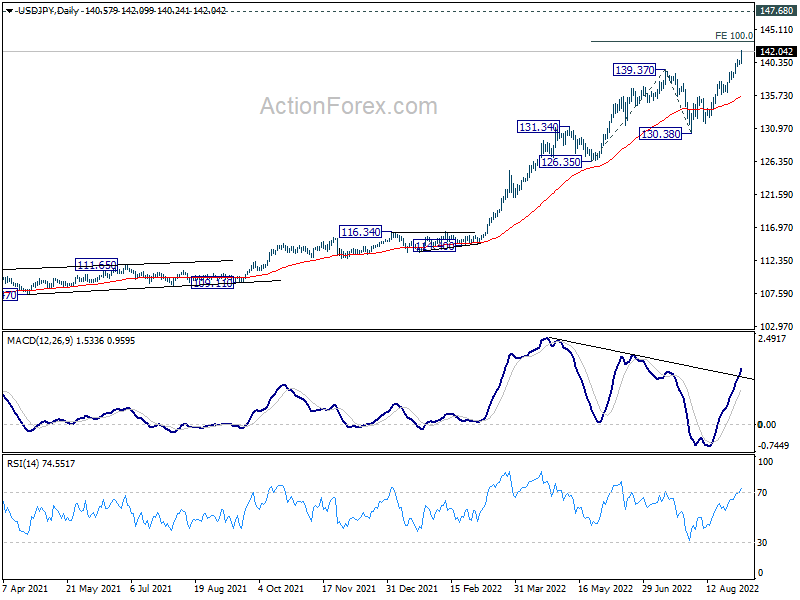
The TW USD index (110.17) simply resumes its uptrend after Friday’s post-payrolls profit taking (cycle top stance at 110.27. The most remarkable performance today comes from the USD/JPY cross rate, jumping from 140.25 this morning to currently trade at 142.50, the strongest level since August 1998. At current pace, the 147.66 1998 peak can come within reach soon. EUR/USD also isn’t out of the woods yet. The pair (0.9895) struggles not to fall below yesterday’s multi-year low of 0.9878. Even so, a more neutral price action in the likes and EUR/AUD, EUR/NZD, EUR/CHF and to lesser extent EUR/CAD only confirms that this is at least as much USD strength as it is euro weakness. EUR/JPY even surpassed the 141mark. Sterling today was one of the few ‘majors’ able to compete with the almighty US dollar as the UK currency profited from the expected huge fiscal support of the PM Truss’ government to address the energy crisis. Cable is holding north of the 1.15 barrier (1.1536). EUR/GBP dropped from the 0.8625 area at the start of trading to currently trade near 0.8575.
News Headlines
Turkey plans a new round of cheap, government-backed loans for businesses, according to persons familiar with the matter. The plans to extend loans under the Credit Guarantee Fund were disclosed during a closed-door meeting held by Treasury and Finance minister Nebati. It’s the latest stimulus measure to keep the economy going as the country heads into next year’s elections. Last month, Turkey’s central bank unexpectedly cut rates in the face of a growth slowdown, even as inflation skyrocketed to more than 80% in August. The news comes after new economic forecasts over the weekend, projecting GDP growth for this year and the next to come in at 5%.
Italy came up with a new plan to reduce natural gas consumption through the winter in order to meet the EU target of 15%. In reality, the reduction will be less, totaling 7% as the country obtained an exemption based on its gas storage capacity. Measures to reach the target include capping indoor temperatures at 19 degrees Celsius and have heating hours reduced, increasing use of coal and shorten the traditional winter heating schedule by two weeks.
US ISM services ticked up to 56.9, corresponds to 2.5% annualized GDP growth
US ISM Services PMI rose from 56.7 to 56.9 in August, above expectation of 55.4. Business activity/production rose from 59.9 to 60.9. New orders rose from 59.9 to 61.8. Employment rose from 49.1 to 50.2. Prices dropped from 72.3 to 71.5.
ISM said: " The services sector had a slight uptick in growth for the month of August due to increases in business activity, new orders and employment. Based on comments from Business Survey Committee respondents, there are some supply chain, logistics and cost improvements; however, material shortages remain a challenge. Employment improved slightly despite a restricted labor market."
"The past relationship between the Services PMI and the overall economy indicates that the Services PMI for August (56.9 percent) corresponds to a 2.5-percent increase in real gross domestic product (GDP) on an annualized basis."
EURUSD Resume Downside After Finding Sellers At Blue Box
In this technical blog, we will look at the past performance of 1 hour Elliott Wave Charts of EURUSD. In which, the decline from the 10 August 2022 high unfolded as an impulse sequence and favored extension in wave five to take place. Therefore, we advised members to sell the bounces in 3, 7, or 11 swings at the blue box areas. We will explain the structure & forecast below:
EURUSD 1 Hour Elliott Wave Chart
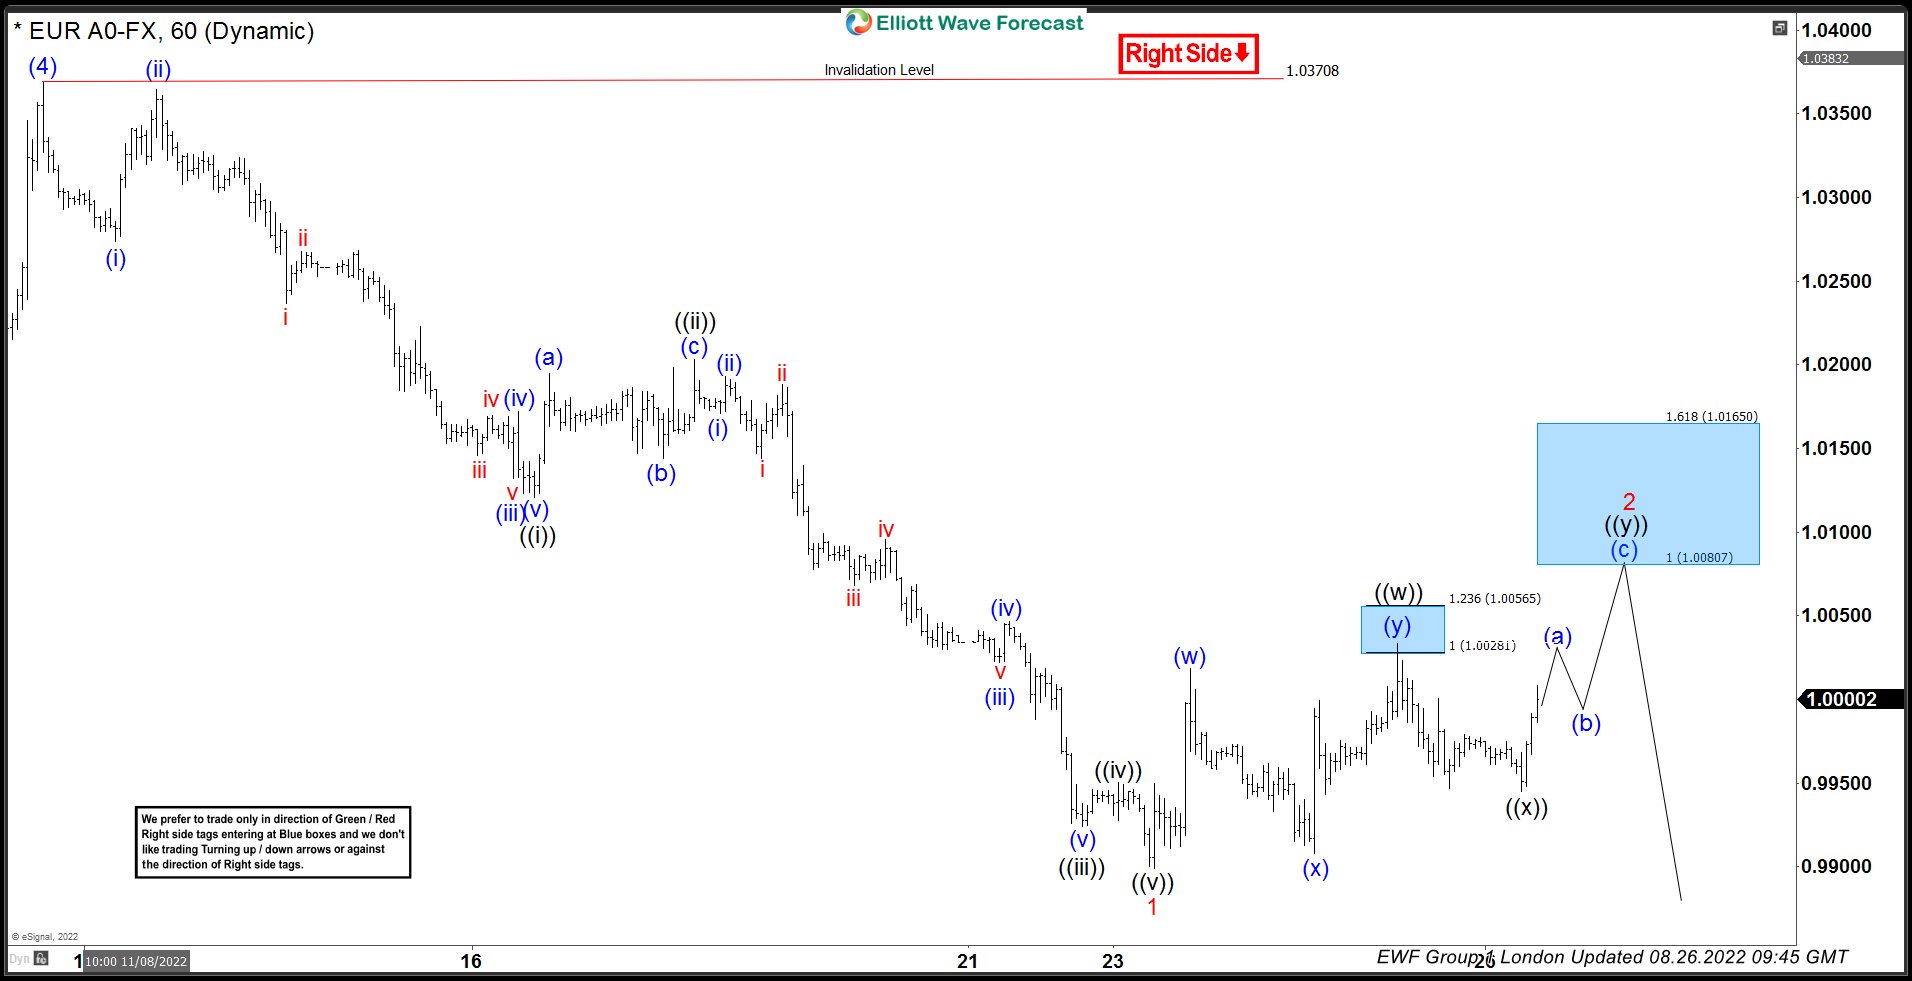
Here’s 1hr Elliott wave Chart from the 8/26/2022 London update. In which, the decline to $0.9898 low ended 5 waves from 08/10/2022 high in wave 1 & made a bounce in wave 2. The internals of that bounce unfolded as an Elliott wave double correction where wave ((w)) ended at $1.0033 high. Then a pullback to $0.9945 low ended wave ((x)) pullback and started the ((y)) leg higher towards $1.0080- $1.0165 blue box area from where sellers were expected to appear looking for more downside or for a 3 wave reaction lower at least.
EURUSD Latest 1hr Elliott Wave Chart
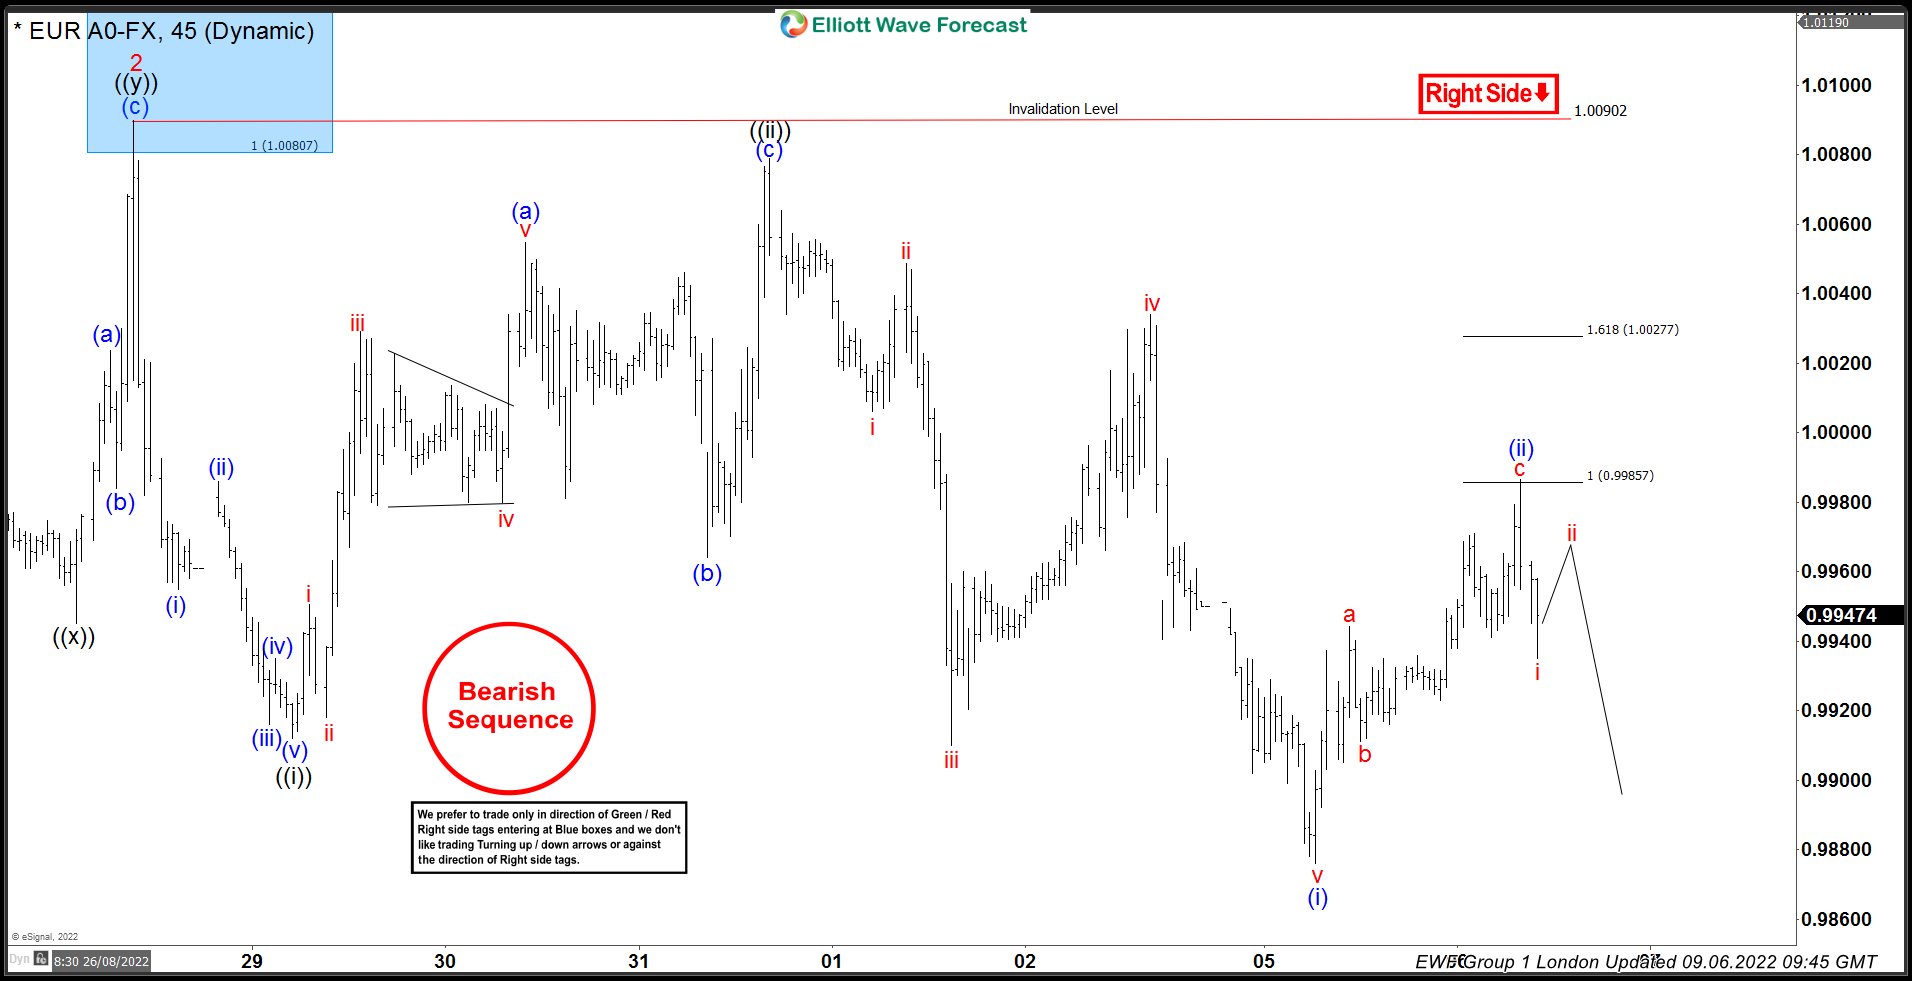
This is the latest 1hr view from the 9/06/2022 London update. In which the pair is showing a reaction lower taking place from the blue box area allowing shorts to get into a risk-free position shortly after taking the position. So far the pair has already made a new low below the 8/23/2022 low confirming the next extension lower to take place. As far as short-term bounces fail below $1.0090 high.
Pound Up as Construction Data Beats Estimate
The British pound is in positive territory today. In the North American session, GBP/USD is trading at 1.1535, up 0.13%.
UK Construction PMI remains in contraction mode
The UK PMIs releases for August are reflecting weak conditions across the economy. Last week, Manufacturing PMI came in below the 50.0 neutral level, indicating contraction. Services PMI managed to stay in expansion territory, but just barely with a reading of 50.9. Today’s Construction PMI improved to 49.2 (vs. 48.9 in July), above the consensus of 48.0. The stronger-than-expected release has given the pound a slight boost but will be of concern to investors since it marks a second straight contraction in construction.
Incoming Prime Minister Liz Truss will have more than just soft PMIs to worry about. Inflation rose to 10.1% in July, as the cost-of-living crisis remains a priority for the government. Energy bills are expected to skyrocket next month, and the government may freeze the increase, but the cost would be astronomical, possibly as high as 130 billion pounds. Inflation is being felt throughout the economy and Truss will be hard-pressed to provide relief everywhere it’s needed.
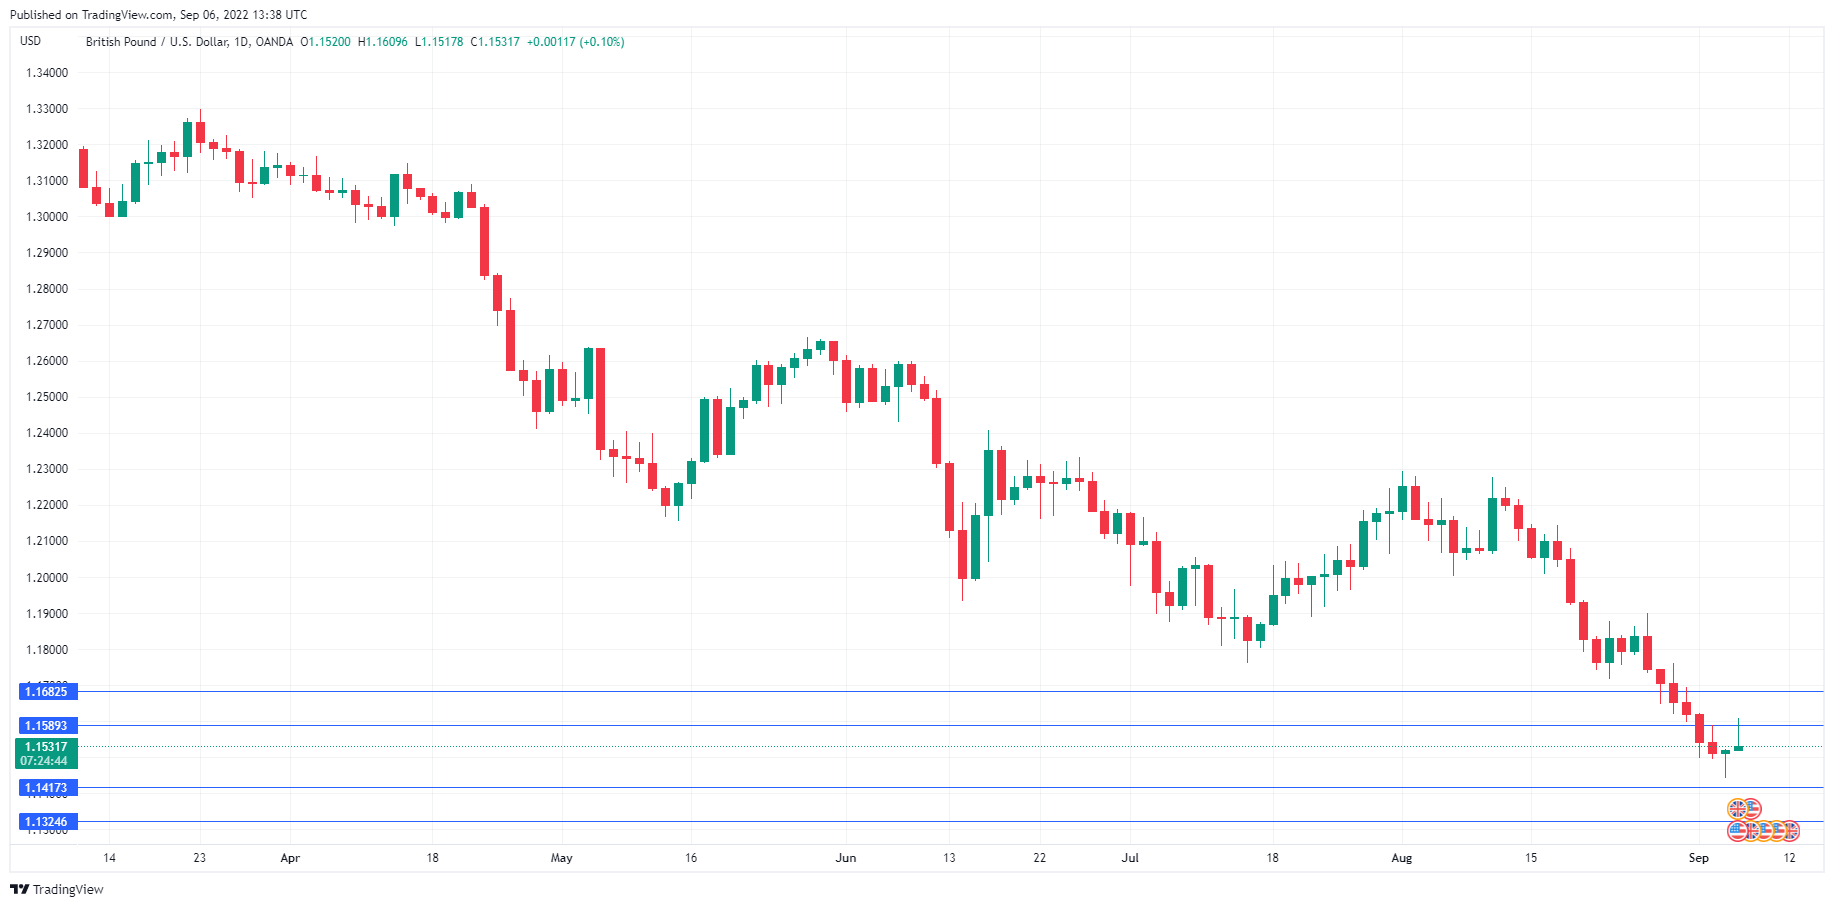
The deteriorating outlook for the UK economy is taking its toll on the British pound, as investors don’t like the country’s economic outlook. GBP/USD fell as low as 1.1443 on Monday, its lowest level since 1985. The pound has more room to fall, as the energy situation in Europe remains grim and the Fed plans to remain aggressive in its fight against inflation. Truss has pledged to cut taxes in order to give the economy a lift, but this could result in inflation rising higher. I don’t envy Truss, who will have to quickly show some improvement in the economy in order to gain the confidence of the markets and the public in order to stay in office.
GBP/USD Technical
- GBP/USD has support at 1.1417 and 1.1324
- There is resistance at 1.1589 and 1.1682
How Much Will the ECB Hike?
We can expect quite a bit of volatility on Thursday, when the ECB will make its rate decision. Surveyed economists are almost evenly split on whether there will be a 50bps or a 75bps hike. The market has priced in around 68bps, implying a favoritism towards the tighter policy. However, it's still possible to get a bounce in the currency, since the move isn't fully priced in.
Though part of the expectations could be influenced by an unusually large amount of debt issuance by Eurozone countries this week. Italy, Austria and Germany are all issuing bonds before the ECB meeting, which could put upward pressure on yields, and obscure how the market is really feeling about what will happen with the rate decision.
Putting the pieces together
There are good fundamental arguments for both positions, as might be expected. On the one hand, EU inflation is likely to keep rising after Russia cut off supply of gas through Nord Stream 1. Tighter policy might be justified in an attempt to prevent higher energy costs from spreading through the economy. On the other hand, that very possibility of higher energy costs could justify keeping rates on hold. Higher energy costs would contribute to a recession, thus lower prices, and less need for the ECB to take as aggressive attitude.
However, the reality is inflation isn't on the "supply side" (that is, because of increased funds) as much as it is due to factors outside the ECB's control. The ECB doesn't control the price of energy, nor the flow of gas from Russia, nor the shutdown of factories because of higher energy and transportation costs. The ECB has one tool, and just because it might not be the most appropriate for the situation, it doesn't mean they won't use it, anyway.
The market reaction
There is wide expectation that the Fed will also hike rates by 75bps. Meaning that if the ECB goes for only 50bps, the gap between the Euro and the dollar will once again widen. That would put downward pressure on the EURUSD. On the other hand, a 75bps hike would simply maintain the gap, which could help the EURUSD, but would have less buoyancy.
The other factor to keep in mind is that ECB staff projections are announced at the same time. This could have a bigger impact on the currency, since forward expectations of rate hikes weigh more on institutional investors. Lately, there have been several ECB members emphasizing that they will push for tighter policy. Some have gone so far as to suggest that rates could go above the "neutral rate" in order to tamp down inflation. That would imply at least another 175bps of hikes over the next four meetings.
The future is what matters
Those aggressive stances might be tempered if the staff forecasts cut the outlook for the shared economy's growth for this year and next. The last projections showed that the bank expected 2.1% growth for this year, and is likely to be revised downward. Inflation was also projected to be at 2% for next year, something that is likely to be revised upwards.
EUR/USD Mid-Day Outlook
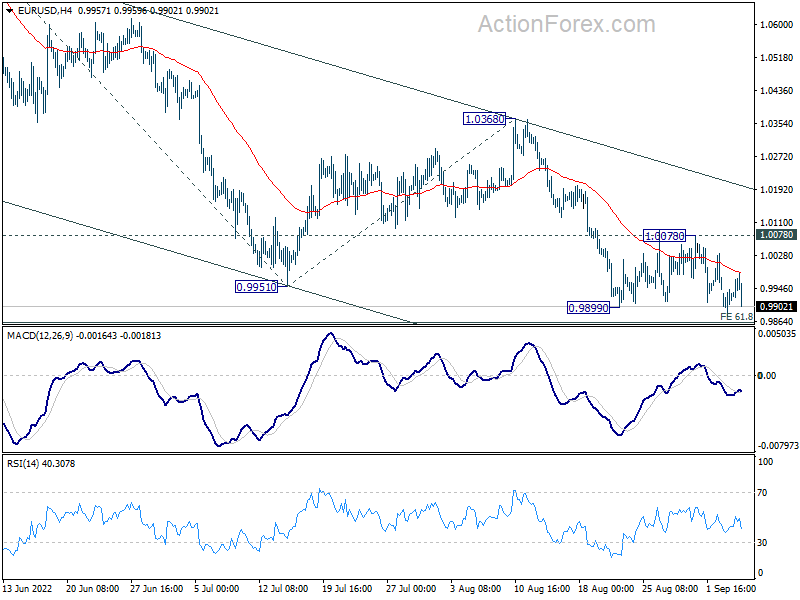
Daily Pivots: (S1) 0.9892; (P) 0.9918; (R1) 0.9958; More...
No change in EUR/USD's outlook and further decline is expected with 1.0078 resistance intact. Decisive break of 61.8% projection of 1.0773 to 0.9951 from 1.0368 at 0.9860 should prompt downside acceleration to 100% projection at 0.9546. On the upside, however, firm break of 1.0078 will indicate short term bottoming, and turn bias back to the upside for 1.0368 resistance instead.
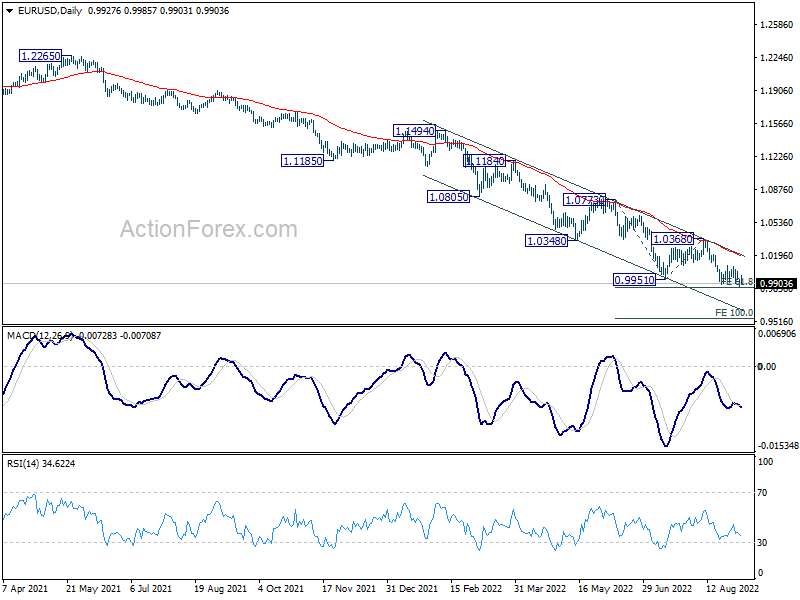
In the bigger picture, down trend from 1.6039 (2008 high) is still in progress. Next target is 100% projection of 1.3993 to 1.0339 from 1.2348 at 0.8694. In any case, outlook will stay bearish as long as 1.0368 resistance holds, even in case of strong rebound.
GBP/USD Mid-Day Outlook
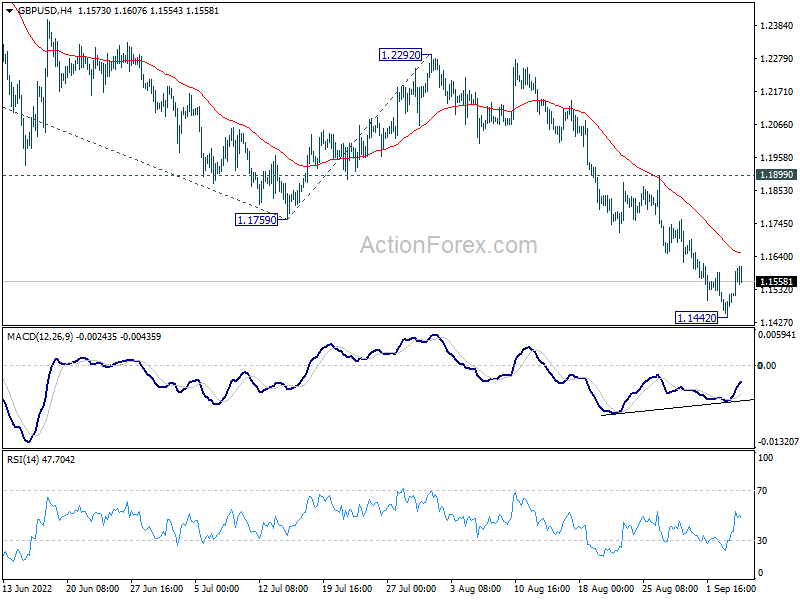
Daily Pivots: (S1) 1.1469; (P) 1.1495; (R1) 1.1547; More...
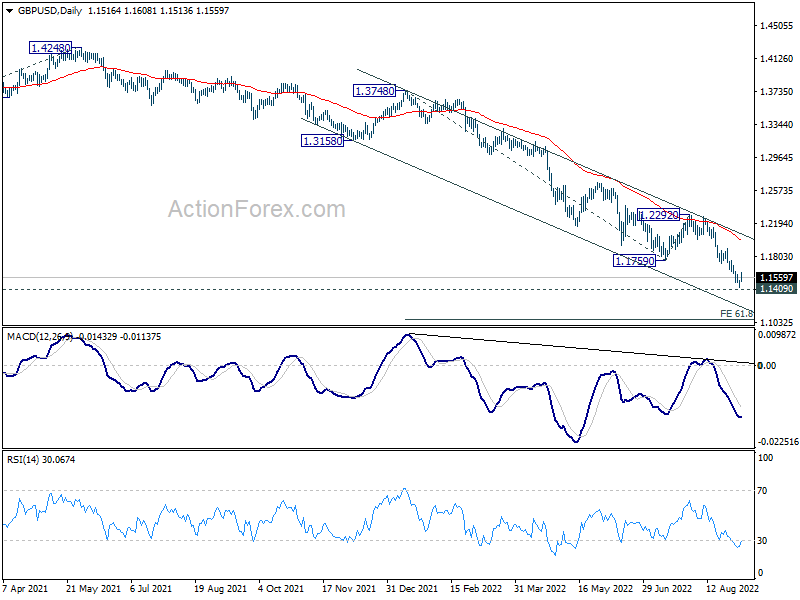
GBP/USD is staying in consolidation above 1.1442 temporary low and intraday bias remains neutral. Upside of recovery should be limited by 1.1899 resistance to bring another decline. On the downside, break of 1.1442 will resume larger down trend for 1.1409 long term support. Firm break there will pave the way to 61.8% projection of 1.3748 to 1.1759 from 1.2292 at 1.1063 next.
In the bigger picture, based on current momentum, fall from 1.4248 (2018 high) is probably resuming long term down trend from 2.1161 (2007 high). Sustained break of 1.1409 will target 61.8% projection of 1.7190 (2014 high) to 1.1409 (2020 low) from 1.4248 (2021 high) at 1.0675. This will remain the favored case for now as long as 1.2292 resistance holds.
USD/CHF Mid-Day Outlook
Daily Pivots: (S1) 0.9781; (P) 0.9809; (R1) 0.9824; More...
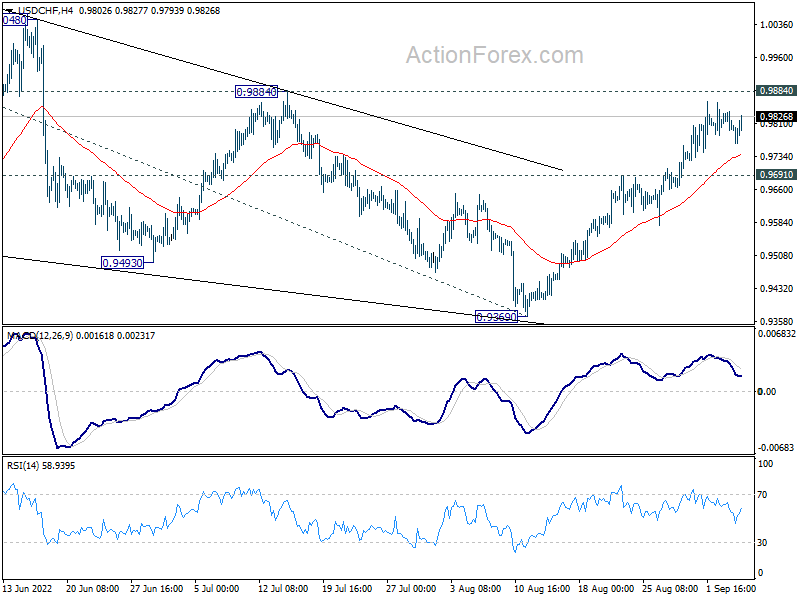
Intraday bias in USD/CHF remains neutral for the moment. Further rise is expected with 0.9691 support intact. On the upside, break of 0.9884 resistance will argue that larger up trend is ready to resume through 1.0063 high. On the downside, however, break of 0.9691 minor support will dampen this view and turn bias back to the downside for 0.9469 support instead.
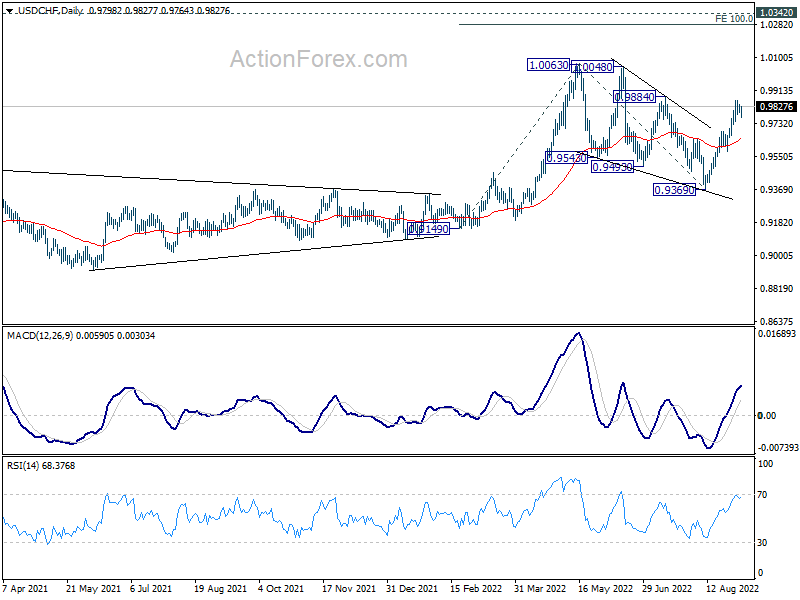
In the bigger picture, current development suggests that up trend from 0.8756 (2021 low) is still in progress. Sustained break of 1.0063 will target 100% projection of 0.9149 to 1.0063 from 0.9369 at 1.0283, and then 1.0342 (2016 high). For now, this will remain the favored case as long as 0.9369 support holds, even in case of deep pull back.
USD/JPY Mid-Day Outlook
Daily Pivots: (S1) 140.25; (P) 140.45; (R1) 140.79; More...
USD/JPY's up trend continues today and hit as high as 142.00 so far. Intraday bias remains on the upside for 100% projection of 126.35 to 139.37 from 130.38 at 143.40. Sustained break there could bring upside acceleration of 147.68 long term resistance. On the downside, below 140.24 minor support will turn intraday bias neutral and bring consolidations first, before staging another rally.
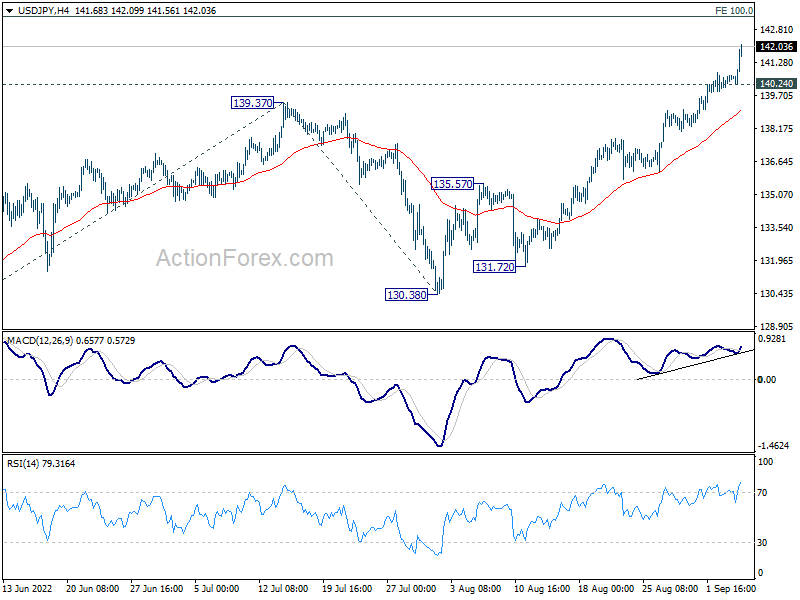
In the bigger picture, up trend from 101.18 is still in progress, as part of the whole up trend from 75.56 (2011 low). Further rise should be seen to 147.68 (1998 high). For now, break of 130.38 support is needed to be the first indication of medium term topping. Otherwise, outlook will stay bullish even in case of deep pull back.