

Sample Category Title
Japan officials concerned by one-sided move in Yen, warned of necessary action
As Yen tumbles further to fresh 24-year low against Dollar, Japan Finance Minister Shunichi Suzuki cautioned that "recent moves are rather rapid and one-sided . We need to be watching developments with strong interest."
Chief Cabinet Secretary Hirokazu Matsuno said at a news briefing, "I'm concerned about rapid, one-sided moves in the currency market recently. If such moves continue, we will take necessary action."
First Impressions: Australian Q2 GDP
Output expanded by 0.9% in the June quarter, meeting market expectations. Consumer spending was a bright spot, up 2.2% (albeit falling short of our expectations). Exports also performed well. However, elsewhere conditions were mixed.
The Australian economy expanded by 0.9% in the June quarter.
That met market expectations, market median 0.9% and Westpac 1.1%.
Annual growth is 3.6%. The level of activity is 5.5% above levels prior to the pandemic, at the end of 2019.
Consumer spending was a bright spot in the quarter (albeit not quite as strong as we anticipated), so too were exports. Elsewhere, conditions were mixed – construction work was down, public demand was flat (representing a consolidation) and inventories were a sizeable drag.
GDP, three measures: the GDP headline is an average of three measures: expenditure, income and production. GDP (E) printed at 0.8% qtr, GDP (I) 0.8% and GDP (P) was 1.1%.
Hours worked: The National Accounts estimate that hours worked expanded by 2.9% - a strong result, but well below the brisk 4.6% reported in the Labour Force Survey.
State demand: NSW led the way, with state final demand expanding by 1.9%. WA consolidated, at only +0.1%, while Victoria and Qld grew at 1.0%, in line with the national figure for domestic demand.
Key surprises: A key upside surprise was consumer spending – a gain of 2.2%, falling short of our expected 2.8%.
Note that the 2.2% gain matches that in Q1 (revised up from 1.5% previously) a period impacted by the omicron wave and wet weather / flooding.
The easing of restrictions and reopening of external borders saw another strong rise in services spend, albeit not quite as strong as anticipated.
The ABS report that, spending on services increased 3.6%, exceeding pre-pandemic levels for the first time. The easing of travel restrictions accelerated spending on transport and other related services. Hotels, cafes and restaurants (+8.8%), transport services (+37.3%) and recreation and culture (+3.6%) all contributed to the rise.
Spending on goods decreased 0.1%, as heightened demand during the onset of the pandemic began to stabilise.
Around incomes, disposable incomes rose 1%qtr, in line with expectations, supported by a solid rise in wage incomes.
The mix saw the household savings ratio decline from 11.1% to 8.7% - a slightly smaller decline than we had pencilled in.
Expenditure detail:
Home building activity declined, down by 2.9% (somewhat less than the partials suggested), impacted by wet weather and supply headwinds (shortages of labour and materials), as well the cost pressures faced by builders.
Business investment increased by 0.6% (as expected), with a decline in construction (infrastructure -3.9% and non-residential building -0.3%) partially offsetting a rise in equipment spending, +3.9%.
Public demand was flat in the quarter, consolidating after a well above par result in Q1 (inflated by a spike in covid vaccine supplies).
Net exports made a sizeable positive contribution to growth, +1.0ppt, albeit only a partial offset to the drag over the past year. Exports, which have struggled during the pandemic, had a strong quarter, +5.5%, while imports consolidated, +0.7%, after a surge in Q1.
Total inventories subtracted -1.2ppts from activity, centred on private business non-farm inventories at -1.1ppts.
Technical Outlook and Review
USD/JPY:
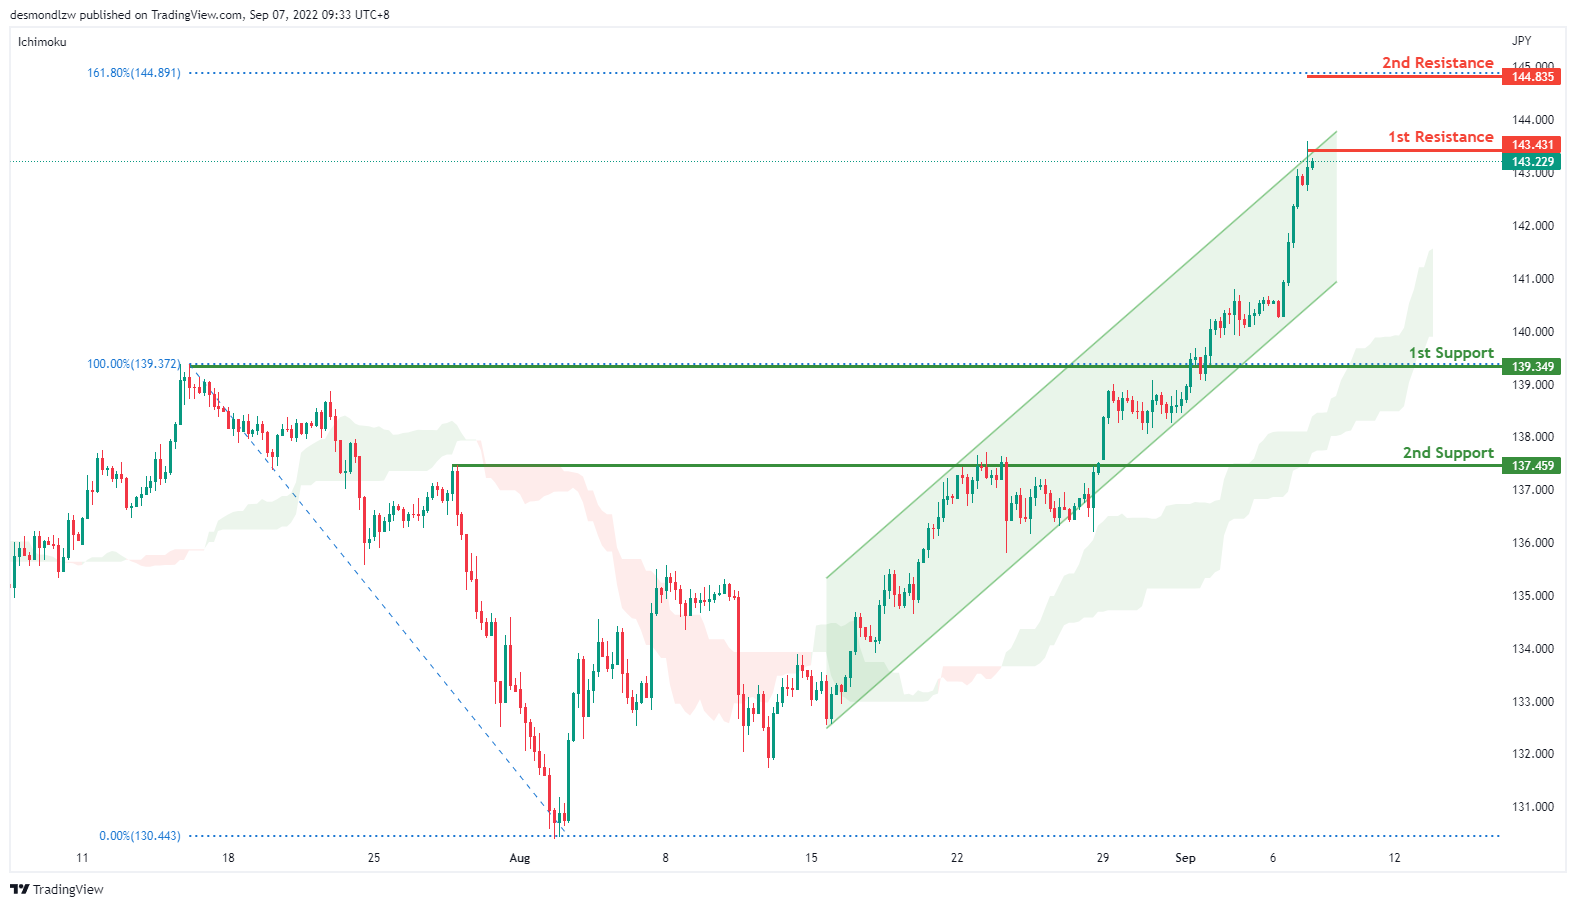
On the H4 chart, price has confirmed a bullish momentum breaking the previous high. We are bullish bias- Price is testing at the first resistance 143.431, if bullish momentum continues it should bring price to the second resistance at 144.815 where the 161.8% fibonacci extension sits. Alternatively, if price reverses, it might pull back to test the first support at 139.349 where the previous swing high sits then the second support at 138.459
Areas of consideration:
- H4 time frame, 1st resistance at 143.431
- H4 time frame, 1st support at 139.349
DXY:
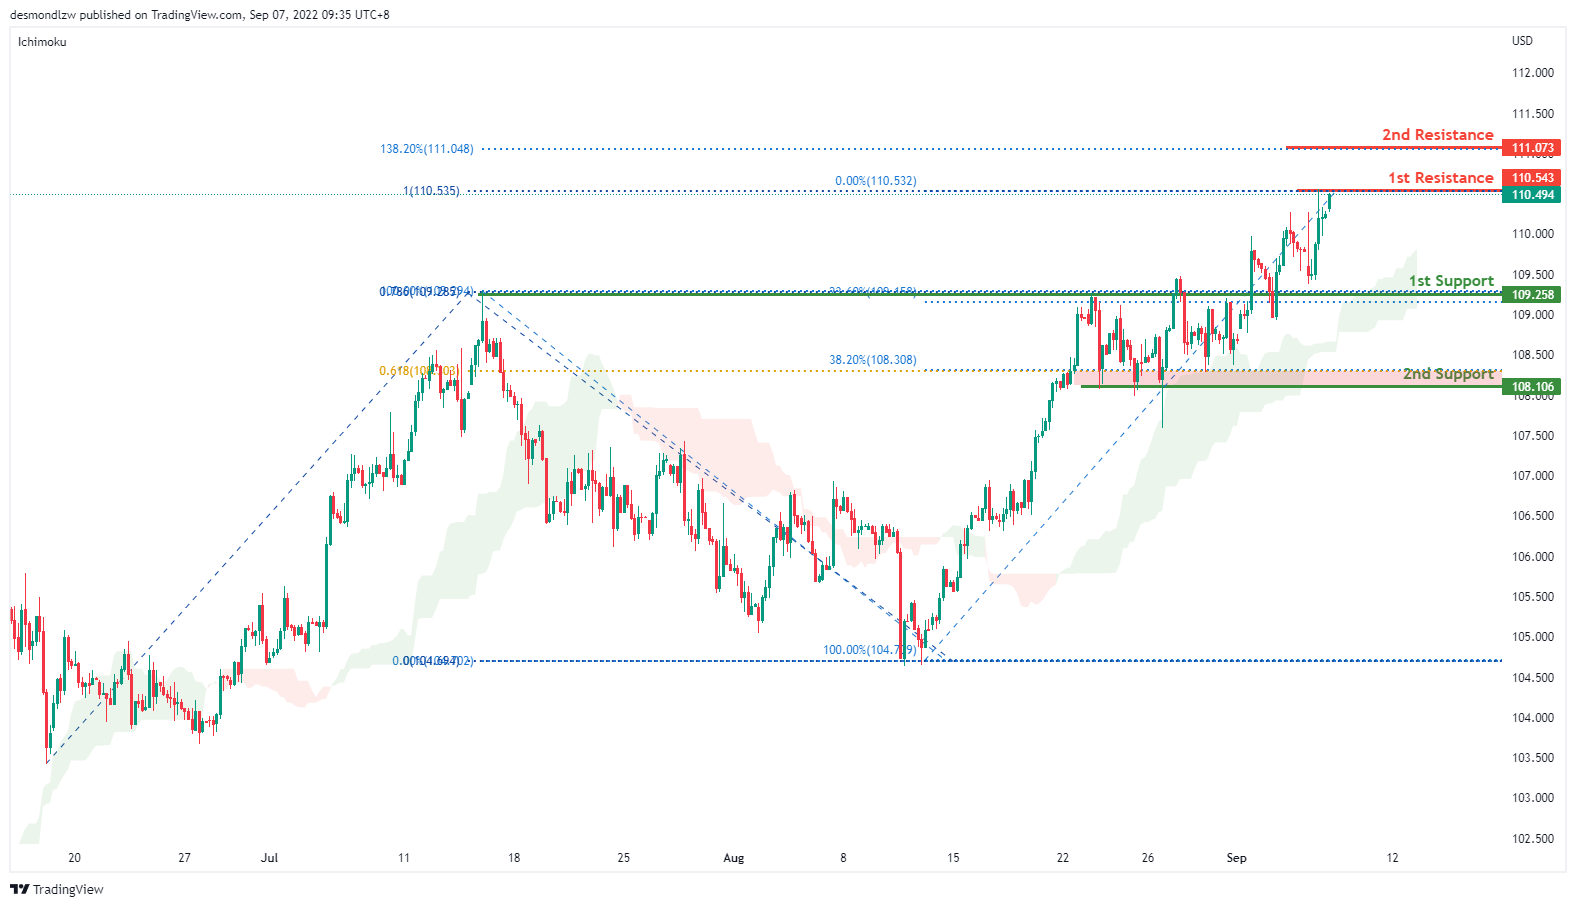
On the H4, price seems to be ranging but it is still moving in an ascending trend and is in a bullish momentum. Price is testing at the first resistance 110.543 levels but if bullish momentum continues, it should bring price up to 111.073 where the 138.2% fibonacci extension sits. Alternatively, price might pull back to test the first support at 109.258 where the 23.6% retracement and previous swing high sits and subsequently the second support at 108.106 where the 38.2% retracement sits
Areas of consideration:
- H4 time frame, 1st resistance at 110.543
- H4 time frame, 1st support at 109.258
EUR/USD:
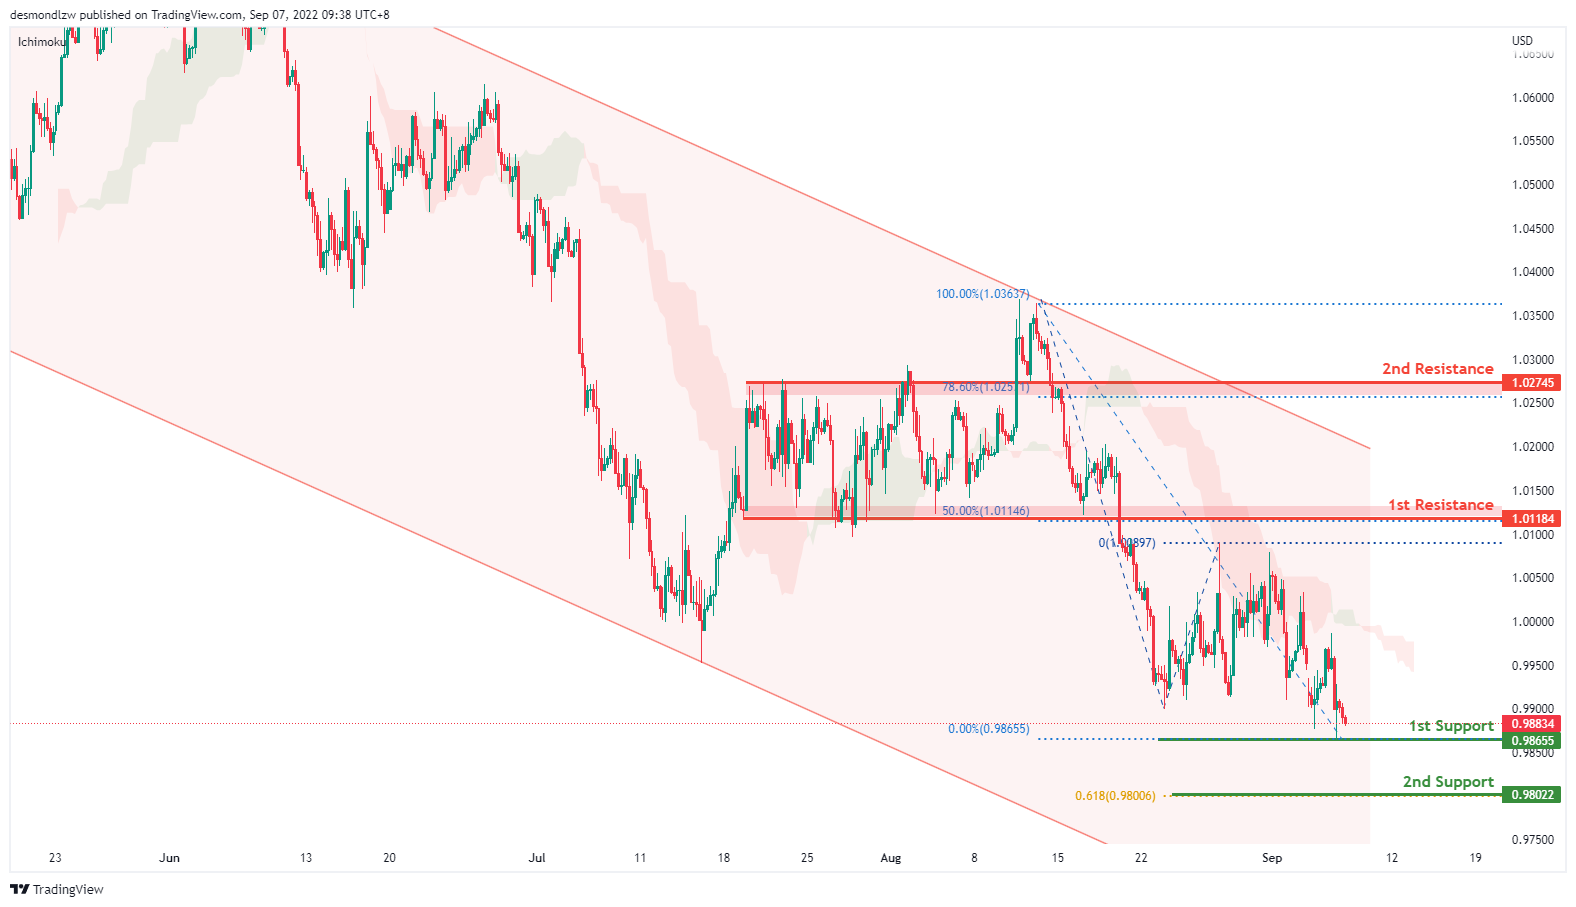
On the H4, price has broken the range and is moving in a descending trend – we are bearish bias. Price looks like it’s moving toward the first resistance at 0.9865 where the previous swing low sits and subsequently the second resistance at 0.9802 where the 61.8% projection sits. Alternatively if price rebounds, it might test the first resistance at 1.0118 where the 50% retracement sits and then the second resistance at 1.02745 where the 78.6% retracement and swing high sits.
Areas of consideration :
- H4 1st resistance at 1.0118
- H4 1st support at 0.9865
GBP/USD:
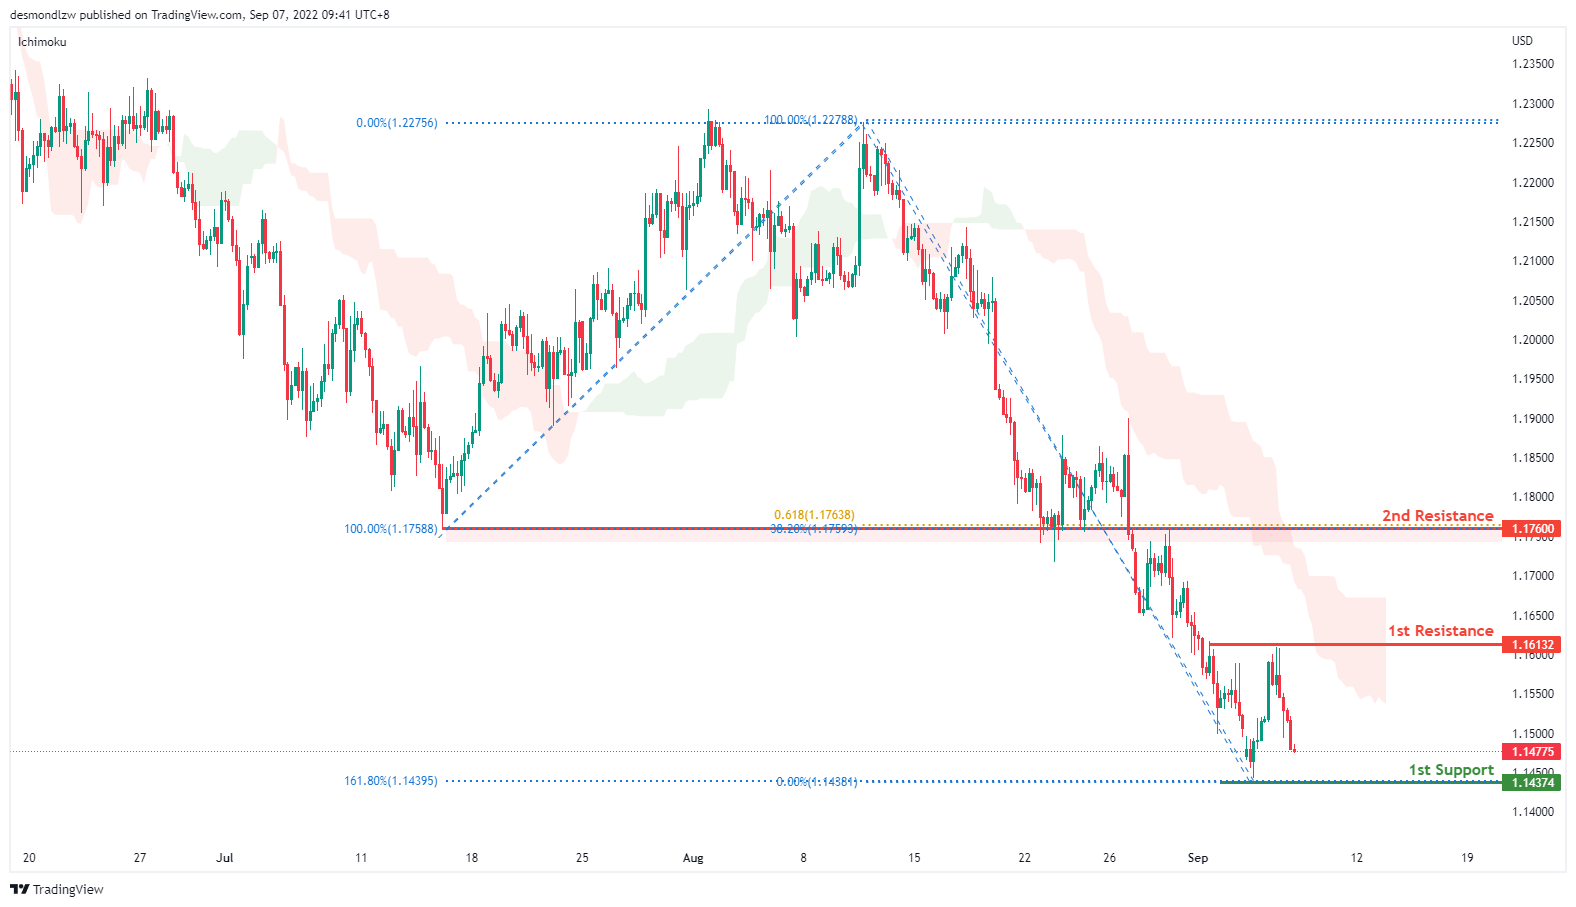
On the H4, prices seem to still be in a bearish momentum and respecting the ichimoku cloud. Prices have rebounded slightly but if bearish momentum continues it should move toward the first support at 1.1437 levels where the 161.8% extension sits. Alternatively, if it fails to break this level, it might look to test the first resistance at 1.1613 where the previous swing high sits subsequently the second resistance at 1.1760 level where the 61.8% projection and 38.2% retracement sits
Areas of consideration:
- H4 1st resistance at 1.163
- H4 1st support at 1.1437
USD/CHF:
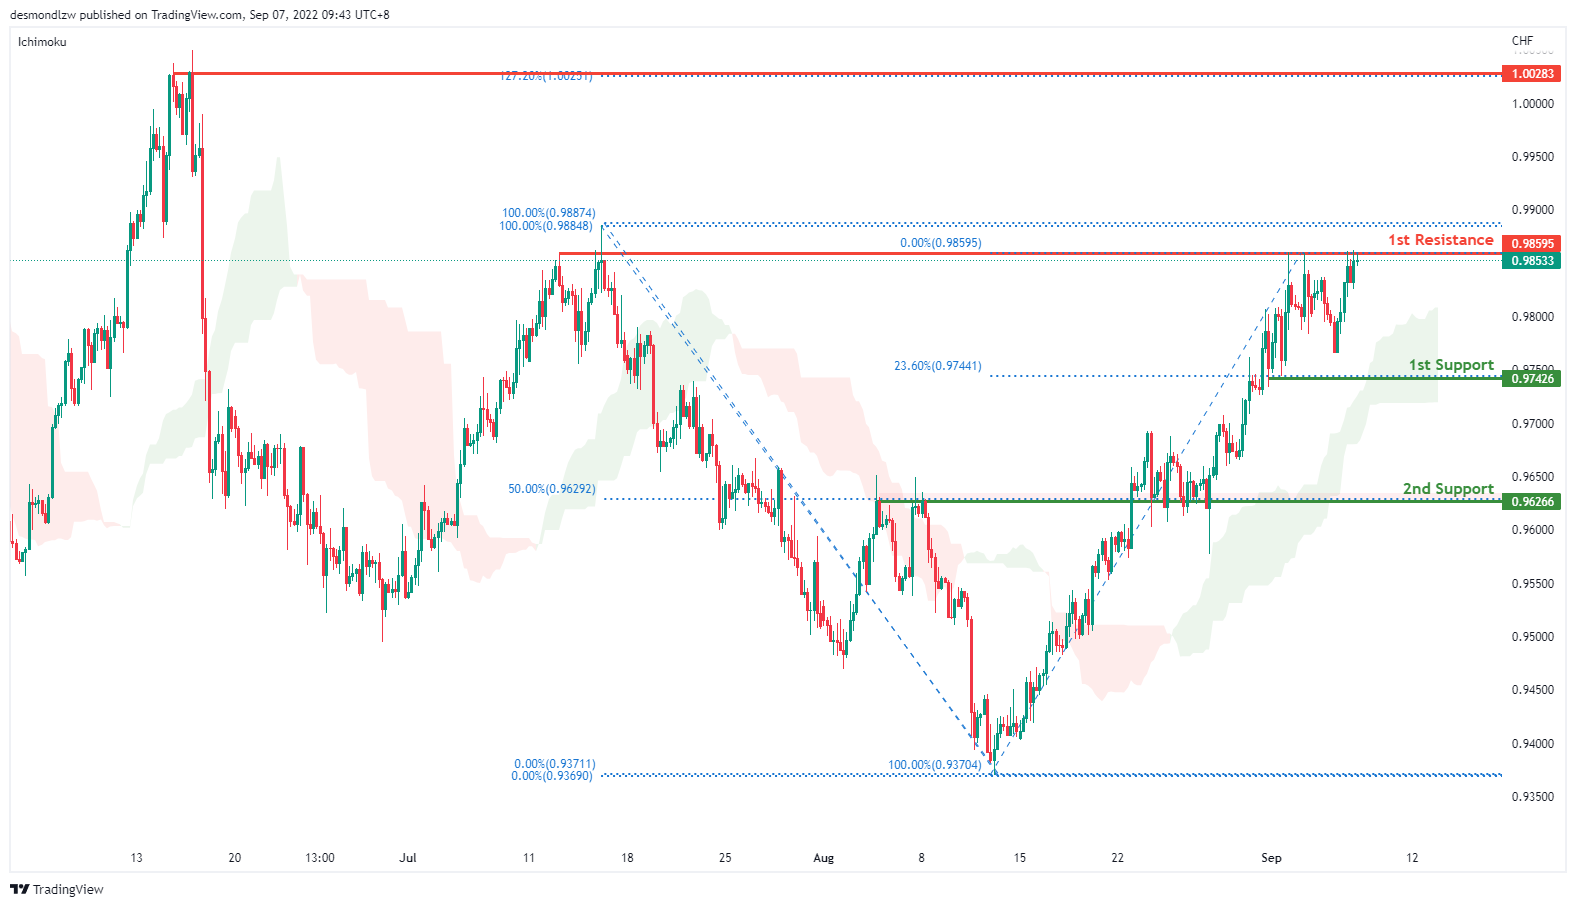
On the H4, with prices moving above the ichimoku cloud and breaking the descending trend, we are bullish. Price is testing the first resistance at 0.9859 where the previous swing high sits. If price do not break the first resistance, it could pull back to test the first support around the 0.9742 levels where the 23.6% retracement and swing low sits, subsequently the second support at 0.9626 where the 50% fibonacci retracement,78.6% projection and previous swing low sits
Areas of consideration
- H4 1st support at 0.9742
- H4 1st resistance at 0.9853
XAU/USD (GOLD):
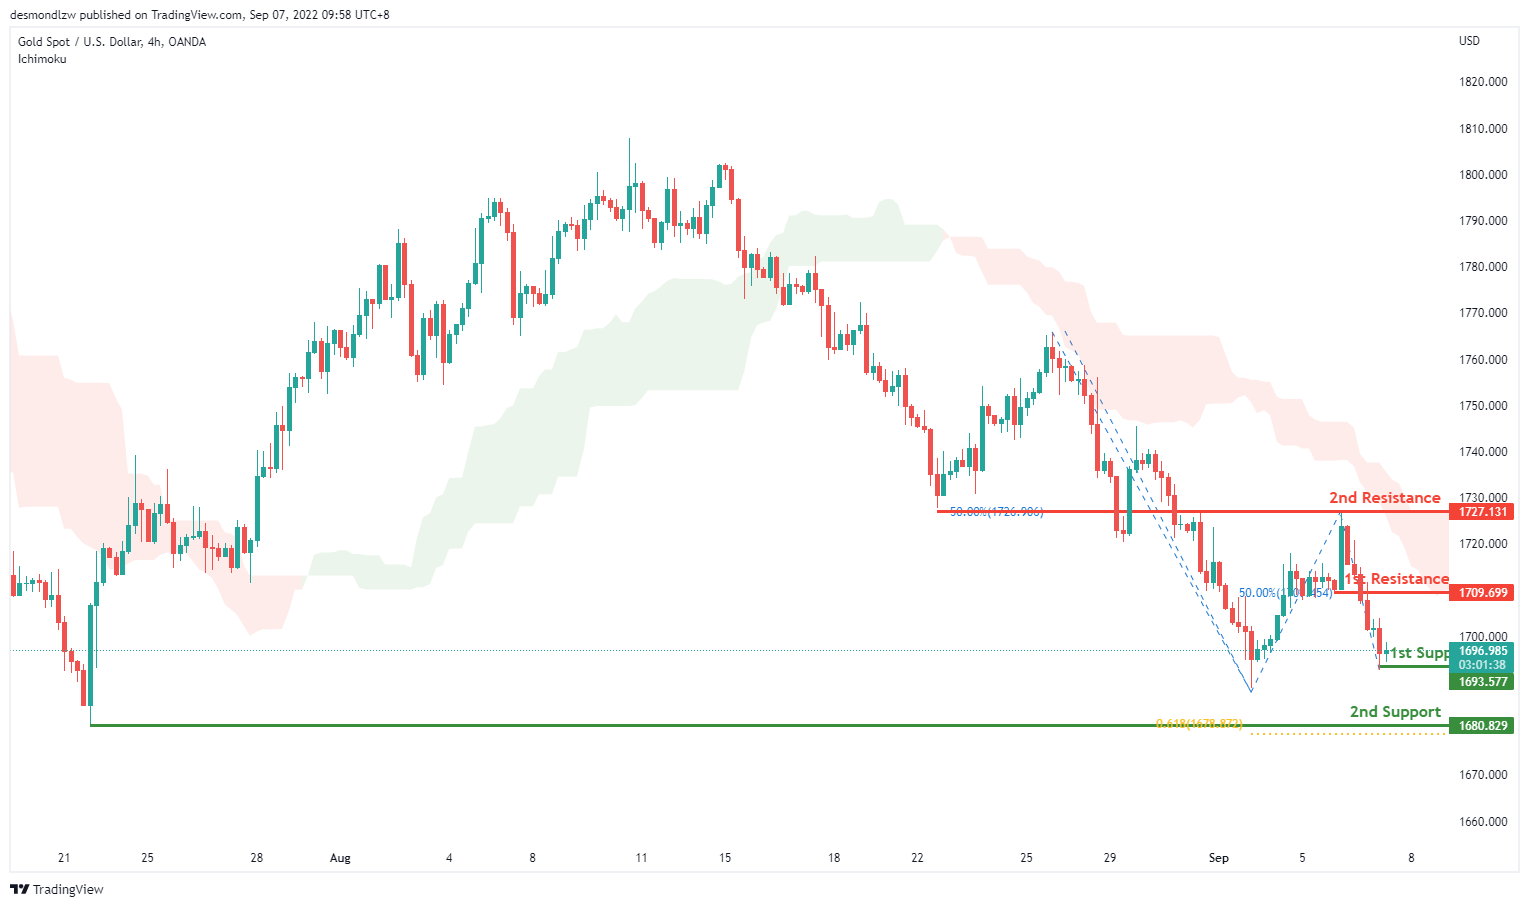
On the H4, with prices below ichimoku cloud, we have a bearish bias that the price may drop to the 1st support at 1693.577, where the swing low is. If the price can break this support line, the next support level could be at 1680.829, where the significant swing low and 61.8% fibonacci projection are. Alternatively, the price may pull back from the 1st support and rise to the 1st resistance at 1709.699, where the 50% fibonacci retracement is. If the price can break the 1st resistance, next resistance could be at 1727.131, where the swing high and 50% fibonacci retracement are.
Areas of consideration:
- H4 time frame, 1st support at 1693.577
- H4 time frame, 2nd support at 1680.829
AUD/USD:
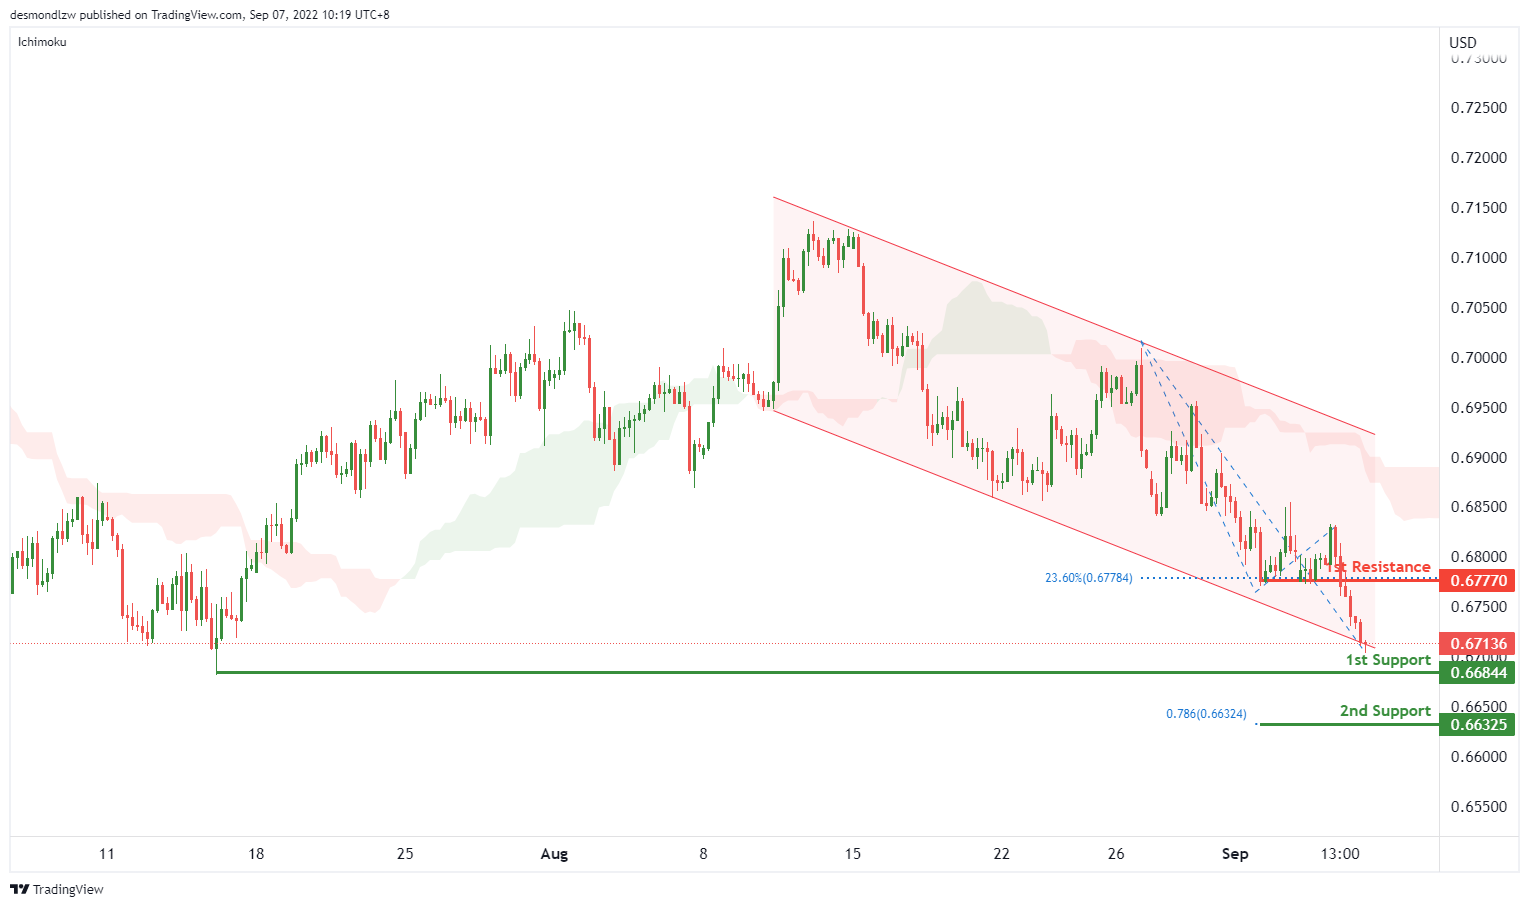
On the H4, with the price moving below the ichimoku cloud and moving within the descending channel, we have a bearish bias that the price may drop from the 1st support at 0.66844, which is in line with the swing low to the 2nd support at 0.66325, where the 78.6% fibonacci projection is. Alternatively, the price may rise to the 1st resistance 0.67770, where the 23.6% fibonacci retracement is.
Areas of consideration
- H4 1st support at 0.66844
- H4 2nd support at 0.66325
NZD/USD:
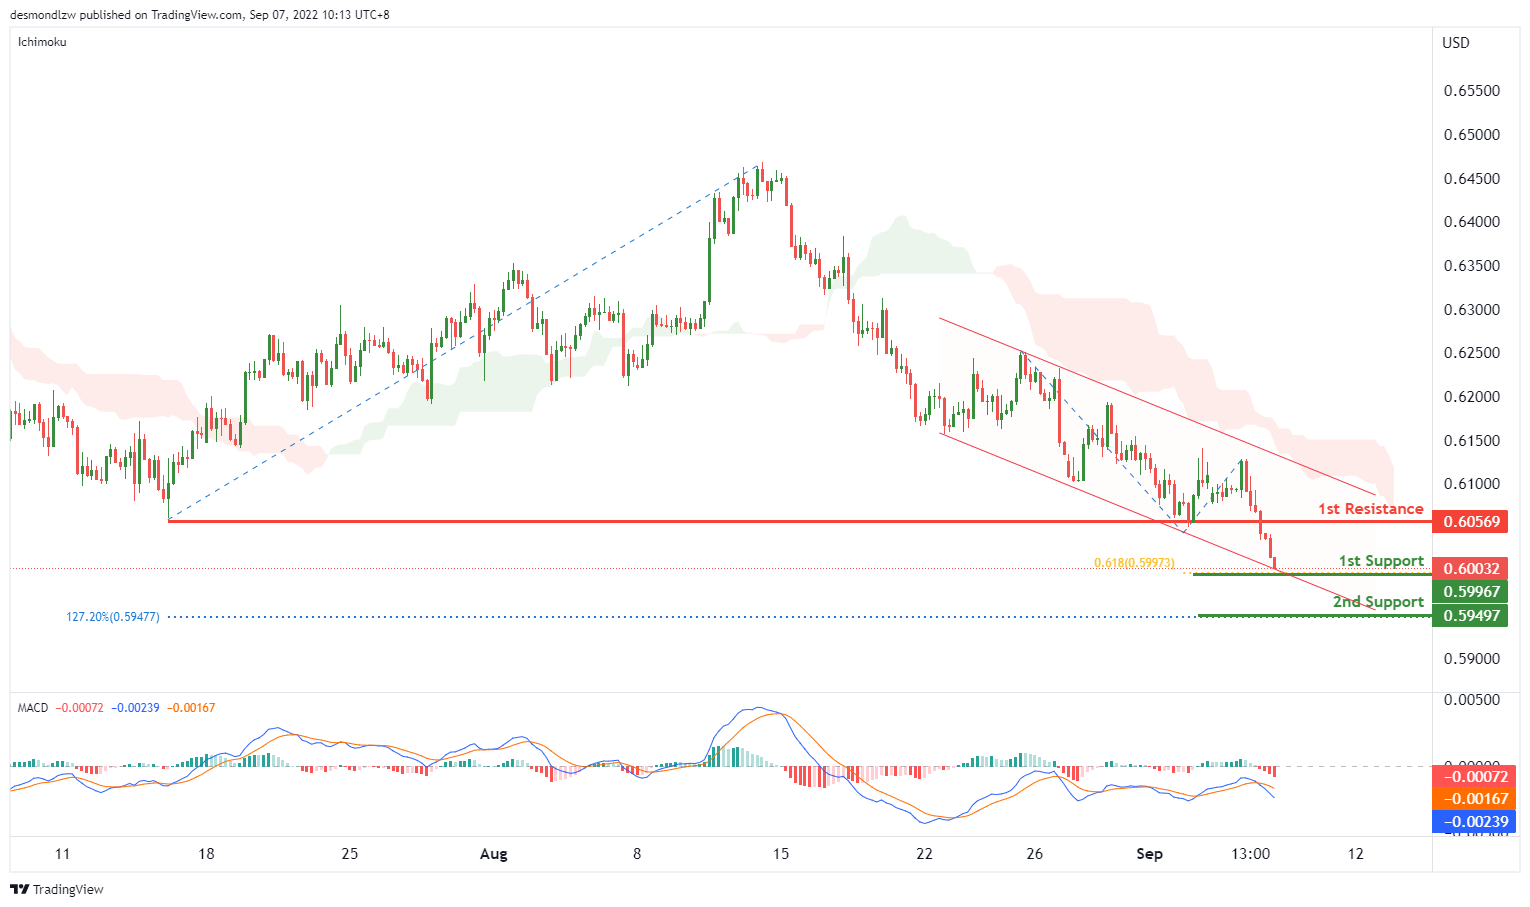
On the H4, with price moving within the descending channel, below ichimoku indicators and MACD showing a death cross, we have a bearish bias that the price may drop from the 1st support at 0.59967, which is in line with the 61.8% fibonacci projection. If the price can break the 1st support, the next support could be at 0.59497, where the 127.2% fibonacci extension is. Alternatively, the price may pull back from the 1st support and rise to the 1st resistance at 0.60569, where the previous swing lows are.
Areas of consideration:
- H4 time frame, 1st support at 0.59967
- H4 time frame, 2nd support at 0.59497
USD/CAD:
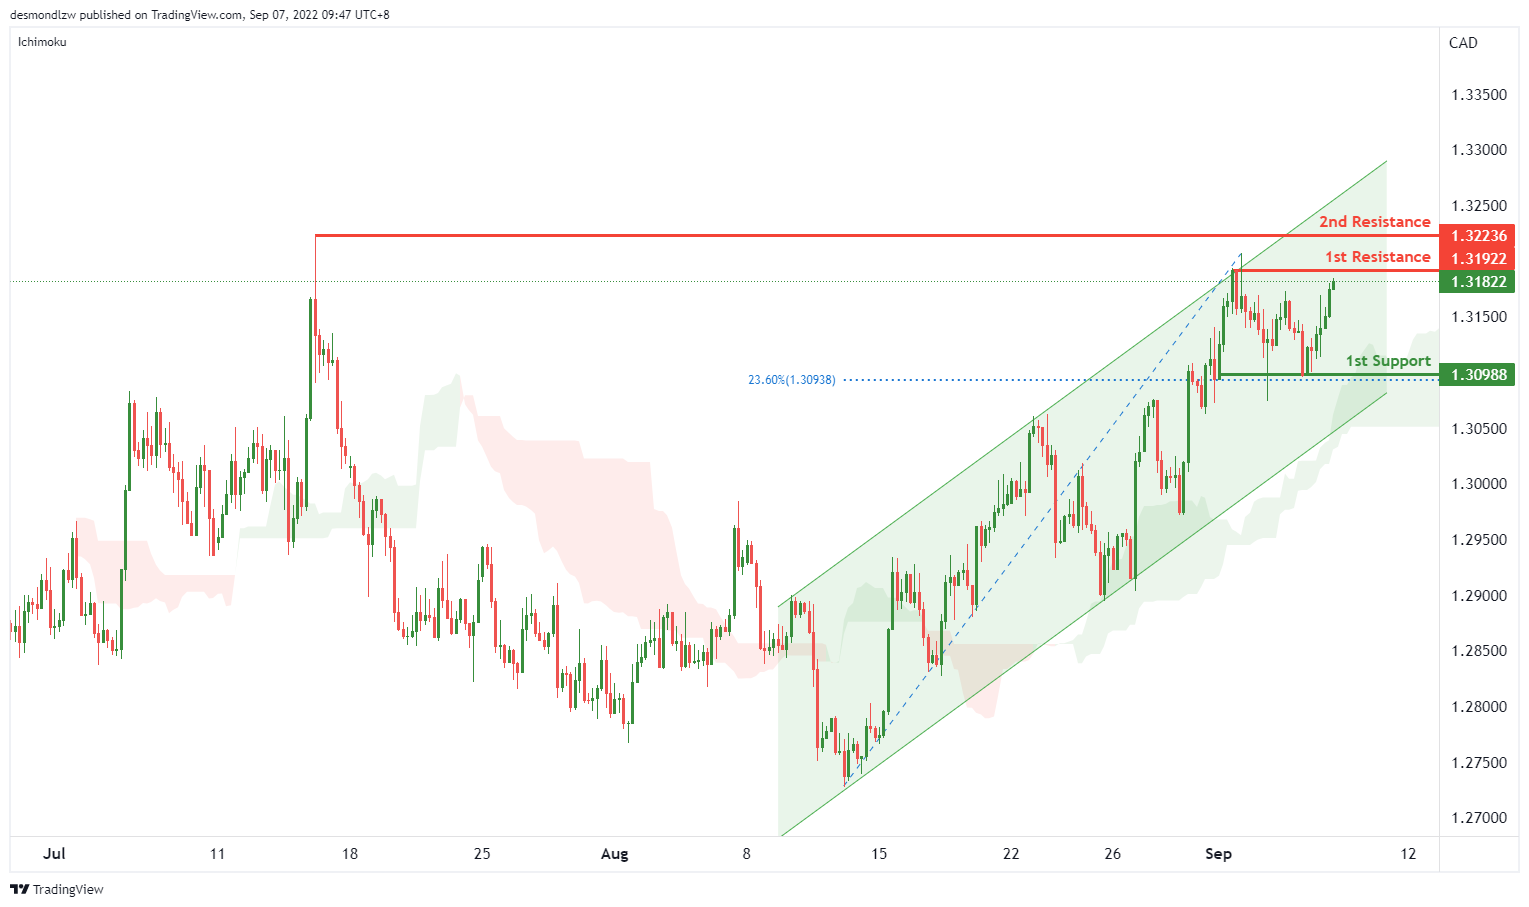
On the H4, with the price moving within the ascending channel, above ichimoku cloud, we have a bullish bias that the price may rise from the 1st resistance at 1.31922, where the swing high is to the 2nd resistance at 1.32236, where the significant swing high is. Alternatively, the price may drop to the 1st support at 1.30988, where the 23.6% fibonacci retracement and previous swing lows are
Areas of consideration:
- H4 time frame, 1st resistance at 1.31922
- H4 time frame, 2nd resistance at 1.32236
OIL:
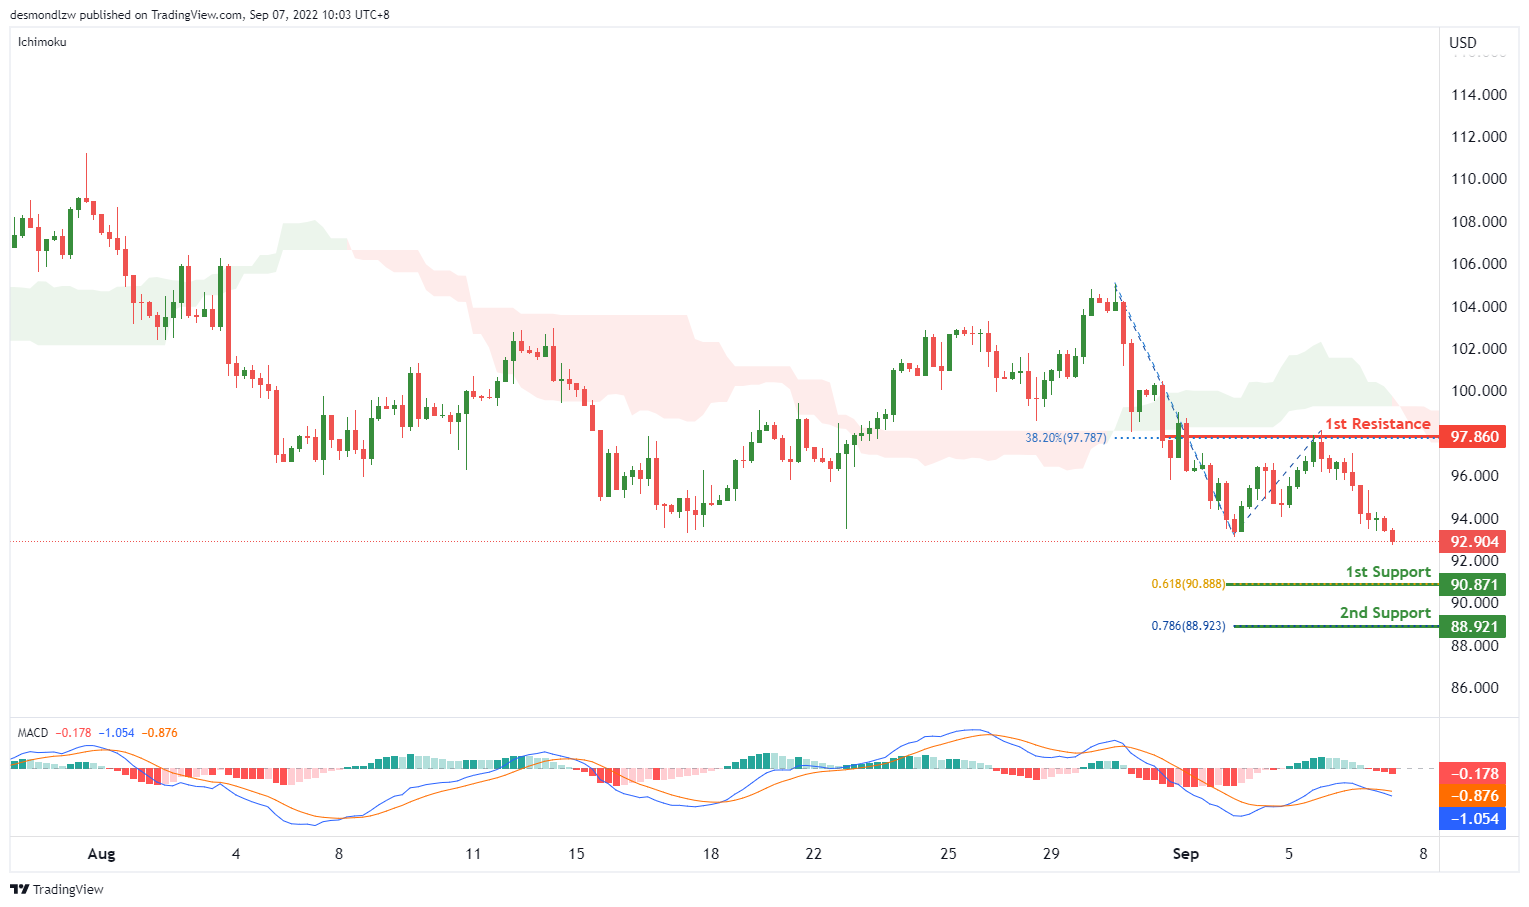
On the H4, with price below ichimoku cloud and MACD showing a death cross, we have a bearish bias that the price may drop to the 1st support at 90.971, where the 61.8% fibonacci retracement is. If the price could break the 1st support, the 2nd support could be at 88.921, where the 78.6% fibonacci retracement is. Alternatively, the price may pull back to the 1st resistance at 97.860, where the 38.2% fibonacci retracement and swing high are.
Areas of consideration:
- H4 time frame, 1st support at 90.971
- H4 time frame, 2nd support at 88.921
Dow Jones Industrial Average:
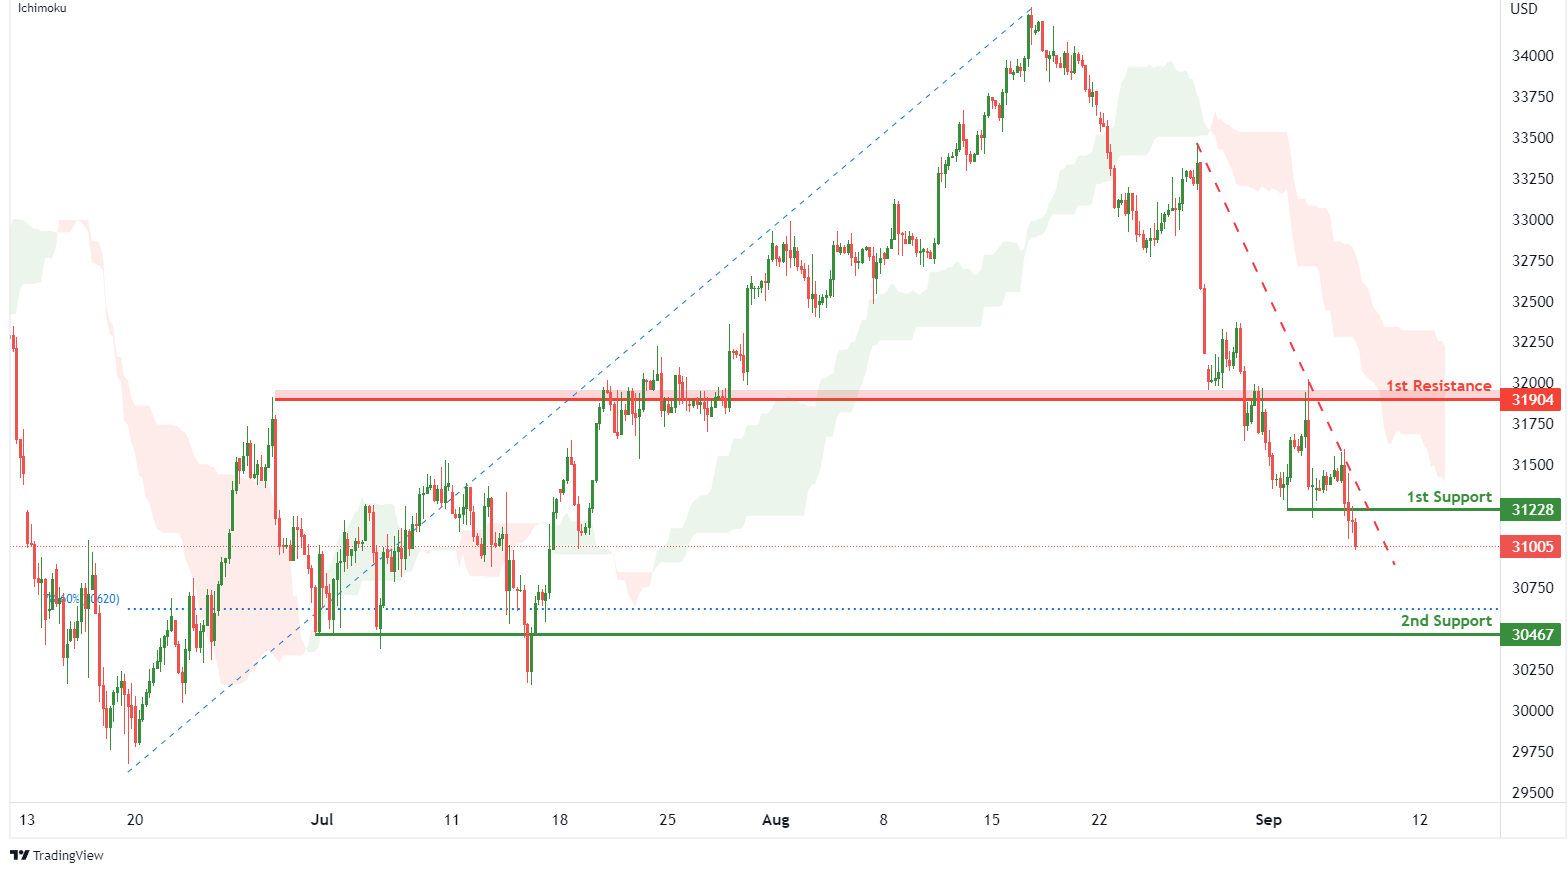
On the H4, with price moving along the descending trendline and below the ichimoku indicator, we have a bearish bias that price will drop from 1st support at 31228 where the pullback support is to the 2nd support at 30467 where the pullback support and 78.6% fibonacci retracement are. Alternatively, price could break 1st support structure and rise to 1st resistance at 31904 where the overlap resistance is.
Areas of consideration:
- H4 time frame, 1st resistance of 31904
- H4 time frame, 1st support at 31228
DAX:
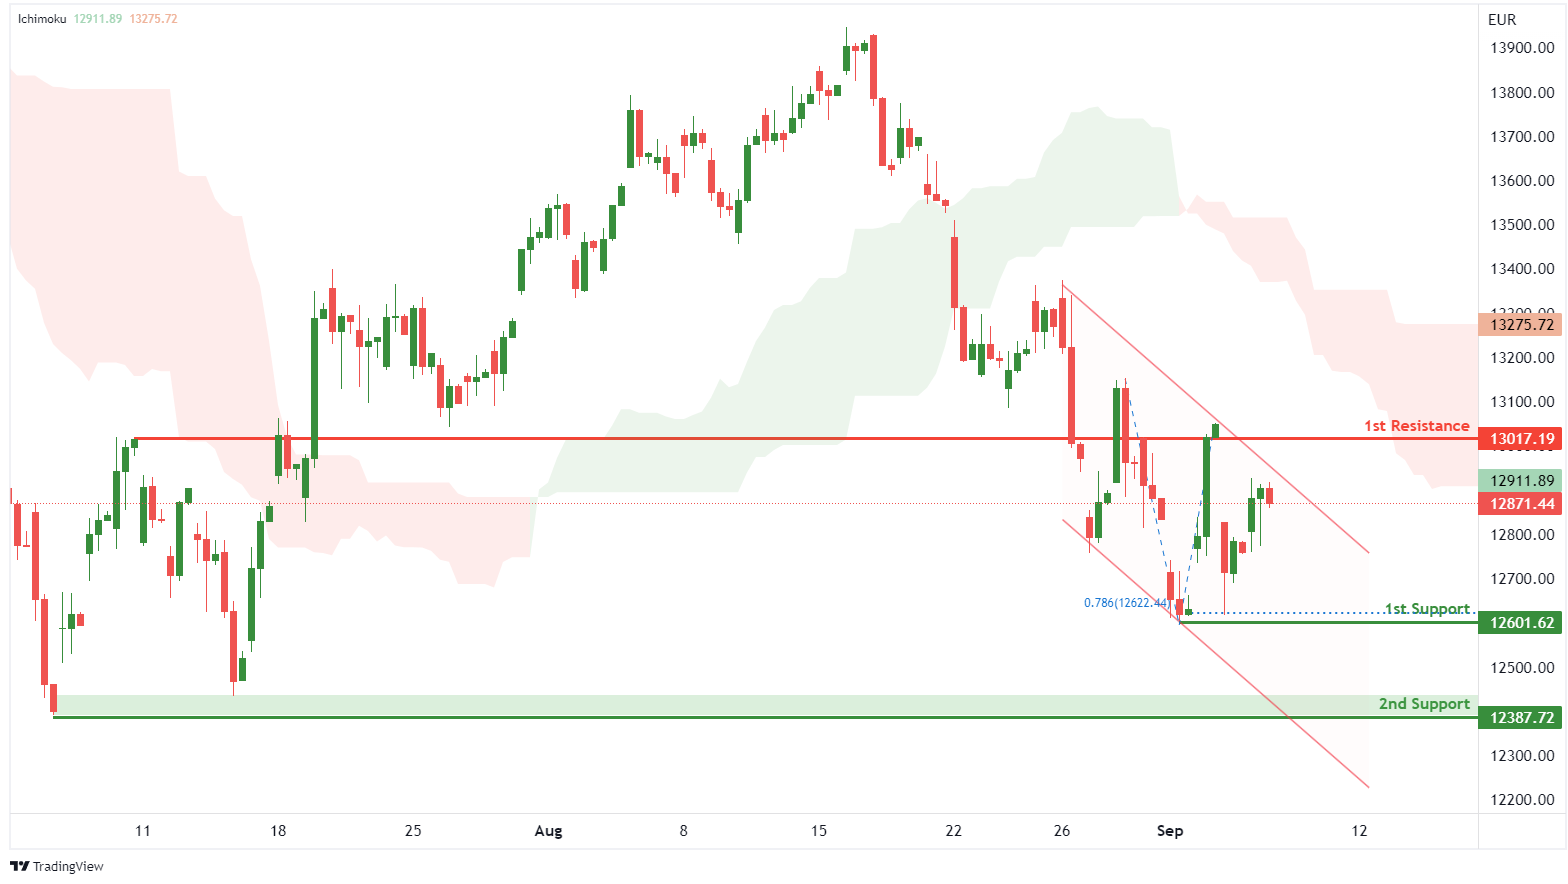
On the H4, with price moving within the descending channel and below the ichimoku indicator, we have a bearish bias that price will drop to 1st support at 12601.62 where the pullback support and 78.6% fibonacci projection are. Once there is downside confirmation that price has broken 1st support structure, we would expect bearish momentum to carry price to 2nd support at 12387.72 where the swing low support is. Alternatively, price could rise to 1st resistance at 13017.19 where the pullback resistance is.
Areas of consideration:
- H4 time frame, 1st resistance of 13017.19
- H4 time frame, 1st support at 12601.62
ETHUSD:
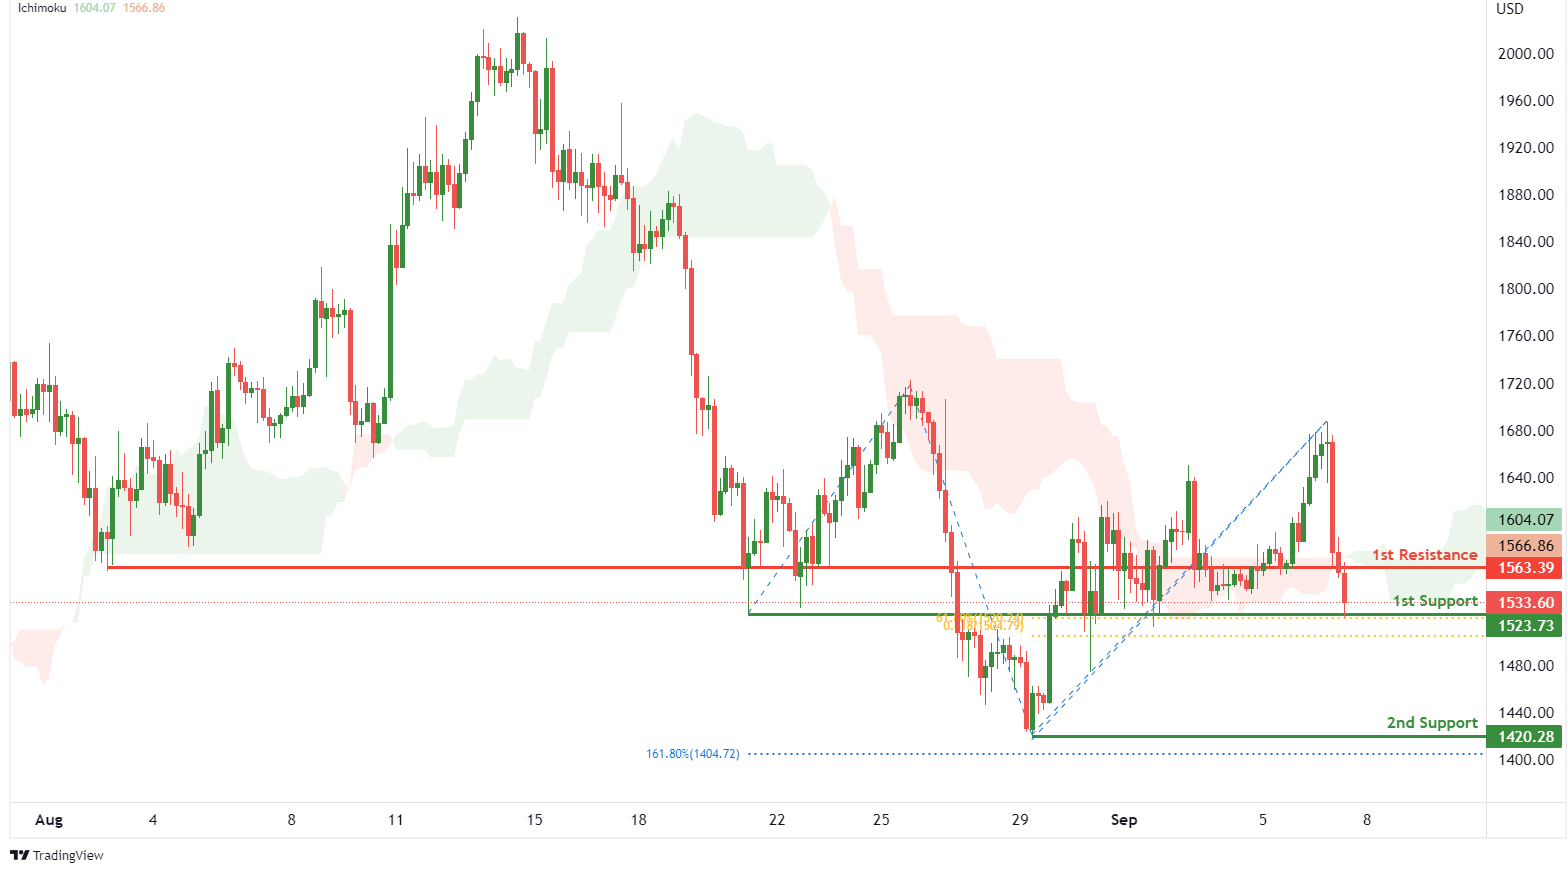
On the H4, with price moving below the ichimoku indicator, we have a bearish bias that price will drop to 1st support at 1523.73 where the pullback support, 61.8% fibonacci retracement and 61.8% fibonacci projection are. Once there is downside confirmation that price has broken 1st support structure, we would expect bearish momentum to carry price to the 2nd support at 1420.38 where the swing low support and 161.8% fibonacci extension are. Alternatively, price could rise to 1st resistance at 1563.39 where the overlap resistance is.
Areas of consideration:
- H4 time frame, 1st resistance of 1563.39
- H4 time frame, 1st support at 1523.73
BTCUSD:
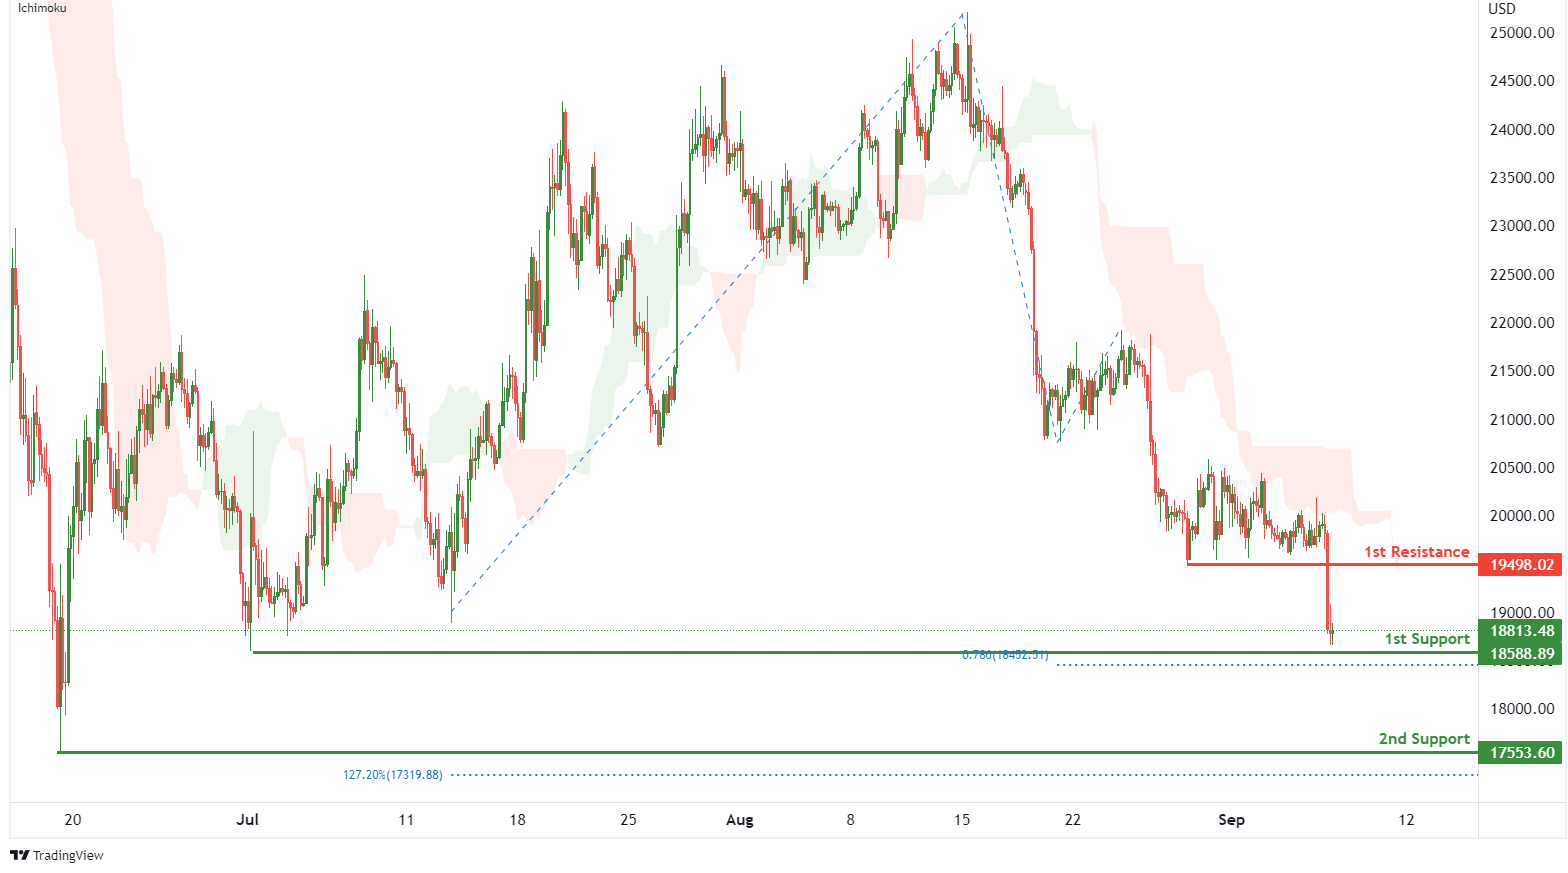
On the H4, with price moving below an ichimoku indicator, we have a bearish bias that price will drop to 1st support at 18588.89 where the swing low support and 78.6% fibonacci projection are. Once there is downside confirmation that price has broken 1st support structure, we would expect bearish momentum to carry price to 2nd support at 17553.60 where the swing low support and 127.2% fibonacci extension. Alternatively, price could rise to 1st resistance at 19498.02 where the pullback resistance is.
Areas of consideration:
- H4 time frame, 1st resistance of 19498.02
- H4 time frame, 1st support at 18588.89
S&P 500:
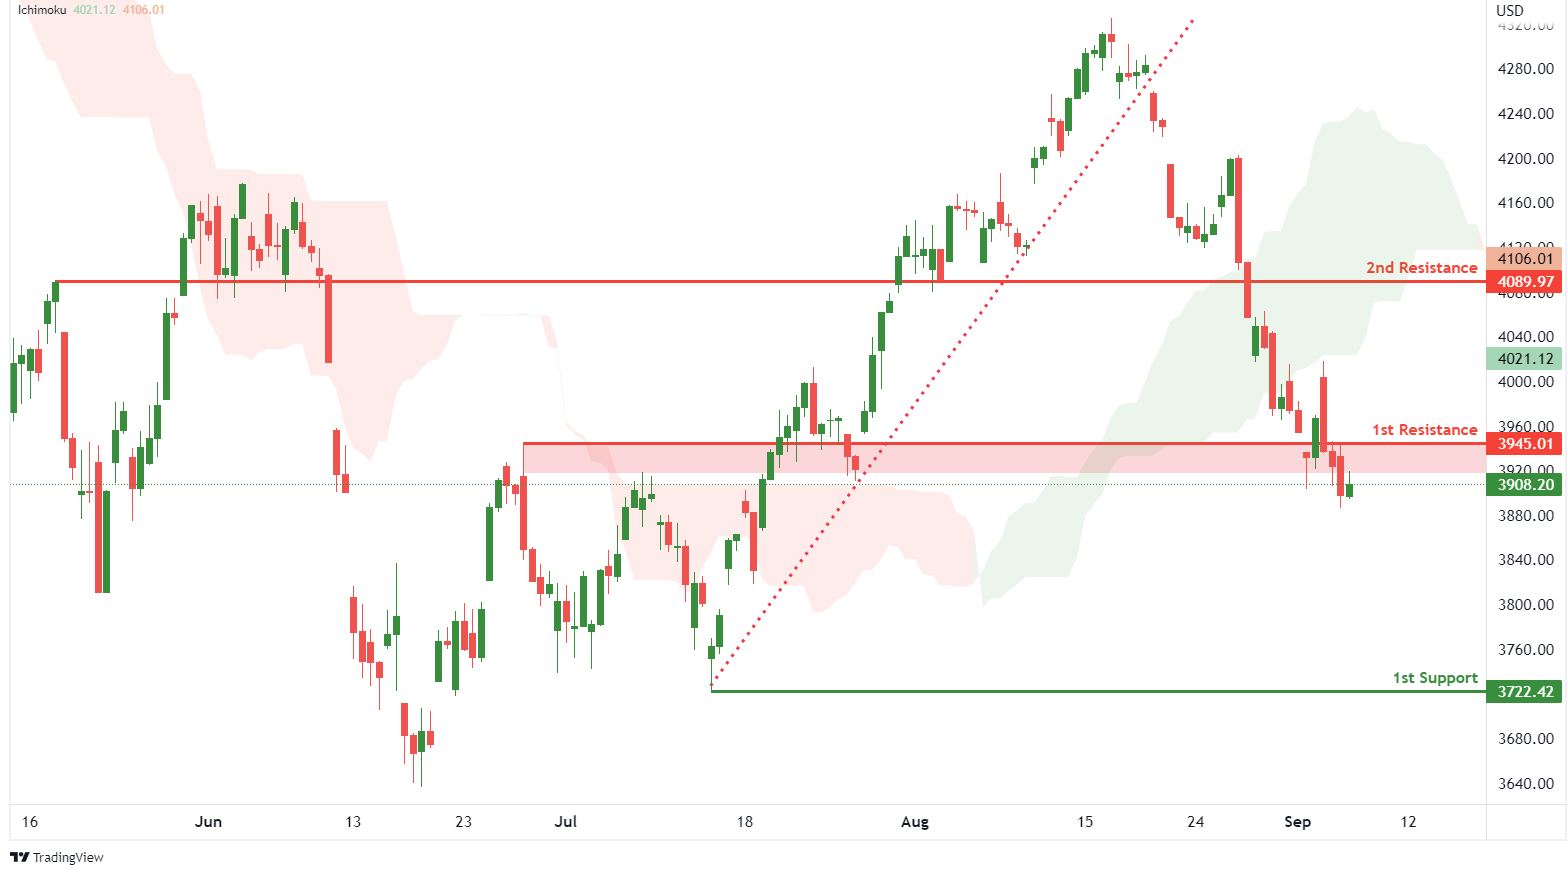
On the H4, with prices breaking out of the ascending trendline and moving below the ichimoku indicator, we have a bearish bias that the price will drop from 1st resistance at 3945.01 where the pullback resistance is to the 1st support at 3722.42 where the swing low support is. Alternatively, price could break 1st resistance structure and rise to 2nd resistance at 4089.97 where the pullback resistance is.
Areas of consideration:
- H4 time frame, 1st resistance of 3945.01
- H4 time frame, 1st support at 3722.42
NZD/USD Dives To New Yearly Low, Dollar Extends Rally
Key Highlights
- NZD/USD declined to a new multi-month low below 0.6100.
- EUR/USD spiked below the 0.9900 support, and GBP/USD stayed below 1.1620.
- USD/JPY surged above the 141.50 and 142.00 resistance levels.
- The Euro Zone GDP could grow 0.6% in Q2 2022 (QoQ).
NZD/USD Technical Analysis
The New Zealand Dollar stayed below the 0.6300 pivot zone against the US Dollar. NZD/USD declined below the 0.6150 and 0.6100 support levels to move further into a bearish zone.
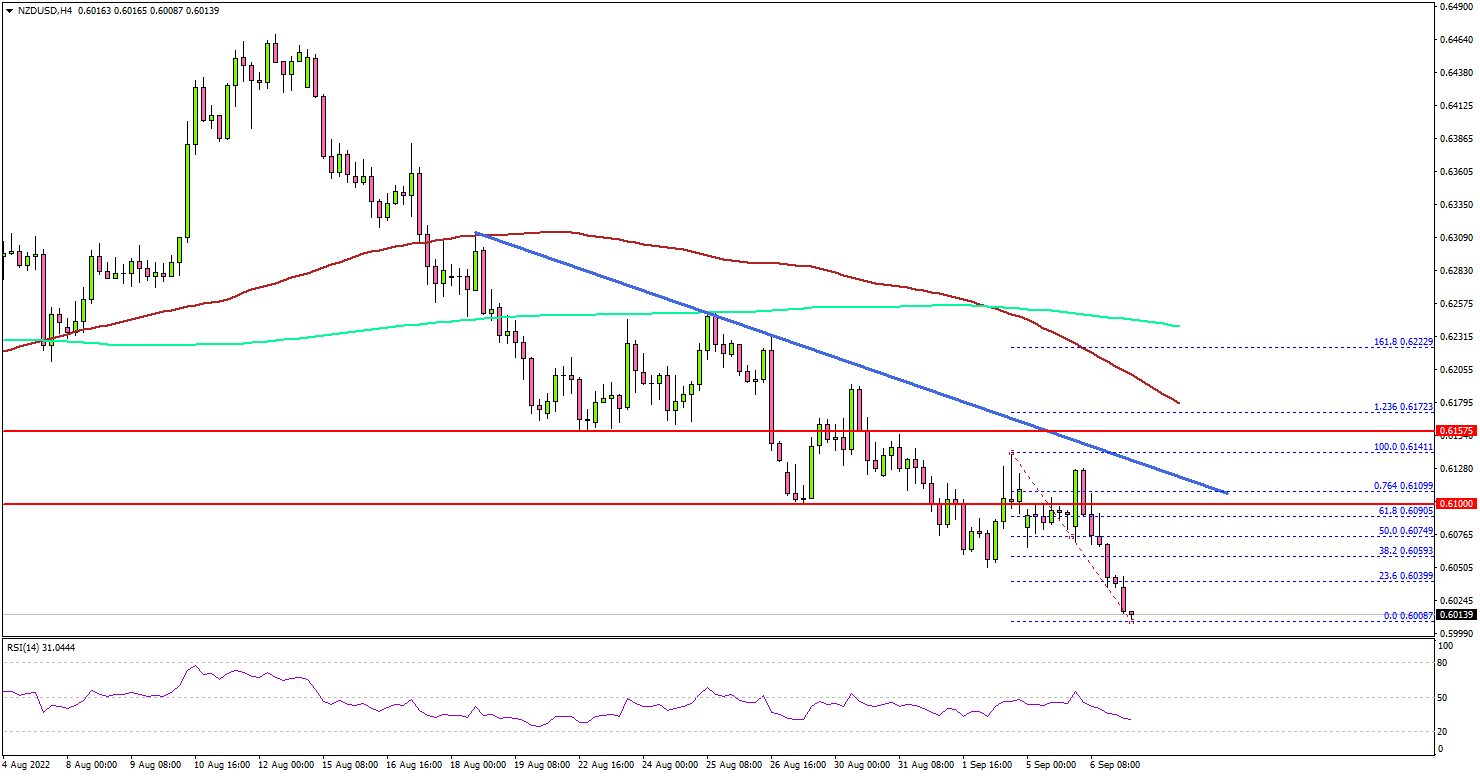
Looking at the 4-hours chart, the pair settled below 0.6100, the 100 simple moving average (red, 4-hours), and the 200 simple moving average (green, 4-hours).
The bears even pushed the pair towards the 0.6020 level. It seems like the bears are in control and there is a risk of a move towards the 0.6000 support zone. A downside break below the 0.6000 support might spark more losses.
The next major support is near the 0.5950 level, below which the pair could even test the 0.5880 level. If there is a recovery wave, the pair might face resistance near the 0.6085 level.
The first major resistance is near the 0.6100 zone and a connecting bearish trend line on the same chart. A clear move above the 0.6100 level might start a steady recovery. In the stated case, NZD/USD may perhaps rise towards the 0.6150 resistance zone.
Looking at EUR/USD, the pair extended losses below the 0.9920 level. Similarly, GBP/USD is at a risk of more losses below the 1.1500 level.
Economic Releases
- Euro Zone Gross Domestic Product Q2 2022 (QoQ) - Forecast 0.6%, versus 0.6% previous.
- Euro Zone Gross Domestic Product Q2 2022 (YoY) - Forecast 3.9%, versus 3.9% previous.
- BoC Interest Rate Decision – Forecast 3.25%, versus 2.5% previous.
Elliott Wave View: EURUSD Should Continue to Extend Lower
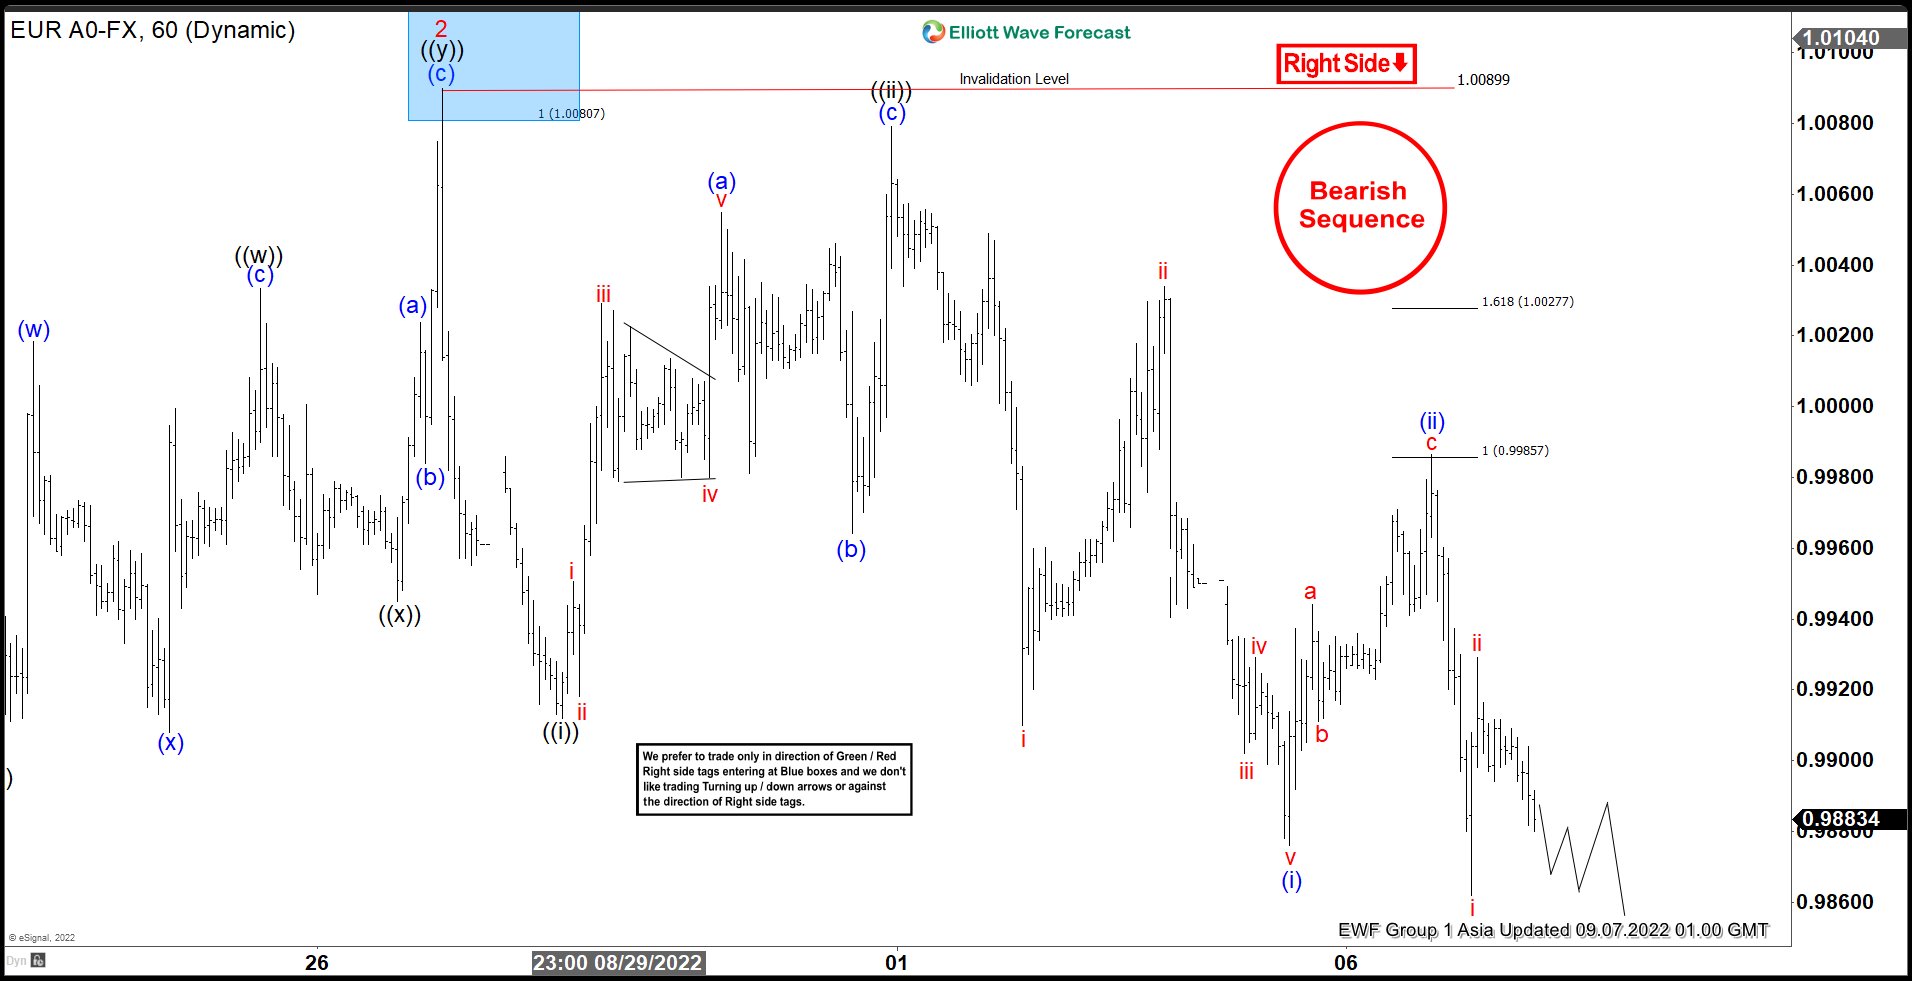
EURUSD shows a bearish sequence from 8.10.2022 high suggesting further downside is likely. The decline from August 10 high is unfolding as an impulse Elliott Wave structure. Down from August 10 high, wave 1 ended at 0.9899 and rally in wave 2 ended at 1.009 as the 1 hour chart below shows. Pair has resumed lower in wave 3 which subdivides into another impulse in lesser degree.
Down from wave 2, wave ((i)) ended at 0.9912 and rally in wave ((ii)) ended at 1.0079. Internal subdivision of wave ((ii)) took the form of a zigzag. Up from wave ((i)), wave (a) ended at 1.0055, wave (b) ended at 0.9973 and wave (c) of ((ii)) ended at 1.0079. Pair then turned lower in wave ((iii)). Down from wave ((ii)), wave (i) ended at 0.9876 and wave (ii) ended at 0.9986. Pair turned lower again in wave (iii) of ((iii)). Down from wave (ii), wave i ended at 0.9862 and wave ii ended at 0.9929. Near term, as far as pivot at 1.009 high stays intact, expect rally to fail in 3, 7, or 11 swing for further downside. Potential target lower is 100% – 161.8% Fibonacci extension from 8.10.2022 peak at 0.933 – 0.962.
EURUSD 60 Minutes Elliott Wave Chart
CHFJPY Wave Analysis
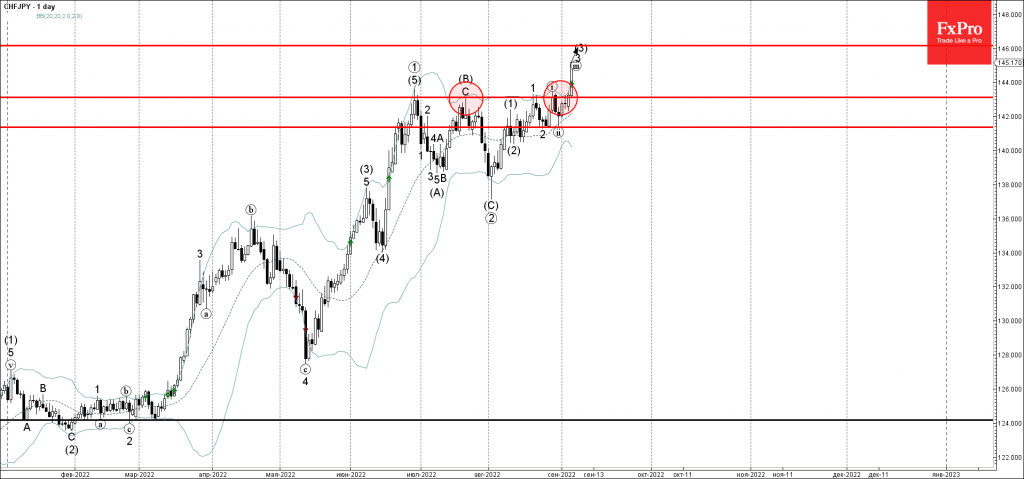
- CHFJPY broke key resistance level 143.10
- Likely to rise to resistance level 146.00
CHFJPY currency pair recently broke the key resistance level 143.10, which has been reversing the price from the end of June, as you can see from the daily CHFJPY chart below.
The breakout of the resistance level 143.10 accelerated the active impulse waves 3 and (3).
Given the strong daily uptrend and powerful yen outflows – CHFJPY can be expected to rise further toward the resistance level 146.00 (target price for the completion of the active impulse waves 3 and (3)).
EURJPY Wave Analysis
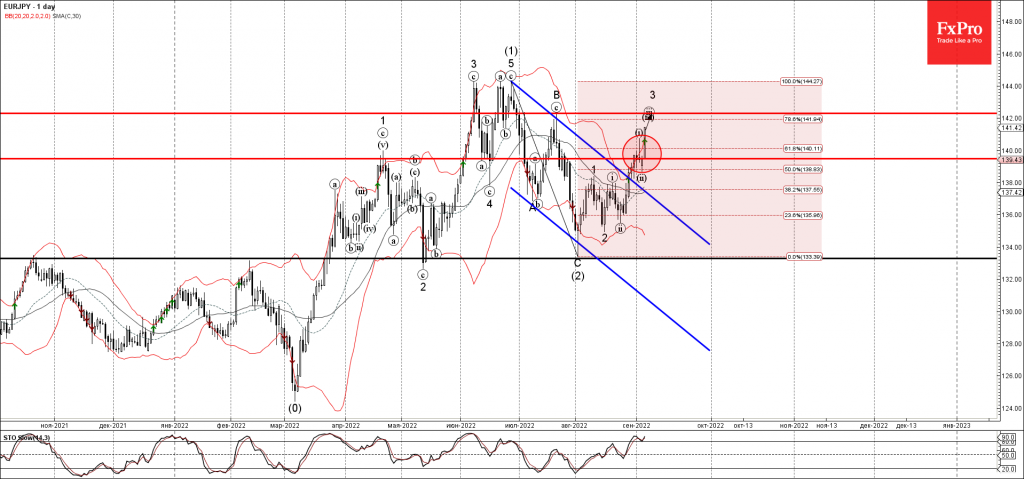
- EURJPY broke key resistance level 139.50
- Likely to rise to resistance level 142.30
EURJPY currency pair recently broke the key resistance level 139.50 standing close to the 61.8% Fibonacci correction of the earlier downward ABC correction (2) from June.
The price earlier broke the resistance trendline of the daily down channel from the end of June – which accelerated the active impulse waves 3 and (3).
Given the clear daily uptrend – EURJPY can be expected to rise further toward the resistance level 142.30 (top of the previous wave B and the target for the completion of wave (iii)).
Eco Data 9/7/22
[php_everywhere instance="1"]
Bank of Canada to Hike Again But Could Be Nearing End of Cycle
The Bank of Canada is almost certain to raise interest rates again on Wednesday when it announces its latest monetary policy decision at 14:00 GMT. After July’s jumbo-sized rate increase when the Bank lifted borrowing costs by a full percentage point, investors are anticipating another big, though slightly smaller, rate hike of 75 basis points. However, when it comes to the Canadian dollar’s reaction in the FX market, what will be more relevant is any clues that there may not be many rate increases left in the pipeline.
Labour market remains tight despite recent softness
Canada’s economy lost some momentum towards the middle half of 2022 and the slowdown is evident in both the labour and housing markets. Employment fell in both June and July, although a modest rebound of 15k is expected on Friday when the August report is published.
The unemployment rate is projected to tick up slightly to 5.0%, but that would still be a historically low level not seen since the mid-1970s.
Household debt is something to worry about
The cooling down of the housing market has been a little more profound, however, with home prices falling in several districts in the last few months. Rising borrowing costs and sky-high prices are likely to blame, and soon, the soaring cost of living as high inflation begins to bite could further dampen demand in the property sector. But even if this eventually translates to year-on-year declines in house prices, there would be a long way to go before prices become affordable again given the spectacular rally that was fuelled by the pandemic stimulus.
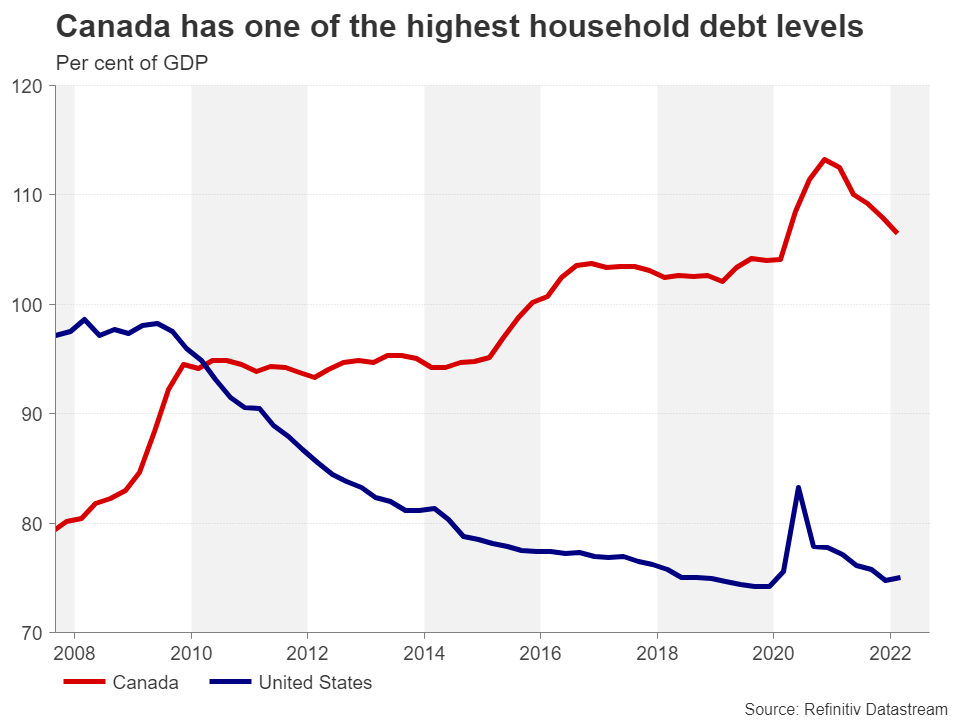
For the Bank of Canada, the main concern from a sharp slowdown in the housing market is the risk of a wider fallout in the economy due to Canada’s very high level of household debt. With household wealth coming under threat from weaker house prices and consumer demand expected to weaken in the coming months as disposable incomes are squeezed from surging inflation, policymakers may want to tread more carefully going forward after slamming on the brakes quite forcefully since April.
Investors see inflation and interest rates peaking
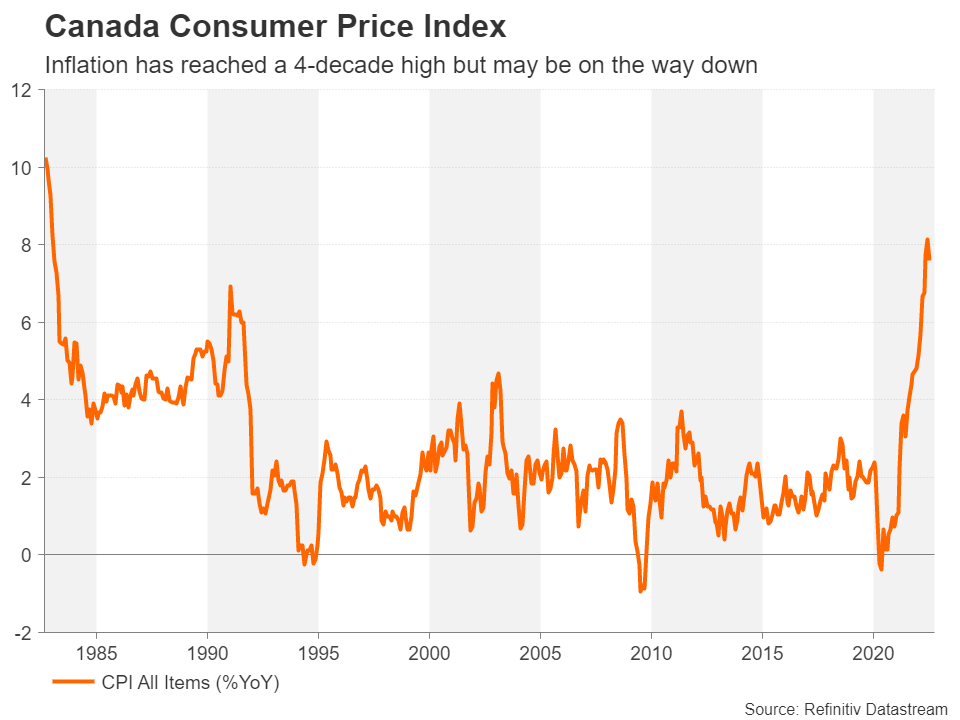
But any dovish tilt from such caution may not come until later in the year as inflation remains too high at the moment despite some early signs that it has peaked. Canada’s consumer price index rose by 7.6% year-on-year in July, slowing from a fresh four-decade high of 8.1% in June.
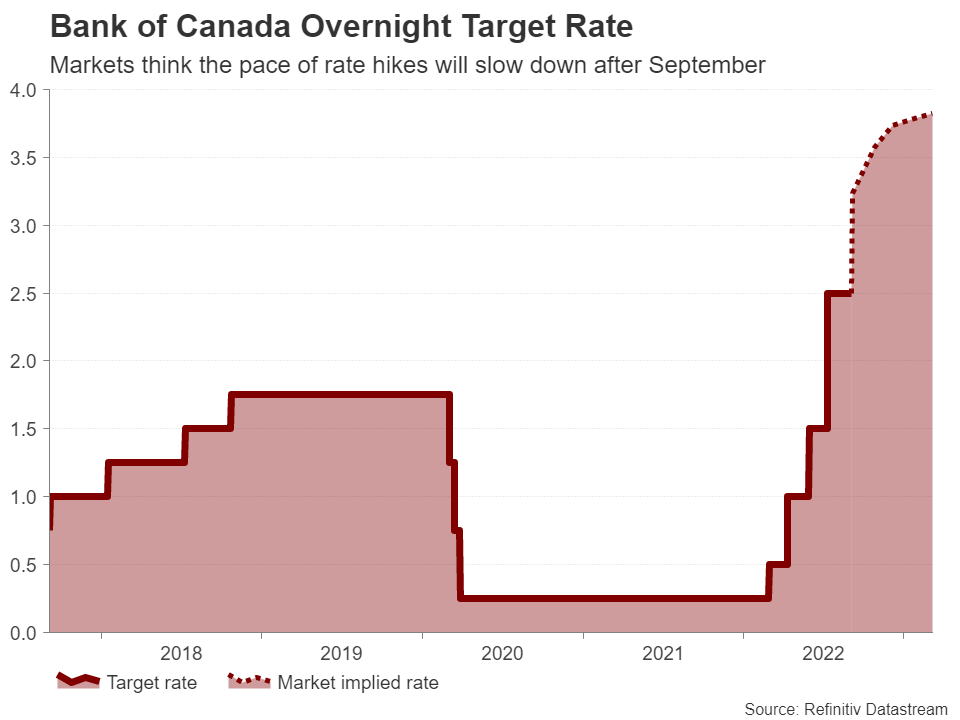
Investors have priced in a more than 90% probability of a 75-basis point hike in the overnight target rate in September. But more significantly, they see rates peaking somewhere between 3.75% and 4% next year. That implies that should the BoC proceed with raising rates to 3.25% from 2.50% currently, it will likely have to go into lower gear after September as it approaches the end of its tightening cycle.
Canada’s energy advantage
However, that estimate of the terminal rate is based on the very big assumption that oil prices remain on a downward path and domestically sourced natural gas prices do not spiral uncontrollably higher as they have in Europe. Moreover, although Canada’s self-sufficiency in energy gives it some protection from the energy crisis in terms of excessive prices, it also means a comparatively smaller economic pain and therefore less reason for the BoC to be cautious than other central banks.
Hence, it’s not surprising that the Canadian dollar is staring at yearly gains versus all the other majors, bar the US dollar. With the Federal Reserve equally, if not, more hawkish than the BoC, dollar/loonie has been steadily rising this year.
It’s all about the Fed vs the BoC for the loonie
Should policymakers show signs that they are fretting about a hard landing in the economy from a possible crash in the property market and hint that the era of hefty rate increases will come to an end after September, dollar/loonie could surpass the 20-month peak of 1.3223 reached in July and aim for the 123.6% Fibonacci extension of the July-August downleg at 1.3341.
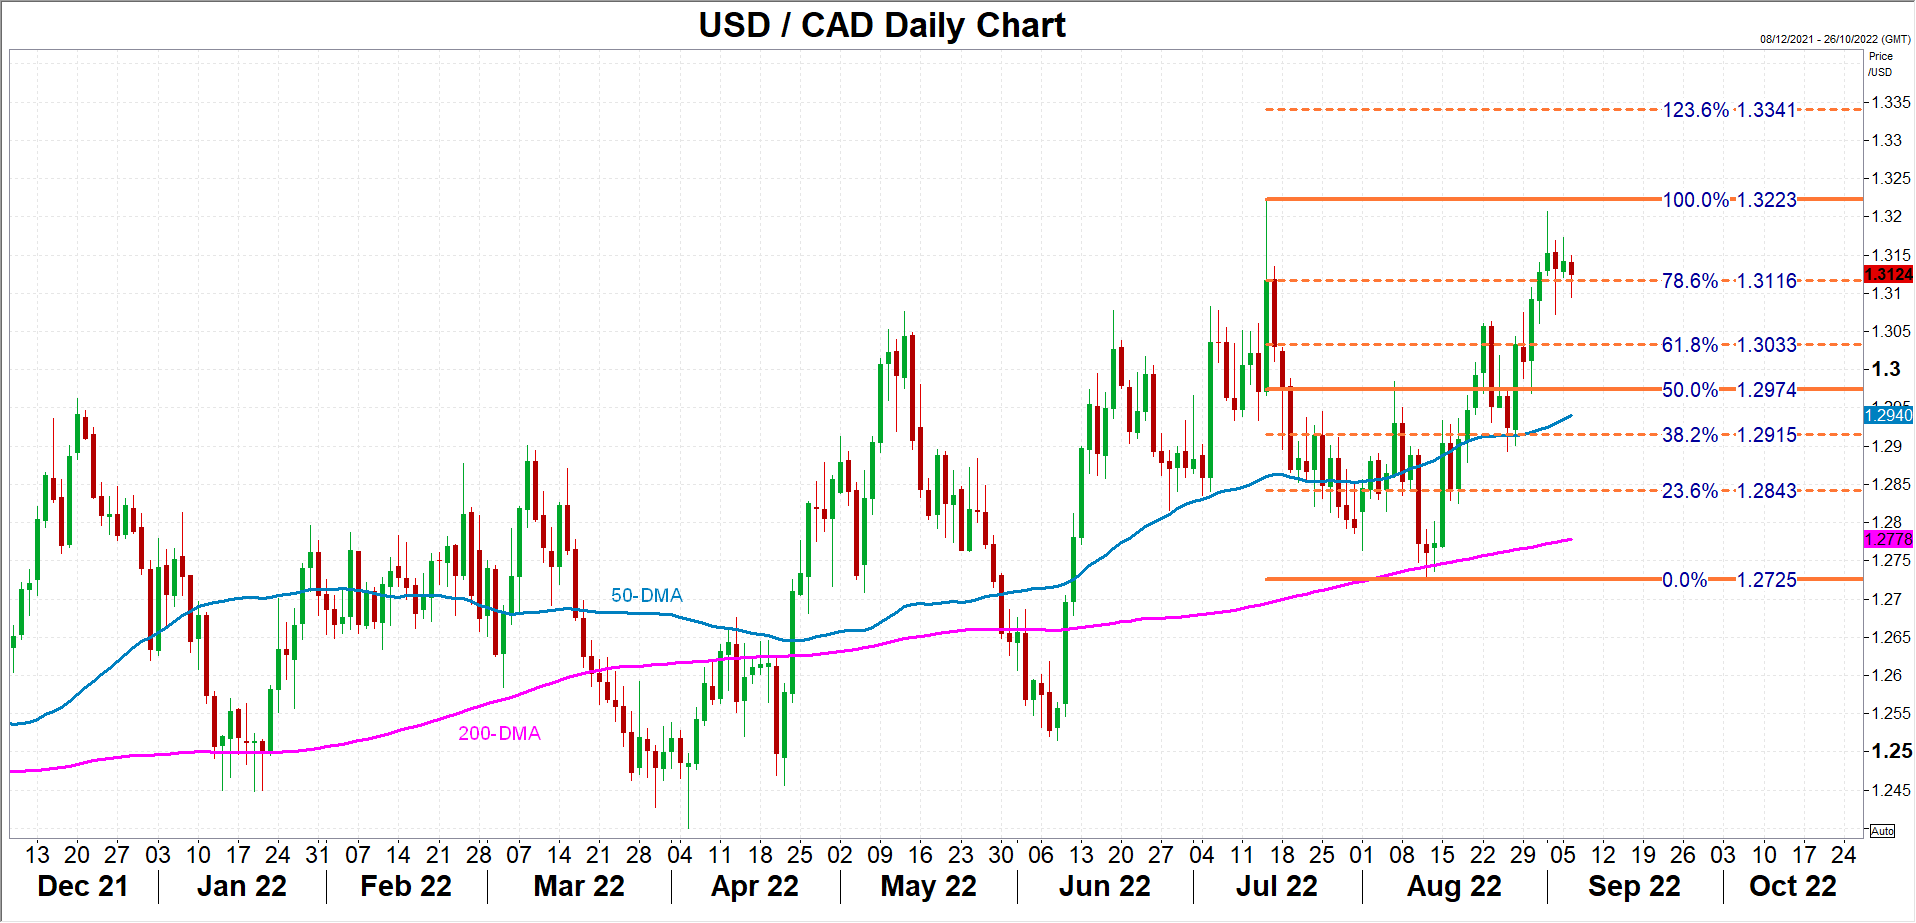
However, if the Bank maintains its hawkish stance for now and flags the need for further tightening, the pair could initially slip towards the 61.8% Fibonacci retracement of 1.3033 before retreating to its 50-day moving average.
Looking beyond the September policy decisions of the Fed and BoC, the focus for dollar/loonie traders will become increasingly about which central bank will be more successful in achieving a soft landing and perhaps less so about the nominal pace of tightening.
Crude Oil Testing Bottom Despite a Bullish Backdrop
Brent and WTI spot prices are now lower than they were before the surprise from OPEC. The cartel yesterday surprised markets with a recommendation to cut oil production quotas by 100,000 BPD from October. The move is small but symbolic. It is the opposite of what the US president had demanded when flying to Saudi Arabia last summer.
Despite the policy setback, the economy and markets still broke the back of the bullish oil market in early June. The oil market, which had previously reacted strongly to bullish news, is now working out the information from the bears with equal zeal.
The WTI price has returned to the region of August lows, having digested the news of the North Stream shutdown and quota cuts in less than 24 hours. Moreover, the cartel has threatened that it may make decisions more than once a month. It is also a clear sign to act more actively in case of quotations fall.
However, it is not so easy for politics to fight the market and the economy. Global demand is shrinking due to lockdowns in China. The gas market is unexpectedly on the side of the bears in oil.
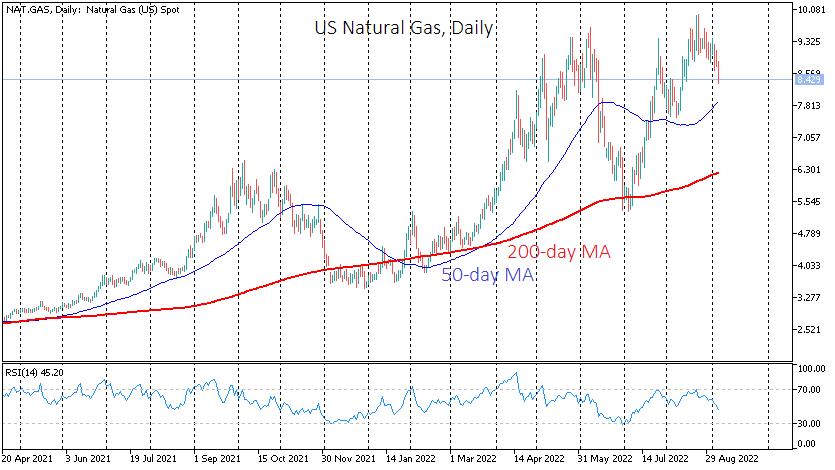
In Europe, exchange prices are losing 9% today to $2250. This is still unbearably expensive for consumers, but it is a two-week low, which fits poorly into the news Armageddon. US prices have also been under pressure for the past two weeks.
Simply put, the entire energy market has come under pressure all at once. We are paying increased attention to these market signals. The market reverses before the news backdrop changes, which seems to be our case
Slightly more liquid and freer of politics, oil performs much better than gas as an energy market indicator. And it signals weakness to buyers.
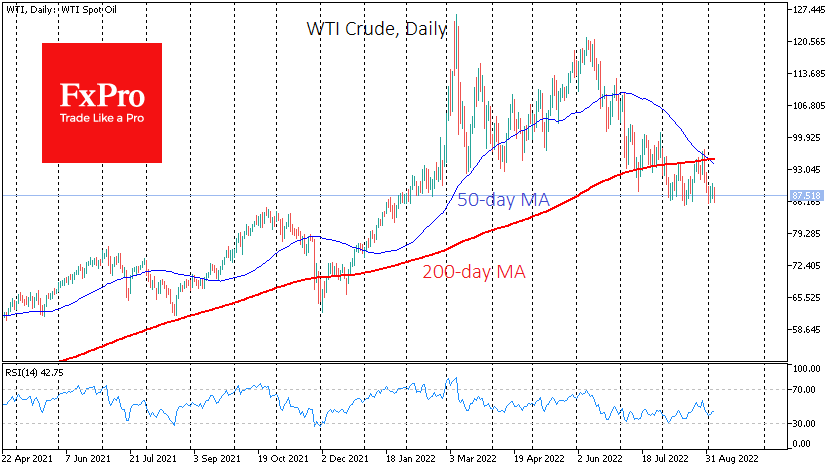
Technical analysis is also on the sellers’ side. The death cross (50-day under the 200-day moving average) in the WTI occurred at the beginning of the month, and in Brent, it is imminent any day now.
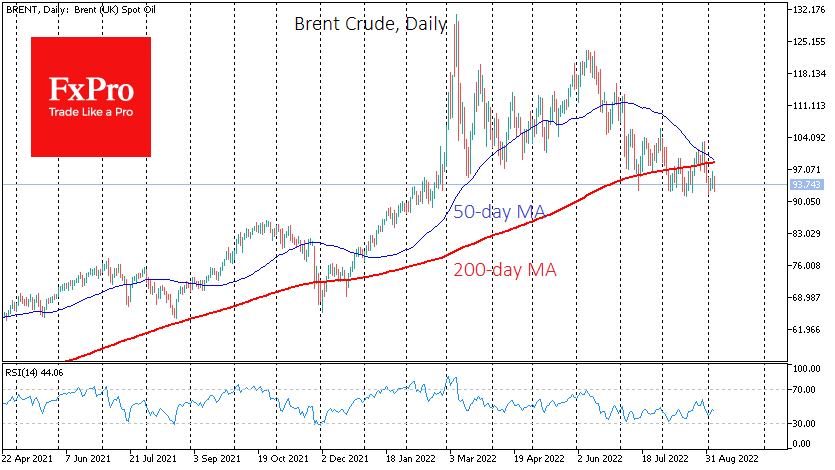
In doing so, the bears have been gathering their strength for a new attack all last month, which is not uncommon in the autumn months.
A significant signal that the oil market has decided to cross the line would be a fall in the price of WTI to $85, the intermediate round level, where concentrated August and February lows. Moreover, this move will zero all the gains since the end of January.
Before the year’s end, the price of oil could dip into the $75-77 area, as high rates will hit consumer demand, not to mention the desire to cut energy consumption worldwide, hitting Crude Oil demand. Likely, the above levels will only be an intermediate point, and the decline will not stop there.