Sample Category Title
US CPI and Euro Area Employment Data in Focus
In focus today
The US January CPI report, that was originally scheduled for Wednesday, will be released today. We think headline inflation slowed down to +0.2% m/m SA (+2.4% y/y) driven by lower gasoline prices and base effects related to high energy prices a year ago. The effect will likely reverse in February, as both gasoline and particularly US natural gas prices rose towards the end of month. We think that core inflation remained relatively steadier at +0.3% m/m SA (2.5% y/y). The apparent slowing in the annual growth rate is also mostly explained by base effects.
In the euro area, the second estimate of GDP growth in 2025Q4 will also reveal how much employment changed in the final quarter of last year. National data show that employment rose sharply in Spain while declined marginally in France and Germany. We thus expect aggregate euro area employment rose 0.1% q/q. The continued growth in employment is positive for the economy, but the low employment growth rate is also showing that the labour market is cooling.
The Munich Security Conference will kick off today, so we might hear some interesting takes on security policies over the weekend.
Economic and market news
What happened overnight
In China, new home prices fell 0.4% m/m (-3.1% y/y) in January, marking the sharpest annual decline in seven months. Despite government measures aimed at reviving the property sector, demand remains weak, particularly in smaller cities with heavy inventories. The prolonged downturn has weighed on household wealth, dampened consumption, and impacted property developers struggling with debt and unfinished projects.
The US and Taiwan finalised a trade agreement reducing Taiwan's tariffs on US goods and committing to nearly USD 85bn in US purchases over four years. The deal maintains a 15% US tariff on Taiwanese imports and lowers tariffs on over 2,000 Taiwanese export items. Taiwan's parliament must still approve the agreement, which aims to strengthen supply chain resilience in high-tech sectors.
What happened yesterday
In the UK, GDP grew by 0.1% q/q in Q4 2025, missing expectations for 0.2%, as uncertainty surrounding November's budget weighed on activity. Business investment fell by nearly 3%, reflecting hesitancy amid economic and political challenges. Manufacturing drove growth, while the services sector stagnated, and construction contracted. Weak data have strengthened expectations for a potential Bank of England rate cut in March. The next key focus will be inflation data on Wednesday, which will be particularly interesting following the dovish tone at the Bank of England's meeting last week.
In the US, the Congressional Budget Office (CBO) released updated budget projections that now fully account for President Trump's policy changes implemented last year. The projections show that the OBBBA will add USD 4.7 trillion to the cumulative deficit over 10 years, partially offset by USD 3.0 trillion in tariff revenues. As a share of GDP, the deficit forecast for 2026 was lifted to -5.8% (from -5.5%), and 2027 to -5.7% (from -5.2%), reflecting faster real growth and higher inflation expectations lifting nominal GDP estimates.
The Trump administration has paused several key tech restrictions targeting China ahead of an April summit with President Xi Jinping. The measures include curbs on telecom imports and Chinese-linked data centre equipment. While the move aims to stabilise trade relations, critics warn of growing national security risks in sensitive sectors like AI and energy infrastructure.
In Norway, the Q1 oil investment survey revealed that oil companies expect to invest NOK 255.3 billion in 2026 and NOK 201.1 billion in 2027, indicating nominal growth of 0.6% and 2.0%, respectively. Adjusting for cost inflation, the figures suggest slightly stronger growth than Norges Bank's December MPR volume estimate for 2026 at -3%, and significantly stronger for 2027 at -6%.
As expected, there was no new monetary signals in NB governor Wolden Bache's annual address last night. The most interesting point short term is that Norges Bank is getting more transparent: 'In the course of this year, we will begin to publish a summary of the Committee's discussions.' This could improve market guiding and avoid some of the volatility occasionally seen on the day of the MPC-meeting the last couple of years
Equities: Equities sold off yesterday, led by the US, as another round of AI-disruption narratives ignited cross-sector de-rating. It is increasingly evident that macro and earnings are not currently in the driver's seat; anything that rhymes with potential AI disruption is being indiscriminately repriced.
Transport was yesterday's casualty. A seemingly contained corporate headline cascaded into a broader re-rating of the segment, ironically sparked by news from a company that itself could plausibly be seen as disruption-vulnerable. Russell 3000 Trucking fell ~7%, while Transportation within the Stoxx 600 underperformed at -3.6%, the weakest industry group on the day.
Notably, US hardware underperformed software for the first time in an extended period.
Style-wise, value and small caps outperformed, while large cap and growth remains under pressure within the AI-disruption trade. This rotation is thematic rather than cyclical. We will elaborate further in Sunday's editorial.
In the US yesterday, Dow -1.3%, S&P 500 -1.6%, Nasdaq -2.0% and Russell 2000 -2.0%.
Asian equities are softer this morning. Still, barely six weeks into the year, Asia is outperforming the US by ~15% YTD.
Futures point to a firmer open in Europe and a softer in the US.
FI and FX: Yesterday's risk-off environment implied a classic risk-off pattern in G10 FX, with the CHF, JPY, and USD outperforming. EUR/USD remains below the 1.19 mark, with the broad USD consolidating. USD/CNY continues its relentless decline, moving from 6.95 ten days ago to 6.90 now. Yields in the US declined significantly, with the 2-year Treasury reverting to pre-NFP levels and the 10-year Treasury falling even below its pre-NFP level. In the euro area, the decline in yields was more modest, with the 2-year Bund yield down 1bp and the 10-year Bund yield 2bp lower. In this week's Reading the Markets Sweden, we take a look at recent weeks' SEK rally through the lens of our in-house time-zone analysis and financial flow data.
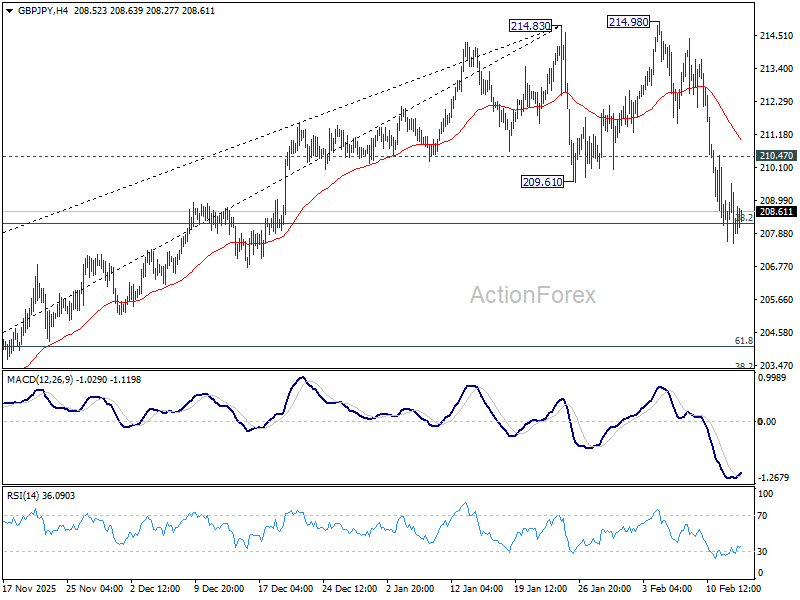
GBP/JPY Daily Outlook
Daily Pivots: (S1) 207.25; (P) 208.41; (R1) 209.24; More...
Immediate focus stays on 38.2% retracement of 197.47 to 214.83 at 208.19 in GBP/JPY. Sustained break there will argue that it's already correcting whole up trend from 184.35. However, strong rebound from current level, followed by break of 210.47 minor resistance will retain near term bullishness, and bring retest of 214.83/98 resistance zone.
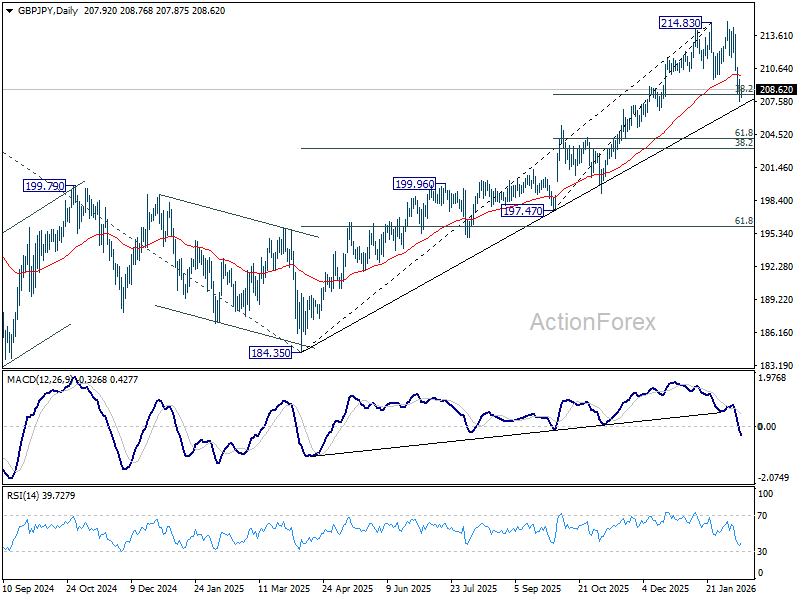
In the bigger picture, up trend from 123.94 (2020 low) is in progress. Next target is 61.8% projection of 148.93 (2022 low) to 208.09 (2024 high) from 184.35 at 220.90. On the downside, break of 205.30 resistance turned support is needed to indicate medium term topping. Otherwise, outlook will stay bullish even in case of deep pullback.
EUR/JPY Daily Outlook
Daily Pivots: (S1) 180.57; (P) 181.56; (R1) 182.30; More...
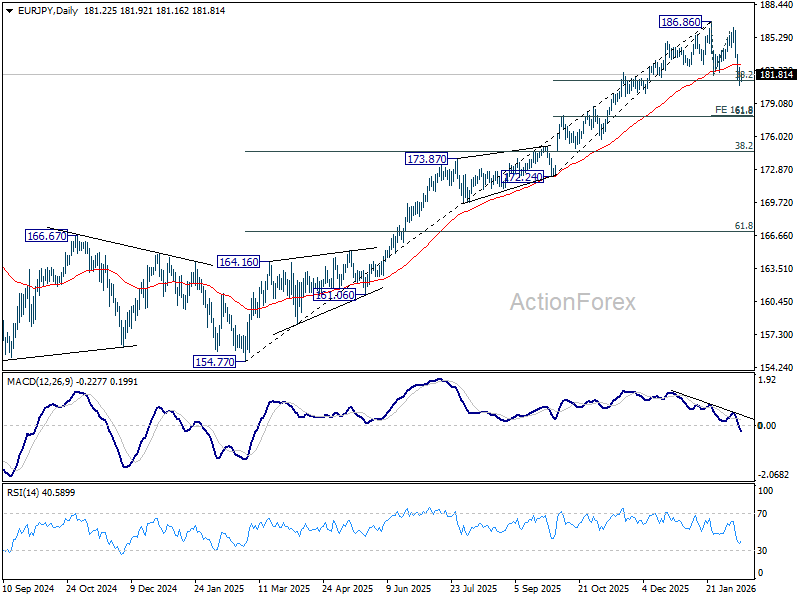
Immediate focus stays on 38.2% retracement of 172.24 to 186.86 at 181.27 in EUR/JPY. Decisive break there will argue that fall from 186.86 is correcting whole up trend from 154.77. Next near term target will be 161.8% projection of 186.86 to 181.76 from 186.22 at 177.96. Nevertheless, strong rebound from current level, followed by break of 182.99 minor resistance will retain near term bullishness, and bring retest of 186.86 high first.
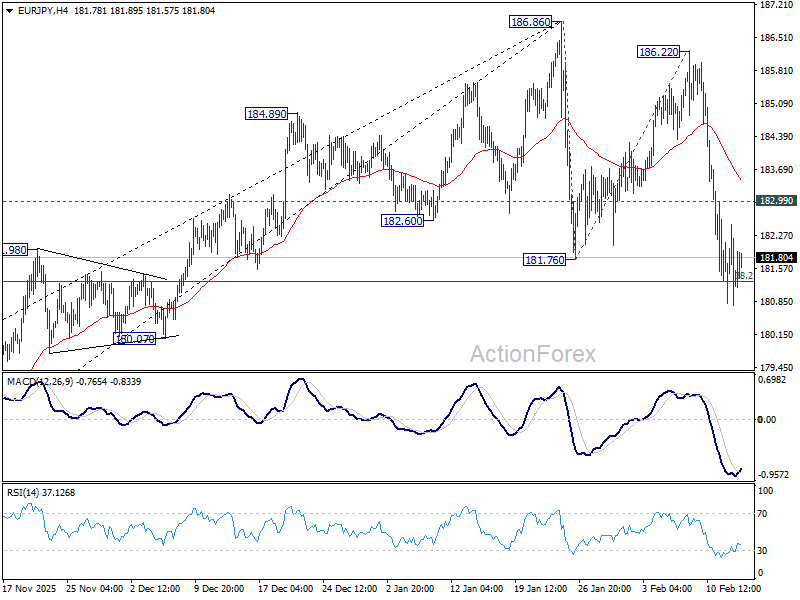
In the bigger picture, up trend from 114.42 (2020 low) is in progress. Upside momentum has been diminishing as seen in bearish divergence condition in D MACD. But there is no clear sign of topping yet. On resumption, next target is 78.6% projection of 124.37 to 175.41 from 154.77 at 194.88 next. Meanwhile, outlook will stay bullish as long as 55 W EMA (now at 174.22) holds, even in case of deep pullback.
EUR/GBP Daily Outlook
Daily Pivots: (S1) 0.8697; (P) 0.8711; (R1) 0.8727; More…
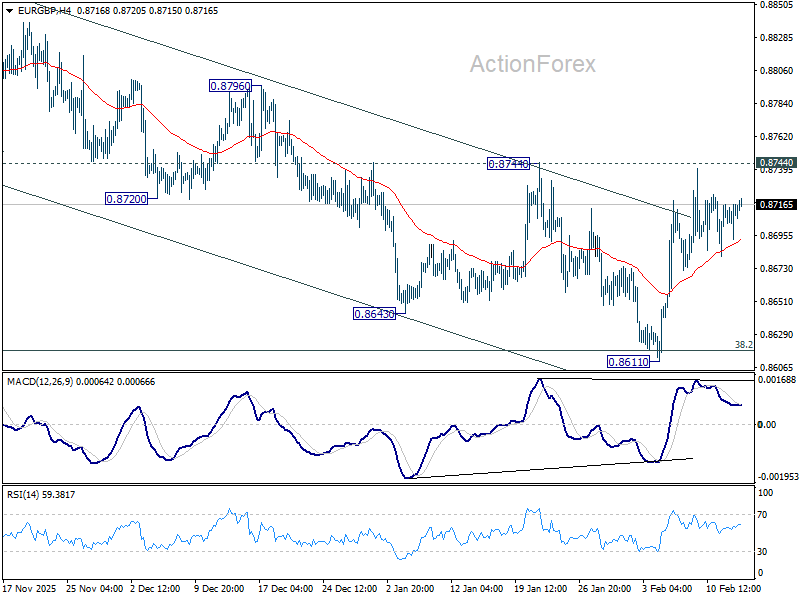
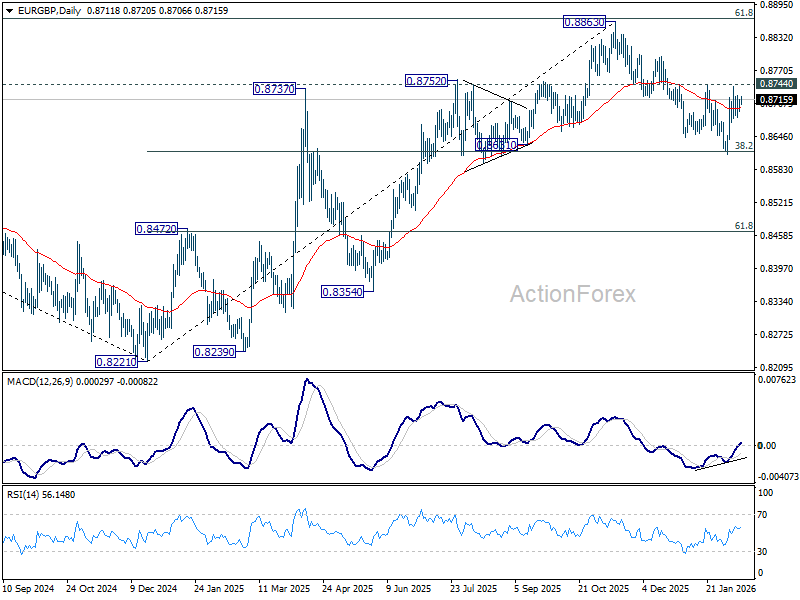
Intraday bias in EUR/GBP stays neutral and outlook is unchanged. On the upside, firm break of 0.8744 resistance will argue that fall from 0.8863 has completed at 0.8611 as a correction. Further rally should be seen back to retest 0.8863 high. On the downside, sustained break of 38.2% retracement of 0.8221 to 0.8663 at 0.8618 will carry larger bearish implications and turn outlook bearish.
In the bigger picture, rise from 0.8221 medium term bottom (2024 low) is seen as a corrective move. Upside should be limited by 61.8% retracement of 0.9267 to 0.8221 at 0.8867. Sustained trading below 55 W EMA (now at 0.8629) should confirm that this corrective bounce has completed. In this case, deeper fall would be seen back to 0.8201/21 key support zone. However, decisive break of 0.8867 will suggest that EUR/GBP is already reversing whole decline from 0.9267 (2022 high). That should pave the way back to 0.9267.
EUR/AUD Daily Outlook
Daily Pivots: (S1) 1.6658; (P) 1.6708; (R1) 1.6793; More...
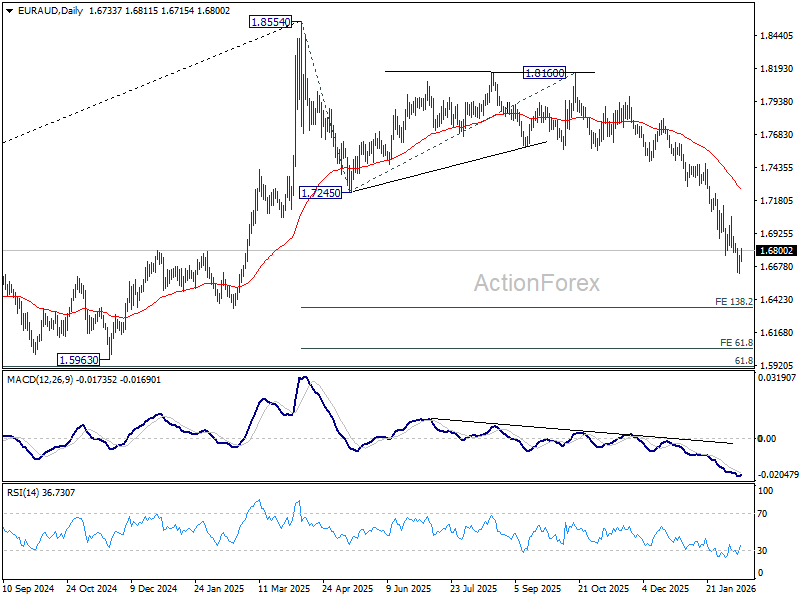
Intraday bias in EUR/AUD is turned neutral with current recovery, and some consolidations would be seen above 1.6620. But outlook will stay bearish as long as 1.7060 resistance holds. Break of 1.6620 will extend the whole down trend from 1.8554, and target 138.2% projection of 1.8554 to 1.7245 from 1.8160 at 1.6351 next.
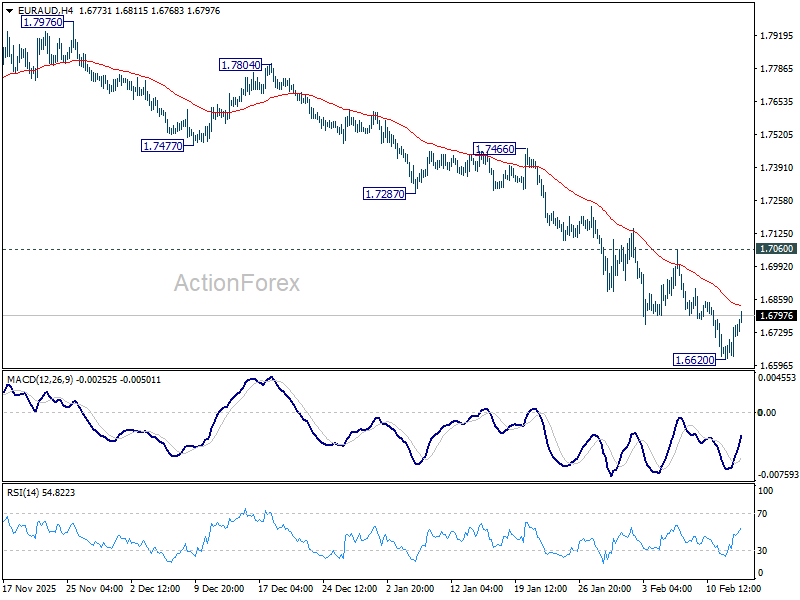
In the bigger picture, fall from 1.8554 medium term top is seen as reversing the whole up trend from 1.4281 (2022 low). Deeper decline should be seen to 61.8% retracement of 1.4281 to 1.8554 at 1.5913, which is slightly below 1.5963 structural support. For now, risk will stay on the downside as long as 1.7245 support turned resistance holds even in case of strong rebound.
EUR/CHF Daily Outlook
Daily Pivots: (S1) 0.9109; (P) 0.9138; (R1) 0.9163; More....
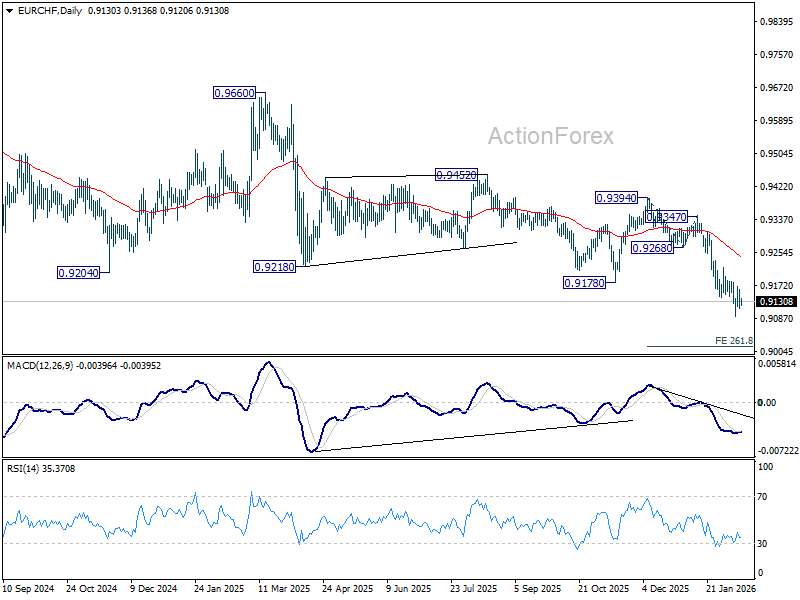
Intraday bias stays neutral in EUR/CHF for consolidations above 0.9092. Further decline is expected as long as 0.9180 resistance holds. Below 0.9092 will resume larger down trend to 261.8% projection of 0.9394 to 0.9268 from 0.9347 at 0.9017 next. However, considering bullish convergence condition in 4H MACD, firm break of 0.9180 will indicate short term bottoming, and bring stronger rebound towards 55 D EMA (now at 0.9242).
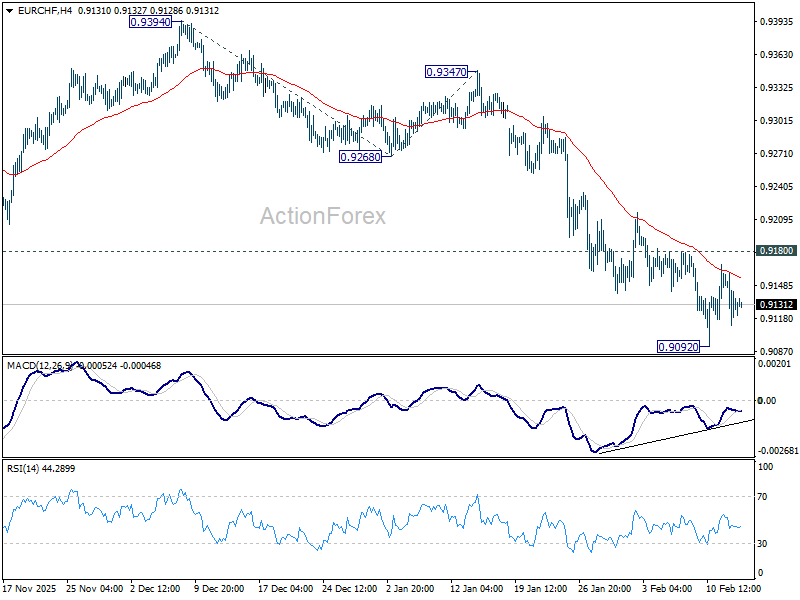
In the bigger picture, down trend from 0.9928 (2024 high) is still in progress with falling 55 W EMA (now at 0.9334) intact. Next target is 61.8% projection of 1.1149 to 0.9407 from 0.9928 at 0.8851. Outlook will stay bearish as long as 0.9394 resistance holds, in case of recovery.
EUR/USD Daily Outlook
Daily Pivots: (S1) 1.1853; (P) 1.1871; (R1) 1.1891; More….
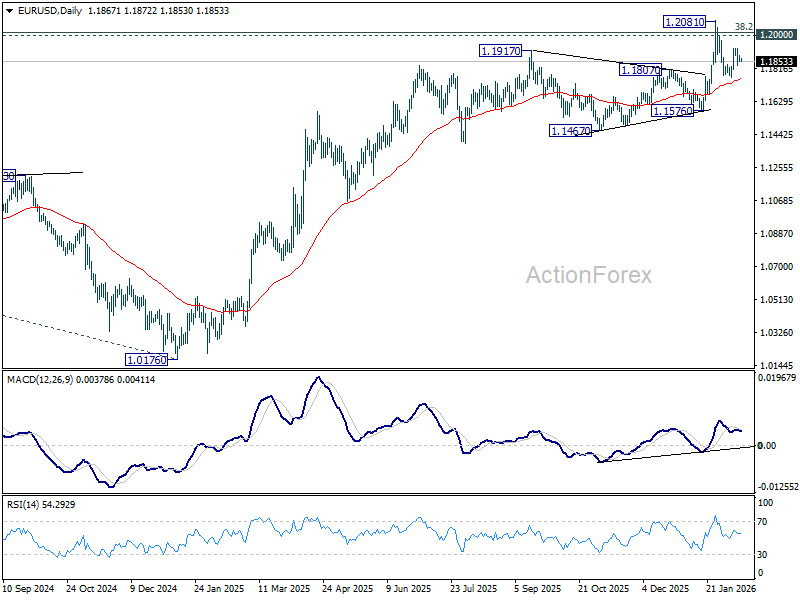
Intraday bias in EUR/USD stays neutral and outlook is unchanged. On the upside, above 1.1928 will target a retest on 1.2081 high. Decisive break there and sustained trading above 1.2 psychological level will carry larger bullish implications. On the downside, however, sustained trading below 55 D EMA (now at 1.1756) will raise the chance of reversal on rejection by 1.2, and target 1.1576 support for confirmation.
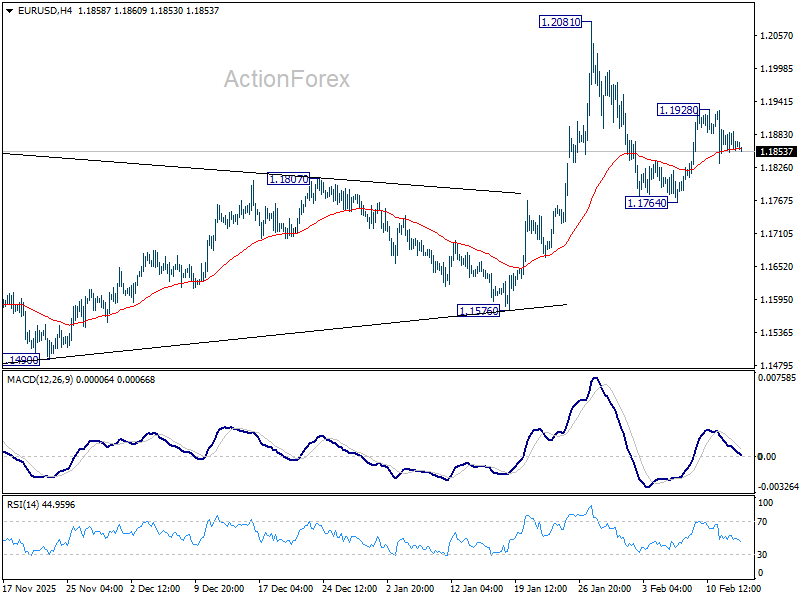
In the bigger picture, as long as 55 W EMA (now at 1.1470) holds, up trend from 0.9534 (2022 low) is still in favor to continue. Decisive break of 1.2 key psychological level will add to the case of long term bullish trend reversal. Next medium term target will be 138.2% projection of 0.9534 to 1.1274 from 1.0176 at 1.2581. However, sustained trading below 55 W EMA will argue that rise from 0.9534 has completed as a three wave corrective bounce, and keep long term outlook bearish.
GBP/USD Daily Outlook
Daily Pivots: (S1) 1.3595; (P) 1.3633; (R1) 1.3662; More...
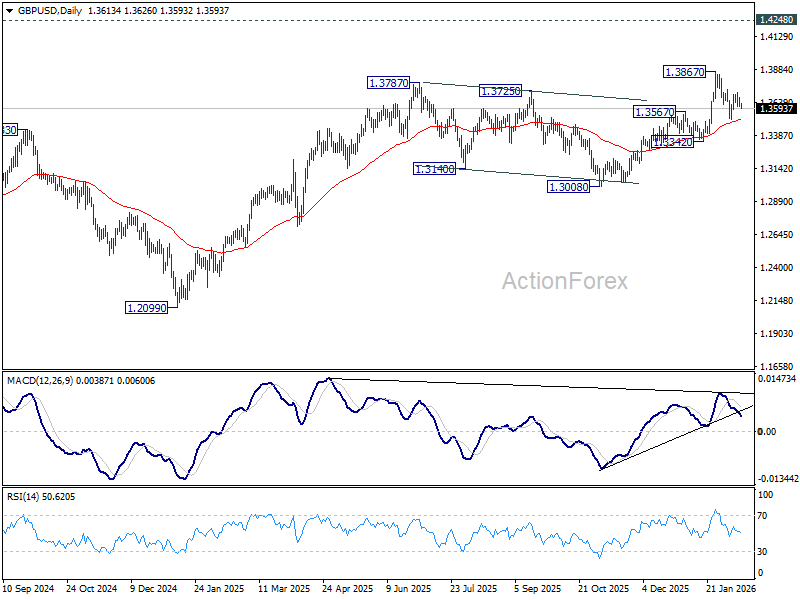
No change in GBP/USD's outlook as range trading continues. On the upside, firm break of 1.3732 will suggest that pullback from 1.3867 has completed as a correction at 1.3507. Retest of 1.3867 should be seen first. Firm break there will resume larger up trend towards 1.4284 key resistance. On the downside, however, sustained trading below 55 D EMA (now at 1.3509) will raise the chance of larger scale correction, and target 1.3342 support for confirmation.
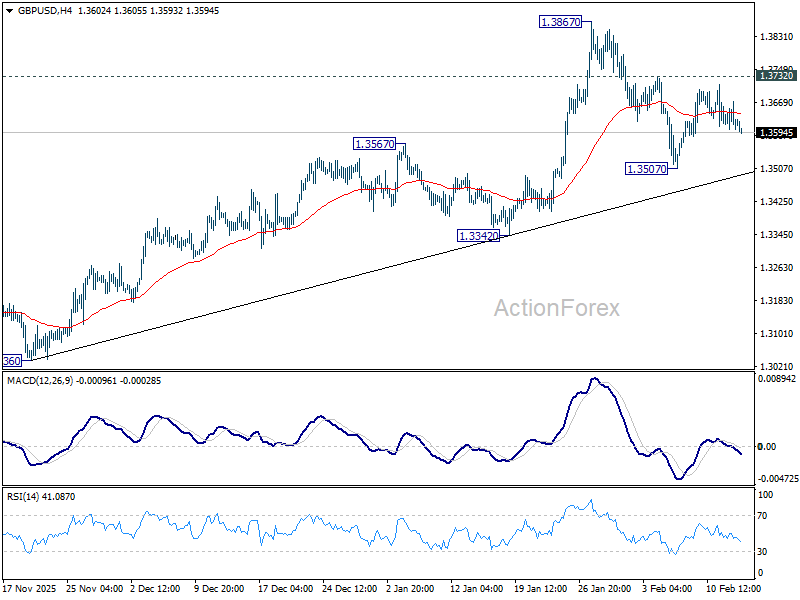
In the bigger picture, rise from 1.0351 (2022 low) is resuming by breaking through 1.3787 high. Further rally should be seen to 1.4284 key resistance (2021 high). Decisive break there will add to the case of long term bullish trend reversal. For now, outlook will stay bullish as long as 1.3008 support holds, even in case of deep pullback.
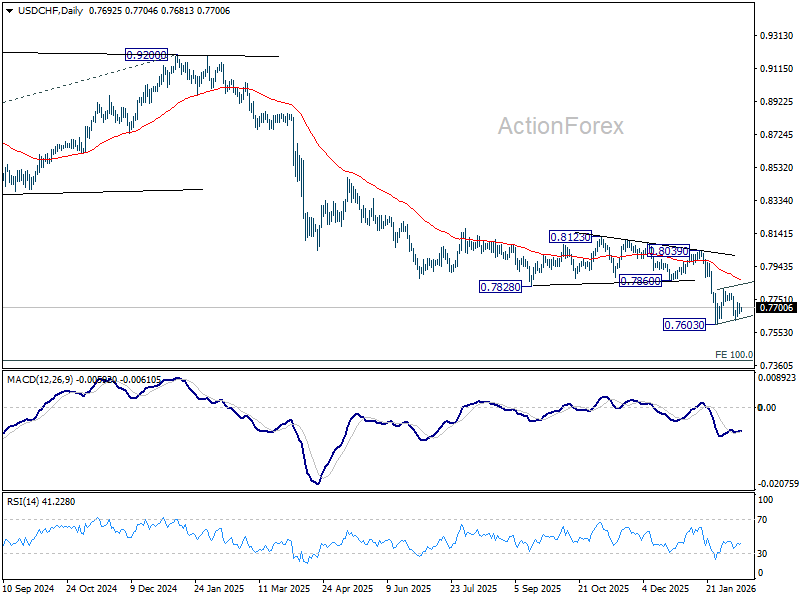
USD/CHF Daily Outlook
Daily Pivots: (S1) 0.7664; (P) 0.7695; (R1) 0.7722; More….
USD/CHF is extending consolidations from 0.7603 and intraday bias remains neutral. Strong rebound could be seen, but upside should be limited by 55 D EMA (now at 0.7862). On the downside, firm break of 0.7603 will resume larger down trend to 0.7382 projection level next.
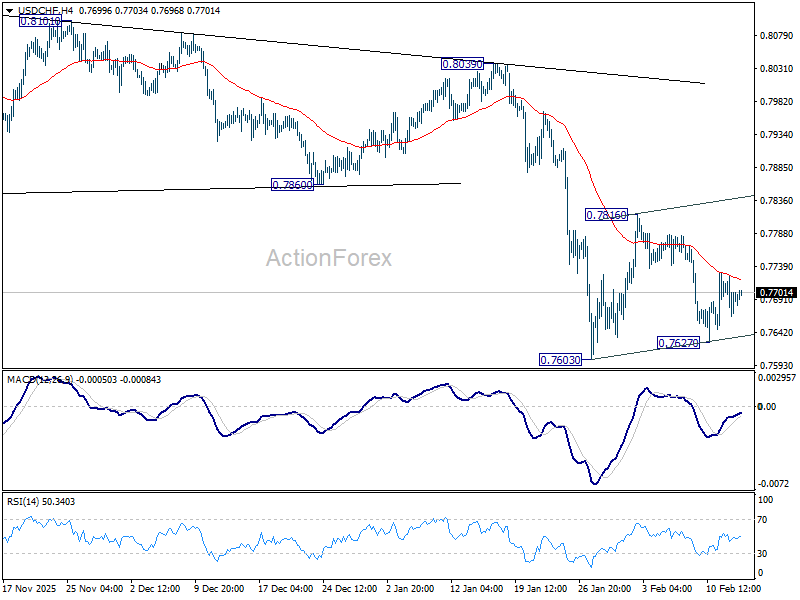
In the bigger picture, larger down trend from 1.0342 (2017 high) is still in progress. Next target is 100% projection of 1.0146 (2022 high) to 0.8332 from 0.9200 at 0.7382. In any case, outlook will stay bearish as long as 55 W EMA (now at 0.8152) holds.
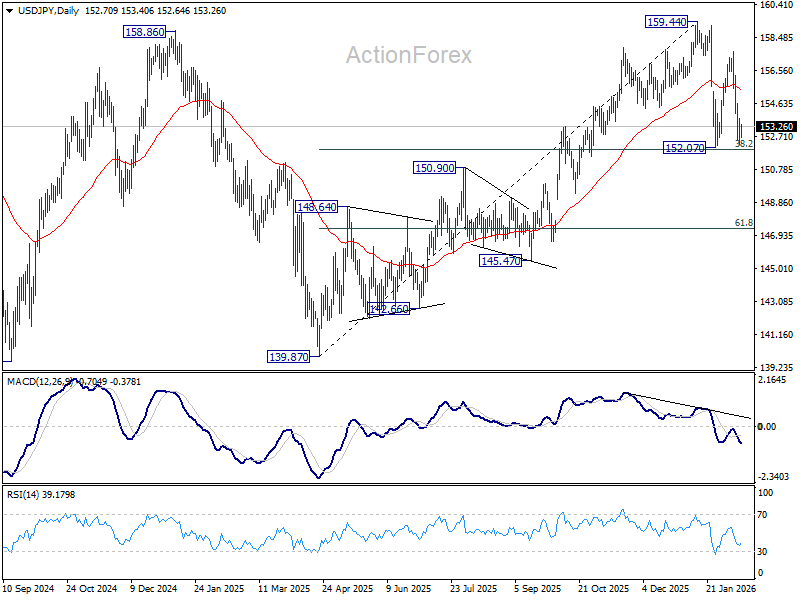
USD/JPY Daily Outlook
Daily Pivots: (S1) 152.34; (P) 153.49; (R1) 154.43; More...
Intraday bias in USD/JPY remains neutral for the moment. While another fall cannot be ruled out, strong support should be seen from 38.2% retracement of 139.87 to 159.44 at 151.96 to bring rebound. On the upside, sustained break of 55 4H EMA (now at 154.70) will bring stronger rebound towards 157.65. However, sustained break of 151.96 will argue that it's reversing the rise from 139.87 already. In this case, deeper fall should then be seen to 61.8% retracement at 147.34, and possibly below.
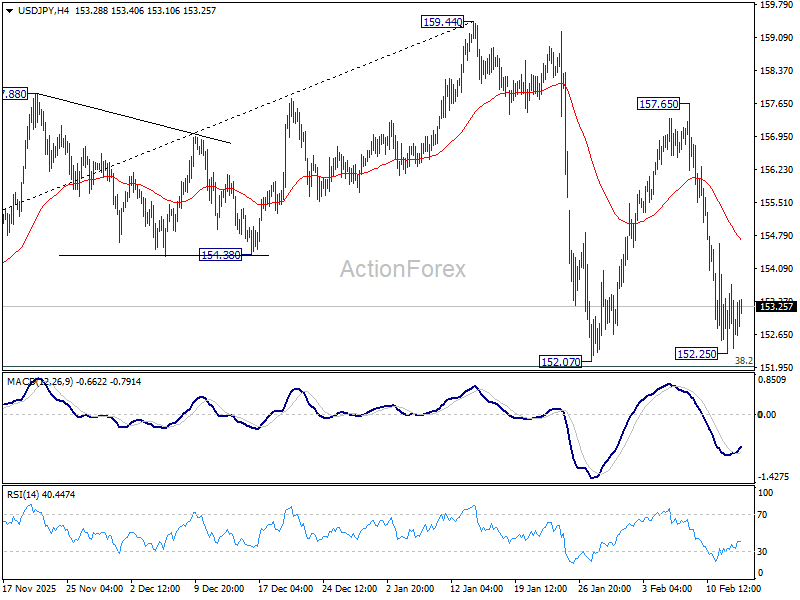
In the bigger picture, outlook is unchanged that corrective pattern from 161.94 (2024 high) should have completed with three waves at 139.87. Larger up trend from 102.58 (2021 low) could be ready to resume through 161.94. This will remain the favored case as long as 55 W EMA (now at 151.68) holds. However, sustained break of 55 W EMA will argue that the pattern from 161.94 is extending with another falling leg.