
Sample Category Title
BoE’s Pill warns disinflation incomplete despite projected CPI drop
BoE Chief Economist Huw Pill said UK underlying inflation remains around 2.5%. He emphasized that policy must continue to bear down on price pressures to ensure disinflation is sustained.
While headline inflation is projected to fall toward 2% in April or May, Pill noted that much of the expected decline reflects temporary effects from measures announced in Chancellor Rachel Reeves’ November budget. Stripping out that half-percentage-point impact, underlying price pressures remain firmer than the 2% target.
"In order to complete that (disinflation) process, monetary policy has a part of play and that means we do need to retain some restrictiveness in the stance of monetary policy until that process of disinflation is complete," Pill said.
Pill said monetary policy still carries a degree of restrictiveness, even if its exact magnitude has become "more ambiguous now". "Perhaps there’s more ambiguity about the extent of restriction than there is ambiguity about the incompleteness of the disinflation process to target," he added.
EUR/USD’s Next Move: Hot Inflation to 1.1785 or Cooling Jobs to 1.2000?
- EUR/USD is in a tight consolidation phase ahead of critical US macroeconomic data, marking its fourth consecutive day of subdued movement.
- The primary market focus is the US Consumer Price Index (CPI), with consensus forecasting a slight slowdown in January's headline and core inflation.
- The pair's direction depends on US data: hot CPI could push EUR/USD toward 1.1785, while signs of a cooling US labor market could see it retest 1.2000.
EUR/USD entered a phase of tight consolidation this morning as traders adopted a "wait-and-see" posture ahead of critical macroeconomic data.
After hitting weekly highs near 1.1928, the pair drifted lower to trade around the 1.1850–1.1870 region, marking its fourth consecutive day of subdued movement.
A barrage of European data releases failed to inspire a breakout this morning. According to EuroStat, the number of employed persons in the Euro Area rose by 0.2% from the previous quarter to 176.13 million in the final quarter of 2025, ahead of the market expectations of a 0.1% increase, according to a preliminary estimate.
It was the bloc's 19th consecutive period of employment growth, extending the slow but consistent trend of increasing jobs in the European labor market, despite concerns that a stronger euro would reduce orders for major employers.
Despite this, EUR/USD continued to coil this morning. Will the US CPI data be enough to bring EUR/USD out of its funk and stoke some volatility?
US dollar and CPI data to Play a Role?
One of the main reasons for Friday’s stagnation is the looming release of the U.S. Consumer Price Index (CPI). Investors are bracing for January inflation figures, which were delayed due to a brief partial US government shutdown earlier in the month. Consensus forecasts suggest:
- Headline Inflation: A slowdown to 2.5% YoY (from 2.7%).
- Core Inflation: A slight ease to 2.5% YoY (from 2.6%).
Beyond inflation, market sentiment was soured by renewed concerns over Artificial Intelligence (AI). Recent comments from industry leaders regarding AI’s potential to disrupt white-collar jobs within the next 18 months triggered a risk-off mood on Wall Street. This benefited the safe-haven US Dollar, exerting downward pressure on the Euro.
US CPI YoY
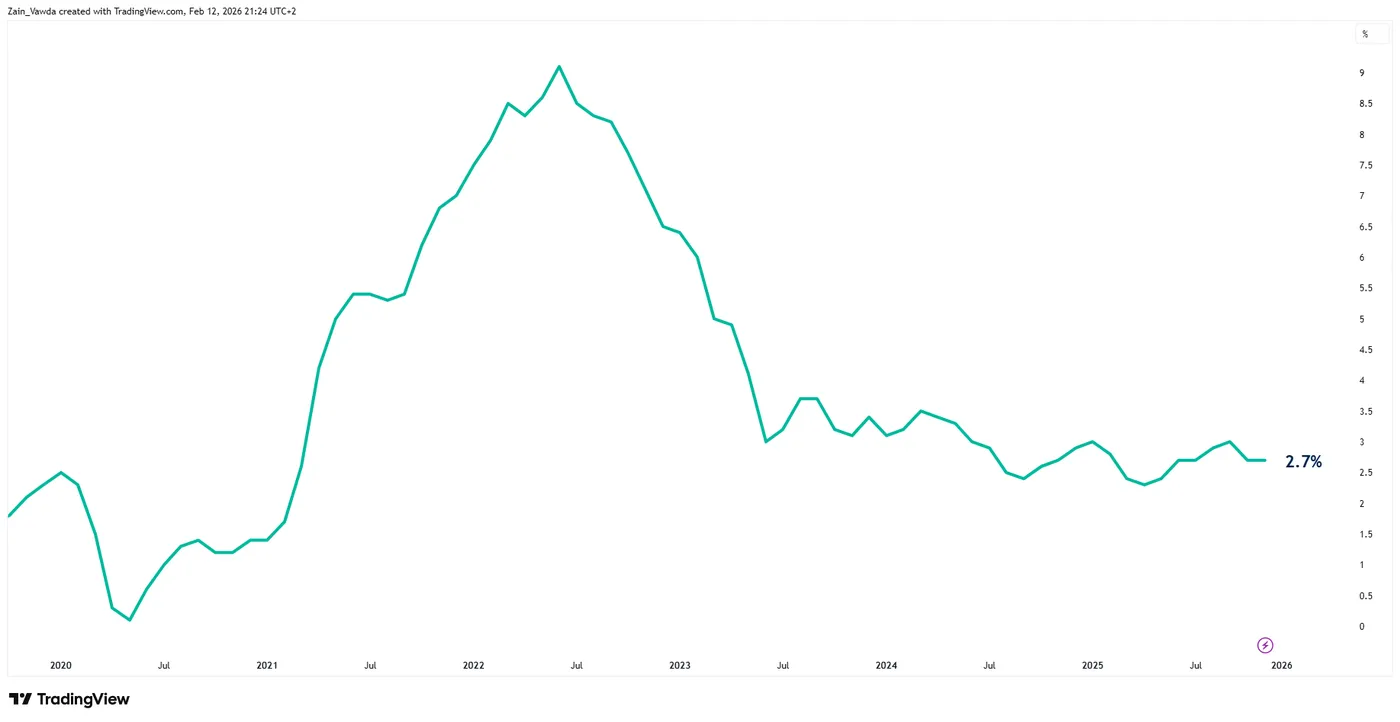
Source: TradingView
Looking Forward: What Will Move the Needle?
The path for EUR/USD will be dictated by two main factors:
Inflation Realities: If the U.S. CPI comes in "hotter" than expected, it will reinforce the Fed’s hawkish pause, likely pushing the pair toward the 1.1785 support level as rate-cut expectations for June are pushed back.
Once the inflation print is out of the way, markets will continue to focus on the US labour market.
Labor Market Strength: While January’s Nonfarm Payrolls were strong, rising jobless claims (reaching 227K this week) suggest underlying cracks. Any further signs of a cooling U.S. labor market could weaken the Dollar and allow the Euro to retest the 1.2000 psychological barrier.
Technical Analysis on EUR/USD
From a technical perspective, EUR/USD is on a four-day losing streak after peaking just above the 1.1900 handle.
As long as bulls keep EUR/USD above the swing low at 1.1769, the momentum remains in favor of the bulls.
The period-14 RSI also remains above the 50 handle which hints at bullish momentum.
A break below this level may still struggle to gain traction as a host of key support areas rest below.
First will be the 1.1700 region with the 100-day MA resting just below at 1.1682. This region could prove a tough nut to crack especially given the narrative around the US dollar.
However, if risk sentiment remains fragile and we get a hot CPI print, then we could see a break of this key support zone and test the trendline.
EUR/USD Daily Chart, February 13, 2026
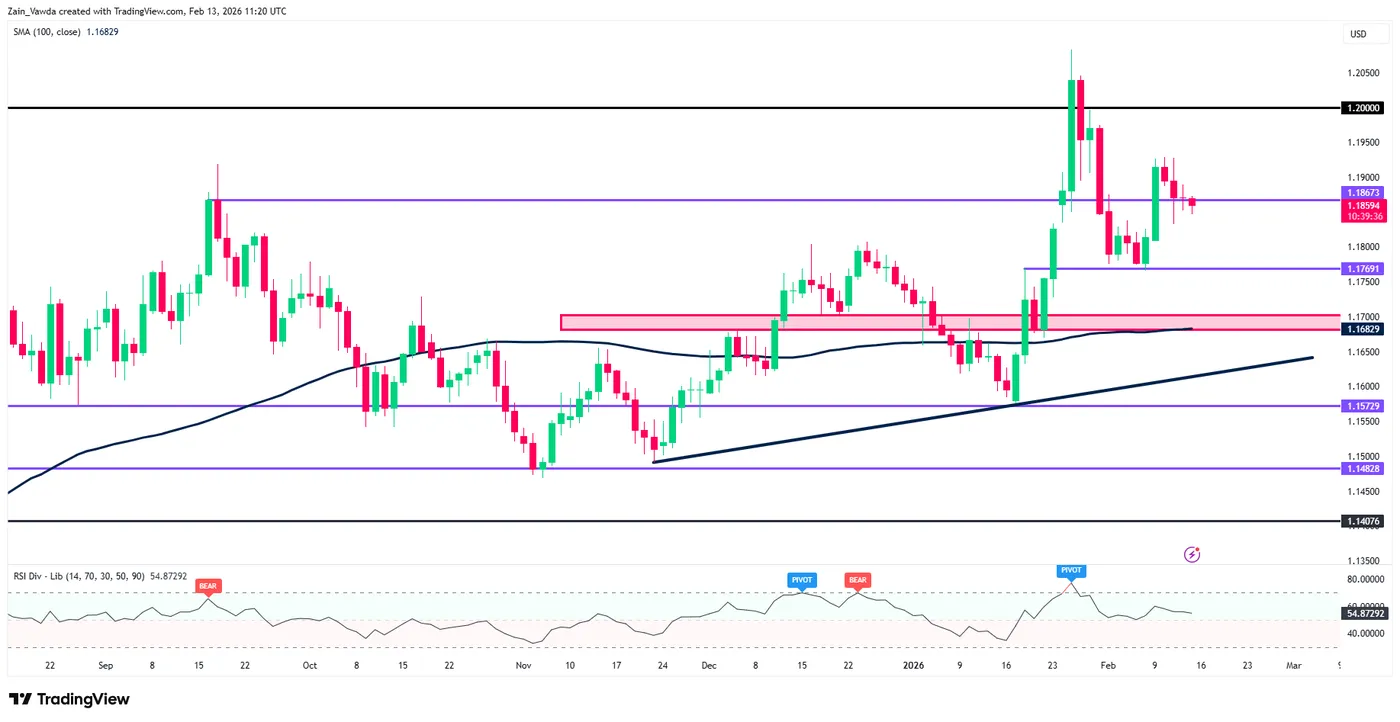
Source: TradingView.com
Safe Trades.
EUR/USD Consolidates Ahead of US Inflation Data
EUR/USD ended the week at 1.1868, remaining within a narrow sideways range for the fourth consecutive session. The market has adopted a wait-and-see approach ahead of the release of January's US consumer price index. The report could influence expectations for Federal Reserve policy.
Forecasts suggest a slowdown in headline inflation to 2.5% year-on-year from 2.7%, while core inflation is expected to ease to 2.5% from 2.6%.
Earlier in the week, strong employment data confirmed the resilience of the labour market, although recent jobless claims came in higher than expected. Investors are now pricing in rates remaining unchanged in March, followed by two 25-basis-point cuts in the second half of the year, in June and September.
The broader backdrop for EUR/USD remains clear: most Fed officials have adopted a wait-and-see stance and are not ready to resume rate cuts imminently. Despite previous easing and the current rate range of 3.50-3.75%, inflation remains below 3%, and the economy continues to demonstrate stability. January's employment data only strengthens the case for a pause.
While some Fed policymakers support further easing, they remain in the minority. The market is shifting expectations for the first cut closer to July. For EUR/USD, this maintains structural support for the dollar. The pair's next move will depend on inflation and signs of a real cooling in the US economy.
Technical Analysis
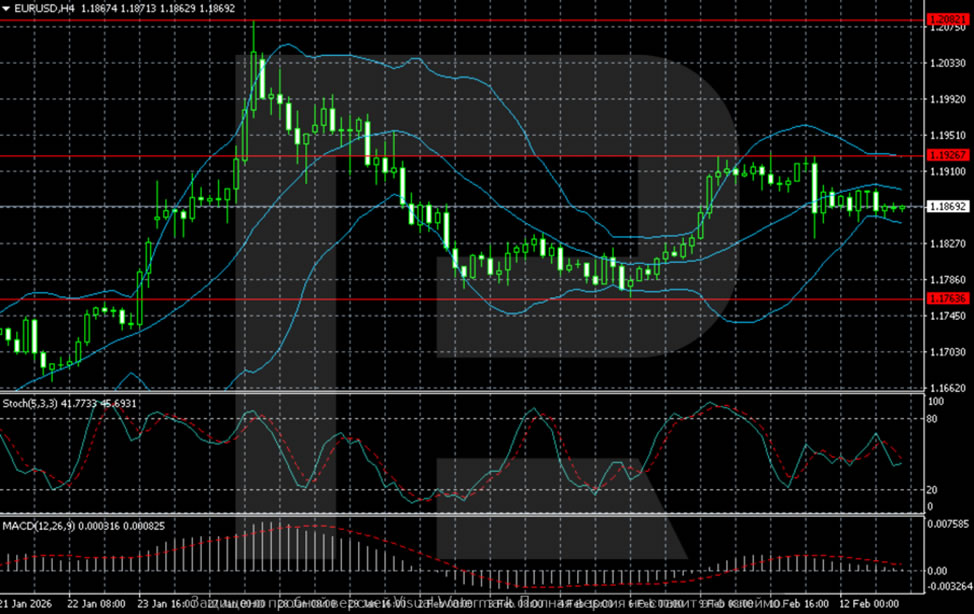
On the H4 chart, EUR/USD remains in a sideways consolidation phase following January's upward momentum. The price is held within the 1.1785-1.1930 range and is currently trading near 1.1870. Bollinger Bands have narrowed, signalling declining volatility. The MACD is hovering near the zero line, indicating weak momentum, while the Stochastic oscillator remains neutral, without a clear directional signal. The market is trading in the middle of the range.
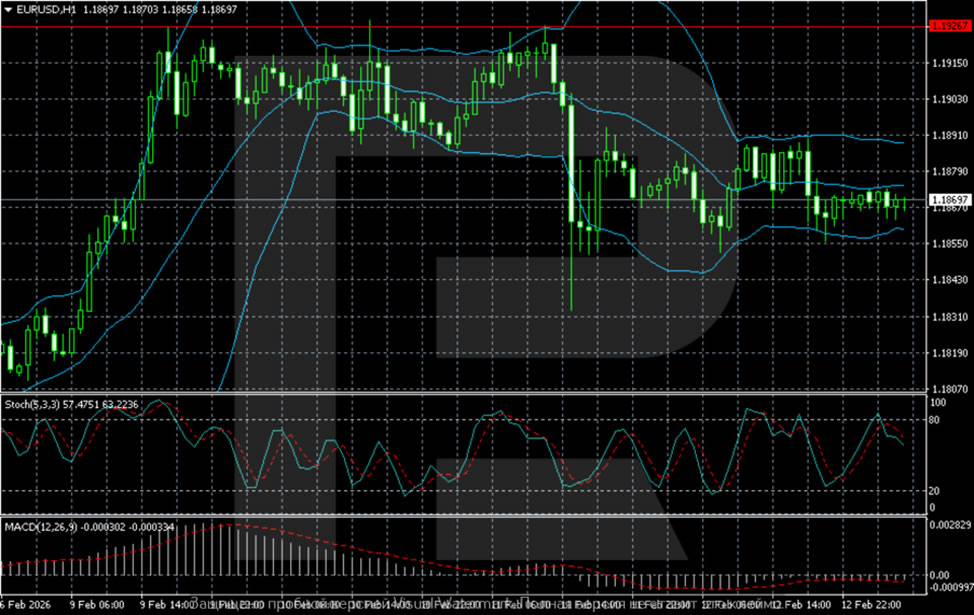
On the H1 chart, price action reflects a tight consolidation with occasional volatility spikes. Buyers quickly absorbed the latest downward move, but attempts to break above 1.1925 have failed. The price has stabilised near the midline of the Bollinger Bands. The MACD remains close to zero, and the Stochastic oscillator is turning lower in neutral territory. In the near term, range trading remains the preferred strategy.
Conclusion
In summary, EUR/USD remains in a state of consolidation, trapped in its narrowest range in weeks as markets await the crucial US inflation report. The pair is caught between two opposing forces: resilient US economic data and delayed Fed easing expectations (supporting the dollar), versus a relatively hawkish ECB stance and already priced-in policy divergence (supporting the euro).
Technically, compressed volatility and neutral indicators signal a breakout may be approaching, but its direction will depend entirely on tonight's CPI outcome. A hotter-than-expected inflation reading would likely push the pair towards the lower boundary at 1.1785, while softer inflation could trigger a retest of resistance near 1.1930. Until then, the range remains the game.
Chart alert: Dow Jones (DJIA) Potential Recovery at 20-Day MA Support, Bulls Need to Break Above 49,940
Key takeaways
- Dow pulls back after fresh highs: The Dow Jones hit a new all-time high near 50,335 but has since slipped back toward its 20-day moving average as broader US indices post week-to-date losses, led by renewed weakness in technology stocks.
- Tech drag, defensives hold firm: The sell-off was driven mainly by the tech sector, with Cisco plunging 12%, while defensive sectors such as Consumer Staples and Utilities outperformed.
- Recovery hinges on key levels: Holding above 49,265 support keeps the rebound scenario alive, with a break above 49,940 opening room to retest record highs; failure below support risks a deeper pullback toward the 50-day moving average near 48,900/48,710.
This is a follow-up analysis and an update of our prior report, “Dow Jones (DJIA) Forecast: Eyeing new all-time high as banks’ earnings loom”, published on 13 January 2026.
Since our last analysis, the Dow Jones Industrial Average has managed to scale a fresh all-time high in February and hit our highlighted resistance of 50,265/50,335.
US stock indices are the worst performers so far this week
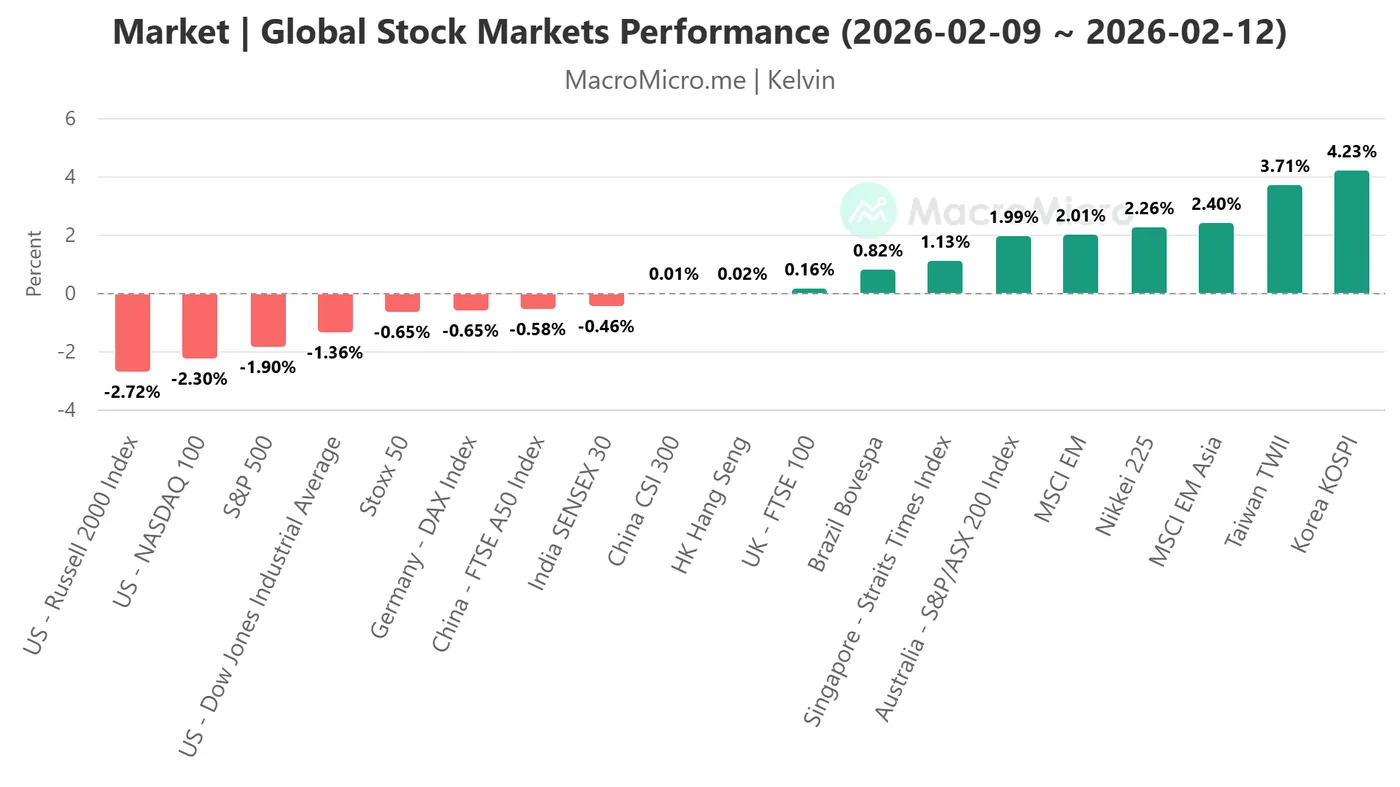
Fig. 1: Global stock indices week-to-date performances as of 12 Feb 2026 (Source: MacroMicro)
The US stock market is on track to end the week on a weaker footing, where all four major US benchmark stock indices have recorded week-to-date losses as of Thursday, 12 February 2026; Dow Jones Industrial Average (-1.4%), S&P 500 (-1.9%), Nasdaq 100 (-2.3%), and small-caps Russell 2000 (-2.7%) (see Fig. 1).
Yesterday’s opening hours gains at the start of the US session evaporated and transformed into an almost broad-based selling across the board, except for the defensive sectors in the S&P 500 that bucked against the bearish trend; Consumer Staples (+1.4%) and Utilities (1.2%).
The main catalyst for the weak performance has been renewed weakness seen in the technology stocks; the S&P 500 Technology sector was the worst performing sector on Thursday (-2.6%), dragged down by Cisco Systems, which plummeted by 12%, its worst single day drop in nearly four years, with its warning that higher memory costs will be adversely affect its profit margins.
The short-term technical chart of the US Wall Street 30 CFD Index (a proxy of the Dow Jones Industrial Average futures) is now showing some signs of stabilization after yesterday’s sell-off.
Let's examine the short-term trajectory of the US Wall Street 30 CFD Index and its supporting elements.
Short-term trend (1 to 3 days): Potential recovery at 20-day moving average
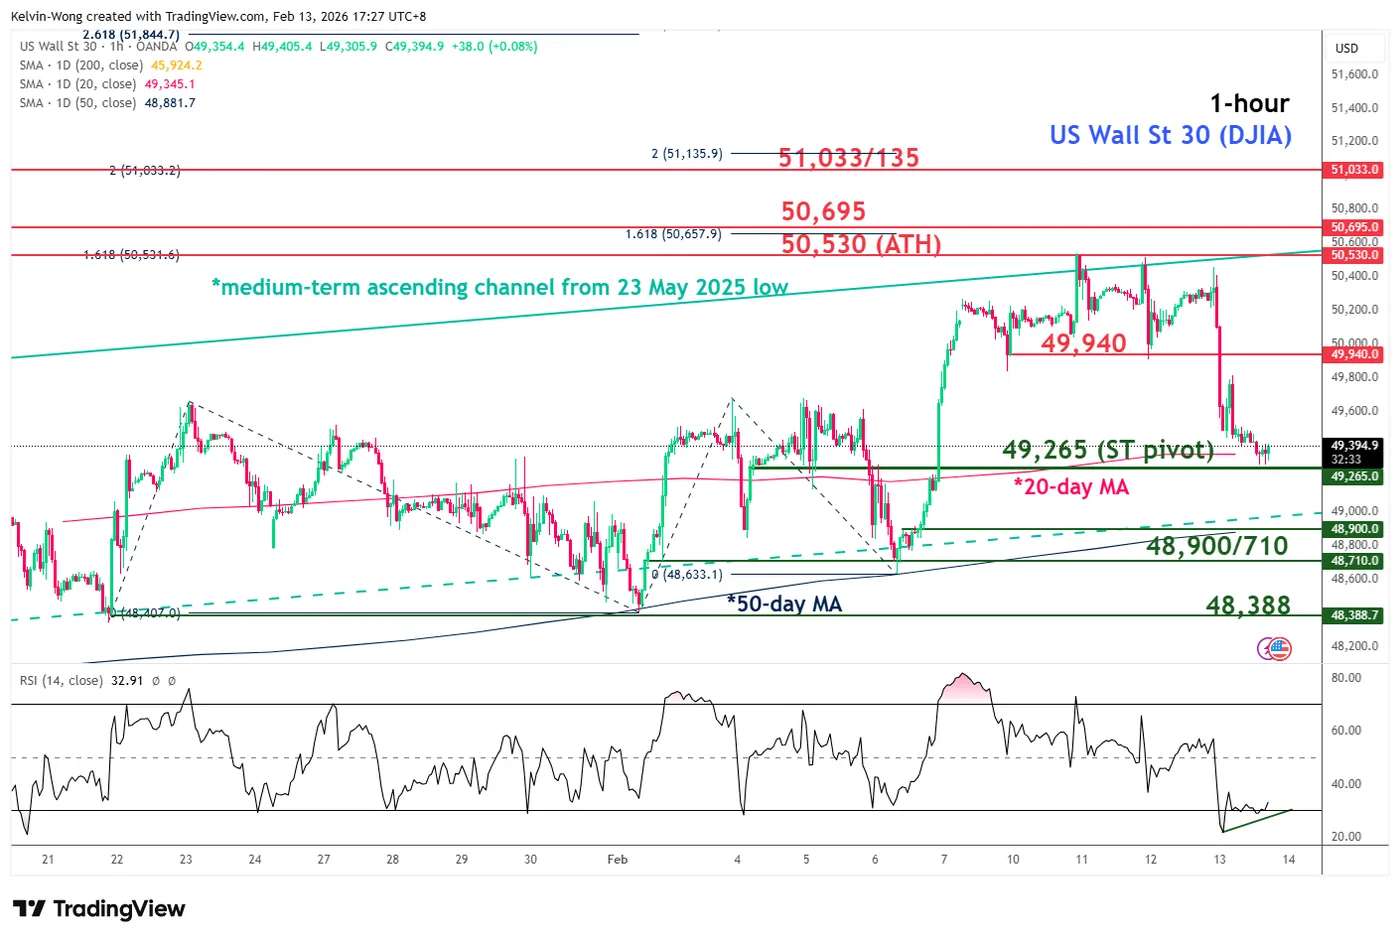
Fig. 2: US Wall Street 30 CFD index minor trend as of 13 Feb 2026 (Source: TradingView)
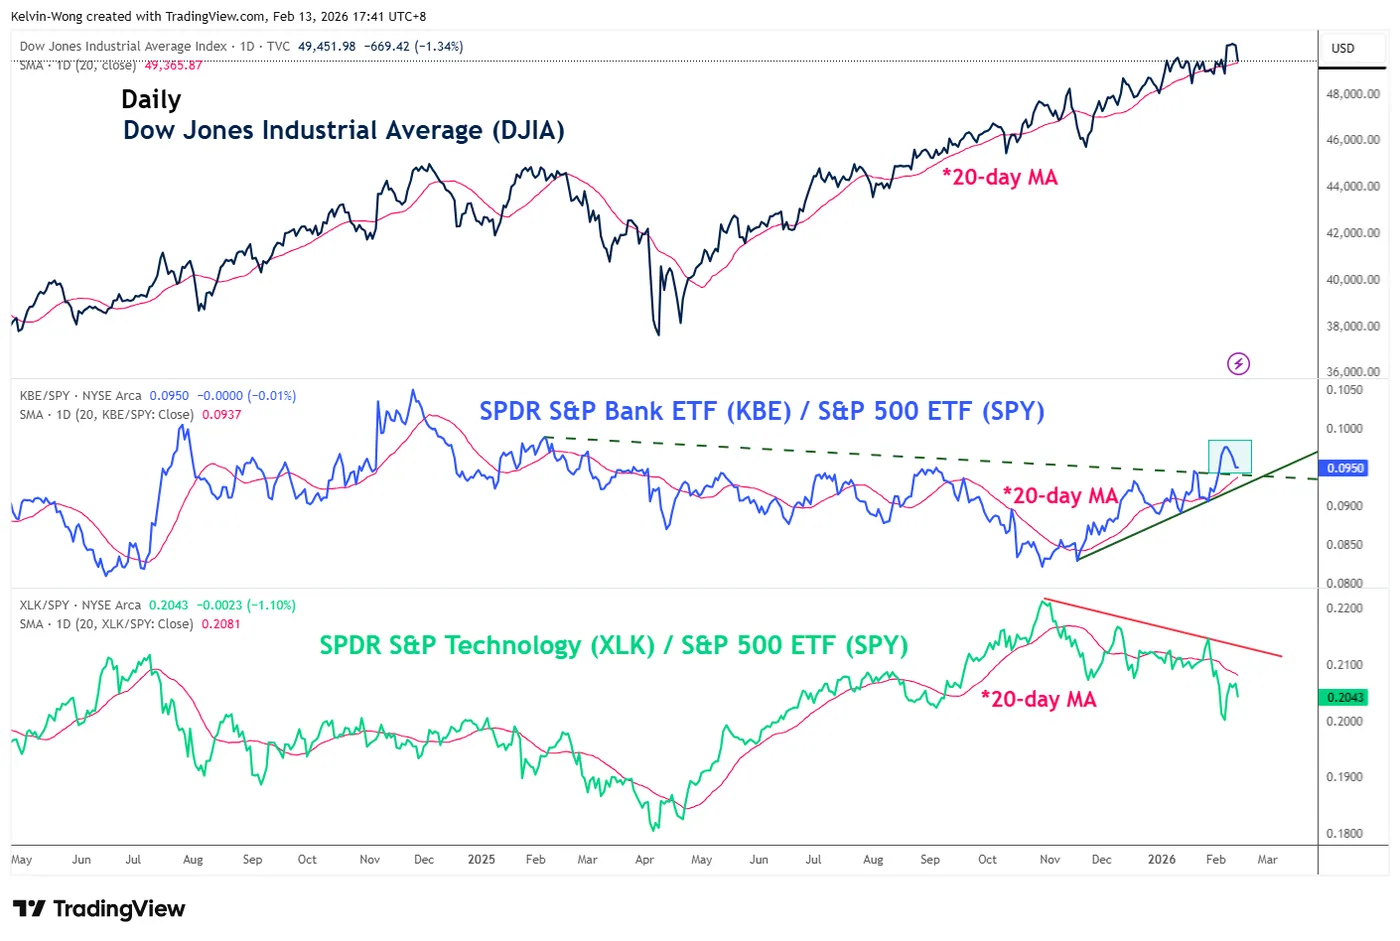
Fig. 3: Ratio chart of S&P Banks ETF over S&P 500 ETF as of 12 Feb 2026 (Source: TradingView)
Watch the 49,265 key short-term pivotal support on the US Wall Street 30 CFD Index, and clearance above 49,940 upside trigger level increases the chances of the recovery to retest the current all-time high area of 50,530 printed on 10 February 2026, before the next intermediate resistance comes in at 50,695 (Fibonacci extension) (see Fig. 2).
On the flip side, a break below 49,265 invalidates the bullish scenario for a deeper minor corrective decline to extend further towards the next intermediate support at 48,900/48,710 (also the 50-day moving average) in the first step.
Key elements to support the short-term bullish bias
- The hourly RSI momentum indicator of the US Wall Street 30 CFD index has flashed out a bullish divergence condition at its oversold region (see Fig. 2).
- The US financial sector, with a weightage of around 28%, is the largest weighted component in the Dow Jones Industrial Average (DJIA).
- The ratio chart of the SPDR S&P Bank ETF over the S&P 500 ETF has traded above a key ascending support since 17 November 2025, which suggests the medium-term outperformance of US banks remains intact, in turn, supporting a recovery on the US Wall Street CFD index at this juncture (see Fig. 3).
Why CPI Release Matters for the Price of Bitcoin
The previous Consumer Price Index (CPI) report was published on 13 January and had a significant impact on Bitcoin’s price. As the BTC/USD chart shows:
- → shortly after the release, the price surged aggressively to the 14 January peak;
- → it then reversed sharply lower (a sign of a bull trap), creating a bearish outlook — which we highlighted on 21 January;
- → subsequently, it broke through multi-month support and entered an accelerated decline towards the $60k area.
For this reason, today’s US inflation report (16:30, GMT+3) is drawing close attention across multiple markets, as it may have a substantial effect on both the dollar and traders’ appetite for risk assets, including Bitcoin.
Technical Analysis of the BTC/USD Chart
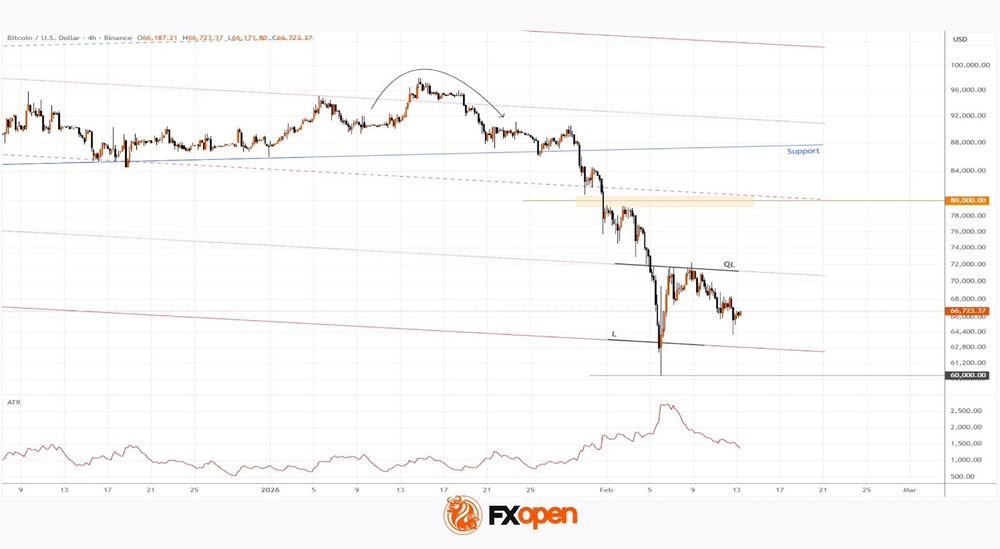
Bitcoin’s price swings have formed a descending channel, shown in red. Within this framework:
- → the lower boundary (L) appears to be key support. When the price dipped below it on 6 February, aggressive buyers stepped in, resulting in a candle with a long lower shadow;
- → the QL line, which divides the lower half of the channel into two sections, is acting as resistance — as reflected in price action on 9 February.
The ATR indicator is trending lower, signalling declining volatility, which suggests the market is awaiting important news. Higher inflation is generally seen as a factor that could delay interest rate cuts, strengthen the dollar and bond yields, and weigh on BTC/USD. Conversely, softer inflation would be supportive for cryptocurrencies.
If the CPI release does not produce major surprises, Bitcoin may continue to trade within the broad L–QL range.
FXOpen offers the world's most popular cryptocurrency CFDs*, including Bitcoin and Ethereum. Floating spreads, 1:2 leverage — at your service (additional fees may apply). Open your trading account now or learn more about crypto CFD trading with FXOpen.
*Important: At FXOpen UK, Cryptocurrency trading via CFDs is only available to our Professional clients. They are not available for trading by Retail clients. To find out more information about how this may affect you, please get in touch with our team.
This article represents the opinion of the Companies operating under the FXOpen brand only. It is not to be construed as an offer, solicitation, or recommendation with respect to products and services provided by the Companies operating under the FXOpen brand, nor is it to be considered financial advice.
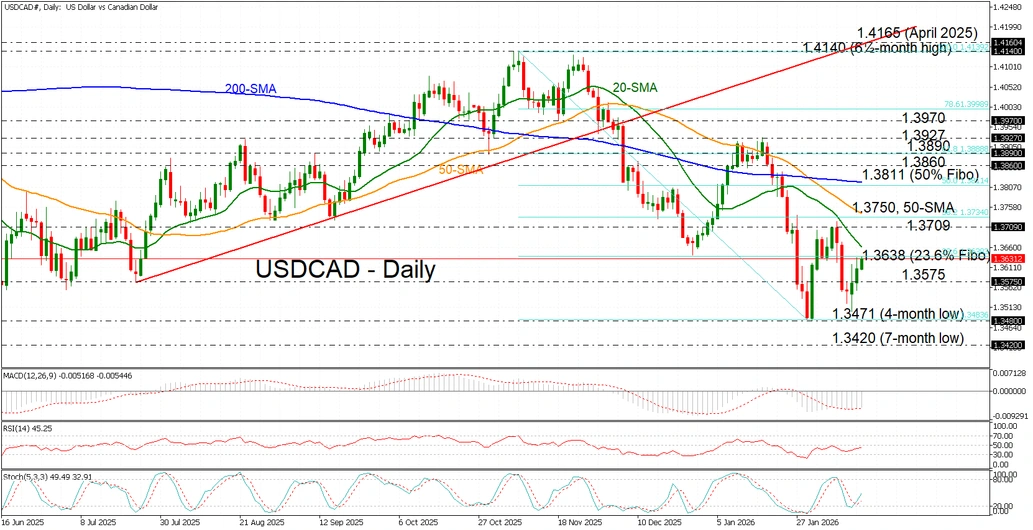
USD/CAD Extends Three‑Day Climb Back to 1.3600
- USD/CAD edges higher but remains bearish in the long term.
- Technical oscillators show early signs of upside appetite while still in negative territory.
USD/CAD is extending its three‑day rebound, climbing back above 1.3600 as broad US dollar strength combines with persistent pressure on the Canadian dollar amid ongoing uncertainty and rising unease surrounding US-Canada trade relations.
If upside momentum continues and price closes above initial resistance at the 23.6% Fibonacci retracement of the November-January pullback at 1.3638, along with the 20‑day simple moving average (SMA) just above at 1.3644, the pair could advance toward a retest of the monthly highs near 1.3709, followed by the 1.3750-1.3811 region, which encapsulates the “death cross” between the 50‑ and 200‑day SMAs.
Despite the latest advance, also reflected in indicators showing tentative upward attempts, momentum signals remain broadly negative. The stochastics are attempting a bullish crossover between the %K and %D lines, the RSI is sloping upward toward the neutral threshold, and the MACD is edging above its red signal line while still below zero. This combination suggests that although bullish attempts are emerging, the broader technical picture remains vulnerable, especially with the pair still trading well below the long-term ascending trendline.
If the bearish pressure resumes, the pair could retreat toward 1.3575, followed by 1.3471, taken from the October lows, and then the seven-month low near 1.3420.
To sum up, downside momentum is easing, but with key resistance levels approaching and indicators still in negative territory, USDCAD’s upside may soon stall.
Nasdaq 100 May Retest This Year’s Low
As the chart of the Nasdaq 100 index (US Tech 100 mini on FXOpen) shows, bearish sentiment currently dominates the equity market. Yesterday, the technology index fell by around 2%.
Why Is the Nasdaq 100 Declining?
According to media reports, developments linked to the expansion of AI are weighing on the market:
- → Major technology firms are sharply increasing capital expenditure on infrastructure, yet there is little clarity on when these investments will begin to generate returns. For instance, Google issued bonds this week, including 100-year debt.
- → The impact of AI on traditional business models, particularly companies operating in the software sector.
Technical Analysis of the Nasdaq 100 Chart
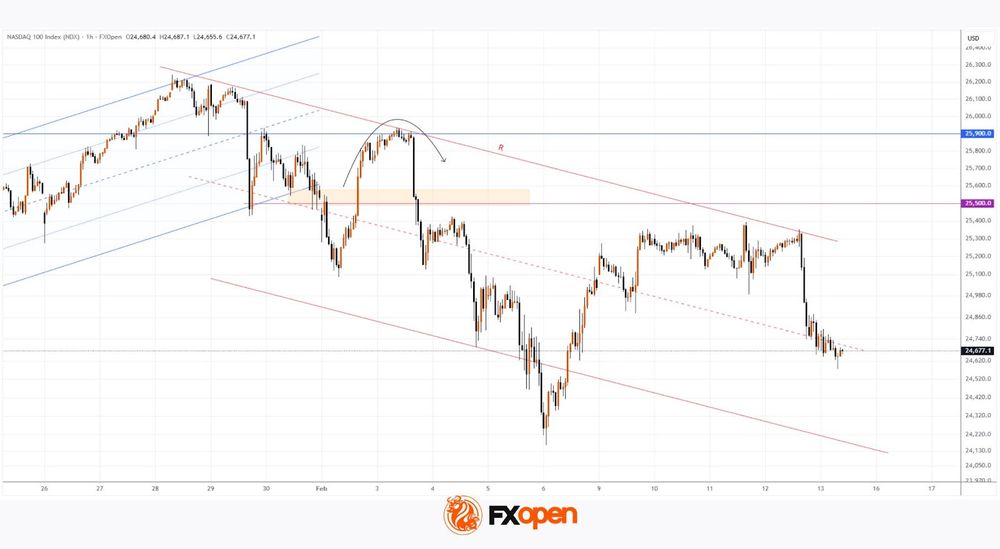
When analysing Nasdaq 100 price action (US Tech 100 mini on FXOpen) on 2 February, we:
- → identified a resistance zone (highlighted in orange) and marked the key 25,900 resistance level;
- → noted that bears had taken the initiative and suggested they would need to maintain control around the 25,500 area — where the ascending channel had previously been broken.
Since then, bulls managed to break above this zone, but only briefly, testing the 25,900 level. As indicated by the arrow, the move was short-lived and prices soon fell back below, signalling the bulls’ inability to sustain upward momentum.
A sequence of lower highs has allowed a descending trend line (R) to be drawn. If the consolidation that began last evening reflects a temporary balance between supply and demand, a median line can be plotted, with a lower channel boundary beneath it.
Under a continued downward trend scenario, this configuration points to the potential for the Nasdaq 100 to set a fresh low for the year. Whether this outlook materialises will largely depend on US inflation data. The CPI report is due for release today at 16:30 (GMT+3). Traders should be prepared for heightened volatility.
Trade global index CFDs with zero commission and tight spreads (additional fees may apply). Open your FXOpen account now or learn more about trading index CFDs with FXOpen.
This article represents the opinion of the Companies operating under the FXOpen brand only. It is not to be construed as an offer, solicitation, or recommendation with respect to products and services provided by the Companies operating under the FXOpen brand, nor is it to be considered financial advice.
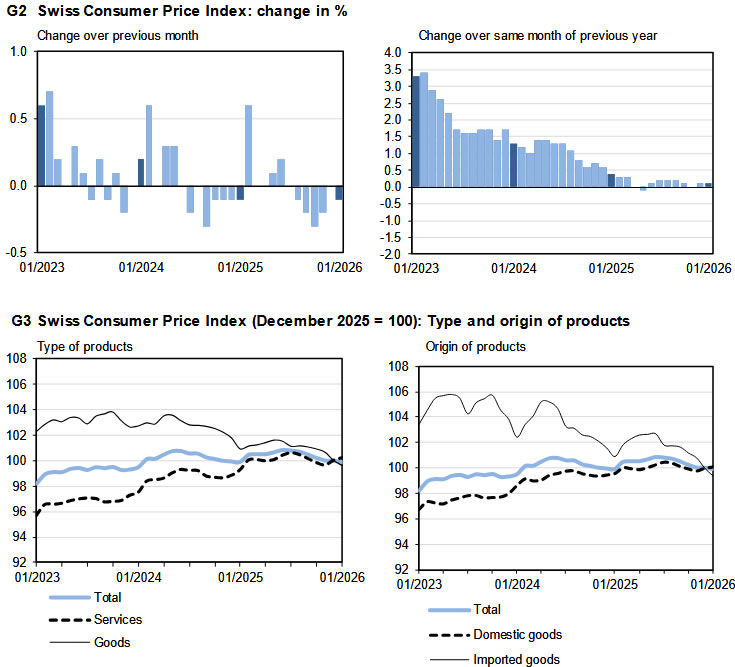
Swiss CPI flat as imported prices drag
Switzerland’s consumer prices slipped -0.1% mom in January, undershooting expectations for a flat reading. The decline was largely driven by a -0.6% drop in imported product prices, while domestic prices edged up 0.1% on the month. Core CPI, which excludes fresh and seasonal products, energy and fuel, rose 0.1%, suggesting limited underlying pressure.
On an annual basis, headline inflation held steady at 0.1% yoy, in line with expectations. Core inflation was unchanged at 0.5%, with domestic product prices also steady at 0.5% from a year earlier. The data point to a subdued price environment, with limited momentum building in domestic costs.
Imported prices remained a key drag, falling -1.5% year-on-year compared with a -1.6% decline previously. The stronger Swiss Franc and softer external price dynamics continue to suppress imported inflation, keeping overall price growth well below levels seen elsewhere in Europe.
USD Fails to Capitalize on Yesterday’s Soured Mood
Markets
Risk averse US investors yesterday upended an otherwise calm, stoic trading session. Equity markets suffered declines from 1.3-2% with tech (valuation) worries flaring up again. Technicals favoured some return action as well with the likes of the S&P500 trading near a record 7k but lacking catalysts for a clean break higher. Core bonds enjoyed a defensive bid led by Treasuries. US rates fell between 5.5 and 8.8 bps, erasing much if not all of the rebound in the wake of Wednesday’s stronger-than-expected payrolls. Long-term Treasuries extended gains after a strong 30-yr auction. German yields shed no more than 1.3 bps at the belly of the curve but are set for more losses at today’s open in a catch-up with the US. European leaders at yesterday’s informal summit agreed on the urgency of making the bloc more competitive and reducing dependencies in strategic sectors. But we’ll have to wait for concrete measures on how to deepen the single market and unlock idle private capital until the next meeting in March. Ahead of this informal gathering, French president Macron again floated the idea of more joint EU debt in sectors such as AI and quantum computing, the energy transition and defence. But that met resistance from Germany. Oil prices retreated too, perhaps helping the core bond recovery, amid growing hopes the US may reach a diplomatic solution with Iran. Brent fell from just south of $70 to around $67.5. The USD failed to capitalize on yesterday’s soured mood. EUR/USD and DXY steadied at 1.1871 and just below 97. Japanese assets are market darlings this week with USD/JPY nearing the YtD low and long-term bonds rallying. The 40-yr yield tumbled another 8 bps, bringing the tally this week so far at -20 bps. JGBs sought to extend gains towards the 2026 highs in Asian dealings this morning but signs of exhaustion are emerging. Stock markets in the region trade fragile following the declines on WS yesterday. Overall cautiousness is expected to hold going into today’s US CPI release and ahead of what is going to be a long weekend for US investors (President’s Day on Monday). KBC’s nowcast for January inflation currently stands at 2.35% headline and 2.43% core. Last month’s decline in used car prices in month on month terms is not expected to continue but may still fall by more than half a percent in annual terms. Food prices continue to benefit from lower producer prices, and we expect a rise of 2.9%. We believe energy prices will decline by half a percent m/m, resulting in a 0.35% y/y increase. All this compares to consensus expectations of 0.3% monthly and 2.5% annually for both headline and core CPI. Speaking in risks, if any, we are particularly mindful of upside surprises with annual repricing in the services sector potentially being an underestimated factor. That would likely be detrimental for stock markets and trigger a kneejerk upleg in US yields. The US dollar should also strengthen though the post-payrolls reaction suggested it requires a big enough upside surprise.
News and views
The Czech National Bank (CNB) published the transcript of an conversation of governor Michl at the University of Chicago on its website yesterday. The CNB governor assessed that in the period before Covid, the central bank rate was below inflation. That motivated people to spend. CNB also actively weakened the koruna and increased the amount of money all contributing higher core inflation. CNB from 2022 changed the logic from motivating people to spend to motivating them to save. This resulted in a higher for longer rate policy and CNB also switched to a strong koruna policy. Michl assesses that ‘high inflation can still return in Europe, with a sharp rise in public debt the main risk. That’s why central banks should remain strict: keep the policy rate above inflation, support saving, and remind people that the economy is not only about spending’. Regarding current policy, inflation is 1.6% and the CNB outlook is around 2%. However, core inflation stays around 3%. If momentum in core inflation declines, there might be room to cut rates, but CNB still will keep the policy rate higher for longer compared with the pre-Covid period. Otherwise, all options remain open.
The Reserve bank of New Zealand published its Q4 expectations survey. Inflation expectations at all forecast horizons rose. Expectations for the 1-year-ahead annual CPI increased by 20 bps 2.39% to 2.59%. For 2-y ahead inflation expectations by 9 basis points from 2.28% to 2.37%. 10-year ahead inflation expectations increased 12 bps to 2.30%. 1-y ahead unemployment expectations eased from 5.01% to 4.95%. Expectations for annual real GDP growth were 2.03% and 2.30% for the one- and two-year-ahead time horizons, respectively. Even as some of the components were a bit mixed, the overall rise in inflation expectations might cause the RNBZ to take a somewhat more hawkish approach at next week policy meeting. RBNZ is expected to keep the policy rate at 2.25% but survey respondents see to be raised toward 2.58% by end of year 2026.
Who’s Next?
Wall Street had an ugly session on Thursday. Technology was responsible for most of the losses, but not for the same reasons. Cisco plunged 12% after warning that rising memory chip prices could squeeze margins, pulling the Nasdaq 100 down roughly 2%. The Magnificent 7 fell about 2.3%, while the broader Nasdaq Composite dropped close to 2%.
The software selloff continued at full speed, with the iShares Expanded Tech-Software ETF falling as much as 3.5% intraday and now trading more than 30% below its September peak.
Logistics companies joined the AI Angst Selloff after another startup, Algorhythm Holdings — formerly a karaoke company (!!) — announced that it helps customers scale freight volumes by 300% to 400% without a parallel increase in headcount. Its shares surged 12% to $1.50 — still dramatically below their early-2000s peak above $3’300! The SPDR S&P Transportation ETF fell nearly 4%. Russell 3000’s trucking index fell nearly 8%.
And there is more to this story.
According to Morningstar’s PitchBook, the volume of distressed loans backing software companies — defined as loans trading below 80 cents on the dollar — doubled in January.
The market appears to be pricing in a future where generative AI models such as Anthropic’s Claude and similar tools disrupt – and kill - traditional SaaS (software-as-a-service) models. That may be an extreme interpretation.
Yes, easier coding and AI-assisted development will increase competition. Software companies could see margins pressured, and consolidation through M&A is likely.
But ultimately, many companies are likely to integrate AI into their existing SaaS offerings rather than be replaced by it. As PitchBook notes: “replacing a core SaaS platform is effectively open-heart surgery for an enterprise”, it may not be the future for everyone. That argument carries weight.
So the selloff may be justified to some extent — but it could also be overdone.
What’s next? Could we see McDonald’s caught up in AI-driven angst because robots replace workers?
But as we know, markets tend to overshoot before stabilizing.
The key question is whether this “SaaS-pocalypse” remains contained or spreads more broadly.
If stress remains largely limited to software and tech, the likely outcome is continued rotation — toward non-tech and non-US markets. That rotation has been underway for several months and looks more like reshuffling than systemic breakdown.
But if distress spreads further — and the weakness across logistics stocks is a red flag — the AI anxiety narrative could evolve into something more macro-relevant. In that case, broader multiple compression and earnings downgrades could follow, and rotation alone would not be enough to shield portfolios.
For now, continued rotation and diversification remains the more plausible scenario. The MSCI World ex-USA index is up around 7% year-to-date, while the S&P 500 is broadly flat. Asian markets have outperformed US peers, due lower valuations and their exposure to memory-chip manufacturers benefiting from AI demand. Korea’s KOSPI, for example, leads the race with a more than 30% since January. Europe’s Stoxx 600 has been relatively insulated from tech volatility due to its limited technology weighting. The FTSE 100 — heavy in energy and mining — has also benefited from diversification flows, and could be an interesting safe harbour when sterling exposure is hedged and if commodity prices remain supportive.
Precious metals, however, do not behave like traditional safe havens since a few weeks. Gold slipped below $5’000 per ounce during yesterday’s tech selloff, an unusual positive correlation with risk assets. Typically, gold attracts capital during equity stress and the latter supports gold miners such as Fresnillo, which nevertheless fell around 4% in London trading on Thursday. Gold is firmer this morning in Asia but faces resistance near recent highs, while Bitcoin is testing the $65’000 support. US Treasuries see haven inflows this week... and I am not even sure that we could call them safe, anymore.
The week hasn’t said its last word yet: attention now turns to the US CPI release. Both headline and core inflation are expected to have eased in January – moving closer toward the Federal Reserve’s (Fed) 2% policy target. If inflation eases, the Fed will be in a better position to lower rates and give some relief to the economy that’s rattled by AI concerns, and job losses that could follow... if AI doesn’t take people’s jobs, possible bankruptcies due to AI could.
So the thinking goes: a set of soft – and ideally softer than expected – CPI update could pull yields lower and throw a floor under the equity selloff. While a set of stronger than expected CPI figures could inject further stress into the market, and trigger a further selloff.
Note that, the selloff that we see across major US indices looks just like the beginning of a correction – if the correction develops further. A 10–20% pullback in the Nasdaq, for example, would be possible – and even healthy – after the past three years’ almost uninterrupted rally. That could bring the Nasdaq all the way down to the 21K–23.5K range.
I am not saying this is what’s next. But it is within the realm of possibility.