Sample Category Title
Weekly Focus – US Job Market Finally Recovers
After a long period of softness, the US labour market finally responded to the stronger growth seen in the second half of 2025, where GDP growth averaged 4.1% annualised. The labour market report showed a gain of 130k jobs in January, the strongest monthly rise in more than a year and the unemployment rate dropped from 4.4% to 4.3%. It lowers the probability of a rate cut from the Fed already in March.
It was not all good news in the US the past week, though. Benchmark revisions to the employment level showed a downward revision of around 900k in 2025 and although it was expected, it underlines that job growth has been much weaker in 2025 compared to previous years. It highlights the rising structural headwind from labour supply but also indicates that productivity growth has been strengthening. Retail sales for December showed a decline of 0.1% m/m in the core measure vs expectations of a 0.4% m/m increase and November was revised lower as well pointing a slower trend in consumption. We do see ebbs and flows in consumption growth, so it is too early to get concerned. We do expect some slowdown in consumption growth on the back of lower wage gains and softer employment growth, which lowers household income growth and thus spending power.
It was a quiet week in the Euro zone but a small lift to the Sentix survey added to signs that manufacturing growth is recovering again after a short soft patch. A sharp rise in German factory orders and rising metal prices also point to stronger manufacturing.
The Japanese election last weekend gave a landslide victory to LDP's prime minister Sanae Takaichi. She pursues a more expansionary fiscal agenda, and her win has driven new gains in Japanese stocks. The reaction has been more muted in the JPY and the bond market, partly because her win was widely anticipated and some profit taking took place in short JPY and bond positions.
In China, the main story was reports saying the financial regulator had told banks to reduce US treasury holdings. It was not confirmed officially, though, and we doubt China is about to sell US treasuries on a wider scale. However, they may lower purchases of long bonds and not refinance existing debt leading to a lower share of treasuries on their balance sheets. Chinese CPI inflation was lower than expected falling from 0.8%y/y to 0.2% y/y However, the data is distorted by timing of the Chinese New Year, which falls in February this year instead of January. More interesting was PPI data, which showed the fourth m/m increase in a row indicating that deflationary pressures are easing.
Financial markets were pretty quiet the past week with stock markets treading water, while bond yields have moved slightly lower despite the stronger US employment report. In oil markets, all eyes are on US-Iran talks and whether they will be able to make a deal to avert a US military intervention. As of today, Polymarket puts a 43% probability on a strike by June.
Next week focus turns to Flash PMIs in the US, euro zone and Japan. German ZEW, euro wage growth and Japanese CPI will also be scrutinized.
Sunset Market Commentary
Markets
US inflation figures were this week’s second focal point for markets, next to Wednesday’s payrolls. January prices rose by 0.2% m/m to be up 2.4% in yearly terms. That was slightly below consensus of 0.3% and 2.5%. Core inflation printed bang in line with expectations, accelerating from December’s 0.2% to 0.3% m/m and resulting in an annual 2.5%. Both headline and core eased in y/y terms from 2.7% and 2.6% respectively, the latter being a new five year low. Energy (-1.5%) and within that category especially gasoline prices (-3.2%) showed some of the steepest monthly declines, together with used cars & trucks (-1.8%). Housing price pressures decelerated quite strongly from December’s 0.4% to 0.2%, dragging the overall numbers down due it its sizeable basket weight (44%). Supporting inflation last month was apparel – considered a tarrif pass-through gauge (0.3%) – and airline fares (+6.5%). Core services (ex. housing) was 0.56%, the biggest increase in a year. In y/y terms, this closely watched indicator (for it measures “domestic” inflation) by the Fed fell to the lowest since 2021. But a more dynamic annualized number based on the three-month moving average marched to the highest since April 2024. It’s not a complete surprise though that markets are ignoring such nuances. US yields dropped in a kneejerk sigh-of-relief response similar (but obviously opposite) to the payrolls reaction. The curve bull flattens with net daily changes varying between -3 and -3.8 bps. The 2-yr yield dropped to a new YtD low and tested the October 2024 multiyear around 3.4%. The timing for a full Fed rate cut didn’t change (July) although the June scenario is regaining traction (85%). Cumulative easing bets for all 2026 rise slightly to the most since the Fed’s last rate cut in December last year (>60 bps). European yields fell in a catch up move with the US and extended declines to around 3 bps in sympathy with their US peers after the CPI. US stock futures rebounded after the CPI-release but still trade with minor losses after the cash open. European stocks are still down on the day. Just as the US dollar failed to profit from Wednesday’s post-payrolls yield uptick, it barely loses territory now. EUR/USD (1.187) gets no further than wiping out the previous, small losses. DXY is similarly going nowhere around but slightly below 97. JPY’s week-long rally met resistance near the YtD highs with USD/JPY eking out tiny gains to 153.
News & Views
The consumer price index in Switzerland in January declined 0.1% compared with December 2025. The price index was 0.1% higher compared to the same month last year. Core inflation (ex. fresh and seasonal products, energy and fuel) rose 0.1% M/M and 0.5% Y/Y. The monthly decease in headline inflation was due to lower prices for electricity and supplementary accommodation. Prices also decreased for air transport, as did those for clothing and footwear. Prices for hotels and international package holidays increased, as did car insurance premiums, the Swiss Statistical office said. The January data were based on a new CPI basket due to a regular revision. Interesting in terms of the impact of the Swiss Franc on inflation, prices of imported goods declined 0.6% M/M and 1.5% Y/Y. The January inflation data, while very low, probably won’t come as a surprise for the Swiss National Bank. In its December forecast, the SNB forecasted inflation at 0.1% Y/Y in Q1 and 0.3% for 2026 as a whole. With the policy rate at 0%, SNB recently indicated that the bar for cutting it back in negative territory remains rather high. At EUR/CHF 0.912, the franc again trades near all-time strongest levels against the euro except for the FX-spike in early 2015.
Polish January CPI inflation printed at +0.6% M/M, further reducing the Y/Y reading to 2.2% Y/Y from 2.4% in December. Inflation dropped further below the 2.5% inflation target of the National Bank of Poland, but the outcome was slightly above consensus estimates. Food prices rose 1.1% m/m, dwelling prices rose 1.3% m/m (of which electricity gas and other fuels rising by 1.9%). Fuels for transport declined 2.4% m/m. Even as inflation was higher than expected, the central bank will probably still discuss a rate cut (policy rate currently 4%) at the early March meeting, which comes with new economic forecasts. Several MPC members including governor Glapinski recently mentioned the option of a rate cut at the March meeting. The zloty 2y swap only rises marginally today (3.52%; +1.75 bps). The zloty gains slightly to EUR/PLN 4.21.
US Inflation Slows, Fed May Cut Rates More Than Market Prices In
- US headline inflation rose by 0.2 per cent month on month and 2.4 per cent year on year, slightly below expectations.
- Core inflation stood at 0.3 per cent month on month and 2.5 per cent year on year, confirming gradual disinflation.
- Rent growth slowed to 0.2 per cent, while tariff effects remained limited.
- Markets reacted moderately, with lower US yields and Fed Funds futures pricing in nearly two and a half cuts
January data without a negative surprise
January’s inflation report in the United States delivered a moderately positive signal for financial markets. Consumer prices rose by 0.2 per cent month on month and by 2.4 per cent year on year, slightly below market consensus. Core inflation, excluding energy and food, increased by 0.3 per cent month on month and 2.5 per cent year on year, in line with analysts’ expectations.
Importantly, the pattern seen in previous years, when January readings repeatedly surprised to the upside, did not reappear. At the beginning of the year, firms often revise their price lists, which in periods of strong cost pressure had previously led to marked increases in inflation indicators. This time, the effect was limited, suggesting that price pressures are gradually easing.
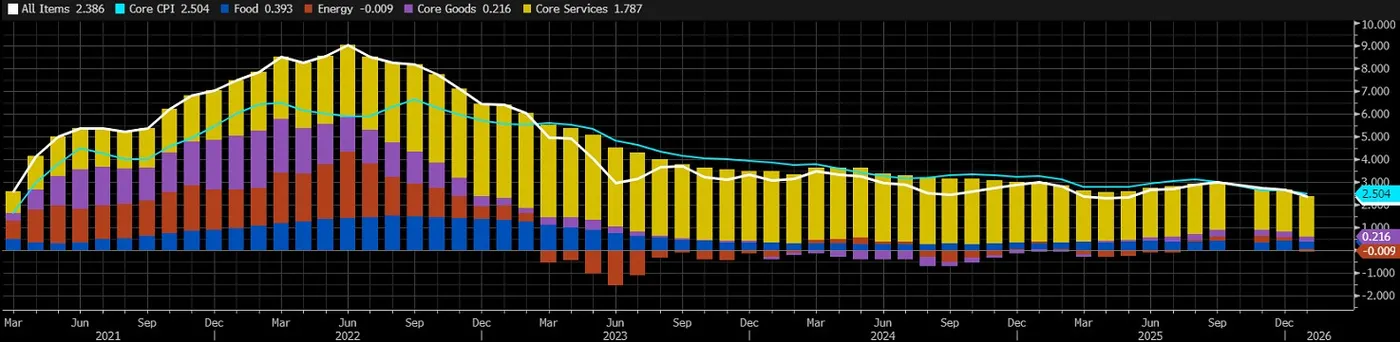
Contributions to US CPI Y/Y% NSA, source: Bloomberg
Limited impact of tariffs and slowing rent pressures
The impact of tariffs on overall price levels remains moderate. In selected categories, such as audio and video equipment, above average price increases are visible. However, overall goods prices excluding energy and food were unchanged compared with the previous month, as was already the case in December.
Stronger increases were recorded in the services sector, where prices rose by 0.4 per cent month on month. This was partly due to significant volatility in air fares, which climbed by 6.5 per cent. More importantly, rent inflation slowed markedly to 0.2 per cent, as housing costs had been a key factor sustaining elevated core inflation in previous quarters.
The trend in core inflation continues to point towards a gradual moderation in price dynamics. The disinflationary process is progressing slowly, but the overall direction remains consistent with policymakers’ expectations.
The Fed can afford to wait for further data
For the Federal Reserve, the current report is relatively comfortable. On the one hand, the feared surge in prices at the start of the year did not materialise, confirming that the impact of tariff increases remains limited. On the other hand, inflation has not fallen sharply enough to justify an immediate easing of monetary policy.
In this context, the central bank can keep interest rates unchanged in the coming months and wait for additional data. Rate cuts at the next two meetings therefore appear unlikely, as policymakers will want to ensure that the downward trend is durable and broadly embedded across the economy.
Three or four rate cuts by year end
In the medium term, however, the prospect of monetary easing remains realistic. If inflation continues to moderate gradually, supporters of the view that tariffs have only a temporary impact on prices will gain further credibility.
The baseline scenario assumes that the rate cutting cycle begins in June, with a total of four interest rate cuts by the end of the year. This would represent a more decisive easing than is currently priced in by financial markets. In such a scenario, the Fed would gradually shift from a neutral stance to a more dovish one, supporting economic activity while continuing to monitor the pace of disinflation and longer term price stability.
Market reaction
The release triggered a moderate but noticeable reaction in financial markets. EURUSD rose from around 1.1860 to 1.1880, signalling a slight weakening of the US dollar. Gold climbed from approximately 4960 USD to 5000 USD per ounce, reflecting increased sensitivity to the prospect of looser monetary policy in the months ahead. Futures on the SP 500 edged higher, indicating a mildly positive reception from equity investors.
A more pronounced move was visible in the bond market. Yields on US Treasury securities declined noticeably, with the ten year yield falling below 4.07 per cent, compared with around 4.12 per cent earlier in the day. The drop in yields suggests that investors have begun to price in a greater likelihood of interest rate cuts later this year.
The futures market reaction was relatively measured. Fed Funds futures currently price in close to two and a half rate cuts for the remainder of the year.
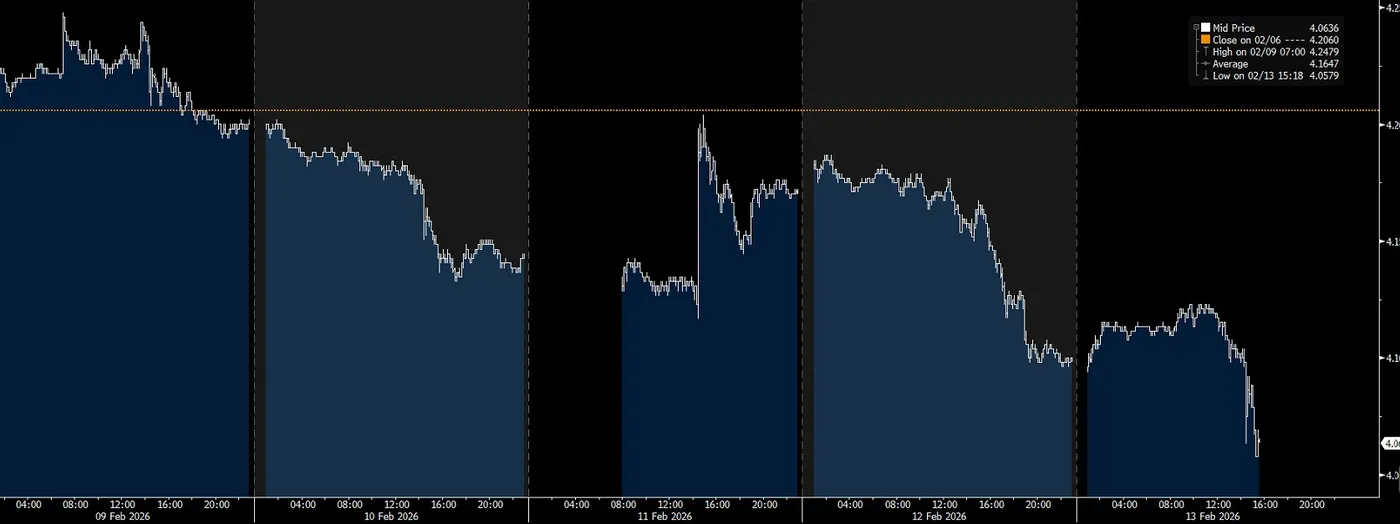
10-year US government bonds, source: Bloomberg
US: CPI Slows to 2.4% in January, But There Remains Upside Risk in the Month’s Ahead
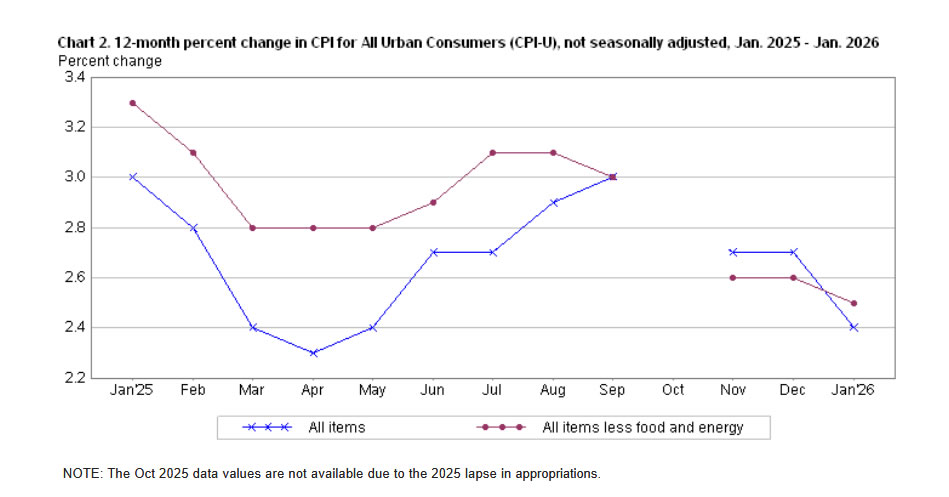
The Consumer Price Index (CPI) rose 0.2% month-on-month (m/m) in January, one-tenth below the consensus forecast in Bloomberg. On a twelve-month basis, CPI was up 2.4% (down from 2.7% the month prior).
- Energy costs fell 1.5% m/m, thanks to a sharp pullback in prices at the pump (-3.2% m/m). Food prices (0.2% from 0.7% in December) also moderated in January.
Excluding food and energy, core inflation rose 0.3% m/m, following softer gains the two prior months and more than the 0.2% m/m average increase over the prior twelve-month period. However, favorable base effects pushed the year-on-year change down to 2.5% (from 2.6% in December).
Price growth on services heated up, rising 0.4% m/m, or the fastest monthly increase since July 2025. Primary shelter costs came in on the cooler side – rising 0.2% m/m – while price growth of non-housing services firmed. Air fares (+6/5% m/m) rose sharply last month, while most other categories tied to discretionary spending were higher.
Core goods prices were flat for a second consecutive month, as a sharp pullback in used vehicle prices (-1.8% m/m) offset smaller gains in household furnishings, apparel, medical commodities, and recreational goods.
Key Implications
All told, January's inflation report came in a touch cooler than expected. But there were plenty of cautionary signs for the months ahead. Core goods would have firmed if not for the sharp pullback in used vehicle prices, as most other categories showed price growth last month. Moreover, the softer gain in primary shelter could still be related to post-government shutdown distortions (see Q&A Question 3), suggesting there could be some giveback in the months ahead.
We expect some firming in inflationary pressures over the coming months, as businesses continue to pass on increasingly more of the tariff cost. There's also a risk of a stronger demand-side push on inflation, as OBBBA tax cuts, easier financial conditions, and a stabilizing labor market provide tailwinds to consumer spending. It's for this reason that we think that the Fed will stay on the sidelines until at least the summer.
USD/JPY Mid-Day Outlook
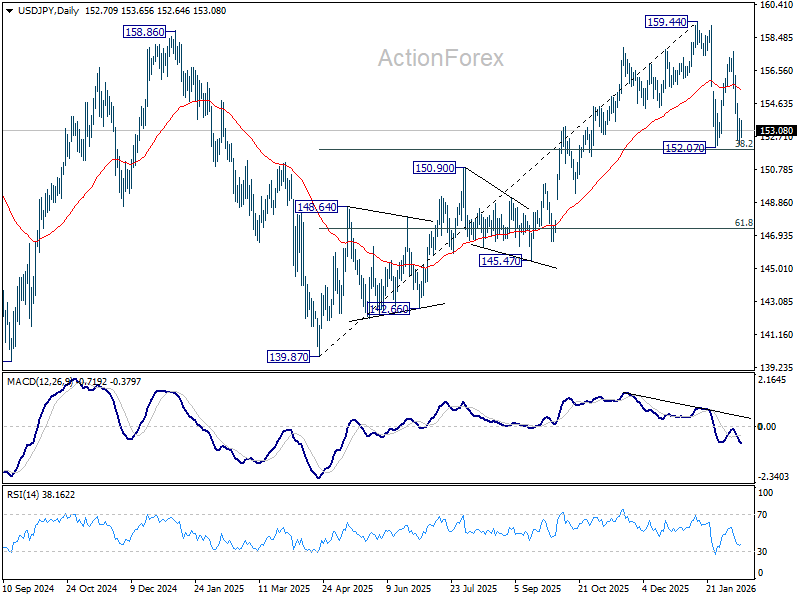
Daily Pivots: (S1) 152.34; (P) 153.49; (R1) 154.43; More...
Intraday bias in USD/JPY stays neutral and outlook is unchanged. While another fall cannot be ruled out, strong support should be seen from 38.2% retracement of 139.87 to 159.44 at 151.96 to bring rebound. On the upside, sustained break of 55 4H EMA (now at 154.70) will bring stronger rebound towards 157.65. However, sustained break of 151.96 will argue that it's reversing the rise from 139.87 already. In this case, deeper fall should then be seen to 61.8% retracement at 147.34, and possibly below.
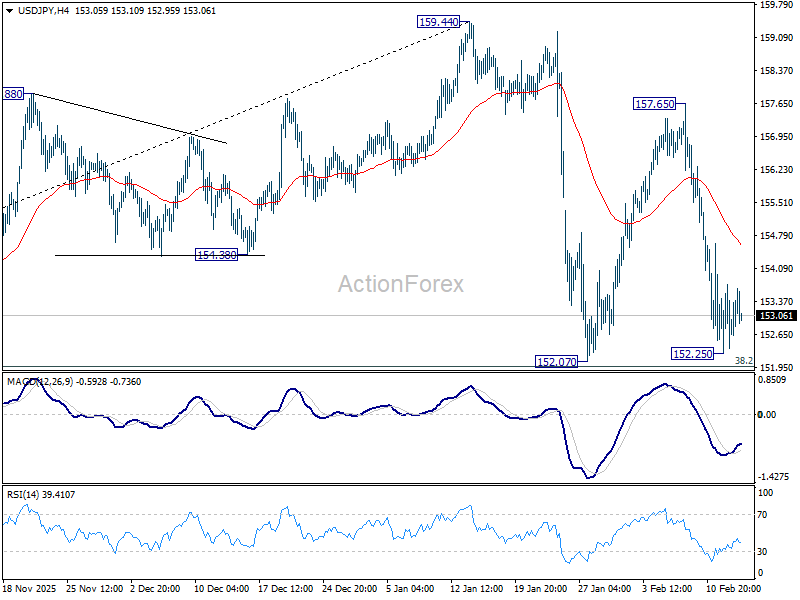
In the bigger picture, outlook is unchanged that corrective pattern from 161.94 (2024 high) should have completed with three waves at 139.87. Larger up trend from 102.58 (2021 low) could be ready to resume through 161.94. This will remain the favored case as long as 55 W EMA (now at 151.68) holds. However, sustained break of 55 W EMA will argue that the pattern from 161.94 is extending with another falling leg.
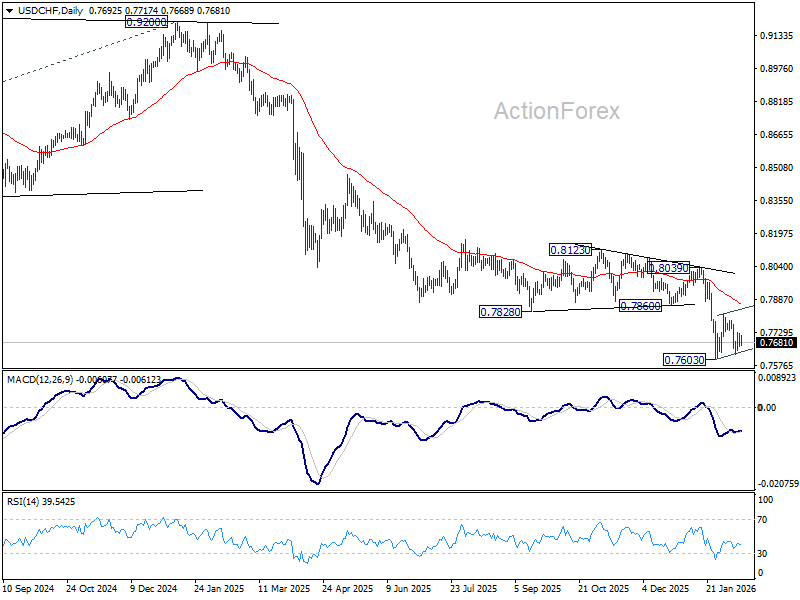
USD/CHF Mid-Day Outlook
Daily Pivots: (S1) 0.7664; (P) 0.7695; (R1) 0.7722; More….
Intraday bias in USD/CHF stays neutral as consolidation from 0.7603 is extending. Strong rebound could be seen, but upside should be limited by 55 D EMA (now at 0.7862). On the downside, firm break of 0.7603 will resume larger down trend to 0.7382 projection level next.
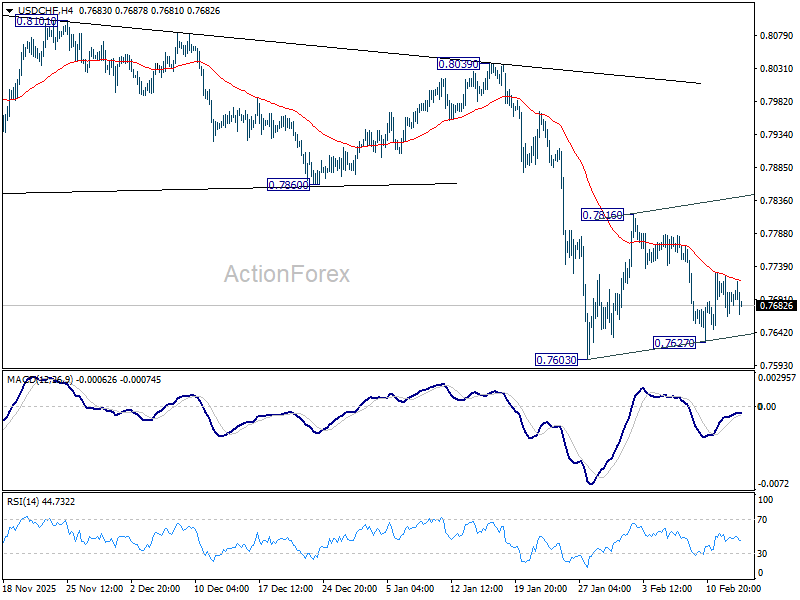
In the bigger picture, larger down trend from 1.0342 (2017 high) is still in progress. Next target is 100% projection of 1.0146 (2022 high) to 0.8332 from 0.9200 at 0.7382. In any case, outlook will stay bearish as long as 55 W EMA (now at 0.8152) holds.
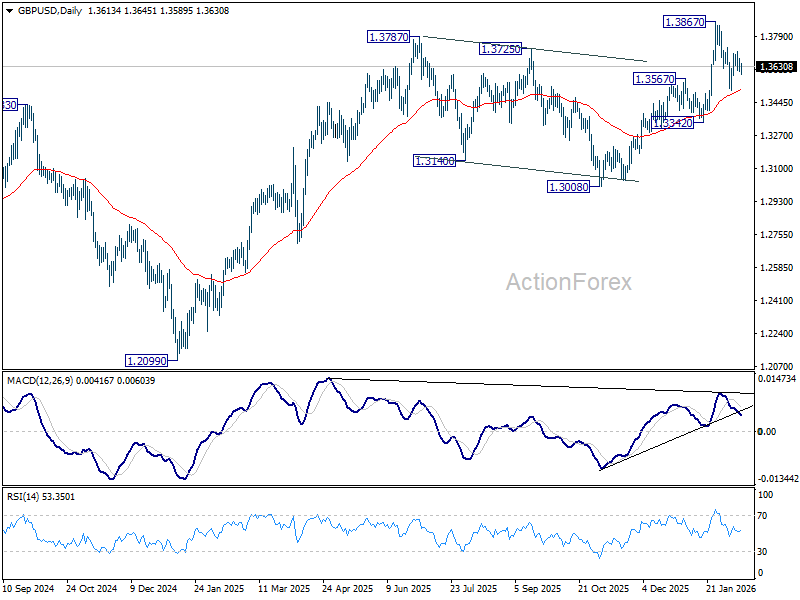
GBP/USD Mid-Day Outlook
Daily Pivots: (S1) 1.3595; (P) 1.3633; (R1) 1.3662; More...
Intraday bias in GBP/USD remains neutral as sideway trading continues. On the upside, firm break of 1.3732 will suggest that pullback from 1.3867 has completed as a correction at 1.3507. Retest of 1.3867 should be seen first. Firm break there will resume larger up trend towards 1.4284 key resistance. On the downside, however, sustained trading below 55 D EMA (now at 1.3509) will raise the chance of larger scale correction, and target 1.3342 support for confirmation.
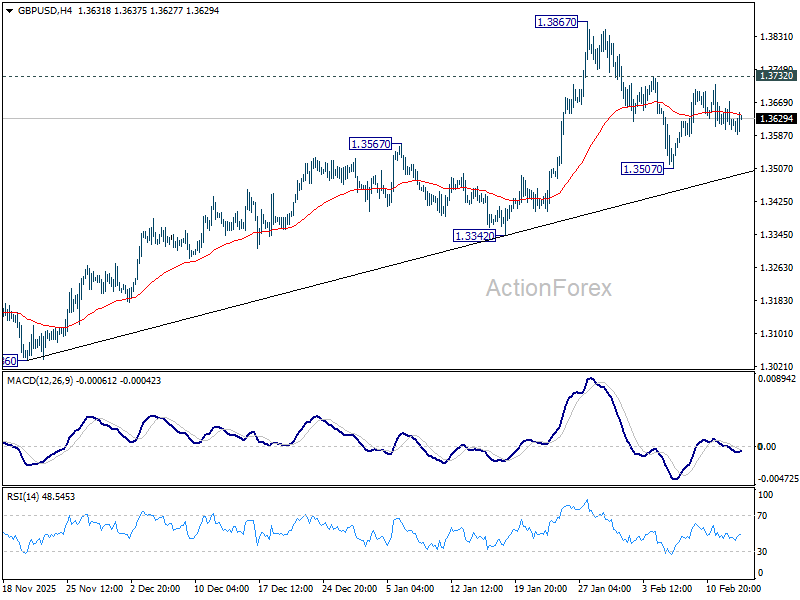
In the bigger picture, rise from 1.0351 (2022 low) is resuming by breaking through 1.3787 high. Further rally should be seen to 1.4284 key resistance (2021 high). Decisive break there will add to the case of long term bullish trend reversal. For now, outlook will stay bullish as long as 1.3008 support holds, even in case of deep pullback.
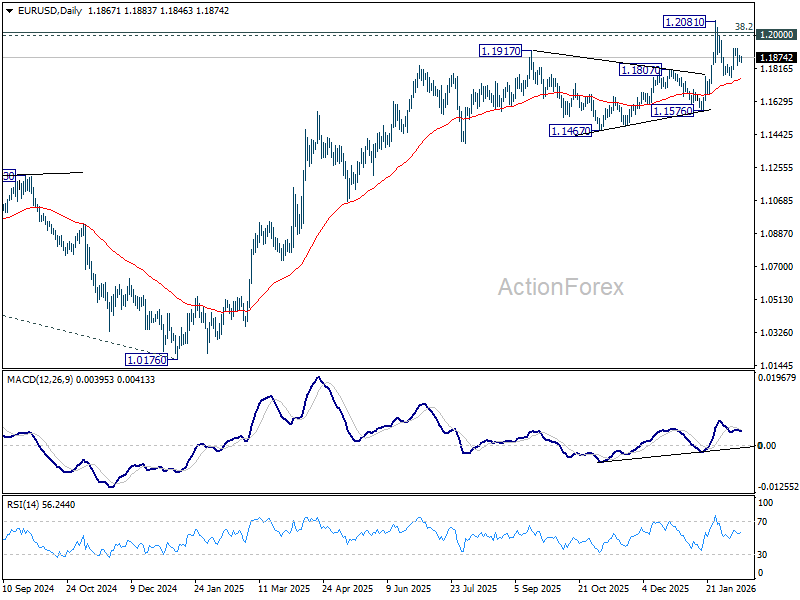
EUR/USD Mid-Day Outlook
Daily Pivots: (S1) 1.1853; (P) 1.1871; (R1) 1.1891; More….
EUR/USD recovers mildly from 55 4H EMA but stays in established tight range. Intraday bias remains neutral. On the upside, above 1.1928 will target a retest on 1.2081 high. Decisive break there and sustained trading above 1.2 psychological level will carry larger bullish implications. On the downside, however, sustained trading below 55 D EMA (now at 1.1756) will raise the chance of reversal on rejection by 1.2, and target 1.1576 support for confirmation.
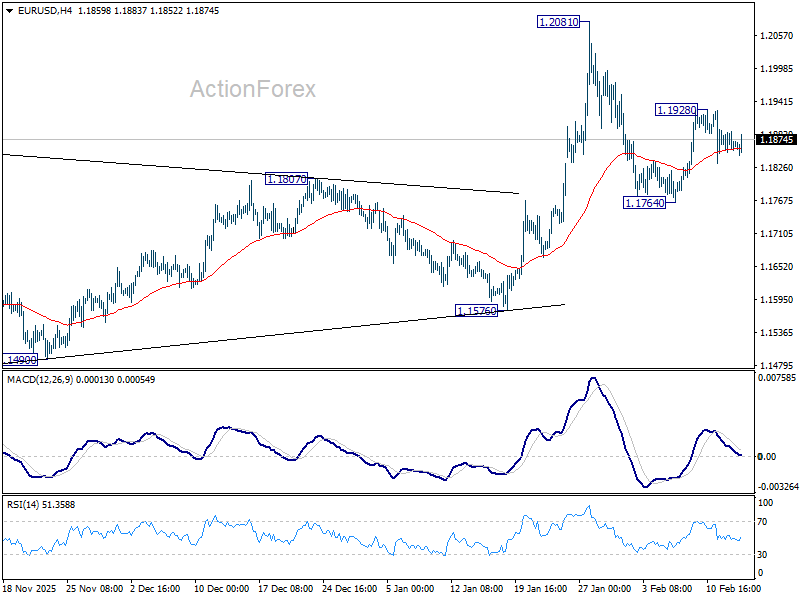
In the bigger picture, as long as 55 W EMA (now at 1.1470) holds, up trend from 0.9534 (2022 low) is still in favor to continue. Decisive break of 1.2 key psychological level will add to the case of long term bullish trend reversal. Next medium term target will be 138.2% projection of 0.9534 to 1.1274 from 1.0176 at 1.2581. However, sustained trading below 55 W EMA will argue that rise from 0.9534 has completed as a three wave corrective bounce, and keep long term outlook bearish.
Dollar Softness Continues, CPI Does Little to Alter Fed Pricing
Forex markets remained relatively steady following the January US CPI release, with the slightly softer-than-expected headline reading failing to trigger major repositioning. The moderation in inflation was largely driven by lower energy prices, while underlying pressures showed only gradual improvement. The data did little to materially alter Fed expectations.
A March hold is effectively locked in, with markets pricing around an 88% probability of no change. Attention instead remains on June, where odds of a rate cut stand near 70%, reflecting expectations that gradual disinflation will eventually allow the Fed to ease.
With policy expectations stable, focus now shifts back to broader risk sentiment. US equity futures were flat at the time of writing, leaving open the question of whether yesterday’s AI-driven selloff will extend into the final session of the week.
On the trade front, according to the Financial Times, US President Donald Trump is considering scaling back some tariffs on steel and aluminum products. Officials reportedly believe certain levies have raised consumer costs on items such as cans and tins. The administration is said to be reviewing affected products and may exempt select items while halting further expansion of tariff lists.
Treasury Secretary Scott Bessent told CNBC that any adjustments would likely involve clarification on “incidental objects,” though ultimate authority rests with the president. Markets will watch closely for confirmation, as even limited tariff easing could modestly support sentiment.
For the week so far, Dollar is the weakest performer, followed by Sterling and Kiwi. Yen leads gains, with Swiss Franc and Aussie also firm. Euro and Loonie sit mid-pack. Positioning remains fluid, and a renewed shift in risk appetite could still reshape currency rankings before weekend.
In Europe, at the time of writing, FTSE is flat. DAX is up 0.22%. CAC is down -0.32%. UK 10-year yield is down -0.017 at 4.438. Germany 10-year yield is down -0.014 at 2.769. Earlier in Asia, Nikkei fell -1.21%. Hong Kong HSI fell -1.72%. China Shanghai SSE fell -1.26%. Singapore Strait Times fell -1.57%. Japan 10-year JGB yield fell -0.022 to 2.213.
US CPI Cools to 2.4% as energy drag offsets shelter gains
US headline CPI eased from 2.7% yoy to 2.4% in January, slightly below expectations of 2.5% and marking the lowest reading since May.
Core CPI also moderated, slipping from 2.6% to 2.5%, matching forecasts and reaching its lowest level since early 2021. Over the past 12 months, the energy index fell -0.1%, while food prices rose 2.9%.
On a monthly basis, CPI rose 0.2%, while core CPI increased 0.3%. Shelter remained the largest contributor to the monthly gain, rising 0.2%, alongside a 0.2% increase in food prices. These advances were partially offset by a -1.5% decline in energy prices, which helped cap overall inflation momentum.
The data reinforce the view that inflation pressures are gradually easing, though core components — particularly shelter — continue to keep underlying price growth above the Fed’s 2% target.
BoE’s Pill warns disinflation incomplete despite projected CPI drop
BoE Chief Economist Huw Pill said UK underlying inflation remains around 2.5%. He emphasized that policy must continue to bear down on price pressures to ensure disinflation is sustained.
While headline inflation is projected to fall toward 2% in April or May, Pill noted that much of the expected decline reflects temporary effects from measures announced in Chancellor Rachel Reeves’ November budget. Stripping out that half-percentage-point impact, underlying price pressures remain firmer than the 2% target.
"In order to complete that (disinflation) process, monetary policy has a part of play and that means we do need to retain some restrictiveness in the stance of monetary policy until that process of disinflation is complete," Pill said.
Pill said monetary policy still carries a degree of restrictiveness, even if its exact magnitude has become "more ambiguous now". "Perhaps there’s more ambiguity about the extent of restriction than there is ambiguity about the incompleteness of the disinflation process to target," he added.
Swiss CPI flat as imported prices drag
Switzerland’s consumer prices slipped -0.1% mom in January, undershooting expectations for a flat reading. The decline was largely driven by a -0.6% drop in imported product prices, while domestic prices edged up 0.1% on the month. Core CPI, which excludes fresh and seasonal products, energy and fuel, rose 0.1%, suggesting limited underlying pressure.
On an annual basis, headline inflation held steady at 0.1% yoy, in line with expectations. Core inflation was unchanged at 0.5%, with domestic product prices also steady at 0.5% from a year earlier. The data point to a subdued price environment, with limited momentum building in domestic costs.
Imported prices remained a key drag, falling -1.5% year-on-year compared with a -1.6% decline previously. The stronger Swiss Franc and softer external price dynamics continue to suppress imported inflation, keeping overall price growth well below levels seen elsewhere in Europe.
BoJ’s Tamura says inflation becoming “sticky,” sees scope to tighten
BoJ board member Naoki Tamura said in a speech that the wage–price cycle the Bank has been aiming to establish remains intact, with inflation increasingly driven by domestic factors rather than imported cost shocks. He argued that inflation is “becoming endogenous and sticky,” as higher labor costs replace raw material prices as the primary driver.
Tamura noted, as early as this spring the Bank could judge its price stability target achieved — provided wage growth in 2026 is confirmed to be consistent with the 2% goal for a third consecutive year. Such confirmation would mark a significant milestone in Japan’s long struggle to exit deflation.
He cautioned, however, that price developments warrant close attention as Yen resumes depreciation. Also, as firms continue to lift wages, there is strong potential for higher labor costs to be passed through across production, distribution and retail stages.
Tamura also there remains “considerable distance” to the neutral interest rate level, implying that even further rate hikes would leave financial conditions accommodative. The challenge, he said, is to avoid both a premature tightening that risks deflation and an environment of persistent inflation that exceeds what can be considered moderate — a balancing act that keeps normalization gradual.
NZ BNZ manufacturing eases to 55.2, but signals continued expansion
New Zealand’s BusinessNZ Performance of Manufacturing Index eased from 56.1 to 55.2 in January, indicating a slight moderation in momentum but remaining firmly in expansion territory. Production slipped from 57.5 to 56.6, employment edged down from 53.7 to 52.9, and new orders cooled from 59.9 to 56.4, pointing to slower yet still solid activity.
Despite the pullback, BNZ described the latest reading as reflecting a “healthy level of expansion.” Senior Economist Doug Steel said the January PMI adds to evidence that the economy has “finally turned the corner,” aligning with forecasts and a broader set of indicators suggesting decent growth.
However, underlying sentiment showed some softening. The proportion of positive comments from respondents fell to 47.7% in January, down from 57.1% in December and 54.4% in November. While the sector remains in growth mode, the decline in optimism hints at a more cautious tone among manufacturers as 2026 begins.
EUR/USD Mid-Day Outlook
Daily Pivots: (S1) 1.1853; (P) 1.1871; (R1) 1.1891; More….
EUR/USD recovers mildly from 55 4H EMA but stays in established tight range. Intraday bias remains neutral. On the upside, above 1.1928 will target a retest on 1.2081 high. Decisive break there and sustained trading above 1.2 psychological level will carry larger bullish implications. On the downside, however, sustained trading below 55 D EMA (now at 1.1756) will raise the chance of reversal on rejection by 1.2, and target 1.1576 support for confirmation.
In the bigger picture, as long as 55 W EMA (now at 1.1470) holds, up trend from 0.9534 (2022 low) is still in favor to continue. Decisive break of 1.2 key psychological level will add to the case of long term bullish trend reversal. Next medium term target will be 138.2% projection of 0.9534 to 1.1274 from 1.0176 at 1.2581. However, sustained trading below 55 W EMA will argue that rise from 0.9534 has completed as a three wave corrective bounce, and keep long term outlook bearish.
US CPI Cools to 2.4% as energy drag offsets shelter gains
US headline CPI eased from 2.7% yoy to 2.4% in January, slightly below expectations of 2.5% and marking the lowest reading since May.
Core CPI also moderated, slipping from 2.6% to 2.5%, matching forecasts and reaching its lowest level since early 2021. Over the past 12 months, the energy index fell -0.1%, while food prices rose 2.9%.
On a monthly basis, CPI rose 0.2%, while core CPI increased 0.3%. Shelter remained the largest contributor to the monthly gain, rising 0.2%, alongside a 0.2% increase in food prices. These advances were partially offset by a -1.5% decline in energy prices, which helped cap overall inflation momentum.
The data reinforce the view that inflation pressures are gradually easing, though core components — particularly shelter — continue to keep underlying price growth above the Fed’s 2% target.