
Sample Category Title
EUR/AUD Daily Outlook
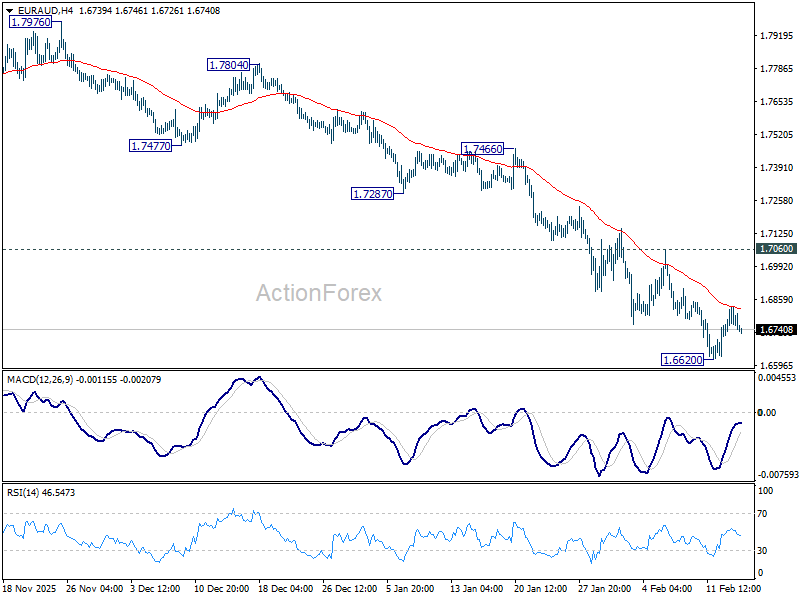
Daily Pivots: (S1) 1.6658; (P) 1.6708; (R1) 1.6793; More...
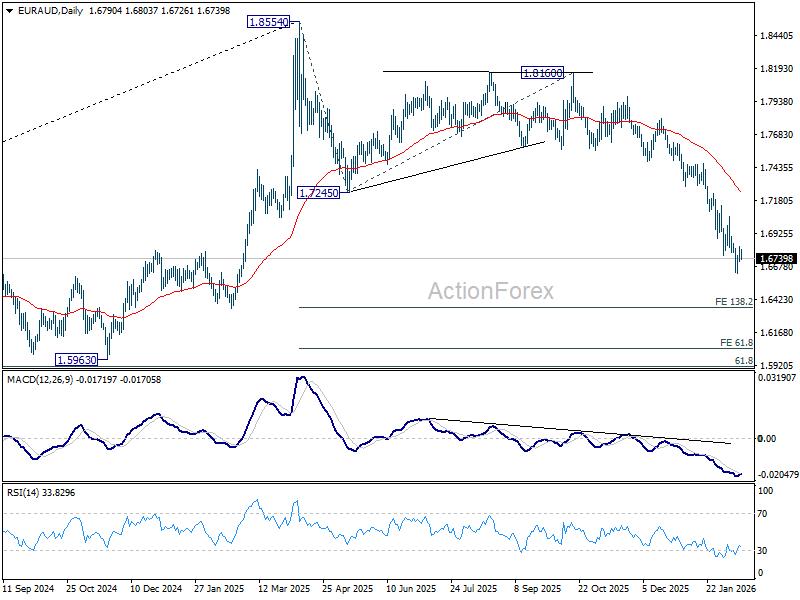
EUR/AUD is staying in consolidations above 1.6620 and intraday bias remains neutral. Outlook will remain bearish as long as 1.7060 resistance holds. On the downside, break of 16620 will resume larger down trend from 1.8554 to 138.2% projection of 1.8554 to 1.7245 from 1.8160 at 1.6351 next. However, firm break of 1.7060 will indicate short term bottoming, and bring stronger rebound.
In the bigger picture, fall from 1.8554 medium term top is seen as reversing the whole up trend from 1.4281 (2022 low). Deeper decline should be seen to 61.8% retracement of 1.4281 to 1.8554 at 1.5913, which is slightly below 1.5963 structural support. For now, risk will stay on the downside as long as 1.7245 support turned resistance holds, even in case of strong rebound.
Soft US CPI Reinforces Rotation Trade
Last week was a week of sweet economic data from the US – or almost.
The jobs market rebounded with 130K new jobs added in January – after a morose 2025 during which the US economy added around 181K jobs for the entire year. That makes roughly 15K job additions per month – and that is weak.
Retail sales were weaker than expected and pointed to a widening spending gap between wealthy and lower-income Americans.
But then Friday’s inflation data showed that headline inflation eased to 2.4% – the slowest since last June – while core inflation fell back to 2.5%, a level last seen in 2021.
The data was mixed but gave some breathing room to markets, as dovish Federal Reserve (Fed) expectations counterbalanced AI-related fears.
The US 2-year yield fell to 3.40% – the lowest since October – as the probability of a Fed rate cut rose to 70%. The US dollar remained under downside pressure on Friday. The greenback is better bid this morning in Asia, but the dovish Fed outlook should keep the dollar under pressure. It’s just that softer-than-expected growth data from Japan this morning is weighing on the Japanese yen after a five-session winning streak, which in turn makes the US dollar look stronger.
Gold, on the other hand, kicks off the week with a move below the $5’000 level. Part of it is due to a marginally stronger US dollar; some argue that softer US inflation is taking pressure off the yellow metal – traditionally seen as a hedge against inflation – but I believe that, given gold’s high correlation with risky assets over the past few weeks, a retreat in gold could be a sign that appetite across risk assets remains weak this Monday morning.
The Nikkei is down 1%, the Kospi is consolidating gains near a record high, while US and European equity futures trade slightly higher, with FTSE futures leading gains at the time of writing.
This week, I expect further capital inflows into the European defence sector, as the weekend’s security talks among Western allies were marked by two notable points:
- The highest US representative was not present.
- The German Chancellor stated that Germany and France are not in talks on nuclear deterrence.
Given how strongly Europeans have relied on the US for the continent’s security, the gap left by US disengagement must be filled, and quickly. Hence, European defence stocks will likely continue to benefit from solid inflows.
What is less clear is what will happen across technology stocks.
One of the most notable moves following Friday’s US inflation data was the divergence between tech and the rest of the market. Falling yields helped lift sentiment in many sectors but failed to cheer up Big Tech.
The Magnificent 7 extended losses by almost 1%. The S&P500 was flat, but the equal-weighted version of the index – where all companies carry the same weight – rebounded 1%. In simpler terms: rising dovish Fed expectations reinforced the rotation trade.
Elsewhere, software stocks took a breather after a catastrophic week, but appetite there remains very fragile.
Overall, Friday’s post-CPI relief was welcome, but the fundamental concerns keeping investors awake at night remain unchanged. Appetite for Big Tech continues to wane: massive – and increasingly leveraged – AI spending casts a shadow over otherwise solid Q4 results. These companies carry significant weight in major US indices – the Magnificent 7 account for roughly a third of the S&P500’s total market-cap weighting. So if they tumble, other sectors will need to work harder to offset the drag.
Second, concerns about leveraged AI spending are now toped by growing anxiety that AI could replace businesses and jobs – which would negatively affect sectors previously expected to benefit from AI productivity gains and lower costs.
The interesting thing is that these two fears do not fully align. If AI is about to wipe out entire sectors and businesses, then piling into AI could make sense, as the “Big Replacement” would enhance returns on AI investment. But if the concern is that AI returns will take time to materialise and the transition will be gradual, then betting on businesses disappearing overnight seems inconsistent.
My take is that AI-related Big Tech stocks are trading at high multiples, and a downside correction was overdue. A further 10–20% pullback is plausible.
But AI-related anxiety and sharp selloffs appear exaggerated. Many companies will benefit from productivity gains and lower costs, which could lead to consolidation – but businesses are unlikely to disappear overnight. Some gems may already be trading at significant discounts. Adobe, for example, is trading at a P/E ratio of around 15.
So valuations between tech and the rest of the market will likely continue to converge, and sector rotation could help temper downside pressure at the index level – the lower the tech exposure, the softer the selloff. Voilà. That’s my big take.
This week will be relatively light. US markets are closed today and China is off to the Lunar New Year holiday. Still, there are several data releases and earnings to watch.
In the US, the Fed minutes on Wednesday and the growth and PCE updates on Friday will be the major releases. In the UK, jobs and inflation data will be in focus. The Reserve Bank of New Zealand (RBNZ) is expected to keep rates unchanged on Wednesday, and flash PMI figures will provide insight into activity levels toward the end of the week.
On the earnings front, Walmart will be interesting to watch, as it could serve as a dual indicator of US consumer health and AI integration, with potential implications for AI business models and what they mean for employment.
Swedish Data Starts the Week Ahead of Global PMIs on Friday
In focus today
Today in Sweden, the labour force survey (LFS) for January will be published. We expect seasonally adjusted unemployment to remain steady at 8.8% (Dec: 8.8%), which is in line with January data from the Swedish Public Employment Service. Looking ahead, we expect a marked labour market recovery during the spring.
Also in Sweden, the money market's inflation expectation survey (Origo Group) is released today. Short-term inflation expectations have slipped from around 2.0% to 1.5% because of the announced reduction in food VAT. However, longer-term expectations are well-anchored on target. Given this, it bolsters the Riksbank's strategy to look through 'temporarily' low inflation in the coming year.
For the rest of the week, focus on Tuesday will be the ZEW Survey in Germany, on Wednesday the minutes of the FOMC's January meeting and the monetary policy meeting in New Zealand, on Thursday the euro area consumer confidence, while flash PMIs for the US and the euro area round of the week on Friday.
Economic and market news
What happened overnight
In Japan, preliminary 2025Q4 GDP growth came in below expectations with an increase of 0.1% q/q (cons: 0.4%, prior: -0.7%). The downside surprise came from slower growth in capital expenditures which only increased 0.2% q/q (cons: 0.8%, prior: -0.3%). Private consumption increased at the slowest pace in a year by increasing 0.1% q/q (cons: 0.1%, prior: 0.4%). The data was thus clearly weaker than expected and especially the low domestic demand caused the Yen to weaken against the USD. After Takaichi's sweeping election win last week, the administration is expected to increase public spending to encourage private consumption and sustain economic growth in 2026.
What happened over the weekend
On Friday, US January CPI landed close to our expectations, as headline inflation slowed down to 2.4% y/y (Dec. 2.7%) and core inflation to 2.5% y/y (Dec. 2.6%). Energy contribution weighed on the headline figure despite the spike in natural gas prices, as US gasoline prices remained low through most of January. Negative base effects weighed also on the core inflation reading, even though the monthly pace accelerated slightly (+0.30% m/m SA, Dec. +0.23%). Looking ahead, slowing housing inflation and unit labour cost growth remain key disinflationary drivers for 2026. Read more about the latest global inflation developments from our Global Inflation Watch - Signs of cooling services inflation, 13 February
In the euro area, employment increased 0.2% q/q in 2025Q4 like in Q3, thereby showing that the labour market continues to be a hawkish factor for the ECB. While the aggregate euro area employment data is encouraging, we also see that the diverging trends between Southern Europe and Central Europe continued as employment in Spain increased 0.8% q/q, while employment in Germany declined 0.1% q/q. Continued employment growth in the euro area supports the ECB's current policy stance.
Over the weekend, the Munich Security Conference took place amid elevated tensions between the US and Europe. US Secretary of State Marco Rubio expressed commitment to the partnership between the US and Europe which gave some relief to European leaders; however, he maintained US demands for European countries to take greater responsibility for their security. In line hereof, Ursula von der Leyen called on the EU to take greater responsibility for its own security, arguing that strategic independence across defence, energy, trade and technology is no longer optional.
Also at the security conference and ahead of this week's peace talks between Ukraine, Russia and the US, Ukrainian president Zelenskyy called for a clear date for Ukraine's EU membership and urged the US to provide security guarantees for at least 20 years. EU leaders responded that they are not ready to set a membership date.
Equities remained largely unchanged on Friday, concluding a risk-off week driven not by macroeconomic developments but by concerns over AI disruption. What began in software this year, last week extended to various other sectors (logistics, transportation, wealth management...) as investors reassessed the disruptive potential of AI in high-margin service businesses. On Friday, however, investors cautiously returned to software. It wasn't a significant rebound, but the industry regained 2% during the US trading session, making it one of the best-performing sectors for the day. Despite the modest software recovery, Friday's session was largely defensive, with healthcare, real estate, and utilities among the top-performing sectors, while banks and big tech lagged. Small-cap stocks outperformed, with the Russell 2000 gaining 1.1% compared to an unchanged performance for the S&P 500 and Stoxx 600. Futures are slightly higher this morning.
FI and FX: EUR/USD ended Friday's session broadly unchanged as US CPI for January came in line with expectations while EUR/CHF hit the lowest level since January 2015 as risk-off sentiment lent support to the Franc. It was a busy week for Norwegian markets as NOK CPI on Tuesday was a game changer for short-end NOK rates as evident from price action with short-end rates completing a close to record intra-day rise. European yields ended the week on a weak footing with risk off sentiment dominating markets over the past week. As a result, 2Y EUR swap yields declined 5bp and 10Y EUR swap yields declined 10bp over the past week. In the US, yields declined across the curve during Friday's session. Oil prices fell on Friday, as news broke that OPEC+ looks to consider whether to hike production again in April.
EUR/CHF Daily Outlook
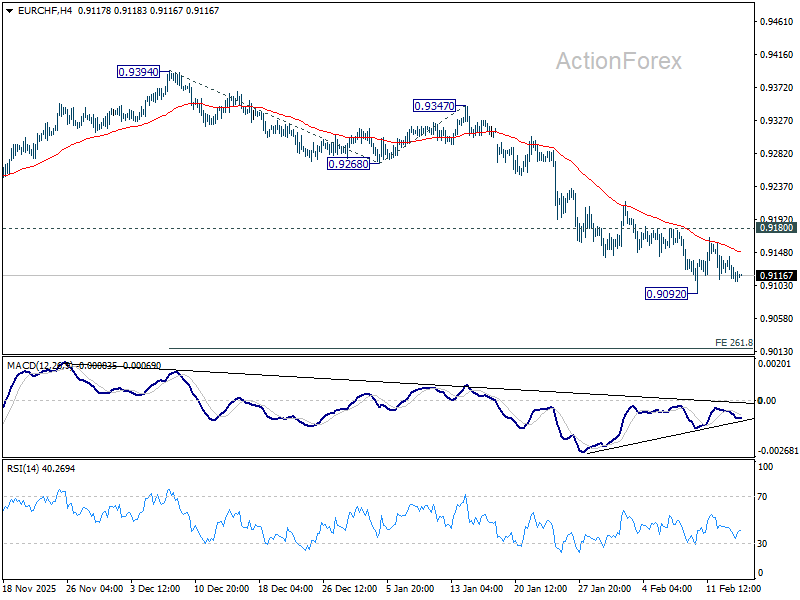
Daily Pivots: (S1) 0.9099; (P) 0.9122; (R1) 0.9135; More....
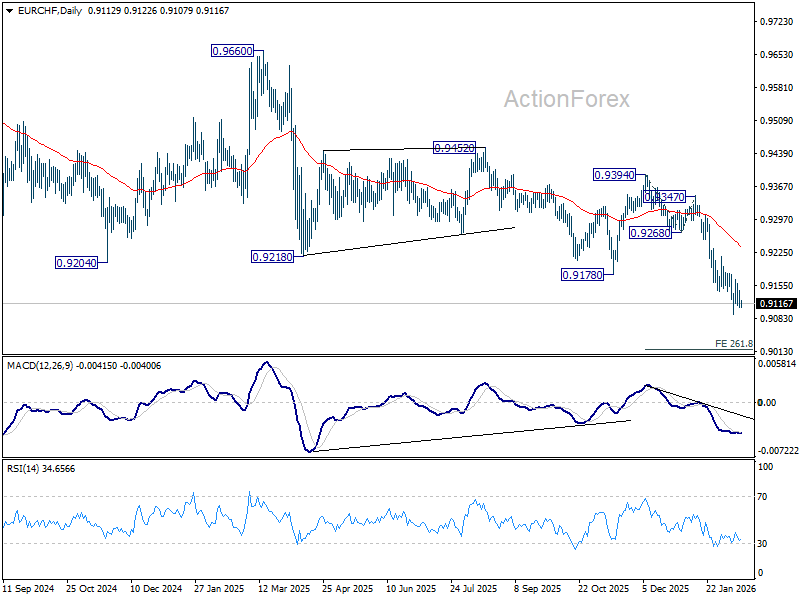
EUR/CHF is staying in consolidations above 0.9092 and intraday bias remains neutral. Further decline is expected as long as long as 0.9180 resistance holds. Firm break of 0.9092 will resume larger down trend and target 261.8% projection of 0.9394 to 0.9268 from 0.9347 at 0.9143. However, considering bullish convergence condition in 4H MACD, decisive break of 0.9180 will indicate short term bottoming, and bring stronger rebound towards 55 D EMA (now at 0.9236).
In the bigger picture, down trend from 0.9928 (2024 high) is still in progress with falling 55 W EMA (now at 0.9258) intact. Next target is 61.8% projection of 1.1149 to 0.9407 from 0.9928 at 0.8851. Outlook will stay bearish as long as 0.9394 resistance holds, in case of recovery.
Holiday-Thinned Trade Keeps FX Locked in Ranges
Trading in Asian markets was subdued at the start of the week, with activity dampened by the U.S. holiday and the approach of Lunar New Year. Many regional desks are already lightly staffed, leaving liquidity thin and conviction limited. The holiday mood has kept volatility compressed.
Major currency pairs and crosses are confined within Friday’s ranges, with little appetite to initiate fresh positions ahead of key catalysts. Dollar, Yen, and Euro are all holding steady, while commodity currencies are drifting modestly but without follow-through.
The week ahead, however, offers potential triggers. RBNZ policy decision, FOMC minutes from January meeting, and a heavy slate of UK data including inflation and employment could inject direction back into markets.
Beyond scheduled events, geopolitical developments may prove more consequential. The second round of U.S.–Iran talks in Geneva on Tuesday is drawing attention. The discussions aim to de-escalate tensions over Tehran’s nuclear programme and avert renewed military confrontation.
According to reports, Iran is pursuing an agreement that would provide economic benefits for both sides, including energy and mining investments as well as aircraft purchases. Progress would signal easing geopolitical risk in Middle East.
Any meaningful breakthrough could weigh on oil prices by reducing supply risk premium. In turn, that may spill over into Gold, which has recently been vulnerable after sharp technical selloff. Conversely, stalled negotiations could revive safe-haven demand.
In currency markets, relative performance remains fluid. Aussie is currently the strongest, followed by Loonie and Dollar, while Yen is lagging alongside Swiss Franc and Sterling. Euro and Kiwi are positioned mid-pack. Given the low-liquidity backdrop, these rankings could shift quickly once participation normalizes.
In Asia, at the time of writing, Nikkei is up 0.07%. Hong Kong HSI is up 0.52%. China is on holiday. Singapore Strait Times is up 0.02%. Japan 10-year JGB yield is up 0.001 at 2.214.
Japan sidesteps technical recession as Q4 growth barely grows by 0.1% qoq
Japan’s economy narrowly avoided a technical recession in Q4, but the rebound fell short of expectations. GDP rose just 0.1% qoq, below the 0.4% forecast, though an improvement from Q3’s -0.6% contraction. On an annualized basis, growth came in at 0.2%, recovering from -2.6% but well under the expected 1.6%.
Private consumption, which accounts for more than half of output, edged up 0.1%. Demand for mobile phones provided support, though spending on food and autos declined. External demand was weak, with exports falling -0.3% qoq, dragged down by soft automobile shipments.
Investment provided modest offsets. Business spending rose 0.2%, supported by strong demand for semiconductor-manufacturing equipment, while housing investment jumped 4.8%.
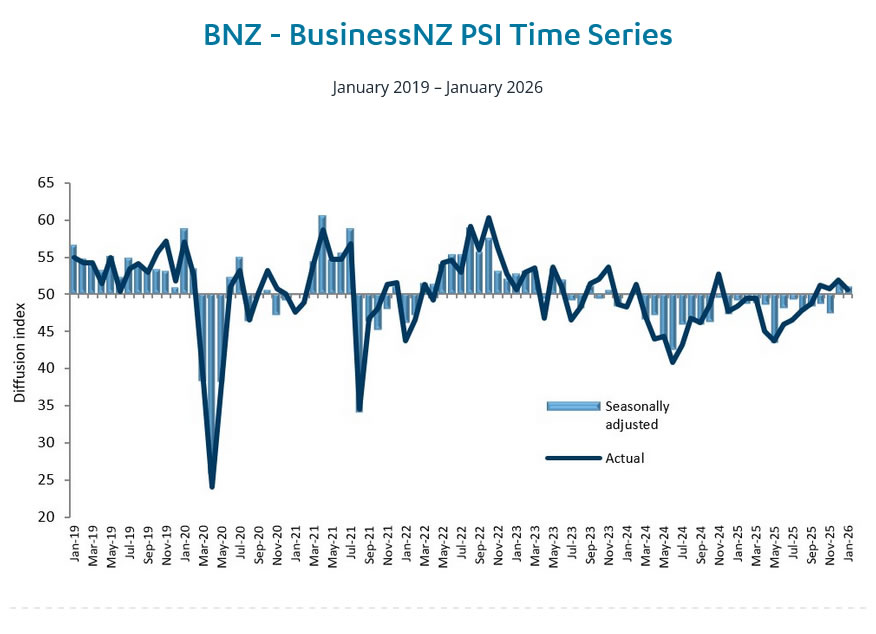
NZ BNZ services falls to 50.9, employment weakness offsets sales strength
New Zealand’s BusinessNZ Performance of Services Index eased from 51.7 to 50.9 in January, slipping further below the survey’s historical average of 52.8. While the index remains marginally in expansion territory, the details reveal a mixed picture. Activity and sales improved from 52.5 to 54.2, but employment deteriorated from 49.6 to 49.1, staying firmly in contraction. New orders edged lower from 52.1 to 51.8, suggesting demand momentum is softening at the margin.
Sentiment remains subdued. The proportion of negative comments rose sharply to 58.7%, up from 50.4% in December and 52.9% in November. Respondents cited seasonal disruptions from Christmas–New Year holidays, fewer enquiries, and a prolonged post-holiday lull. Elevated living and operating costs continue to weigh on business confidence, underscoring fragile recovery conditions.
Still, BNZ Senior Economist Doug Steel struck a more constructive tone, noting that data since late 2025 has reinforced confidence that positive momentum can be sustained. While services growth is hardly robust, the economy appears to be expanding gradually.
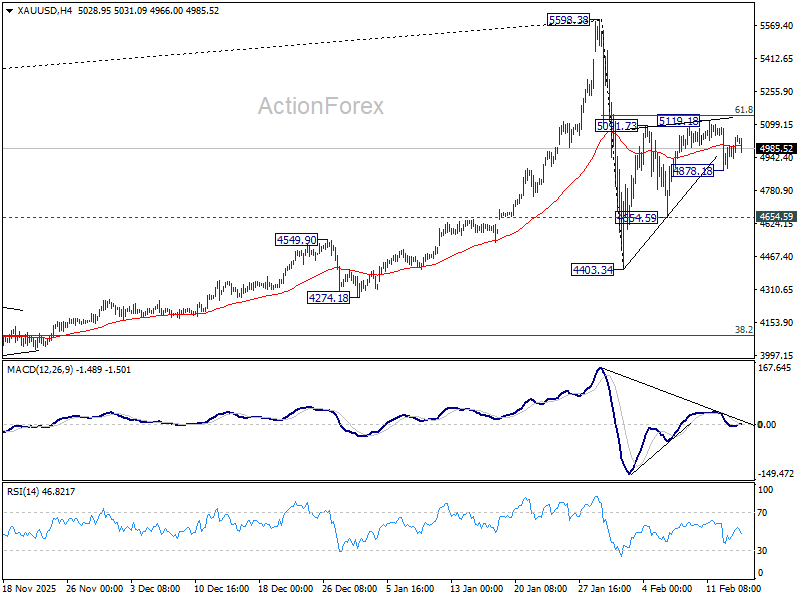
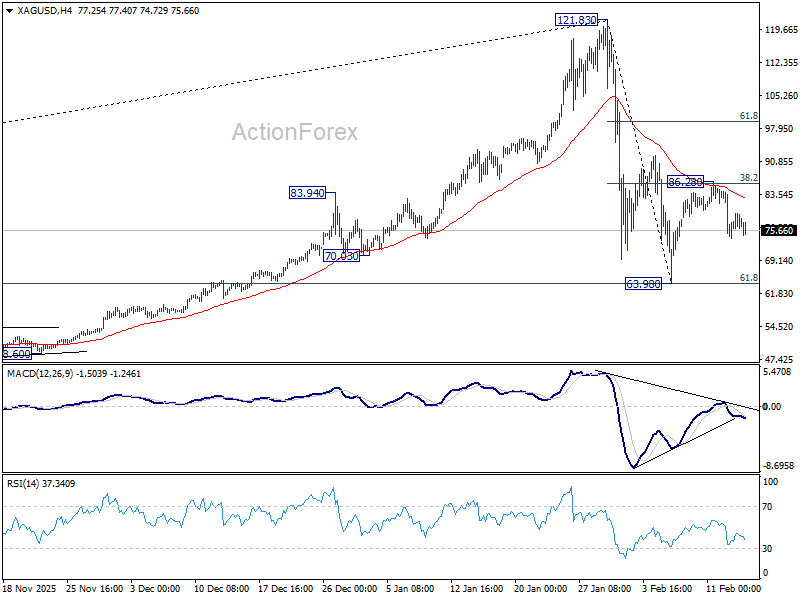
Gold and Silver risk revisiting February lows as corrective rebound fade
Gold and Silver are technically fragile after last week’s sharp mid-week selloff. The subsequent recoveries have lacked conviction, with momentum indicators failing to show meaningful upside traction. Price action suggests sellers remain in control in the near term. A retest of the early February lows now looks increasingly likely, particularly if Dollar stages a more notable rebound.
In broader context, both metals have transitioned into medium-term corrective phases. The powerful, unified macro narrative that fueled last year’s record-breaking rally is no longer present. Instead of a dominant theme like geopolitics or central bank policies, price movements are now more technical and intermarket-driven.
Technically, Gold’s break below its near-term rising trend line raises the risk that rebound from 4,403.34 has already completed at 5,119.18 in a three-wave corrective structure. As long as 5119.18 caps upside, near-term risks remain mildly skewed lower. Break below 4,878.18 temporary low could trigger acceleration toward 4654.59 support. A firm move through that level would open the door for retest of 4,403.34.
Silver shows similar vulnerability. Strong rejection at the 85 resistance zone — where 55 4H MACD rolled over and 38.2% retracement of 121.83 to 63.98 at 85.46 converged — suggests rebound from 63.98 has likely completed at 86.28. Deeper fall would be seen back to retest 63.98. But an immediate break there is not expected. Range trading between 63.98 and 86.28 may dominate in near term before broader decline from 121.83 resumes.
The week ahead: RBNZ hold, Fed minutes, UK CPI, and AU employment
This week’s macro calendar lacks a blockbuster event, but central bank communication and key inflation prints could still shift rate expectations at the margin. RBNZ stands as the only policy meeting, while FOMC minutes, UK CPI, and Australian employment data provide additional catalysts.
RBNZ is widely expected to hold OCR at 2.25%. After an aggressive easing cycle, policymakers are now in prolonged pause mode, allowing prior rate cuts to filter through economy. Growth has shown tentative stabilization, but recovery remains uneven. Inflation rebounded to 3.1% in Q4 from prior quarter, while one-year inflation expectations rose to 2.59%. Although uptick grabbed attention, with spare capacity lingering and unemployment still above average, RBNZ has little urgency to reverse course.
Late 2026 or early 2027 remains base case for an RBNZ rate hike. Guidance on tightening remains premature. However, tone matters. If policymakers sound increasingly confident that recovery is taking hold, markets could begin to price earlier normalization. That would offer near-term support to NZD, particularly against soft Dollar backdrop.
In US, focus shifts to FOMC minutes from January meeting. Rates were left unchanged at 3.50–3.75%, with only Governors Christopher Waller and Stephen Miran dissenting in favor of a cut. Both are well-known doves, so attention will center on broader committee debate.
The key question is whether majority views easing cycle as completed, or merely paused. March hold is effectively locked in, but nuance in discussion could shift June pricing slightly. Markets will parse language around inflation progress and labor market resilience for clues.
UK data calendar is heavier. Employment, wage growth, CPI, and retail sales all arrive as markets increasingly price March rate cut following dovish hold by BoE. Inflation dynamics remain decisive. Any faster-than-expected slowdown would cement expectations for imminent easing. Conversely, sticky wage growth would complicate picture and limit downside for Sterling. Political instability continues to weigh on GBP sentiment, leaving currency sensitive to macro surprises.
Australia’s employment data is another focal point. RBA surprised markets earlier this year by returning to rate hike stance amid renewed inflation pressure. While Q1 CPI remains critical for determining May decision, solid job and wage data would keep tightening bias alive.
Beyond that, Japan GDP, Canada CPI, and flash PMIs from major economies round out calendar.
Here are some highlights for the week:
- Monday: New Zealand BNZ services; Japan GDP; Eurozone industrial production; Canada housing starts, manufacturing sales.
- Tuesday: RBA minutes; Japan tertiary industry index; Germany CPI final; UK employment; Germany ZEW; Canada CPI; US Empire state manufacturing.
- Wednesday: New Zealand PPI; RBNZ rate decision; Japan trade balance; UK CPI, PPI; US durable goods orders; industrial production, FOMC minutes.
- Thursday: Australia employment; Eurozone current account; Canada new housing price index, trade balance; US jobless claims, Philly Fed survey, trade balance.
- Friday: Australia PMIs; Japan PMIs; UK retail sales, PMIs; Eurozone PMIs; Canada retail sales; US GDP revision, personal income and spending, PCE inflation, PMIs.
EUR/CHF Daily Outlook
Daily Pivots: (S1) 0.9099; (P) 0.9122; (R1) 0.9135; More....
EUR/CHF is staying in consolidations above 0.9092 and intraday bias remains neutral. Further decline is expected as long as long as 0.9180 resistance holds. Firm break of 0.9092 will resume larger down trend and target 261.8% projection of 0.9394 to 0.9268 from 0.9347 at 0.9143. However, considering bullish convergence condition in 4H MACD, decisive break of 0.9180 will indicate short term bottoming, and bring stronger rebound towards 55 D EMA (now at 0.9236).
In the bigger picture, down trend from 0.9928 (2024 high) is still in progress with falling 55 W EMA (now at 0.9258) intact. Next target is 61.8% projection of 1.1149 to 0.9407 from 0.9928 at 0.8851. Outlook will stay bearish as long as 0.9394 resistance holds, in case of recovery.
Gold and Silver risk revisiting February lows as corrective rebound fade
Gold and Silver are technically fragile after last week’s sharp mid-week selloff. The subsequent recoveries have lacked conviction, with momentum indicators failing to show meaningful upside traction. Price action suggests sellers remain in control in the near term. A retest of the early February lows now looks increasingly likely, particularly if Dollar stages a more notable rebound.
In broader context, both metals have transitioned into medium-term corrective phases. The powerful, unified macro narrative that fueled last year’s record-breaking rally is no longer present. Instead of a dominant theme like geopolitics or central bank policies, price movements are now more technical and intermarket-driven.
Technically, Gold’s break below its near-term rising trend line raises the risk that rebound from 4,403.34 has already completed at 5,119.18 in a three-wave corrective structure. As long as 5119.18 caps upside, near-term risks remain mildly skewed lower. Break below 4,878.18 temporary low could trigger acceleration toward 4654.59 support. A firm move through that level would open the door for retest of 4,403.34.
Silver shows similar vulnerability. Strong rejection at the 85 resistance zone — where 55 4H MACD rolled over and 38.2% retracement of 121.83 to 63.98 at 85.46 converged — suggests rebound from 63.98 has likely completed at 86.28. Deeper fall would be seen back to retest 63.98. But an immediate break there is not expected. Range trading between 63.98 and 86.28 may dominate in near term before broader decline from 121.83 resumes.
USD/JPY Falls to Key Support as AI Concerns Pressure Stocks
Last week, USD/JPY started higher after Sanae Takaichi’s strong election win. However, as the result was largely expected, selling soon entered the market. Even though U.S. employment data came in stronger than expected, adding 130,000 jobs and lowering the chances of a near-term U.S. rate cut, USD/JPY still ended the week lower.
U.S. stocks also fell over the week, with technology shares leading the decline. Investors are increasingly concerned about how artificial intelligence could affect existing business models. Weaker-than-expected U.S. Retail Sales added further pressure, although lower CPI data helped ease some inflation worries.
Bitcoin remained under pressure, with sellers continuing to dominate and concerns growing about its longer-term outlook. Gold, on the other hand, continued its steady rise as investors looked for stability.
Markets This Week
U.S. Stocks
Concerns about the impact of AI continued to dominate markets last week, a theme we have seen throughout 2026. After hitting record highs earlier in the week, the Dow turned lower as negative sentiment spread. The move below the 10-day moving average suggests the recent uptrend may be over for now. With AI concerns unlikely to disappear soon, selling into rallies may offer better trading opportunities this week. Resistance is at 50,500, 51,000, and 51,500, while support is at 49,500, 49,000, 48,500, and 48,000.
Japanese Stocks
The Nikkei started the week higher as markets viewed Takaichi’s victory as positive for Japanese stocks. However, weakness in U.S. equities and a stronger yen limited further gains. Although the recent uptrend remains strong, the market may move lower in the short term, especially if U.S. stocks stay under pressure. Without fresh positive news, gains may be difficult to sustain, so sideways to slightly lower movement is possible this week. Resistance is seen at 58,000円, 59,000円, and 60,000円, while support is at 56,000円, 55,000円, 54,000円, and 53,000円.
USD/JPY
USD/JPY moved lower as traders took profit after Takaichi’s victory. Attention has shifted to the narrowing interest rate gap between the U.S. and Japan, as the Bank of Japan continues to signal that further rate hikes are possible. The pair is still holding above key support at 152 and is trading well below the 10-day moving average, so a short-term bounce at the start of the week is possible. However, weaker-than-expected U.S. data could quickly push the pair lower again. Resistance is at 155, 156, 158, and 159, while support is at 152, 151, and 150.
Gold
Gold had a relatively quiet week, trading around the key $5,000 level. Prices moved lower at times, but strong buying interest remained, showing that gold is still in demand. Buying opportunities may offer the better strategy overall, but with the chart pointing to sideways movement near $5,000, buying on dips rather than chasing rallies may be the smarter short-term approach. Resistance is seen at $5,100, $5,200, $5,500, and $5,600, while support is at $4,900, $4,800, and $4,650.
Crude Oil
WTI crude traded sideways last week and failed to break above recent resistance, as tensions in Iran did not escalate further and the technical picture weakened. With prices now below the 10-day moving average, the market appears to be in a range, with slightly lower levels more likely in the short term. Resistance remains at $66.50, $70, and $75, while support is at $60, $55, and $50.
Bitcoin
Bitcoin traded sideways last week as investors reviewed the recent sharp fall and continued to question its long-term future. The price has moved back above the 10-day moving average, which is now flat, suggesting that another large drop is less likely in the short term. For now, range trading may offer the best opportunities as the market waits for clearer direction. Resistance is at $70,000, $75,000, $80,000, and $85,000, while support is at $65,000, $60,000, and $55,000.
This Week’s Focus
- Monday: Japan GDP and Industrial Production, E.U. Industrial Production
- Tuesday: E.U. German CPI and ZEW Economic Sentiment, U.K. Unemployment Rate
- Wednesday: Japan Trade Balance, U.K. CPI, U.S. Durable Goods, Housing Starts, Industrial Production and FOMC Meeting Minutes
- Thursday: Australia Unemployment Rate, U.S. Trade Balance
- Friday: Japan National CPI, U.K. Retail Sales and S&P Global Manufacturing PMI, E.U. HCOB Eurozone Manufacturing PMI, U.S. PCE Price index, S&P Global Manufacturing PMI, New Home Sales and Michigan Consumer Sentiment
Although the week may begin quietly due to the U.S. holiday, it could become more interesting as markets focus on Wednesday’s key economic announcements and the Fed minutes. Investors will be watching closely to see whether U.S. stocks come under further pressure. USD/JPY is approaching an important support level and is likely to see increased volatility. Meanwhile, Bitcoin has consolidated at lower levels and is worth monitoring closely for potential trading opportunities.
Japan sidesteps technical recession as Q4 growth barely grows by 0.1% qoq
Japan’s economy narrowly avoided a technical recession in Q4, but the rebound fell short of expectations. GDP rose just 0.1% qoq, below the 0.4% forecast, though an improvement from Q3’s -0.6% contraction. On an annualized basis, growth came in at 0.2%, recovering from -2.6% but well under the expected 1.6%.
Private consumption, which accounts for more than half of output, edged up 0.1%. Demand for mobile phones provided support, though spending on food and autos declined. External demand was weak, with exports falling -0.3% qoq, dragged down by soft automobile shipments.
Investment provided modest offsets. Business spending rose 0.2%, supported by strong demand for semiconductor-manufacturing equipment, while housing investment jumped 4.8%.
NZ BNZ services falls to 50.9, employment weakness offsets sales strength
New Zealand’s BusinessNZ Performance of Services Index eased from 51.7 to 50.9 in January, slipping further below the survey’s historical average of 52.8. While the index remains marginally in expansion territory, the details reveal a mixed picture. Activity and sales improved from 52.5 to 54.2, but employment deteriorated from 49.6 to 49.1, staying firmly in contraction. New orders edged lower from 52.1 to 51.8, suggesting demand momentum is softening at the margin.
Sentiment remains subdued. The proportion of negative comments rose sharply to 58.7%, up from 50.4% in December and 52.9% in November. Respondents cited seasonal disruptions from Christmas–New Year holidays, fewer enquiries, and a prolonged post-holiday lull. Elevated living and operating costs continue to weigh on business confidence, underscoring fragile recovery conditions.
Still, BNZ Senior Economist Doug Steel struck a more constructive tone, noting that data since late 2025 has reinforced confidence that positive momentum can be sustained. While services growth is hardly robust, the economy appears to be expanding gradually.
EUR/USD At Pivotal Juncture As Sellers Guard Resistance
Key Highlights
- EUR/USD found support at 1.1765 and corrected some losses.
- A key bullish trend line is forming with support at 1.1850 on the 4-hour chart.
- GBP/USD is consolidating above the 1.3600 support.
- Gold prices could resume upside if there is a move above $5,150.
EUR/USD Technical Analysis
The Euro dipped below 1.1800 against the US Dollar before the bulls appeared. EUR/USD found support near 1.1765 and recently started a recovery wave.
Looking at the 4-hour chart, the pair climbed above 1.1800 and the 38.2% Fib retracement level of the downward move from the 1.2082 swing high to the 1.1765 low. The pair even settled above the 100 simple moving average (red, 4-hour) and the 200 simple moving average (green, 4-hour).
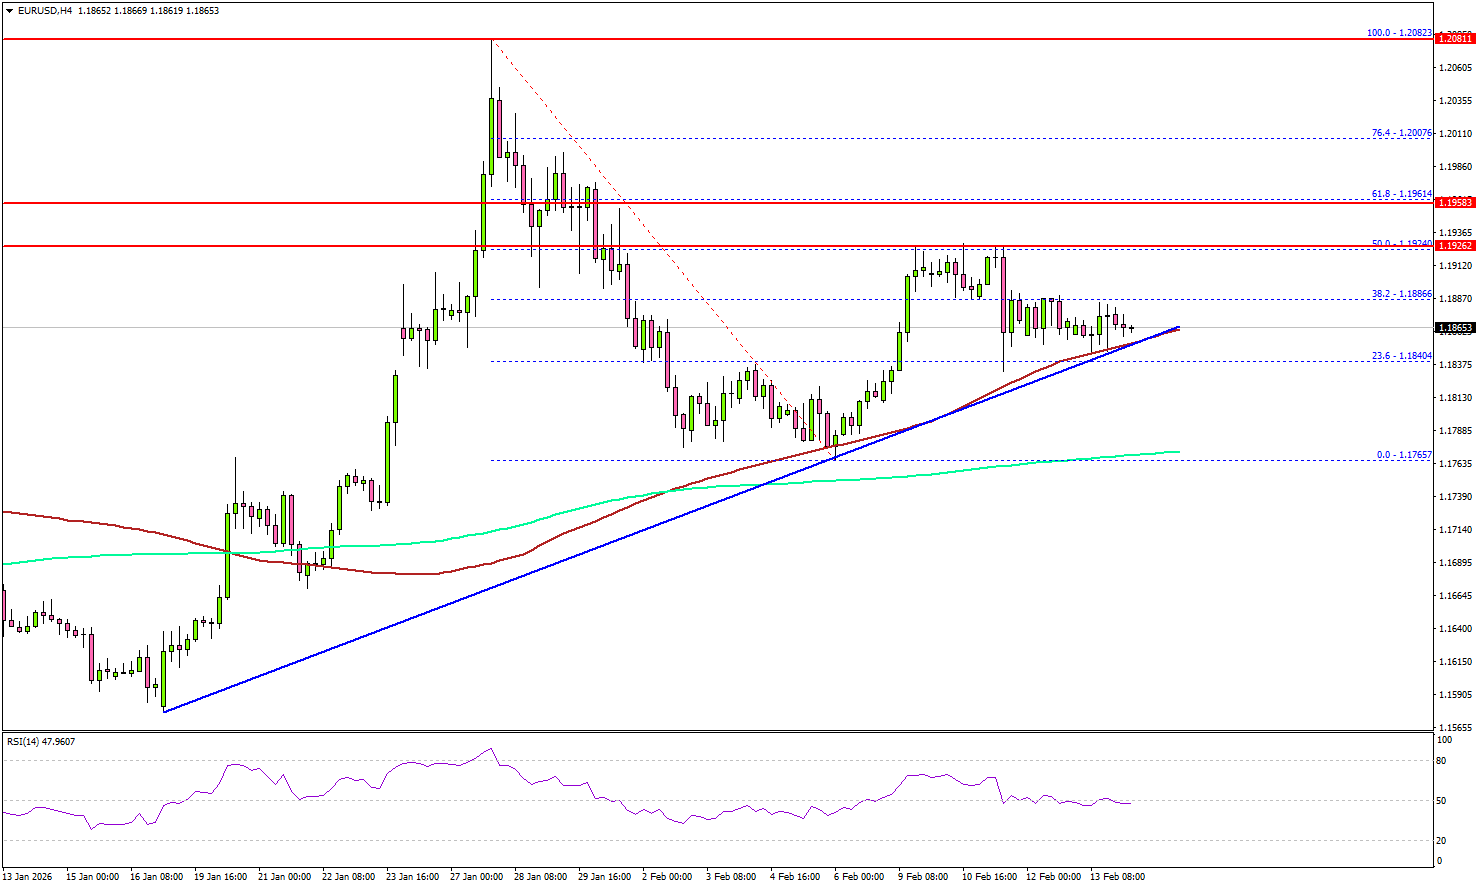
On the upside, the pair is now facing hurdles near 1.1920 and the 50% Fib retracement level of the downward move from the 1.2082 swing high to the 1.1765 low.
The next stop for the bulls might be 1.1960. A close above 1.1960 could open the doors for more gains. In the stated case, the bulls could aim for a move to 1.2000 or even 1.2050. The main resistance sits near 1.2080.
Immediate support could be 1.1850 and the trend line. The first major area for the bulls might be near 1.1800. The main support sits at 1.1765, below which the pair might gain bearish momentum. In the stated case, it could even revisit 1.1660.
Looking at GBP/USD, the pair is slowly moving higher from 1.3520 but faces hurdles near 1.3680 and 1.3720.
Upcoming Key Economic Events:
- Euro Zone Industrial Production for Dec 2025 (MoM) - Forecast -1.5%, versus +0.7% previous.