Sample Category Title
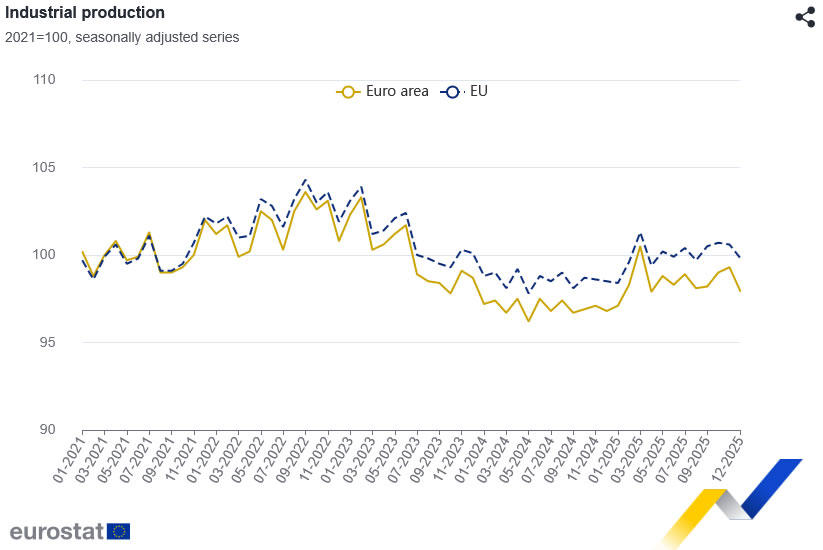
Eurozone industrial output contracts -1.4% mom in December, capital goods drag
Eurozone industrial production fell -1.4% mom in December, slightly better than expectation of -1.5% mom, but still signaling weak momentum into year-end. .
By category, capital goods output in Eurozone dropped sharply by -1.9%, highlighting fragile business investment conditions. Production of intermediate goods edged down -0.1%, energy slipped -0.3%, and non-durable consumer goods fell -0.3%. Durable consumer goods provided limited offset, rising 0.2%.
Across the broader EU, production declined -0.8% mom. Slovakia (-4.9%), Germany (-2.9%), and Spain (-2.6%) recorded the steepest contractions, while Luxembourg (+6.4%), Sweden (+4.4%), and Malta (+4.2%) posted solid gains.
Gold is Getting Cheaper, But It Is Not Critical
Gold on Monday fell to 4980 USD per ounce after rising more than 2% in the previous session. The volatility was driven by weaker-than-expected US inflation data.
Soft CPI data has boosted expectations of a Fed rate cut this year, and the market is now pricing in just over two cuts. Investors' focus was on the publication of the FOMC minutes, a preliminary estimate of US GDP and PCE inflation data. All of them could clarify the timing of the regulator's next move.
On the geopolitical front, attention is focused on the nuclear negotiations between the US and Iran, as well as the resumption of consultations on Tuesday to address the conflict involving Russia. These events could further affect risk appetite and demand for defensive assets.
Despite the current correction, gold remains supported by geopolitical uncertainty, continued purchases by central banks, and capital flows from sovereign bonds and currencies.
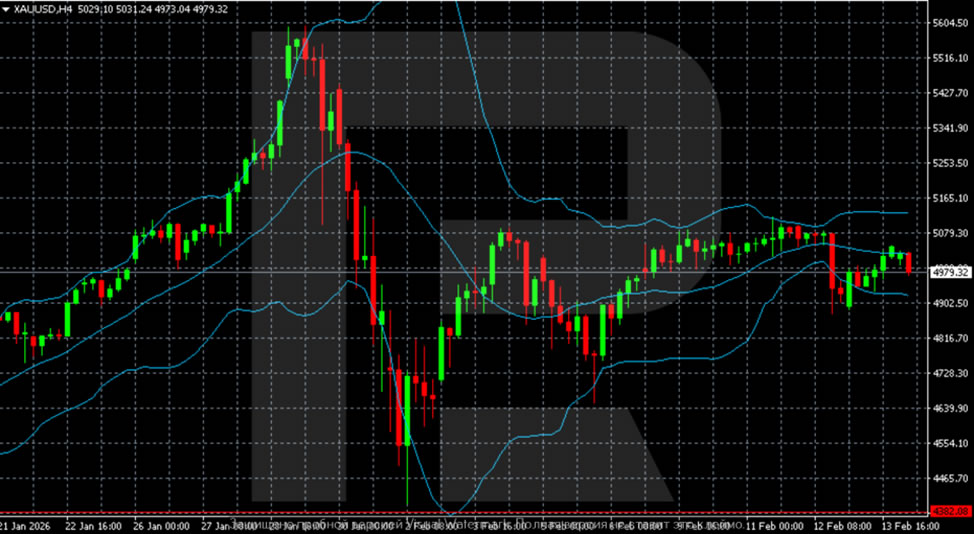
Technical Analysis
The H4 time frame for gold shows a transition after a sharp decline from the zone above 5500 USD to the consolidation phase. The price is held around 4980–5050, moving along the median line of the Bollinger Bands. Volatility has decreased noticeably, with a range forming. Key support stands at 4900–4920 USD, resistance at 5050–5100 USD.
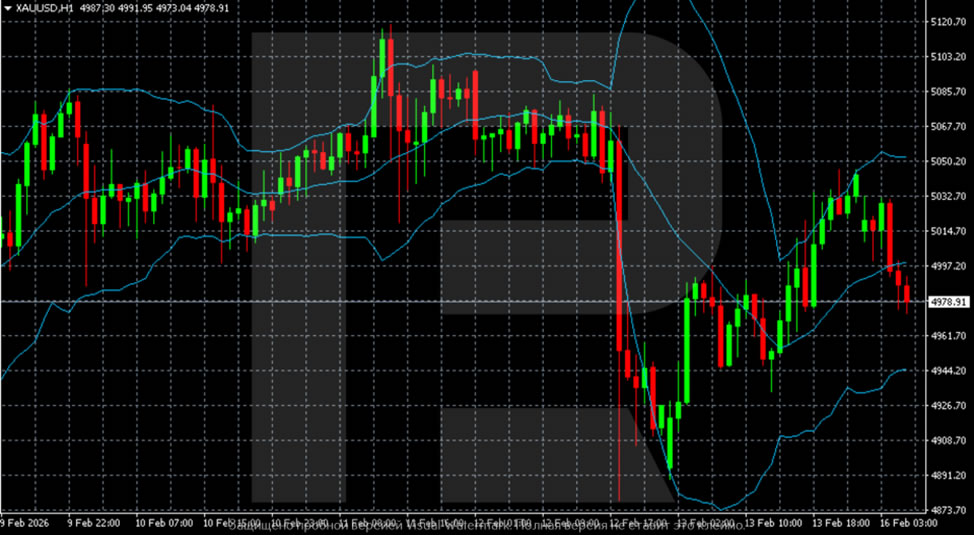
The H1 chart shows a sharp drop to 4880 USD, followed by a rebound. Now the price is again testing the area 4970-4990 USD. The Bollinger Bands are narrowing – the market is bracing for another move. Pinning above 5000 USD will open the way to 5050 USD; the loss of 4950 USD will increase pressure towards 4900 USD.
Conclusion
In summary, gold's modest pullback represents a healthy consolidation following an aggressive rally triggered by softer US inflation data. The fundamental backdrop remains constructive, with renewed Fed easing expectations, sustained central bank buying, and geopolitical tensions providing underlying support. Technically, the price is compressing within a narrowing range, signalling an imminent directional move. The critical threshold remains the psychological 5000 level: reclaiming it would target 5050 USD resistance, while sustained weakness below 4950 USD could open a retest of 4900 USD support. With key US data and geopolitical events looming, gold is poised for its next significant move.
GBP/USD Enters Consolidation Phase; USD/CAD Strengthens
GBP/USD started a downside correction from 1.3700. USD/CAD is gaining bullish momentum and might clear 1.3640 for more upside.
Important Takeaways for GBP/USD and USD/CAD Analysis Today
The British Pound rallied toward 1.3700 before the bears appeared.
There is a declining channel forming with support near 1.3585 on the hourly chart of GBP/USD at FXOpen.
USD/CAD is showing positive signs above the 1.3555 support zone.
There was a break above a key bearish trend line with resistance at 1.3555 on the hourly chart at FXOpen.
GBP/USD Technical Analysis
On the hourly chart of GBP/USD at FXOpen, the pair gained pace for a move toward 1.3700, as discussed in the previous analysis. The British Pound failed to stay above 1.3700 and started a downside correction below 1.3660 against the US Dollar.
The pair traded below 1.3630, the 50-hour simple moving average, and the 50% Fib retracement level of the upward move from the 1.3508 swing low to the 1.3712 high.
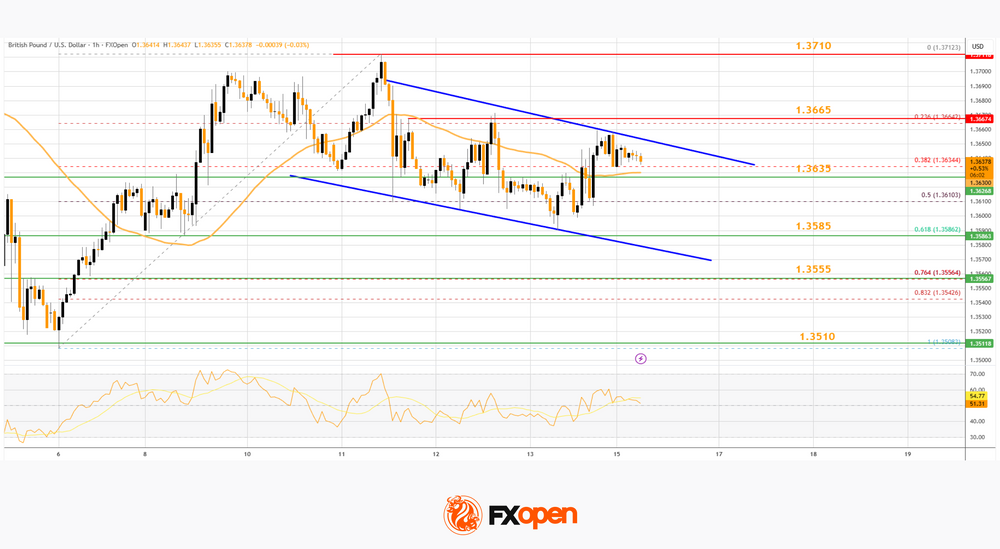
Finally, the bulls appeared near 1.3600, and the pair trimmed some losses. It is back above 1.3630 and the 50-hour simple moving average. Immediate hurdle on the upside is near 1.3665.
The first major resistance is 1.3710. The main sell zone sits at 1.3740. A close above 1.3740 might spark a steady upward move. The next stop for the bulls might be near 1.3800. Any more gains could lead the pair toward 1.3880 in the near term.
If there is a fresh decline, initial bid zone on the GBP/USD chart sits at 1.3635. The next major area of interest could be 1.3585. There is also a declining channel forming with support near 1.3585, below which there is a risk of another sharp decline. In the stated case, the pair could drop toward 1.3510.
USD/CAD Technical Analysis
On the hourly chart of USD/CAD at FXOpen, the pair formed a strong base above 1.3500. The US Dollar started a fresh increase above 1.3540 and 1.3550 against the Canadian Dollar.
More importantly, there was a break above a key bearish trend line with resistance at 1.3555. The pair even climbed above the 50% Fib retracement level of the downward move from the 1.3724 swing high to the 1.3504 low.
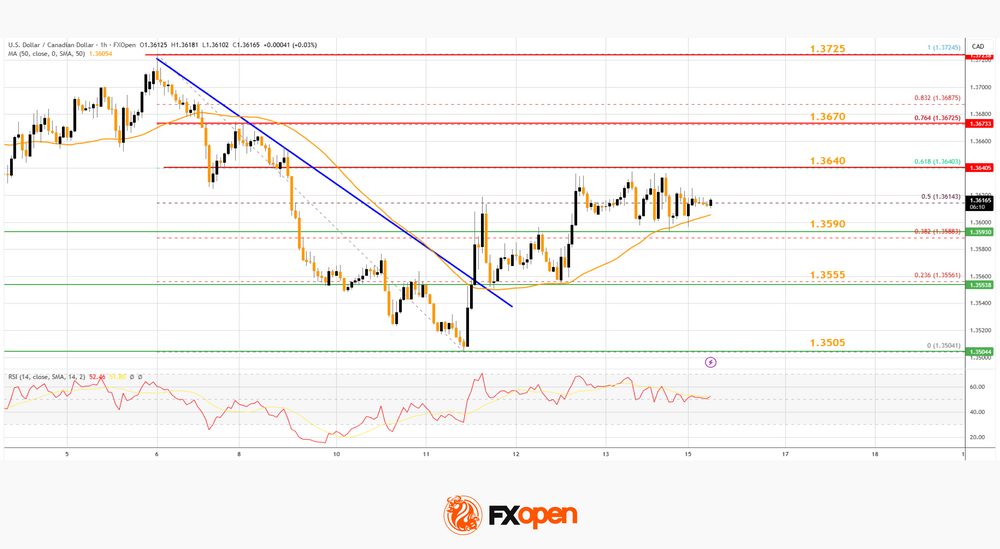
The pair is now consolidating above the 50-hour simple moving average. If there is another increase, the pair might face hurdles near 1.3640 and the 61.8% Fib retracement.
A clear upside break above 1.3640 could start another steady increase. In the stated case, the pair could test 1.3725. A close above 1.3725 might send the pair toward 1.3800. Any more gains could open the doors for a test of 1.3920.
Initial support is near the 50-hour simple moving average and 1.3590. The next key breakdown zone could be 1.3555. The main hurdle for the bears might be 1.3505 on the same USD/CAD chart.
A downside break below 1.3505 could push the pair further lower. The next key area of interest might be 1.3465, below which the pair might visit 1.3420.
Trade over 50 forex markets 24 hours a day with FXOpen. Take advantage of low commissions, deep liquidity, and spreads from 0.0 pips (additional fees may apply). Open your FXOpen account now or learn more about trading forex with FXOpen.
This article represents the opinion of the Companies operating under the FXOpen brand only. It is not to be construed as an offer, solicitation, or recommendation with respect to products and services provided by the Companies operating under the FXOpen brand, nor is it to be considered financial advice.
BoJ’s Ueda holds first post-election talks with Takaichi
BoJ Governor Kazuo Ueda met Prime Minister Sanae Takaichi for the first time since the LDP’s decisive election win, in talks closely watched by markets for clues on policy direction. The timing is notable, with expectations growing that inflation pressures tied to Yen weakness could accelerate interest rate normalization.
Following the meeting, Ueda described the talks as a “general exchange of views on economic and financial developments,” adding that the prime minister made no specific monetary policy requests. Pressed on whether he secured political backing for the BoJ’s rate hikes, Ueda declined to provide details, saying there was nothing he could disclose about the substance of the discussion.
Speculation has intensified in recent weeks that rising cost-of-living pressures may prompt the BoJ to consider raising rates as early as March or April. While the meeting yielded no explicit signals, the absence of public disagreement may be interpreted as tacit support for the central bank’s cautious path toward policy tightening.
Dollar Index (DXY) Stabilises After CPI Release
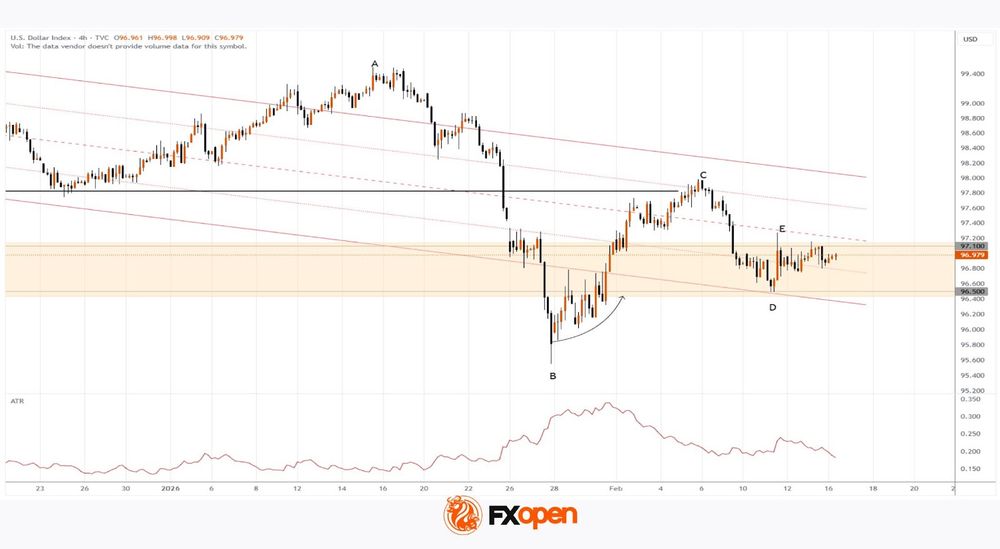
Late January proved exceptionally volatile in the currency markets, as reflected by the ATR indicator. However, following the rebound from the four-year low (B), price swings on the DXY chart have narrowed, suggesting a degree of market stabilisation.
Friday’s CPI release had the potential to trigger sharp moves in the US dollar index, yet no major surprises emerged. According to Forex Factory data, the actual figures were broadly in line with analysts’ forecasts (inflation eased slightly as expected), and market participants headed into the long weekend, with US financial markets closed on Monday for Presidents’ Day.
Technical Analysis of the DXY Chart
On 27 January, when analysing the Dollar Index (DXY) chart, we:
- → updated the descending channel (marked in red);
- → noted that DXY was trading near a long-term support zone from which price had rebounded twice in the second half of 2025;
- → suggested that the downward momentum could be losing strength.
However, the market had other plans. Although the rally towards peak C (the former support level) is a clear sign that bearish pressure is fading, it was preceded by a false downside breakout of the aforementioned support area.
Swing analysis also points to stabilisation, based on the proportional structure:
- → peak C formed within the 50%–61.8% retracement of the A→B impulse;
- → trough D developed within the 50%–61.8% retracement of the B→C move;
- → peak E emerged within the 50%–61.8% retracement of the C→D impulse.
The previously highlighted support zone is now acting as a range where supply and demand appear balanced.
While the descending channel remains technically valid, the confident trajectory (indicated by the arrow) from the B low suggests that bears may struggle to maintain the prevailing trend of recent months.
Trade global index CFDs with zero commission and tight spreads (additional fees may apply). Open your FXOpen account now or learn more about trading index CFDs with FXOpen.
This article represents the opinion of the Companies operating under the FXOpen brand only. It is not to be construed as an offer, solicitation, or recommendation with respect to products and services provided by the Companies operating under the FXOpen brand, nor is it to be considered financial advice.
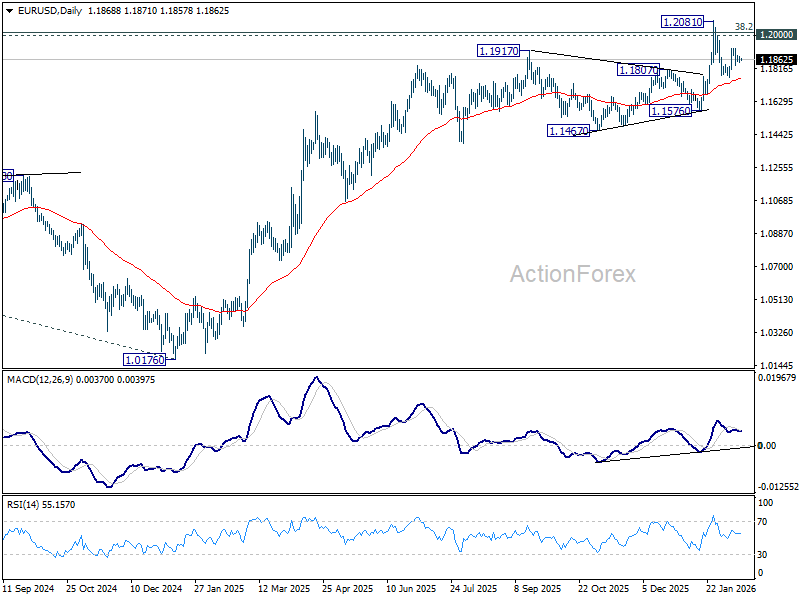
EUR/USD Daily Outlook
Daily Pivots: (S1) 1.1849; (P) 1.1867; (R1) 1.1887; More….
Intraday bias in EUR/USD remains neutral as range trading continues. On the upside, above 1.1928 will target a retest on 1.2081 high. Decisive break there and sustained trading above 1.2 psychological level will carry larger bullish implications. On the downside, however, sustained trading below 55 D EMA (now at 1.1760) will raise the chance of reversal on rejection by 1.2, and target 1.1576 support for confirmation.
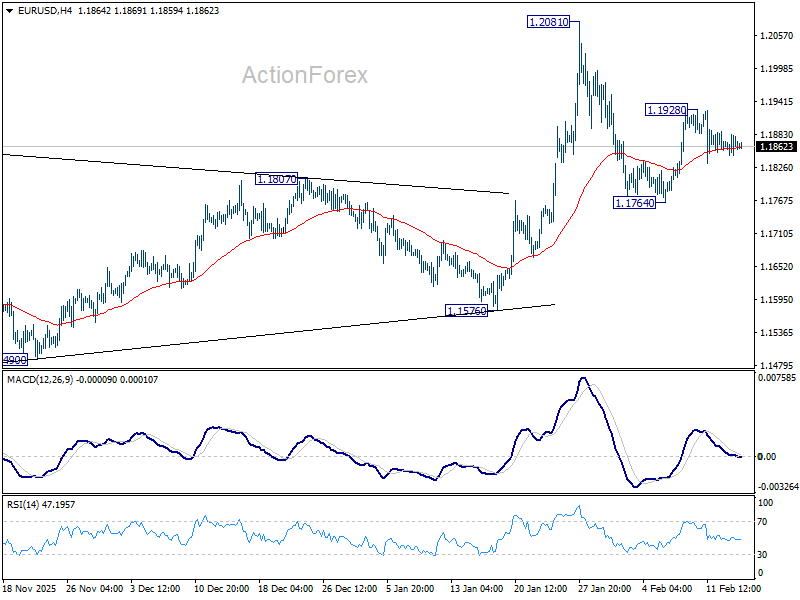
In the bigger picture, as long as 55 W EMA (now at 1.1485) holds, up trend from 0.9534 (2022 low) is still in favor to continue. Decisive break of 1.2 key psychological level will add to the case of long term bullish trend reversal. Next medium term target will be 138.2% projection of 0.9534 to 1.1274 from 1.0176 at 1.2581. However, sustained trading below 55 W EMA will argue that rise from 0.9534 has completed as a three wave corrective bounce, and keep long term outlook bearish.
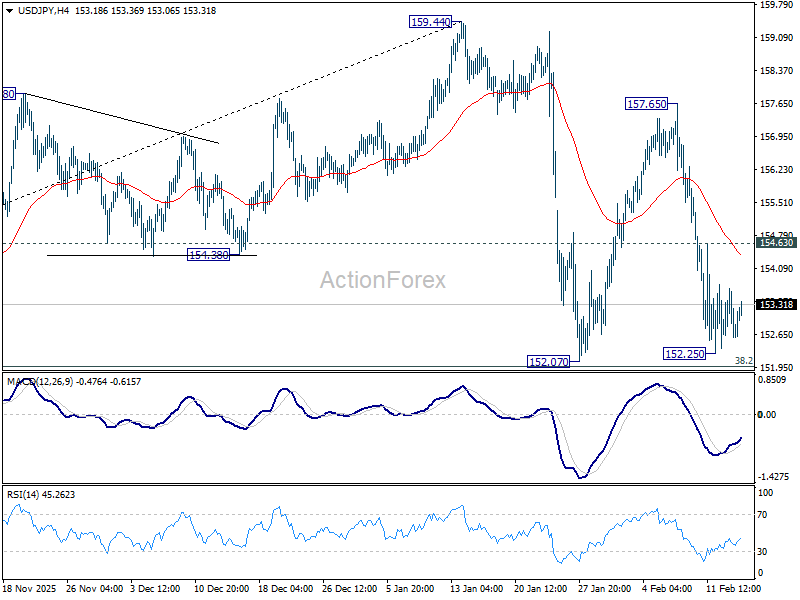
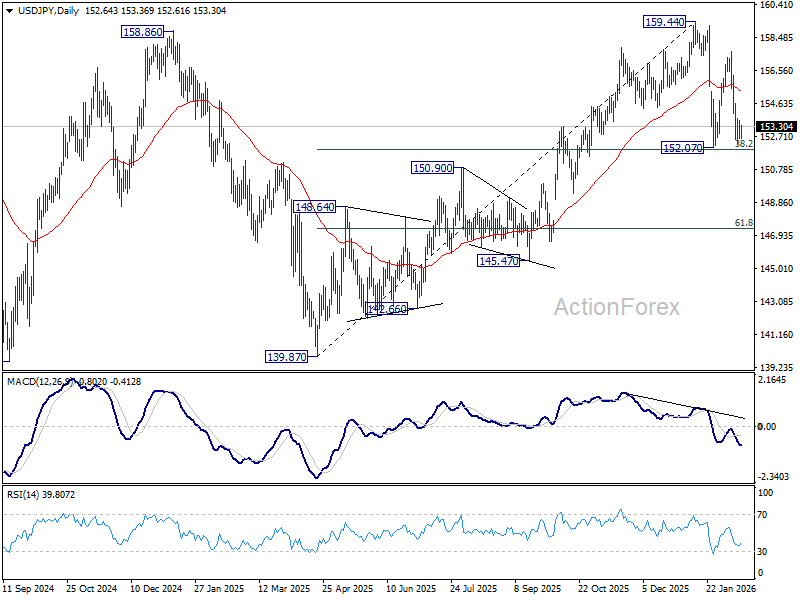
USD/JPY Daily Outlook
Daily Pivots: (S1) 152.31; (P) 152.99; (R1) 153.38; More...
Intraday bias in USD/JPY remains neutral for the moment. With 38.2% retracement of 139.87 to 159.44 at 151.96 intact, price actions from 159.44 are seen as a consolidations pattern only. On the upside, firm break of 154.63 minor resistance will bring stronger rebound towards 157.65. However, decisive break of 151.96 will argue that it's reversing the rise from 139.87 already. In this case, deeper fall should then be seen to 61.8% retracement at 147.34, and possibly below.
In the bigger picture, outlook is unchanged that corrective pattern from 161.94 (2024 high) should have completed with three waves at 139.87. Larger up trend from 102.58 (2021 low) could be ready to resume through 161.94. This will remain the favored case as long as 55 W EMA (now at 151.77) holds. However, sustained break of 55 W EMA will argue that the pattern from 161.94 is extending with another falling leg.
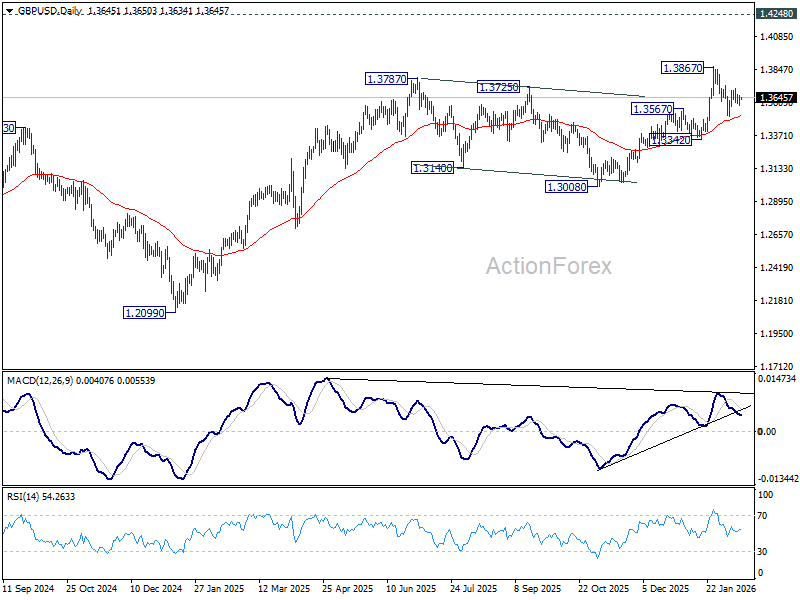
GBP/USD Daily Outlook
Daily Pivots: (S1) 1.3610; (P) 1.3635; (R1) 1.3679; More...
Range trading continues in GBP/USD and intraday bias remains neutral at this point. On the upside, firm break of 1.3732 will suggest that pullback from 1.3867 has completed as a correction at 1.3507. Retest of 1.3867 should be seen first. Firm break there will resume larger up trend towards 1.4284 key resistance. On the downside, however, sustained trading below 55 D EMA (now at 1.3511) will raise the chance of larger scale correction, and target 1.3342 support for confirmation.
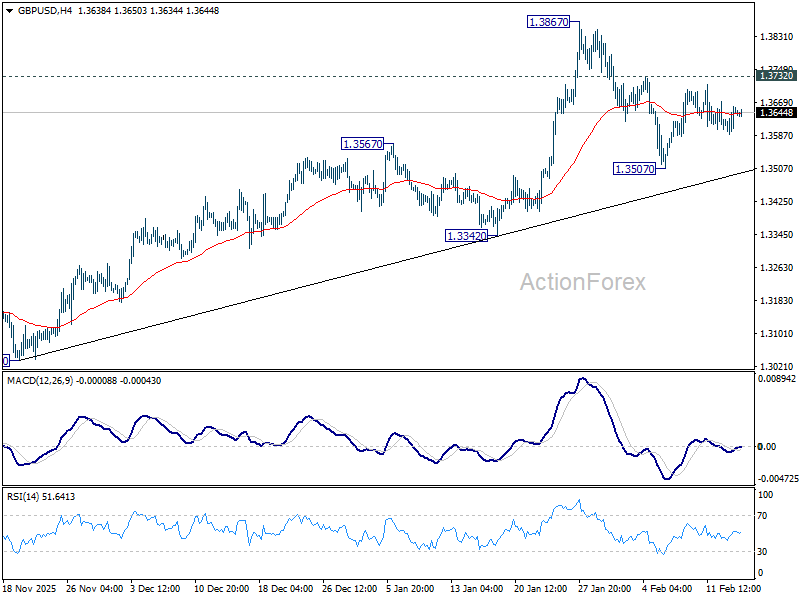
In the bigger picture, rise from 1.0351 (2022 low) still in progress and should target 1.4284 key resistance (2021 high). Decisive break there will add to the case of long term bullish trend reversal. For now, outlook will stay bullish as long as 1.3008 support holds, even in case of deep pullback.
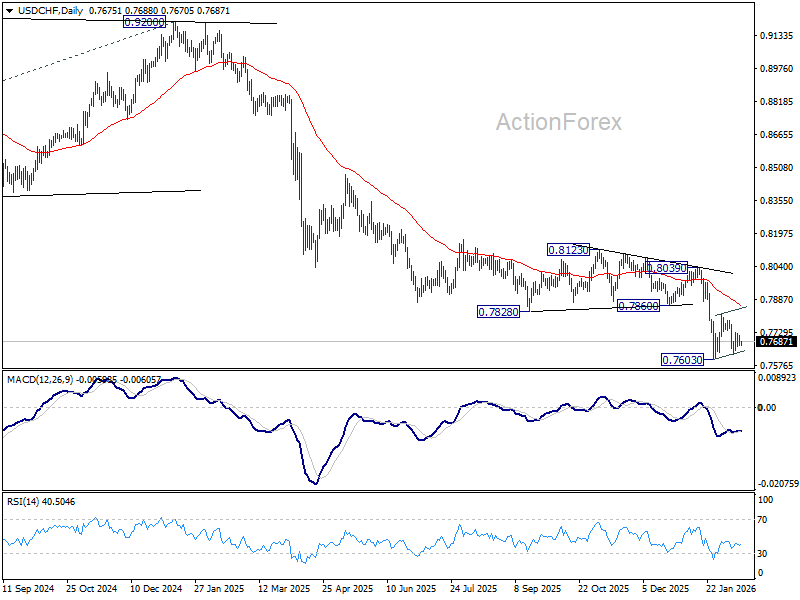
USD/CHF Daily Outlook
Daily Pivots: (S1) 0.7656; (P) 0.7688; (R1) 0.7707; More….
USD/CHF is extending the consolidations pattern from 0.7603 and intraday bias stays neutral. Stronger rebound cannot be ruled out but upside should be limited by 55 D EMA (now at 0.7855) to complete the pattern. On the downside, break of 0.7603 will resume larger down trend, and target 0.7382 projection level next.
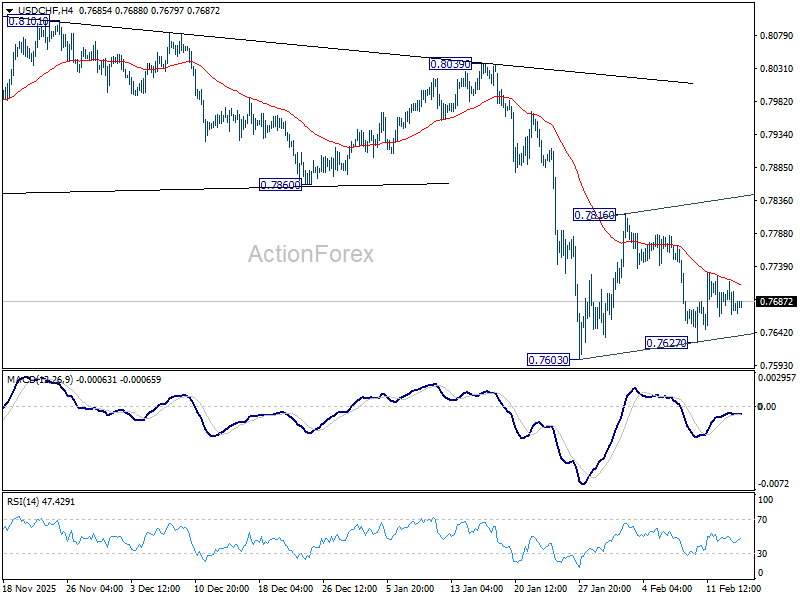
In the bigger picture, down trend from 1.0342 (2017 high) is still in progress. Next target is 100% projection of 1.0146 (2022 high) to 0.8332 from 0.9200 at 0.7382. In any case, outlook will stay bearish as long as 0.8123 resistance holds.
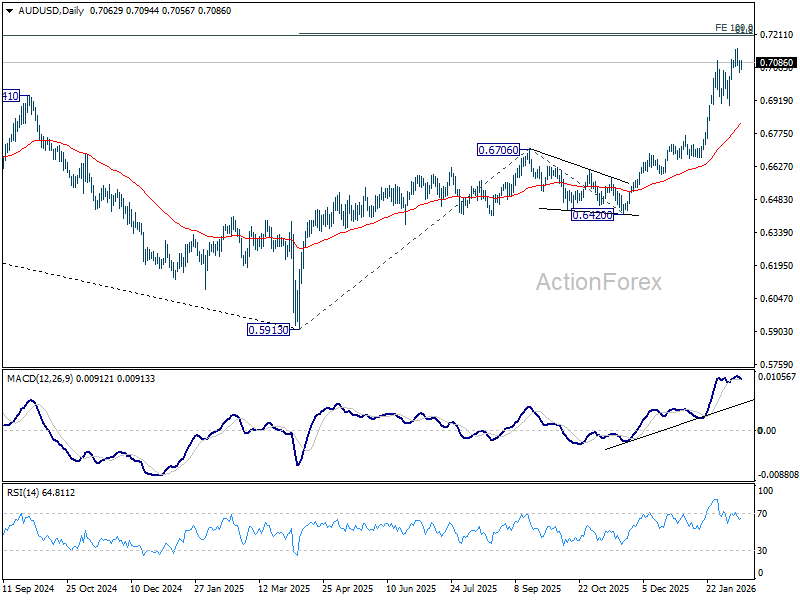
AUD/USD Daily Report
Daily Pivots: (S1) 0.7046; (P) 0.7072; (R1) 0.7100; More...
Intraday bias in AUD/USD remains neutral and more consolidations could be seen below 0.7146 short term top. Deeper retreat might be seen but downside should be contained above 0.6896 support to bring another rally. On the upside, above 0.7146 will resume larger up trend to 100% projection of 0.5913 to 0.6706 from 0.6420 at 0.7213.
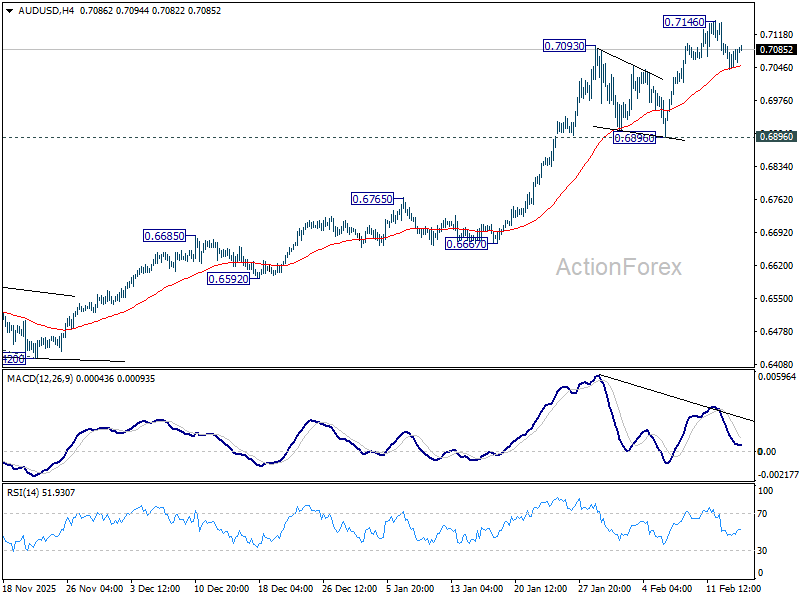
In the bigger picture, current development argues that rise from 0.5913 (2024 low) is reversing whole down trend from 0.8006 (2021 high). Further rally should be seen to 61.8% retracement of 0.8006 to 0.5913 at 0.7206. This will remain the favored case as long as 0.6706 resistance turned support holds, even in case of deep pullback.