Sample Category Title
Tech Under Pressure as US Returns from Long Weekend
With the US and many Asian markets closed, the first trading session of the week was rather calm in Europe. European yields moved lower, influenced by downside pressure on their US peers following a softer-than-expected CPI print on Friday.
A benchmark for European bond yields retreated to its lowest level since the beginning of December. The Stoxx 600 added a meagre 0.13%, while defence stocks outperformed — unsurprisingly — following a tense meeting among Western allies over the weekend, to which the US did not send its highest-level official, and where Germany and France began discussing nuclear deterrence. Elsewhere, we observed slight divergence across regions: the German DAX fell, pressured by tech stocks, while the CAC 40 eked out a small gain, helped by inflows into defence names.
European banks rallied on reports that policymakers are looking to strengthen the euro’s global status as a reserve currency and in international transactions. Europe is considering offering euro liquidity to global partners in times of crisis. This would represent a significant step for the currency —perhaps one of the clearest signs that Europe is looking to stand up to the US amid the White House unwelcome trade and security policies.
Such a move would be supportive for the euro, potentially increasing demand — particularly as the euro area offers relative policy stability at a time when the Federal Reserve (Fed) is facing credibility questions. Policy missteps in the US — on trade, political and geopolitical fronts — risk fuelling inflation, and inflation erodes a currency’s purchasing power – the last thing you want for a reserve currency. Moreover, if the euro circulates more widely across the globe, companies may increasingly issue euro-denominated debt, and euro-denominated transaction would reduce FX risk for European firms. There are clear positives in this context.
There are, however, risks to consider. A global currency often implies a stronger currency, and strength is not ideal for exporters, as it makes products more expensive abroad and may weigh on demand. This is why France has backed the plan but has called for a clearer assessment of the economic implications. In the end, if the US loses ground, someone else gains — but who?
In the short run, euro traders did not react. The euro continued to give back its early-month gains against a broadly stronger US dollar. The dollar, however, is softer this morning in Asia, with the USDJPY retracing yesterday’s gains. The yen is strengthening on expectations that weak growth figures will not derail the Bank of Japan’s normalization path, as inflation remains a priority and the price component of yesterday’s GDP report was the only upside surprise.
Today, the US returns from its long weekend to investors who are no longer hungry for risk. The Nikkei 225 is down this morning despite a notable fall in Japanese yields on rising bets that Sanae Takaichi would maintain fiscal discipline while supporting the economy (though how that balance would be achieved remains unclear!). SoftBank Group, a proxy for Big Tech appetite, is down more than 5.5% at the time of writing, while Nasdaq Composite futures are leading losses among major US indices.
In the absence of fresh catalysts — and with existing headwinds unchanged — there is little reason for this bearish tech momentum to reverse. On the contrary, concerns around increasingly leveraged AI spending are intensifying.
As Bloomberg noted: “Debt investors are worried that the biggest tech companies will keep borrowing until it hurts in the battle to develop the most powerful artificial intelligence.”
They may keep borrowing until it hurts — both themselves and their investors.
Big Tech is undergoing a significant financial transformation. Companies such as Meta, Alphabet and Microsoft historically maintained strong balance sheets and substantial cash reserves, supported by relatively capital-light business models.
AI, however, is capital-intensive. It requires building complex and advanced data centres equipped with next-generation chips. Investment comes before monetization. And you do not build a data centre overnight — the lag between capital expenditure and revenue generation can be 12–18 months, sometimes longer depending on grid access and deployment. During that period, free cash flow can come under pressure.
Big Tech has significantly increased AI capital expenditure in recent years. While these companies continue to generate substantial operating cash flow, rising investment means that incremental spending is increasingly financed through debt issuance. Higher leverage alters a company’s risk profile, even if from historically strong starting positions.
Happily, markets have hedging mechanisms. One way to hedge rising credit risk is through credit derivatives — namely credit default swaps (CDS).
Oracle Corporation CDS became one of the barometers of AI-related debt risk last year, partly because Oracle already carried meaningful leverage relative to peers, and partly because CDS on mega-cap tech companies either not existed for years, or liquidity was low given their strong credit profiles.
But since mid-last year, CDS activity tied to major AI spenders has increased in both visibility and volume, reflecting a growing desire to hedge exposure. Instruments linked to companies including Amazon, Microsoft, Meta, Alphabet and even Nvidia have seen rising interest.
This means that investors are increasingly using CDS to hedge exposure to companies whose credit risk was once considered close to negligible.
What does this mean? It suggests that appetite for Big Tech is becoming more selective as AI spending accelerates and balance sheet dynamics evolve. A durable recovery in sentiment may require clearer visibility on monetization — or a valuation reset.
New Zealand Expected to Hold Rates Despite Australia’s Recent Hike
In focus today
Today, the UK jobs report for December is released. The unemployment rate is expected to remain fairly stable with consensus at 5.2% and the previous rate at 5.1%. Following the recent more dovish signs from the Bank of England, the pace of the cooling of the labour market will be key to gauge the timing of the next rate cut.
In Germany, the February ZEW survey is released. The assessment of both the current situation and expectations rebounded in January, which is a positive sign for the economy. Industrial orders have also rebounded, meaning there are tentative signs of a recovery taking shape in Germany, so we expect to see a further improvement in the February data.
Overnight, we expect the Reserve Bank of New Zealand (RBNZ) to maintain its monetary policy unchanged, in line with consensus. Markets are pricing the first rate hike only for Q4 even though the central bank of neighbouring Australia hiked rates already two weeks ago.
Economic and market news
What happened overnight
This morning for the US, we slightly adjusted our Fed call and now see two more 25bp rate cuts in June and September (prev. March and June). We then expect the Fed to maintain the terminal rate at 3.00-3.25% through the rest of 2026 and 2027. While last week's strong January jobs report alleviated the need for near-term policy easing, we still see a good case for the Fed resuming rate cuts in summer. Cooling wage growth and housing inflation as well as the risk of private consumption surprising negative are likely to tilt the balance towards a cut, when Kevin Warsh has his first meeting as the Fed chair in June.
What happened yesterday
In Sweden, it was a big surprise as seasonally adjusted unemployment dropped to 8.0% (cons: 8.8%), while employment remained unchanged at high levels. Both the December and January reading suggest fairly big revisions to the better for both the unemployment rate and the employment rate. The strong labour market should balance out some of the pressure on the Riksbank from the low inflation readings and should decrease the probability of a rate cut in H1.
Also in Sweden, inflation expectations decreased in February, particularly for the one-year horizon, which decreased to 1.4% from 1.5% in January. The decrease reflects the downside surprise in the January inflation figures.
In geopolitics, Iran conducted naval drills in the Strait of Hormuz, a vital shipping route, after the US on Sunday deployed an additional aircraft carrier in the region. This comes ahead of talks in Switzerland today, where Iranian Foreign minister Abbas Araghchi and US special envoy Steve Witkoff will meet to discuss nuclear weapons and Iran's missile program.
Equities: Little changed on Monday and in thin volumes as US and much of Asia were closed for holiday. European and Nordic equities little changed on headline with Stoxx 600 0.1% higher and OMX Nordic All-Share -0.1% lower. Risk off continued below the surface, with a defensive bias of banks, defence, telecom and insurance among the top performers. More importantly, tech stocks continued to underperform, which we view as the origin of the current defensive rotation. Hence, the modest rebound in software in US on Friday did not survive. This looks set to continue today, as US futures are -0.5-1% lower, with Russell 2000 and tech-heavy Nasdaq leading the declines.
FI and FX: Yesterday was a quiet day for fixed income as European yields remained largely unchanged with 2Y swap rates trading just below 2.20% and 2Y Bund yields at 2.05%. After long-end yields have declined over the past week with 2Y US Treasury yields down almost 10bp to 3.40% and 10Y US Treasury yields down about 15bp to 4.05% the US was out for Presidents' Day yesterday. Similarly, the USD broadly consolidated in a quiet start to the week, with EUR/USD holding in the mid-1.18-1.19 range. While NOK FX did very little during yesterday's session, momentum has in recent week still been strong supported by both global and domestic drivers. Today, we look for the latest labour market report out in the UK to see whether this can trigger a move out of the recent very narrow 0.86-0.87 range in EUR/GBP.
EUR/USD Daily Outlook
Daily Pivots: (S1) 1.1840; (P) 1.1859; (R1) 1.1872; More….
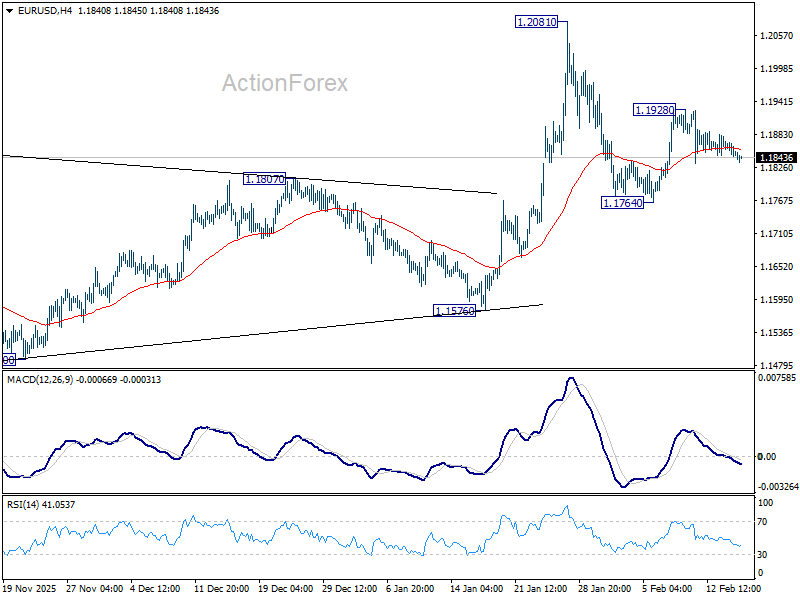
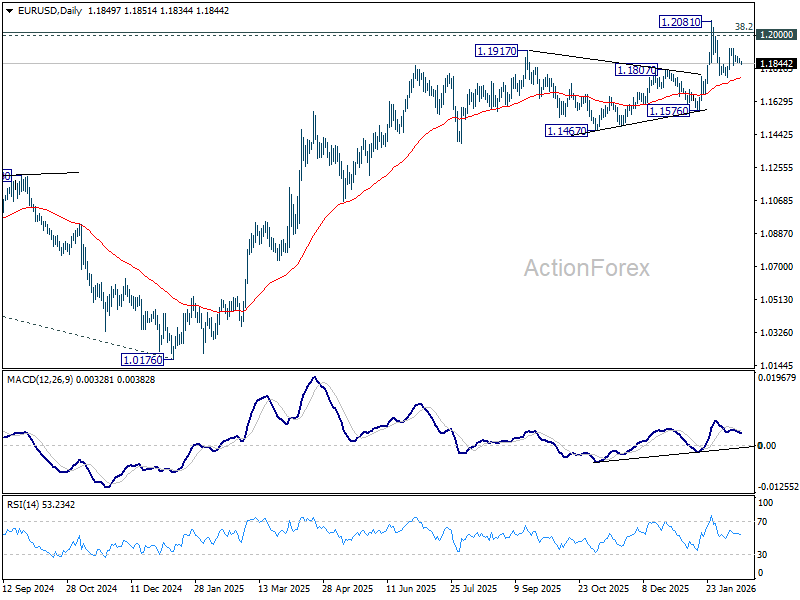
Intraday bias in EUR/USD remains neutral as sideway trading continues. On the upside, above 1.1928 will target a retest on 1.2081 high. Decisive break there and sustained trading above 1.2 psychological level will carry larger bullish implications. On the downside, however, sustained trading below 55 D EMA (now at 1.1760) will raise the chance of reversal on rejection by 1.2, and target 1.1576 support for confirmation.
In the bigger picture, as long as 55 W EMA (now at 1.1485) holds, up trend from 0.9534 (2022 low) is still in favor to continue. Decisive break of 1.2 key psychological level will add to the case of long term bullish trend reversal. Next medium term target will be 138.2% projection of 0.9534 to 1.1274 from 1.0176 at 1.2581. However, sustained trading below 55 W EMA will argue that rise from 0.9534 has completed as a three wave corrective bounce, and keep long term outlook bearish.
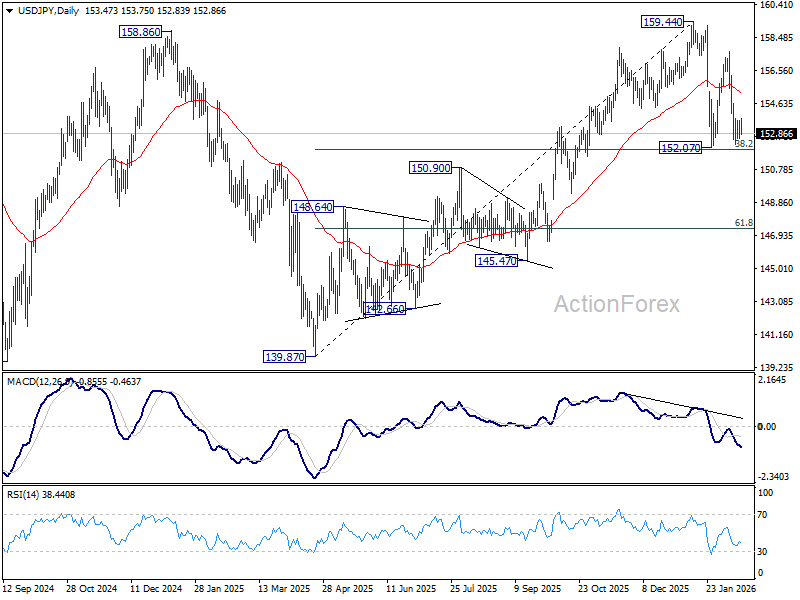
USD/JPY Daily Outlook
Daily Pivots: (S1) 152.89; (P) 153.27; (R1) 153.89; More...
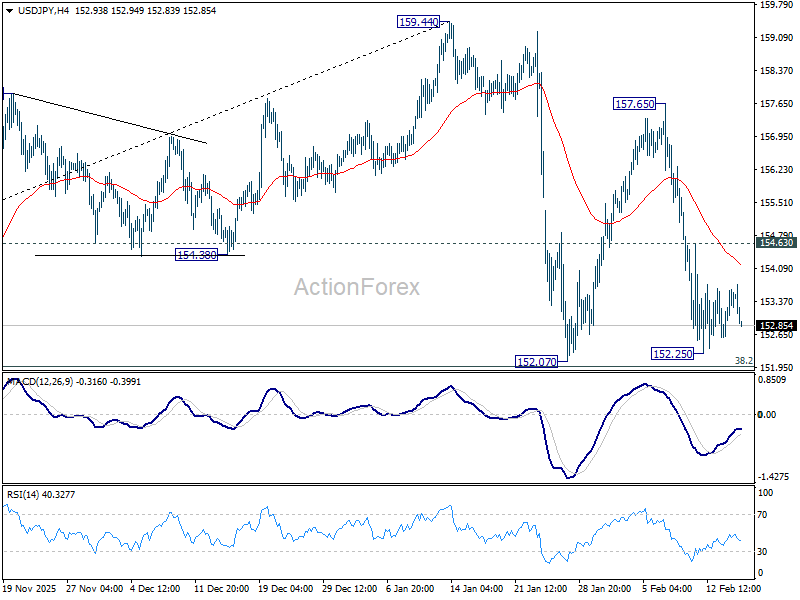
Intraday bias in USD/JPY remains neutral and outlook is unchanged. With 38.2% retracement of 139.87 to 159.44 at 151.96 intact, price actions from 159.44 are seen as a consolidations pattern only. On the upside, firm break of 154.63 minor resistance will bring stronger rebound towards 157.65. However, decisive break of 151.96 will argue that it's reversing the rise from 139.87 already. In this case, deeper fall should then be seen to 61.8% retracement at 147.34, and possibly below.
In the bigger picture, outlook is unchanged that corrective pattern from 161.94 (2024 high) should have completed with three waves at 139.87. Larger up trend from 102.58 (2021 low) could be ready to resume through 161.94. This will remain the favored case as long as 55 W EMA (now at 151.77) holds. However, sustained break of 55 W EMA will argue that the pattern from 161.94 is extending with another falling leg.
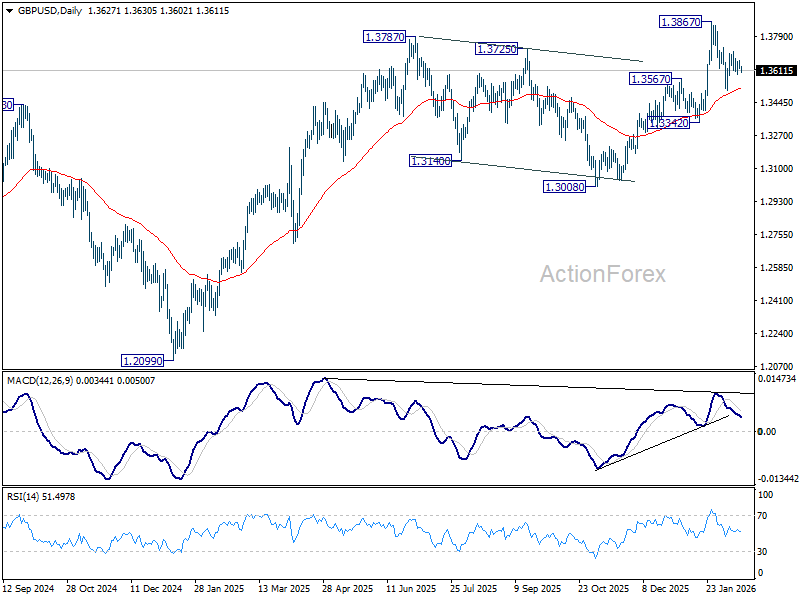
GBP/USD Daily Outlook
Daily Pivots: (S1) 1.3616; (P) 1.3639; (R1) 1.3653; More...
Sideway trading continues in GBP/USD and intraday bias remains neutral first. On the upside, firm break of 1.3732 will suggest that pullback from 1.3867 has completed as a correction at 1.3507. Retest of 1.3867 should be seen first. Firm break there will resume larger up trend towards 1.4284 key resistance. On the downside, however, sustained trading below 55 D EMA (now at 1.3518) will raise the chance of larger scale correction, and target 1.3342 support for confirmation.
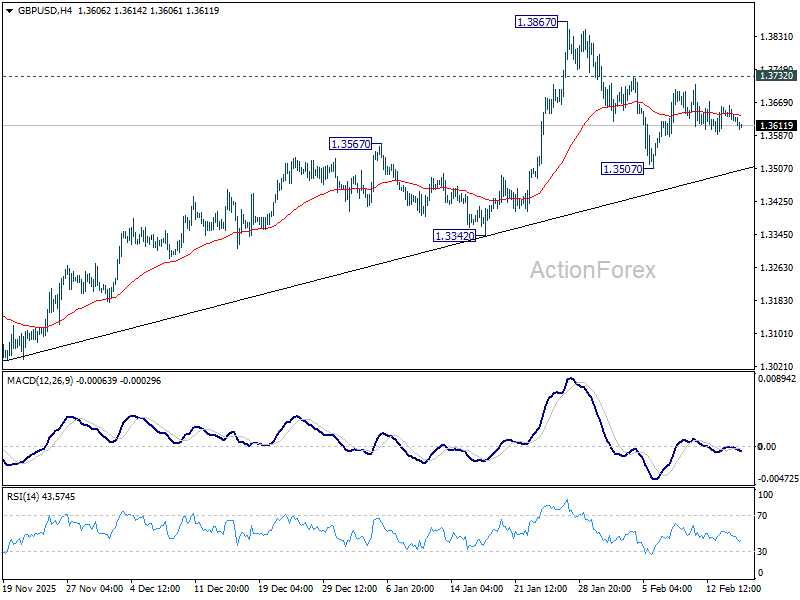
In the bigger picture, rise from 1.0351 (2022 low) still in progress and should target 1.4284 key resistance (2021 high). Decisive break there will add to the case of long term bullish trend reversal. For now, outlook will stay bullish as long as 1.3008 support holds, even in case of deep pullback.
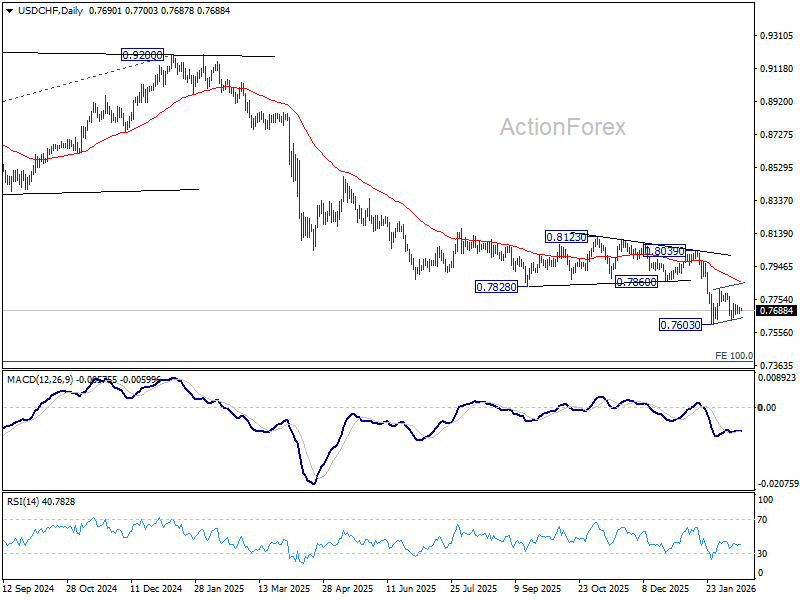
USD/CHF Daily Outlook
Daily Pivots: (S1) 0.7678; (P) 0.7692; (R1) 0.7709; More….
Intraday bias in USD/CHF stays neutral at this point, and consolidation from 0.7603 could extend. Stronger rebound cannot be ruled out but upside should be limited by 55 D EMA (now at 0.7855) to complete the pattern. On the downside, break of 0.7603 will resume larger down trend, and target 0.7382 projection level next.
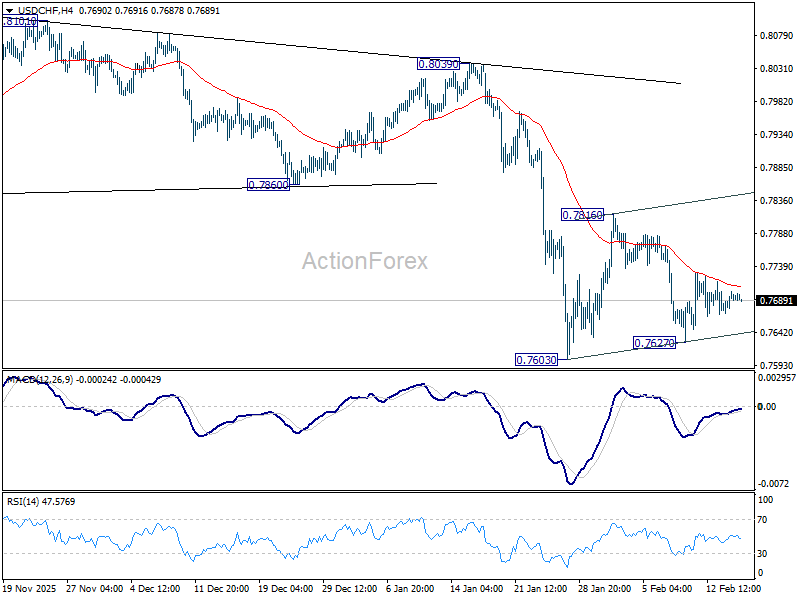
In the bigger picture, down trend from 1.0342 (2017 high) is still in progress. Next target is 100% projection of 1.0146 (2022 high) to 0.8332 from 0.9200 at 0.7382. In any case, outlook will stay bearish as long as 0.8123 resistance holds.
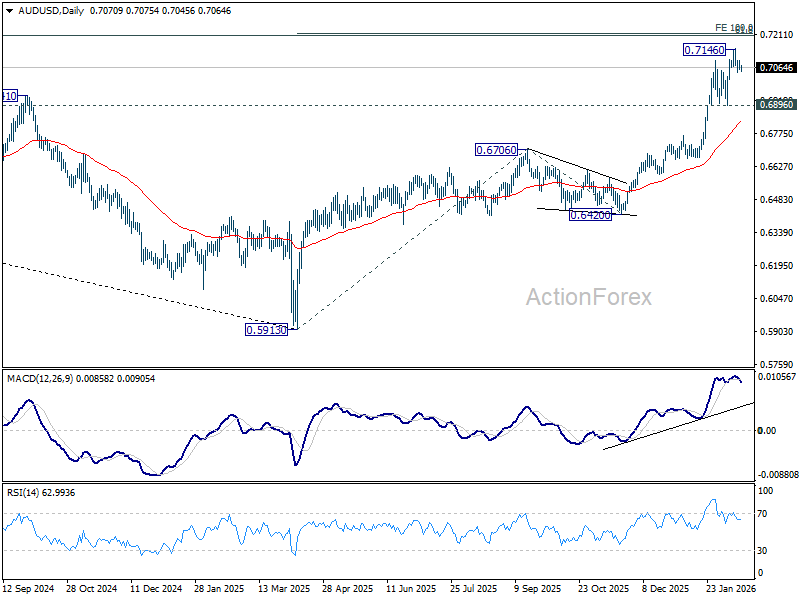
AUD/USD Daily Report
Daily Pivots: (S1) 0.7055; (P) 0.7076; (R1) 0.7093; More...
Intraday bias in AUD/USD stays neutral for the moment. Consolidation from 0.7146 would extend further and deeper retreat cannot be ruled out. But downside should be contained above 0.6896 support to bring another rally. On the upside, above 0.7146 will resume larger up trend to 100% projection of 0.5913 to 0.6706 from 0.6420 at 0.7213.
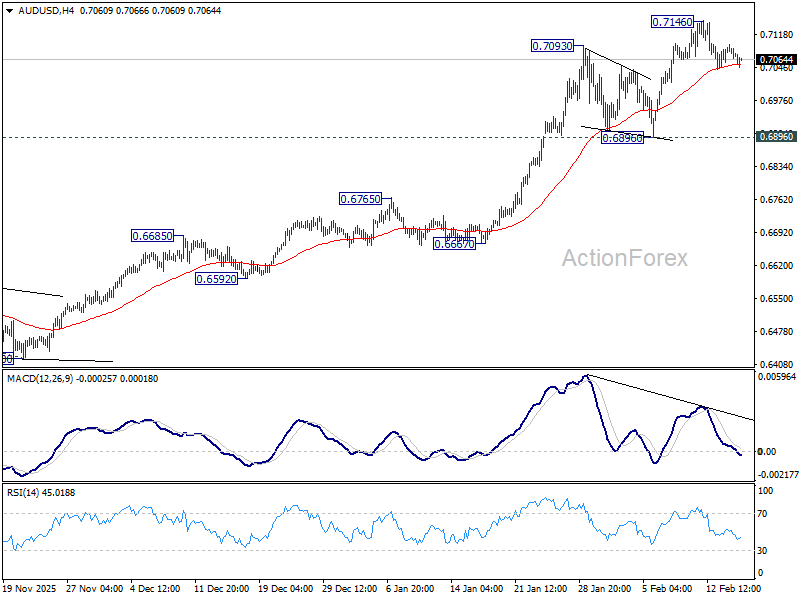
In the bigger picture, current development argues that rise from 0.5913 (2024 low) is reversing whole down trend from 0.8006 (2021 high). Further rally should be seen to 61.8% retracement of 0.8006 to 0.5913 at 0.7206. This will remain the favored case as long as 0.6706 resistance turned support holds, even in case of deep pullback.
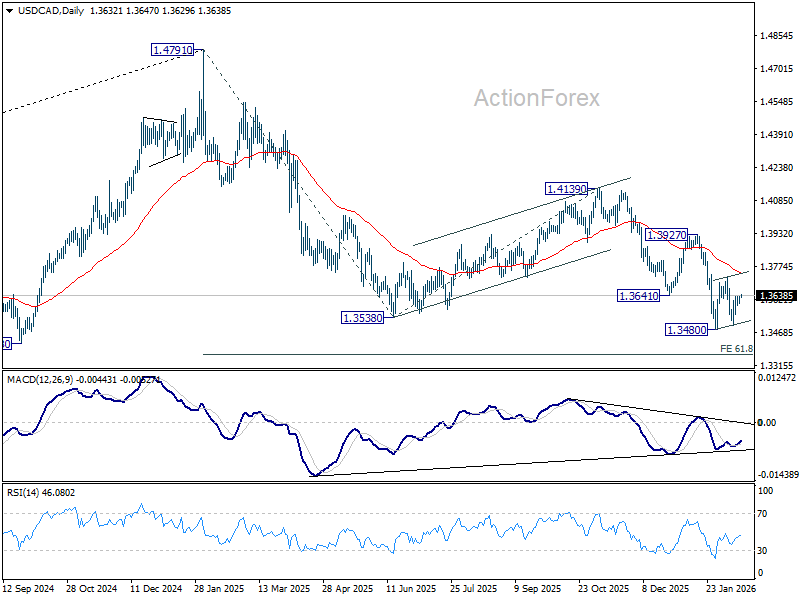
USD/CAD Daily Outlook
Daily Pivots: (S1) 1.3614; (P) 1.3627; (R1) 1.3651; More...
Intraday bias in USD/CAD remains neutral and more consolidations would be seen above 1.3480. While stronger rebound cannot be ruled out, upside should be limited by 55 D EMA (now at 1.3744) to complete the pattern. On the downside, firm break of 1.3480 will resume larger down trend from 1.4791 to 61.8% projection of 1.4791 to 1.3538 from 1.4139 at 1.3365.
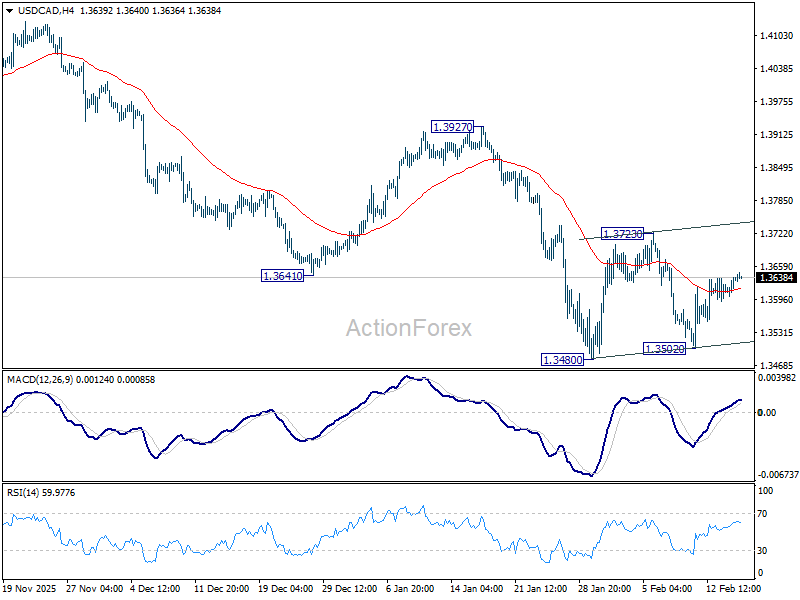
In the bigger picture, price actions from 1.4791 are seen as a corrective pattern to the whole up trend from 1.2005 (2021 low). Deeper fall could be seen as the pattern extends, to 61.8% retracement of 1.2005 to 1.4791 at 1.3069. For now, medium term outlook will be neutral at best, until there are signs that the correction has completed, or that a bearish trend reversal is confirmed.
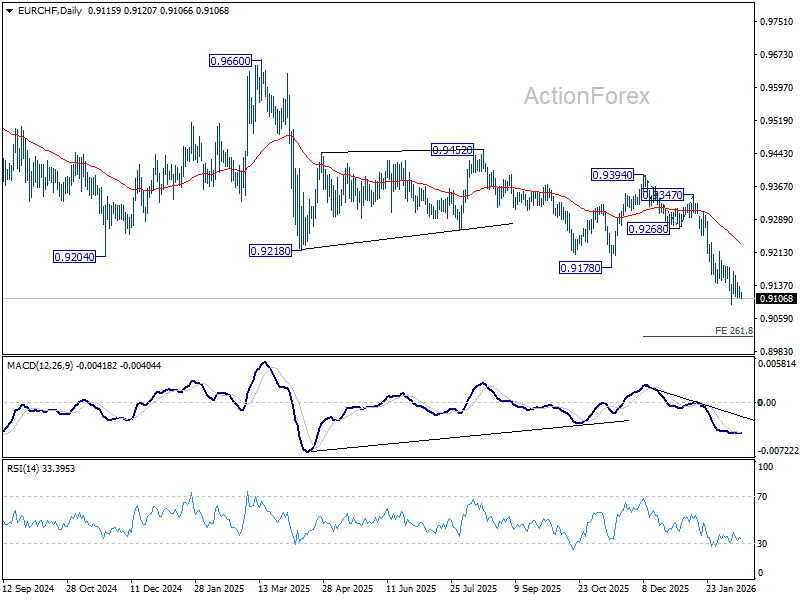
EUR/CHF Daily Outlook
Daily Pivots: (S1) 0.9110; (P) 0.9124; (R1) 0.9134; More....
Intraday bias in EUR/CHF remains neutral and more consolidations could be seen above 0.9092. Further decline is expected as long as long as 0.9180 resistance holds. Firm break of 0.9092 will resume larger down trend and target 261.8% projection of 0.9394 to 0.9268 from 0.9347 at 0.9143. However, considering bullish convergence condition in 4H MACD, decisive break of 0.9180 will indicate short term bottoming, and bring stronger rebound towards 55 D EMA (now at 0.9232).
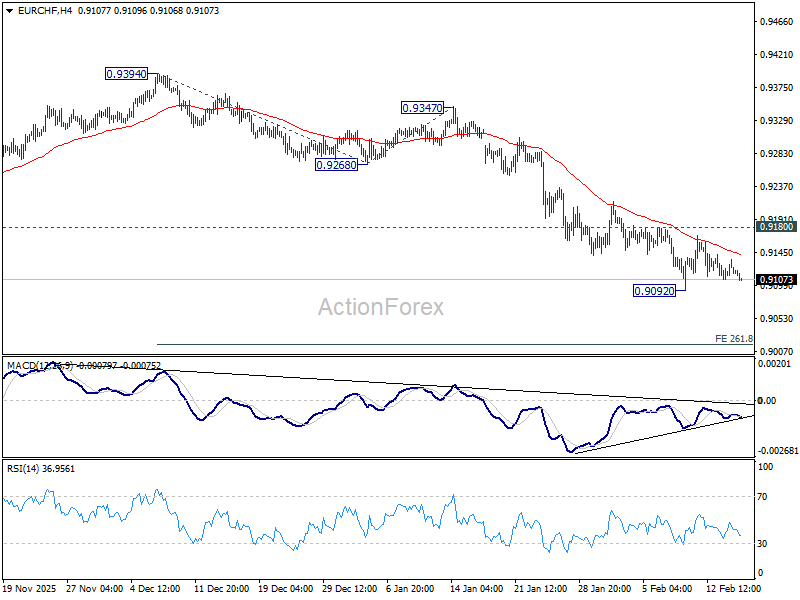
In the bigger picture, down trend from 0.9928 (2024 high) is still in progress with falling 55 W EMA (now at 0.9258) intact. Next target is 61.8% projection of 1.1149 to 0.9407 from 0.9928 at 0.8851. Outlook will stay bearish as long as 0.9394 resistance holds, in case of recovery.
EUR/GBP Daily Outlook
Daily Pivots: (S1) 0.8687; (P) 0.8695; (R1) 0.8704; More…
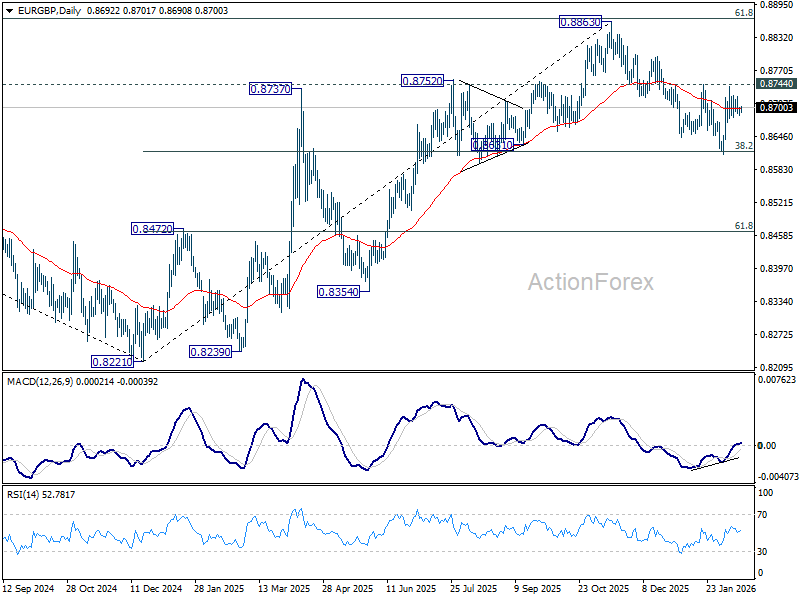
Range trading continues in EUR/GBP and intraday bias remains neutral. On the upside, decisive break of 0.8744 resistance will indicate that fall from 0.8863 has completed as a correction. Further rally should then be seen back to retest 0.8863 high. On the downside, sustained break of 38.2% retracement of 0.8221 to 0.8663 at 0.8618 will carry larger bearish implications and turn outlook bearish.
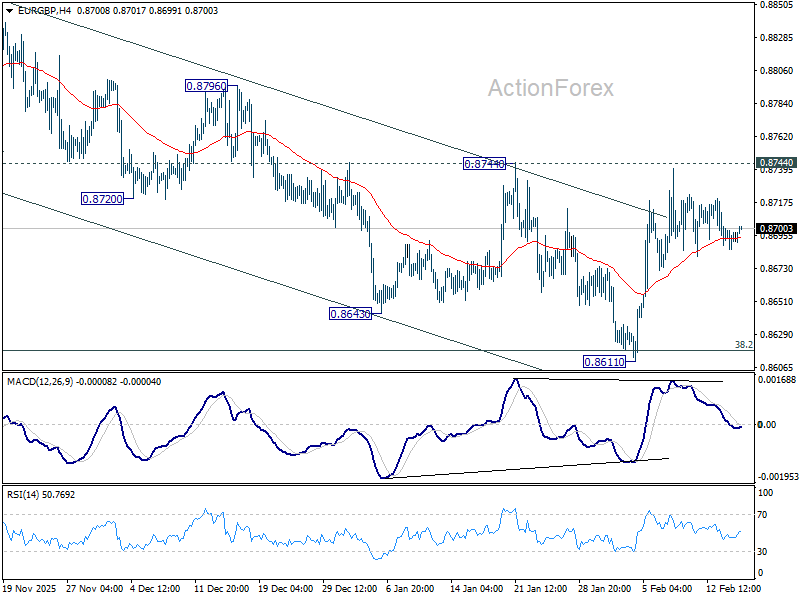
In the bigger picture, rise from 0.8221 medium term bottom (2024 low) is seen as a corrective move. Upside should be limited by 61.8% retracement of 0.9267 to 0.8221 at 0.8867. Sustained trading below 55 W EMA (now at 0.8631) should confirm that this corrective bounce has completed. In this case, deeper fall would be seen back to 0.8201/21 key support zone. However, decisive break of 0.8867 will suggest that EUR/GBP is already reversing whole decline from 0.9267 (2022 high). That should pave the way back to 0.9267.