
Sample Category Title
Fed’s Goolsbee urges patience, keeps door open to multiple 2026 rate cuts
Chicago Fed President Austan Goolsbee cautioned against overinterpreting last week’s CPI data, even as headline inflation slowed to 2.4%. In comments to CNBC, he stressed the need to confirm that easing price pressures are not temporary.
Goolsbee pointed to tariffs as a lingering uncertainty, noting that their longer-term impact could complicate the inflation outlook. For now, he prefers a wait-and-see approach rather than assuming that inflation is firmly on track toward 2%.
Still, Goolsbee kept the door open to additional easing next year. “If this proves to be transitory, and we can show that we’re on the path back to 2% inflation, I still think there’s several more rate cuts that can happen in 2026,” he said.
Sunset Market Commentary
Markets
UK gilts outperform global peers with yields pushing between 1.2 and 3.5 bps lower, accompanied by GBP weakness. EUR/GBP reaches for the YtD high just south of 0.875, up from a sub 0.87 reading in early European hours. GBP/USD (cable) loses the 1.36 big figure to revisit the February troughs. The moves follow this morning’s UK labour market report that surprised to the downside. Employment grew by 52k in the three months through December 2025 from the previous three-month (Jul-Sep) period. That was less than halve the 108k expected. A preliminary estimate for January printed at -11k. The unemployment rate in the same period rose to 5.2% with only the 5.3% pandemic peak standing in the way of a decade high. And wage growth (ex. bonus) decelerated to the slowest in five years. Barring a huge upward surprise in tomorrow’s CPI, the numbers all but cement a rate cut by the Bank of England in March. Governor Bailey had been the swing vote in an otherwise evenly split committee the last couple of times. He wanted - and just got - more evidence of wage pressures easing before supporting a further rate reduction. Money market pricing rose from 60% after the BoE February meeting to <75% yesterday before rising to more than 80% today.
US Treasuries’ gains in Asian and European dealings evaporated throughout the day. The front end first, following the ADP weekly employment change indicator. Longer tenors (almost) returned earlier gains when US investors joined. The four-month weekly MA in the week through January 30 rose from an upwardly revised 7.75k to 10.25k, printing higher readings for a third week straight now and suggesting improving hiring momentum. The 2-yr yield on a net daily basis adds 2.5 bp with the intraday movement spanning 6 bps. Bund yields drop 0.5-2 bps. The 2-yr tenor (flat) for now found support at the lower bound of a downward sloping trend channel with origins dating back from ECB Schnabel’s December speech (on markets pricing in rate hikes). Longer-term yields, both in Germany and in swap, recouped some of the intraday losses despite the fragile risk sentiment that reigned for most of the day. European equities whipsawed between gains and losses all day and currently are up 0.4%. Wall Street defied negative futures (up to -1%) with a flat open. Both the dollar and the Japanese yen return invigorated from the long weekend. USD/JPY balances out but a strong JGB performance this morning (yields down almost 10 bps at the long end) reveals appetite for Japanese assets. DXY rises to 97.4, EUR/USD drops to 1.182.
News & Views
German ZEW investor sentiment (current situation) improved from -72.7 to -65.9 in February, the second best level since July 2023. The export-oriented sectors showed moderate to strong improvements. Prospects have particularly improved for the chemical and pharmaceutical industries (+7.5 ), steel and metal production (+8.6) and mechanical engineering (+10.9). This likely reflects better than expected incoming orders at the end of 2025. Despite continuing uncertainty, prospects for private consumption are improving (+6). In contrast, banks and insurances and the information technology industry are facing some headwinds. The forward looking ZEW expectations index stabilized at 58.3 (from 59.6), but that’s still the second best level since July 2021.
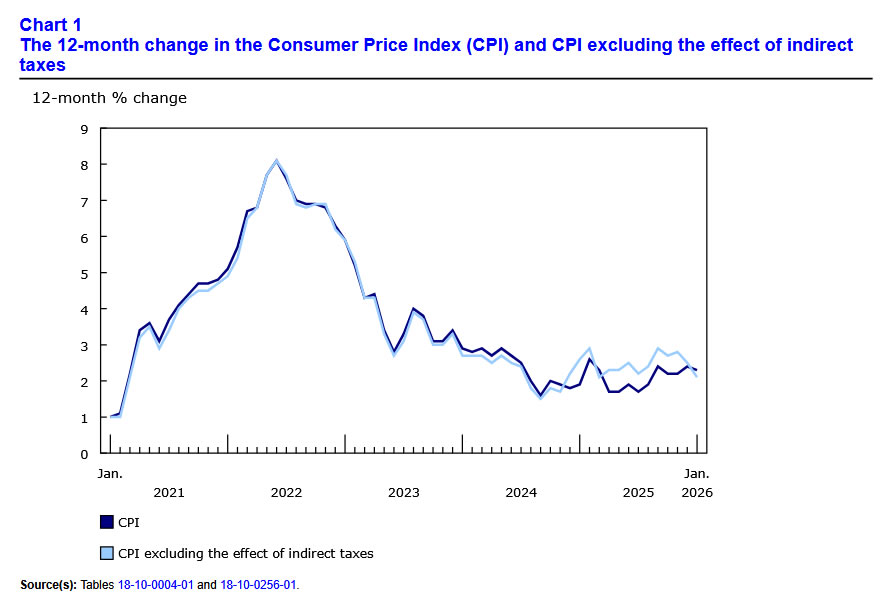
The overall Canadian price level was unchanged in January (0% M/M) while consensus expected a modest increase (+0.1%). Details were a mixed bag with declining transportation costs being a significant drag in January. On an annual basis, inflation slowed from 2.4% to 2.3%. Gasoline prices had the biggest downward impact, mainly because of a base effect (+0.5% M/M vs +4% M/M last year). The temporary tax break on certain items from mid December 2024 to mid-February 2025 continued to put upward pressure. Underlying core inflation gauges slowed as well though, like for example the Bank of Canada’s preferred trimmed mean: 2.7% Y/Y to 2.4% Y/Y. The latter is the lowest level since April 2021 and is a welcome development as the Bank of Canada holds a steady course with a 2.25% policy rate. Growth in shelter costs continued to decelerate, rising by 1.7% Y/Y in what was the first sub-2% outcome in nearly five years.
Inflation Pressures in Canada See January Chill
Headline CPI inflation cooled a tick in January to 2.3% year-on-year (y/y) one tenth lower than consensus expectations. Even so, inflation was boosted by comparison to lower prices during the federal government's temporary sales tax holiday from mid-December 2024 to mid-February 2025.
Prices at the pump were the biggest factor in cooler January inflation. Gasoline prices were down 16.7% on a year-on-year basis in January.
Not surprisingly, categories where inflation was highest were those impacted by the temporary GST/HST exemption, including restaurant meals (+12.3 y/y), alcohol purchased at stores (+7.9% y/y), games toys and hobbies (+8.7% y/y) and children's clothes (+6.3% y/y).
Inflation at the grocery store eased slightly, but remained at 4.8% y/y. This was driven by lower prices for fresh fruit. Food inflation has been a particular sore spot recently (see report), but is expected to continue cooling in the months ahead.
Shelter inflation continued to cool (1.7% y/y). Slower price growth for rent (+4.3% y/y) and mortgage interest costs (+1.2%y/y) drove the deceleration.
The Bank of Canada has focused on broader "underlying inflation" recently, but the official core inflation metrics (median and trim), both cooled further in January, running at 2.5% y/y on average. Zeroing in on trends over the past three months, trim and median inflation were running well below the Bank of Canada's 2% target.
Key Implications
Even with the base year effect from last year's GST holiday, inflation was looking softer than expected in January. Underlying inflation remains above the 2% target on a year-on-year basis, but trends in recent months are looking decidedly soft. Canadian government bond yields are off slightly on the soft report.
Overall, January's data is consistent with our expectation for inflation to moderate to the Bank's target over the next year (see recent forecast), as past inflation problem areas, like rents, continue to cool.
EUR/USD Mid-Day Outlook
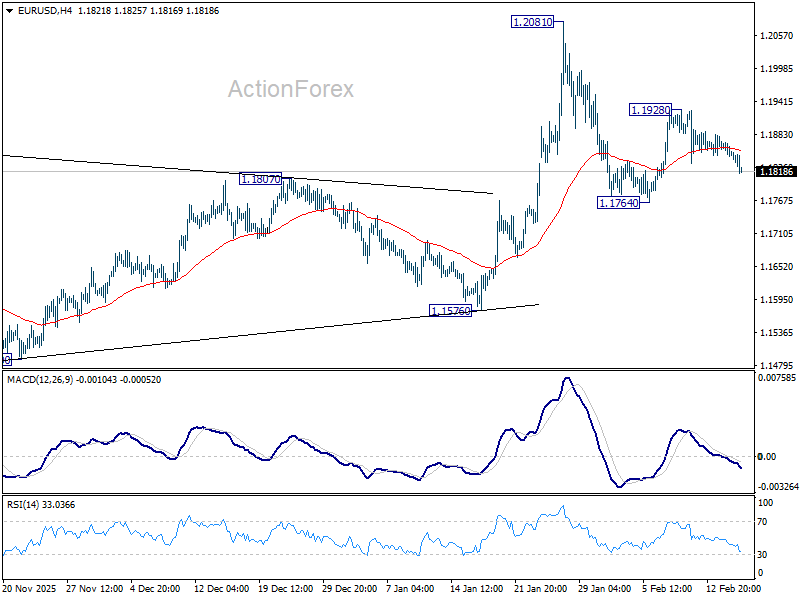
Daily Pivots: (S1) 1.1840; (P) 1.1859; (R1) 1.1872; More….
Intraday bias in EUR/USD stays neutral and outlook is unchanged. On the upside, above 1.1928 will target a retest on 1.2081 high. Decisive break there and sustained trading above 1.2 psychological level will carry larger bullish implications. On the downside, however, sustained trading below 55 D EMA (now at 1.1760) will raise the chance of reversal on rejection by 1.2, and target 1.1576 support for confirmation.
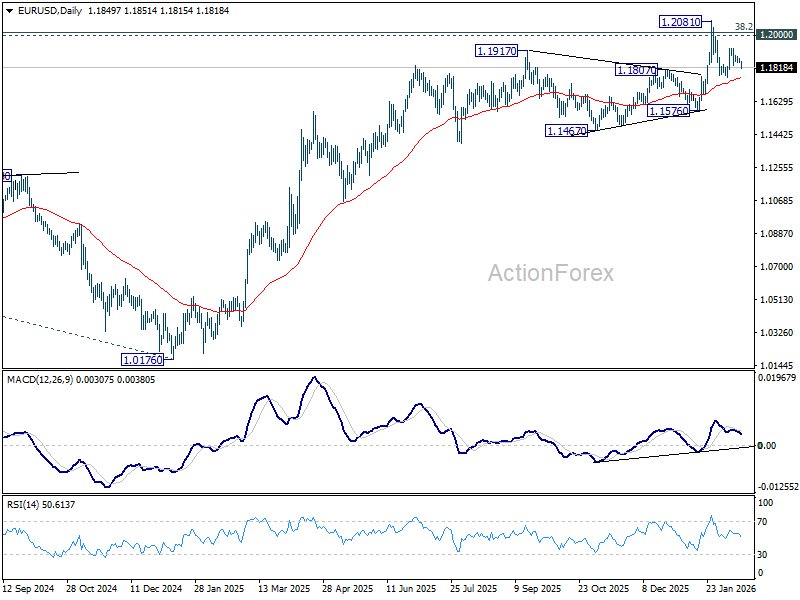
In the bigger picture, as long as 55 W EMA (now at 1.1485) holds, up trend from 0.9534 (2022 low) is still in favor to continue. Decisive break of 1.2 key psychological level will add to the case of long term bullish trend reversal. Next medium term target will be 138.2% projection of 0.9534 to 1.1274 from 1.0176 at 1.2581. However, sustained trading below 55 W EMA will argue that rise from 0.9534 has completed as a three wave corrective bounce, and keep long term outlook bearish.
USD/CHF Mid-Day Outlook
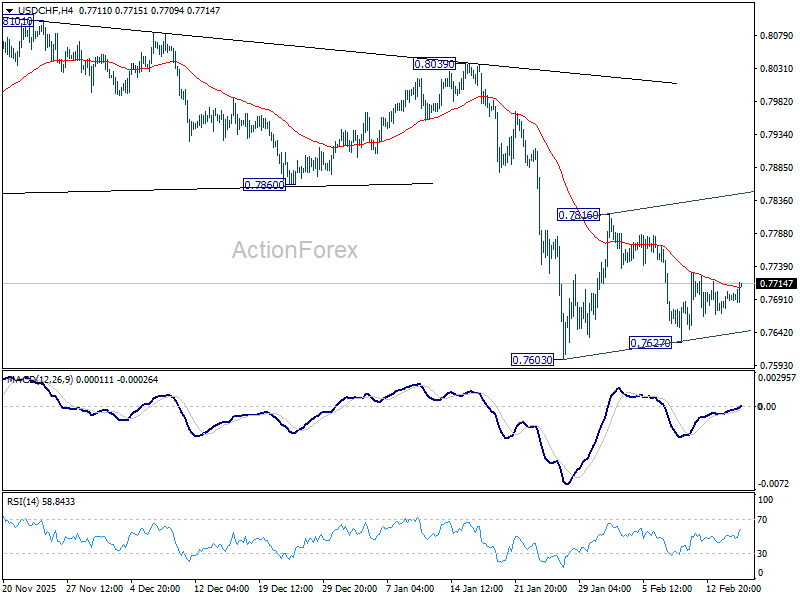
Daily Pivots: (S1) 0.7678; (P) 0.7692; (R1) 0.7709; More….
Sideway trading continues in USD/CHF and intraday bias remains neutral. Stronger rebound cannot be ruled out but upside should be limited by 55 D EMA (now at 0.7855) to complete the pattern. On the downside, break of 0.7603 will resume larger down trend, and target 0.7382 projection level next.
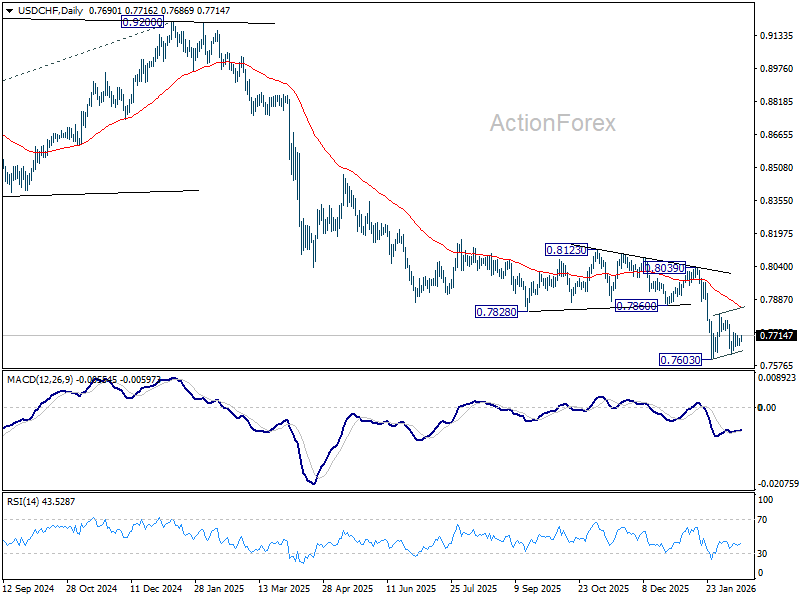
In the bigger picture, down trend from 1.0342 (2017 high) is still in progress. Next target is 100% projection of 1.0146 (2022 high) to 0.8332 from 0.9200 at 0.7382. In any case, outlook will stay bearish as long as 0.8123 resistance holds.
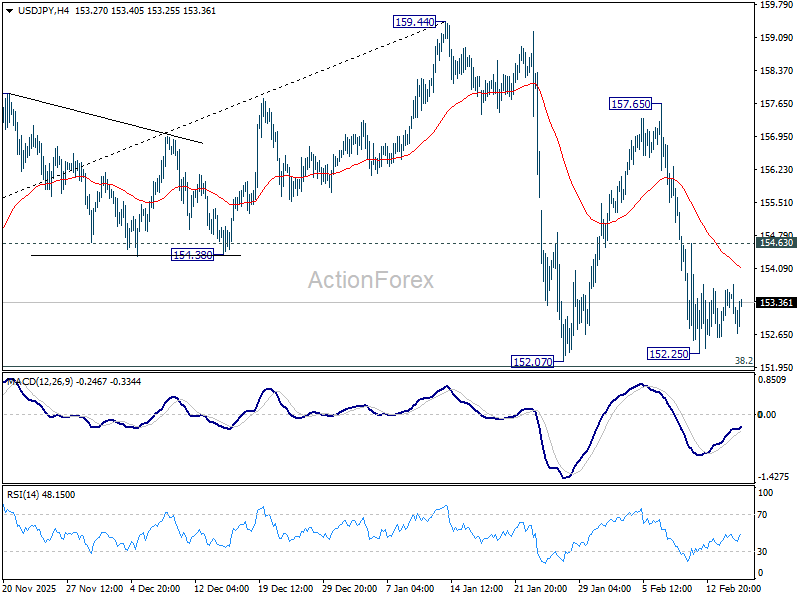
USD/JPY Mid-Day Outlook
Daily Pivots: (S1) 152.89; (P) 153.27; (R1) 153.89; More...
Range trading continues in USD/JPY and intraday bias stays neutral. With 38.2% retracement of 139.87 to 159.44 at 151.96 intact, price actions from 159.44 are seen as a consolidations pattern only. On the upside, firm break of 154.63 minor resistance will bring stronger rebound towards 157.65. However, decisive break of 151.96 will argue that it's reversing the rise from 139.87 already. In this case, deeper fall should then be seen to 61.8% retracement at 147.34, and possibly below.
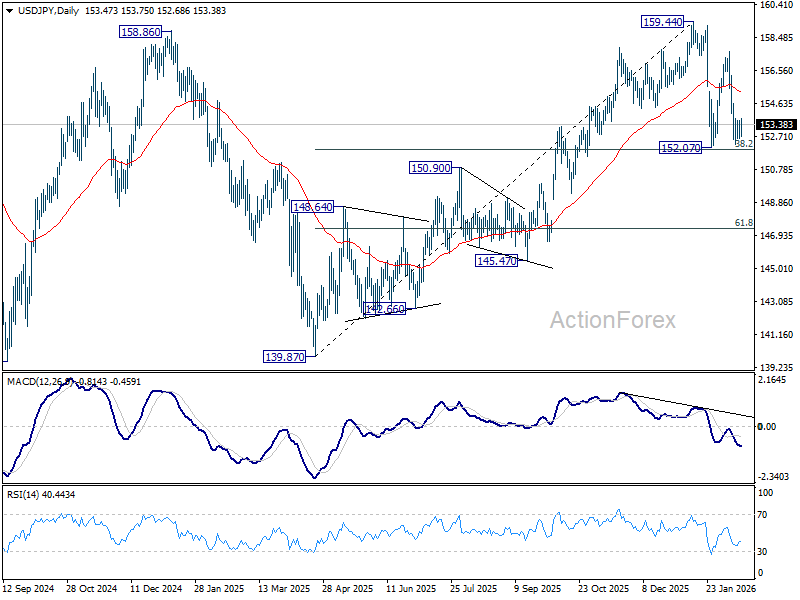
In the bigger picture, outlook is unchanged that corrective pattern from 161.94 (2024 high) should have completed with three waves at 139.87. Larger up trend from 102.58 (2021 low) could be ready to resume through 161.94. This will remain the favored case as long as 55 W EMA (now at 151.77) holds. However, sustained break of 55 W EMA will argue that the pattern from 161.94 is extending with another falling leg.
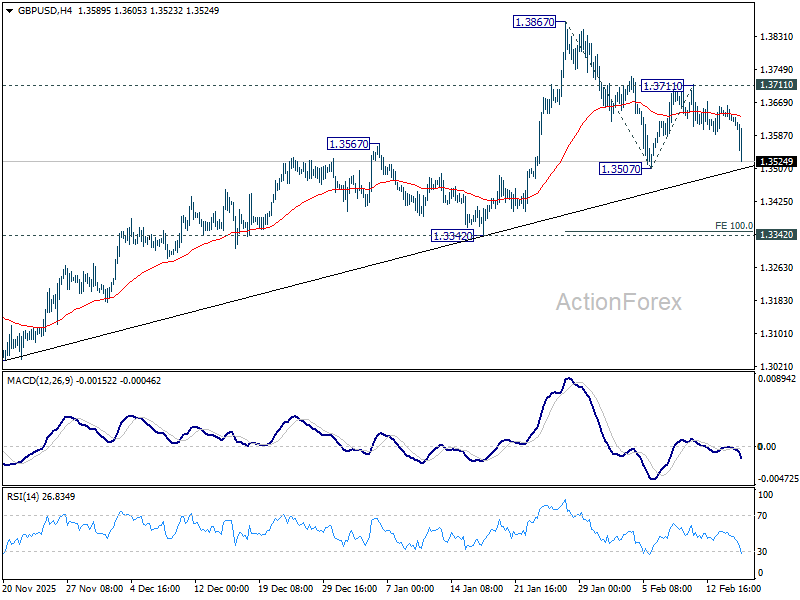
GBP/USD Mid-Day Outlook
Daily Pivots: (S1) 1.3616; (P) 1.3639; (R1) 1.3653; More...
Immediate focus is now on 1.3507 support in GBP/USD with today's downside acceleration. Firm break there and sustained trading below 55 D EMA (now at 1.3518) will raise the chance of larger scale correction. Deeper fall should then be seen to 1.3342 support for confirmation. On the upside, break of 1.3711 will bring retest of 1.3867 high.
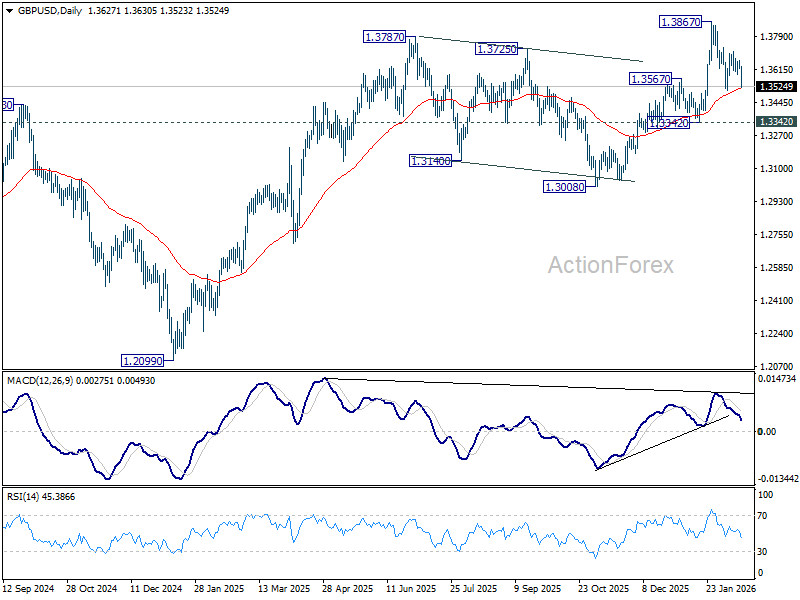
In the bigger picture, rise from 1.0351 (2022 low) still in progress and should target 1.4284 key resistance (2021 high). Decisive break there will add to the case of long term bullish trend reversal. For now, outlook will stay bullish as long as 1.3008 support holds, even in case of deep pullback.
Sterling Slides on Soft Jobs Data as BoE Cut Bets Firm; RBNZ Up Next
Sterling trades broadly lower today after weaker-than-expected UK labor data strengthened expectations for a March rate cut from BoE. Rising unemployment and moderating wage growth have shifted the tone around policy outlook, particularly among more centrist MPC members who may now lean more dovish.
Traders are now assigning more than 75% probability to a March cut, while two rate cuts are fully priced by November. The repricing marks a clear pivot from earlier caution. Still, Sterling selling remains relatively restrained. Investors appear reluctant to extend bearish positions ahead of tomorrow’s CPI release, which could either validate or challenge the dovish shift. A softer inflation print would cement expectations for March action, while sticky services inflation could temper aggressive bets.
Beyond UK data, focus quickly shifts to Asia, where RBNZ delivers its rate decision. A hold at 2.25% is widely expected tomorrow, with consensus that policy is in prolonged pause phase following earlier easing. However, debate centers on timing of next move. More aggressive forecasters anticipate two hikes beginning in Q3 this year, while conservative views push normalization into early 2027. The divergence reflects uncertainty around durability of domestic recovery.
A key element will be how RBNZ addresses Q4 CPI at 3.1%, which surprised to upside. Markets will also scrutinize updated projections for signals that inflation risks are tilting higher or that slack remains sufficient to justify patience. A clear hawkish tilt in language or forecasts could lift Kiwi. Conversely, a cautious tone emphasizing spare capacity may dampen tightening expectations.
So far today, Yen leads gains, followed by Dollar and Kiwi. Sterling is weakest, trailed by Aussie and Euro, while Swiss Franc and Loonie sit in middle.
In Europe, at the time of writing, FTSE is up 0.33%. DAX is up 0.01%. CAC is down -0.04%. UK 10-year yield is down -0.042 at 4.36. Germany 10-year yield is down -0.027 at 2.731. Earlier in Asia, Nikkei fell -0.42%. Japan 10-year JGB yield fell -0.088 to 2.126. Hong Kong, China, and Singapore were on Lunar New Year holiday.
Canada CPI slows to 2.3% in January as gasoline drives deceleration
Canada’s headline CPI eased from 2.4% yoy to 2.3% yoy in January, slightly below expectations of unchanged inflation. The moderation was largely driven by gasoline prices, which fell -16.7% yoy following a -13.8% decline in December. The sharper drop at the pump was the main contributor to the slowdown in headline inflation.
However, underlying price pressures remain more resilient. Excluding gasoline, CPI rose 3.0% yoy, unchanged from December. Excluding food and energy, inflation edged down modestly to 2.4% yoy from 2.5%.
Core measures were mixed but generally softer. CPI Median slipped to 2.5% yoy from 2.6%, while CPI Trim declined more sharply to 2.4% yoy from 2.7%. CPI Common eased to 2.7% yoy from 2.8%.
Germany ZEW falls to 58.3 as recovery remains fragile
Germany’s ZEW Economic Sentiment index edged down from 59.6 to 58.3 in February, missing expectations of 65.2 but still pointing to cautious optimism. Current Situation index improved from -72.7 to -65.9, roughly in line with forecasts. At the Eurozone level, ZEW Economic Sentiment index fell from 40.8 to 39.4, undershooting expectations of 45.2. However, the Current Situation measure improved by 4.5 points to -13.6.
ZEW President Achim Wambach described the recovery as “fragile,” noting that structural challenges continue to weigh on industry and private investment. He emphasized that upcoming reforms to Germany’s social insurance system should be used to strengthen the country’s competitiveness as a business location.
Sector breakdown showed moderate to strong improvement in export-oriented industries, including chemicals and pharmaceuticals, steel and metals, and mechanical engineering, likely reflecting stronger incoming orders late last year. Private consumption prospects also improved, while banks, insurers, and IT sectors reported weaker expectations.
UK unemployment hits five-year high at 5.2%, wage growth slows
UK labor market data pointed to further cooling at the start of the year. Payrolled employment fell by -11k in January and is down -134k over the past 12 months, a -0.4% yoy decline.
Meanwhile, the January claimant count rose by 28.6k, above expectations of 22.8k, signaling rising pressures in the job market. Early estimates for January showed median monthly pay growth ticking up to 4.6% yoy from 4.4%.
In the three months to December, the unemployment rate increased from 5.1% to 5.2% — the highest level since 2020. Wage growth showed signs of moderation. Average earnings including bonus slowed to 4.2% yoy from 4.6%, undershooting expectations of 4.6%. Earnings excluding bonus eased to 4.2% yoy from 4.4%, in line with forecasts.
RBA minutes sees risks tilting toward tighter policy
Minutes of RBA’s February 3 meeting revealed that while the case for holding rates was considered, members ultimately saw a stronger argument for raising the cash rate by 25 bps to 3.85%. The decision reflected growing concern that inflation pressures may prove more persistent than previously anticipated.
The Board judged that part of the recent rise in inflation likely reflects sustained "capacity pressure", and that financial conditions were "currently not restrictive enough " to return inflation to target within a reasonable timeframe. Data received since the previous meeting strengthened the view that, "without a policy response, inflation could remain persistently above target for too long."
Members also acknowledged that risks to both price stability and full employment objectives had "shifted materially". Staff forecasts show inflation staying above the midpoint of the target range for at least two more years, based on a market-implied path that assumes two additional hikes in 2026. If realized, that would extend the already prolonged period during which underlying inflation has exceeded target. At the same time, downside risks to the labor market were seen as having diminished.
Still, policymakers stressed "prevailing uncertainties meant it was not possible to have a high degree of confidence in any particular path for the cash rate." The minutes suggest the tightening bias remains intact, but future moves will hinge squarely on incoming data, particularly inflation and labor market developments.
GBP/USD Mid-Day Outlook
Daily Pivots: (S1) 1.3616; (P) 1.3639; (R1) 1.3653; More...
Immediate focus is now on 1.3507 support in GBP/USD with today's downside acceleration. Firm break there and sustained trading below 55 D EMA (now at 1.3518) will raise the chance of larger scale correction. Deeper fall should then be seen to 1.3342 support for confirmation. On the upside, break of 1.3711 will bring retest of 1.3867 high.
In the bigger picture, rise from 1.0351 (2022 low) still in progress and should target 1.4284 key resistance (2021 high). Decisive break there will add to the case of long term bullish trend reversal. For now, outlook will stay bullish as long as 1.3008 support holds, even in case of deep pullback.
Canada CPI slows to 2.3% in January as gasoline drives deceleration
Canada’s headline CPI eased from 2.4% yoy to 2.3% yoy in January, slightly below expectations of unchanged inflation. The moderation was largely driven by gasoline prices, which fell -16.7% yoy following a -13.8% decline in December. The sharper drop at the pump was the main contributor to the slowdown in headline inflation.
However, underlying price pressures remain more resilient. Excluding gasoline, CPI rose 3.0% yoy, unchanged from December. Excluding food and energy, inflation edged down modestly to 2.4% yoy from 2.5%.
Core measures were mixed but generally softer. CPI Median slipped to 2.5% yoy from 2.6%, while CPI Trim declined more sharply to 2.4% yoy from 2.7%. CPI Common eased to 2.7% yoy from 2.8%.
Dollar Not in a Rush
- EURUSD remains prone to consolidation.
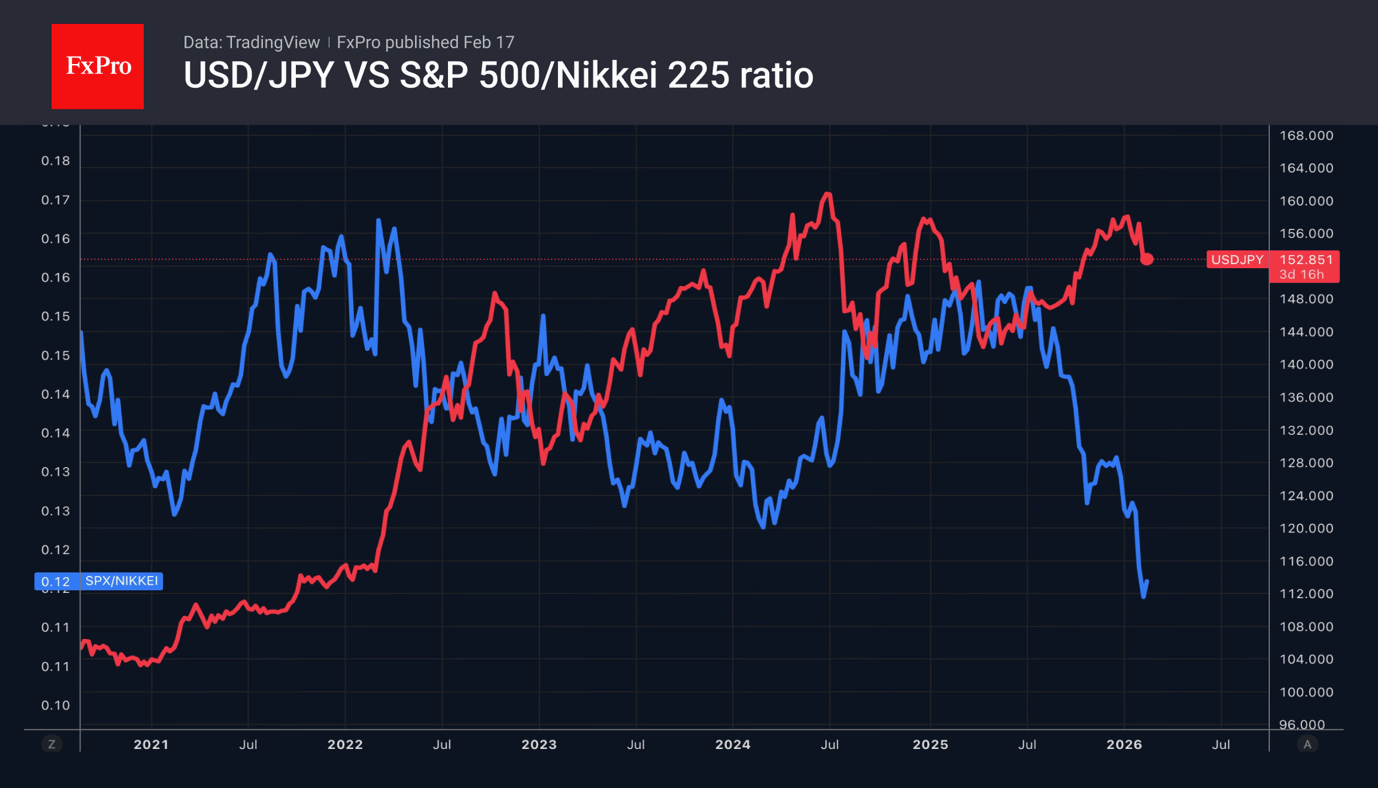
- The yen is strengthening thanks to capital flows.
The US markets, closed for Presidents’ Day, brought calm to the Forex market. Traders are not forcing events, awaiting the publication of the January FOMC meeting minutes. This has resulted in EURUSD moving into a narrow trading range. The pair showed no interest in the news that the ECB is ready to offer liquidity to other central banks to prevent tensions in the money markets. This involves an increase in repo operations from the third quarter.
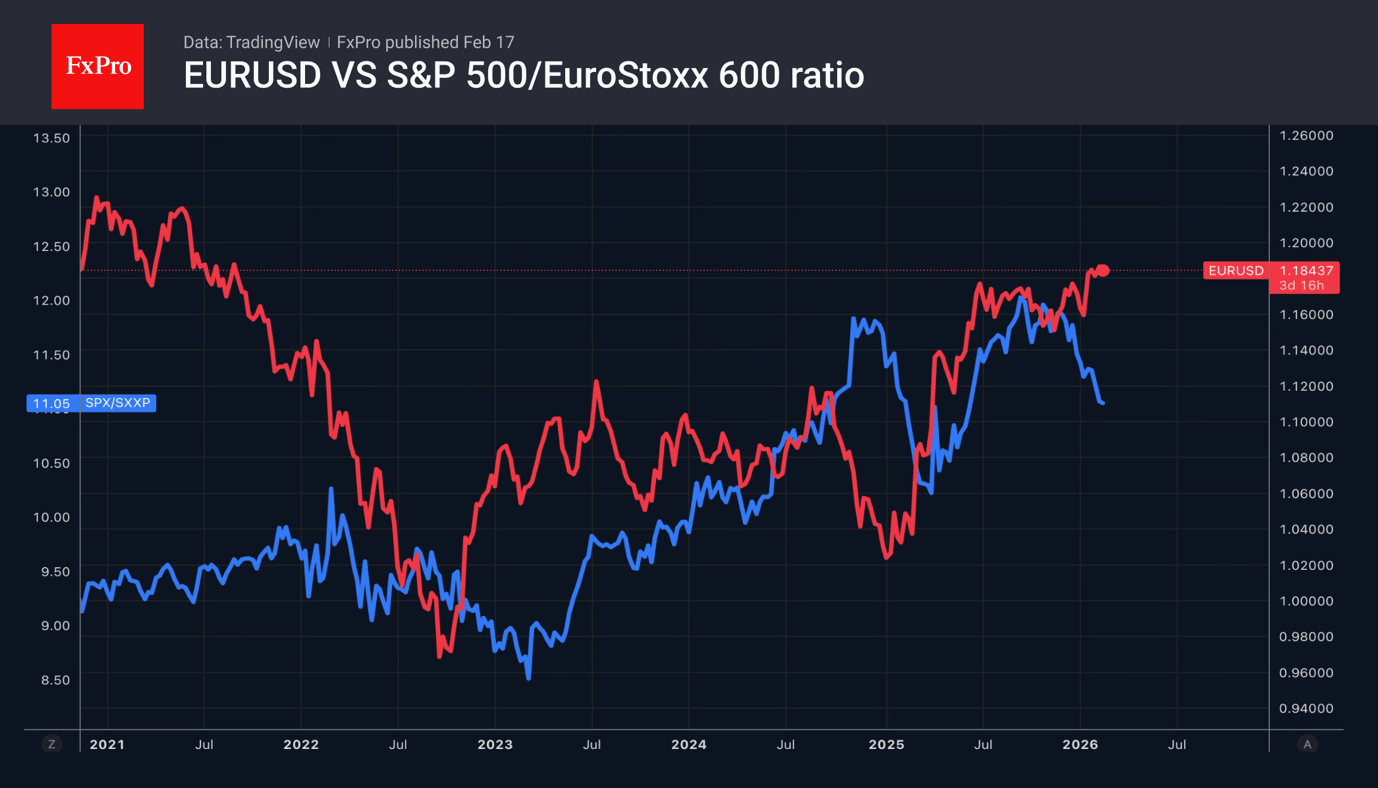
ING believes that the euro’s growing global role is positive for EURUSD. The exchange rate is closely linked to capital flows, and their movement from the US to Europe is good news for the regional currency. Christine Lagarde shares this opinion. According to the Frenchwoman, the general mood is currently in favour of the euro, as money is flowing into the region. The head of the ECB prefers incentives to taxes. Therefore, cheap liquidity will accelerate rotation.
However, in the short term, the US dollar has a counterplay. The longer the Fed pauses in the easing cycle, the wider the rate differential will be. The high attractiveness of US assets will prevent investors from rushing to transfer capital to Europe.
Japan is also scoring points with international investors. According to Kazuo Ueda (BoJ Governor), Sanae Takaichi (Prime Minister) did not make any specific requests that would restrict the activities of the central bank. They discussed economic and financial conditions. If the central bank continues to make decisions independently, political stability will play into the hands of the bears on USDJPY. Investors are trying to understand whether the Prime Minister is pressuring the BoJ to stop raising rates, which also increases debt servicing costs.
Gold is trying to find a balance point, treading water around $5,000 per ounce. According to Jefferies, two main macro factors are supporting the precious metal: the depreciation of the US dollar and high inflation. This allows the company to raise its forecast for the end of the year from $4,200 to $5,000. It notes the high risks of a short-term peak in Gold amid growing fears among traders concerned about the collapse in prices at the end of January.
The situation on the silver market is even worse. Backwardation is intensifying, and futures contracts with distant delivery dates are falling in price. This is usually characteristic of perishable goods such as agricultural products.