Sample Category Title
AUD/USD steady after RBA minutes, momentum tempered but uptrend intact
AUD/USD is steady after RBA minutes reinforced tightening bias, though policymakers emphasized low confidence in outlining the next move. That cautious messaging capped immediate upside follow-through. Still, markets continue to price a solid chance of a May rate hike, despite growing talk that the currency’s recent surge could lessen the need for further tightening. As long as those expectations remain intact, any pullback in AUD/USD should be contained, leaving the broader uptrend undisturbed.
In recent days, arguments have surfaced that Aussie’s recent surge may act as a “shadow hike,” reducing need for additional tightening. Since early January, AUD has rallied roughly 5.8% against Dollar and 4.8% against Yuan. A stronger exchange rate lowers import prices, theoretically easing inflation pressure without further rate increases.
Given that China accounts for roughly 25–30% of Australia’s total trade and US around 11% of goods imports, the appreciation looks meaningful. Standard models suggest that a sustained 10% appreciation trims headline inflation by about 0.5–1.0% over a year.
However, relying on currency strength alone to anchor inflation is a risky strategy. The recent 5% move is helpful but limited, and its impact is concentrated in goods prices. Yet goods inflation is no longer the primary problem. December CPI showed headline at 3.8%, driven by domestic pressures. Rent inflation persists amid structural housing constraints. Services costs remain elevated due to wage dynamics. In short, exchange-rate strength does little to address core domestic drivers.
The logic for further tightening rests on three pillars a stronger AUD cannot directly weaken. First, labor market remains tight, and wage growth continues to support services inflation. Second, productivity gains remain modest. Without stronger output per worker, higher wages feed directly into higher prices. Third, fiscal policy still provides tailwinds, offsetting some monetary restraint.
Market pricing continues to assign high probability to another 25bps hike in May, pending Q1 CPI confirmation. Unless data show abrupt cooling in labor market or services pricing, the “shadow hike” narrative is unlikely to displace tightening bias.
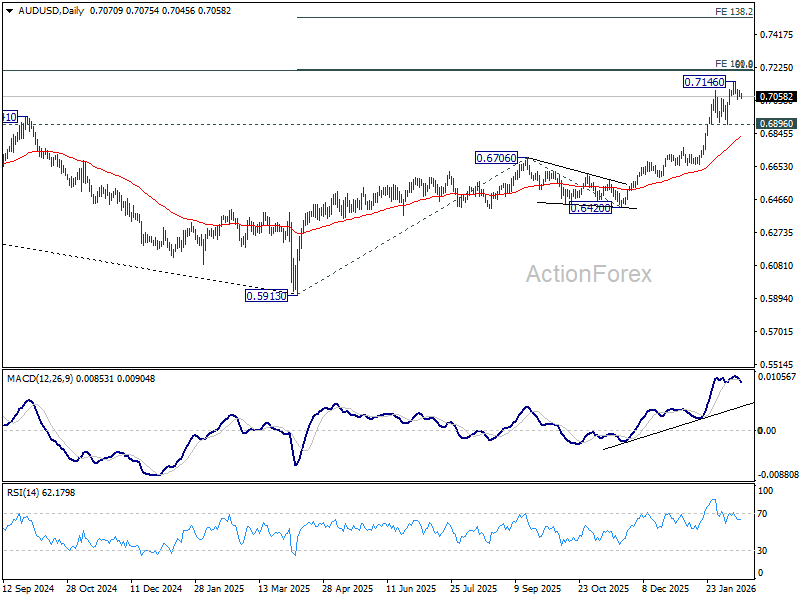
Technically, some more consolidations would likely be seen in AUD/USD below 0.7146 short term top. But downside should be contained above 0.6896 support to bring up trend resumption. The real test lies in 0.72 zone, with 100% projection of 0.5913 to 0.6706 from 0.6420 at 0.7213. Decisive break there will pave the way to 138.2% projection at 0.7516. But that break through 0.72 might need either a shift in expectations for more than one RBA hike this year, or more Fed rate cuts.
Gold Approaches Key Zone Ahead Of Breakout Attempt
Key Highlights
- Gold started a fresh increase above $4,850 and $5,000.
- A major contracting triangle is forming with resistance at $5,140 on the 4-hour chart.
- WTI Crude Oil faces resistance near $63.85 and $64.50.
- USD/JPY retested the 152.25 support zone and started a consolidation phase.
Gold Price Technical Analysis
Gold remained well bid above $4,650 against the US Dollar. The price formed a base and was able to settle above the $4,850 resistance zone.
The 4-hour chart of XAU/USD indicates that the price climbed above the 50% Fib retracement level of the downward move from the $5,598 swing high to the $4,401 low. The price even surpassed the 100 Simple Moving Average (red, 4 hours) and remained well above the 200 Simple Moving Average (green, 4 hours).
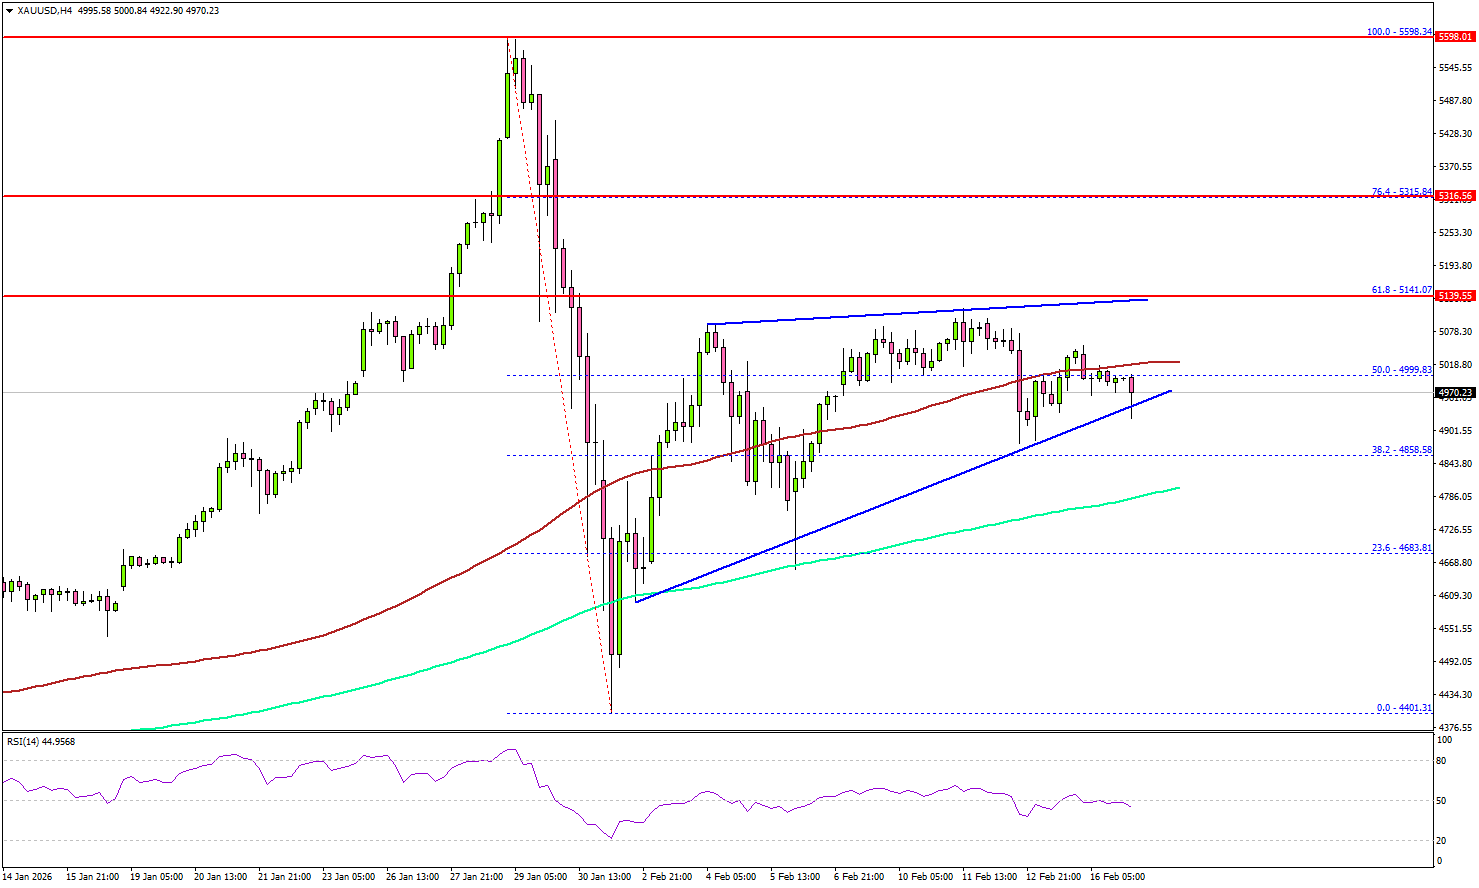
However, the bears are now active near the $5,120 and $5,140 levels. There is also a major contracting triangle forming with resistance at $5,140. The next major resistance sits near $5,250.
A clear move above $5,250 could open the doors for more upside. In the stated case, the bulls could aim for a move toward $5,315 and the 76.4% Fib retracement level of the downward move from the $5,598 swing high to the $4,401 low. The main target for the bulls could be $5,500.
If there is another decline, Gold might find bids near the $4,960 level. The first major support sits at $4,820, below which the price might slide to $4,680. The main support sits at $4,550. Any more losses might call for a test of $4,440 or even $4,400 in the coming days.
Looking at WTI Crude Oil, the price recovered above $65.00 before the bears took a stand near $65.50.
Economic Releases to Watch Today
- UK Claimant Count Change for Jan 2026 – Forecast 22.8K, versus 17.9K previous.
- UK ILO Unemployment Rate for Dec 2025 (3M) – Forecast 5.1%, versus 5.1% previous.
- NY Empire State Manufacturing Index for Feb 2026 – Forecast 6.0, versus 7.7 previous.
RBA minutes sees risks tilting toward tighter policy
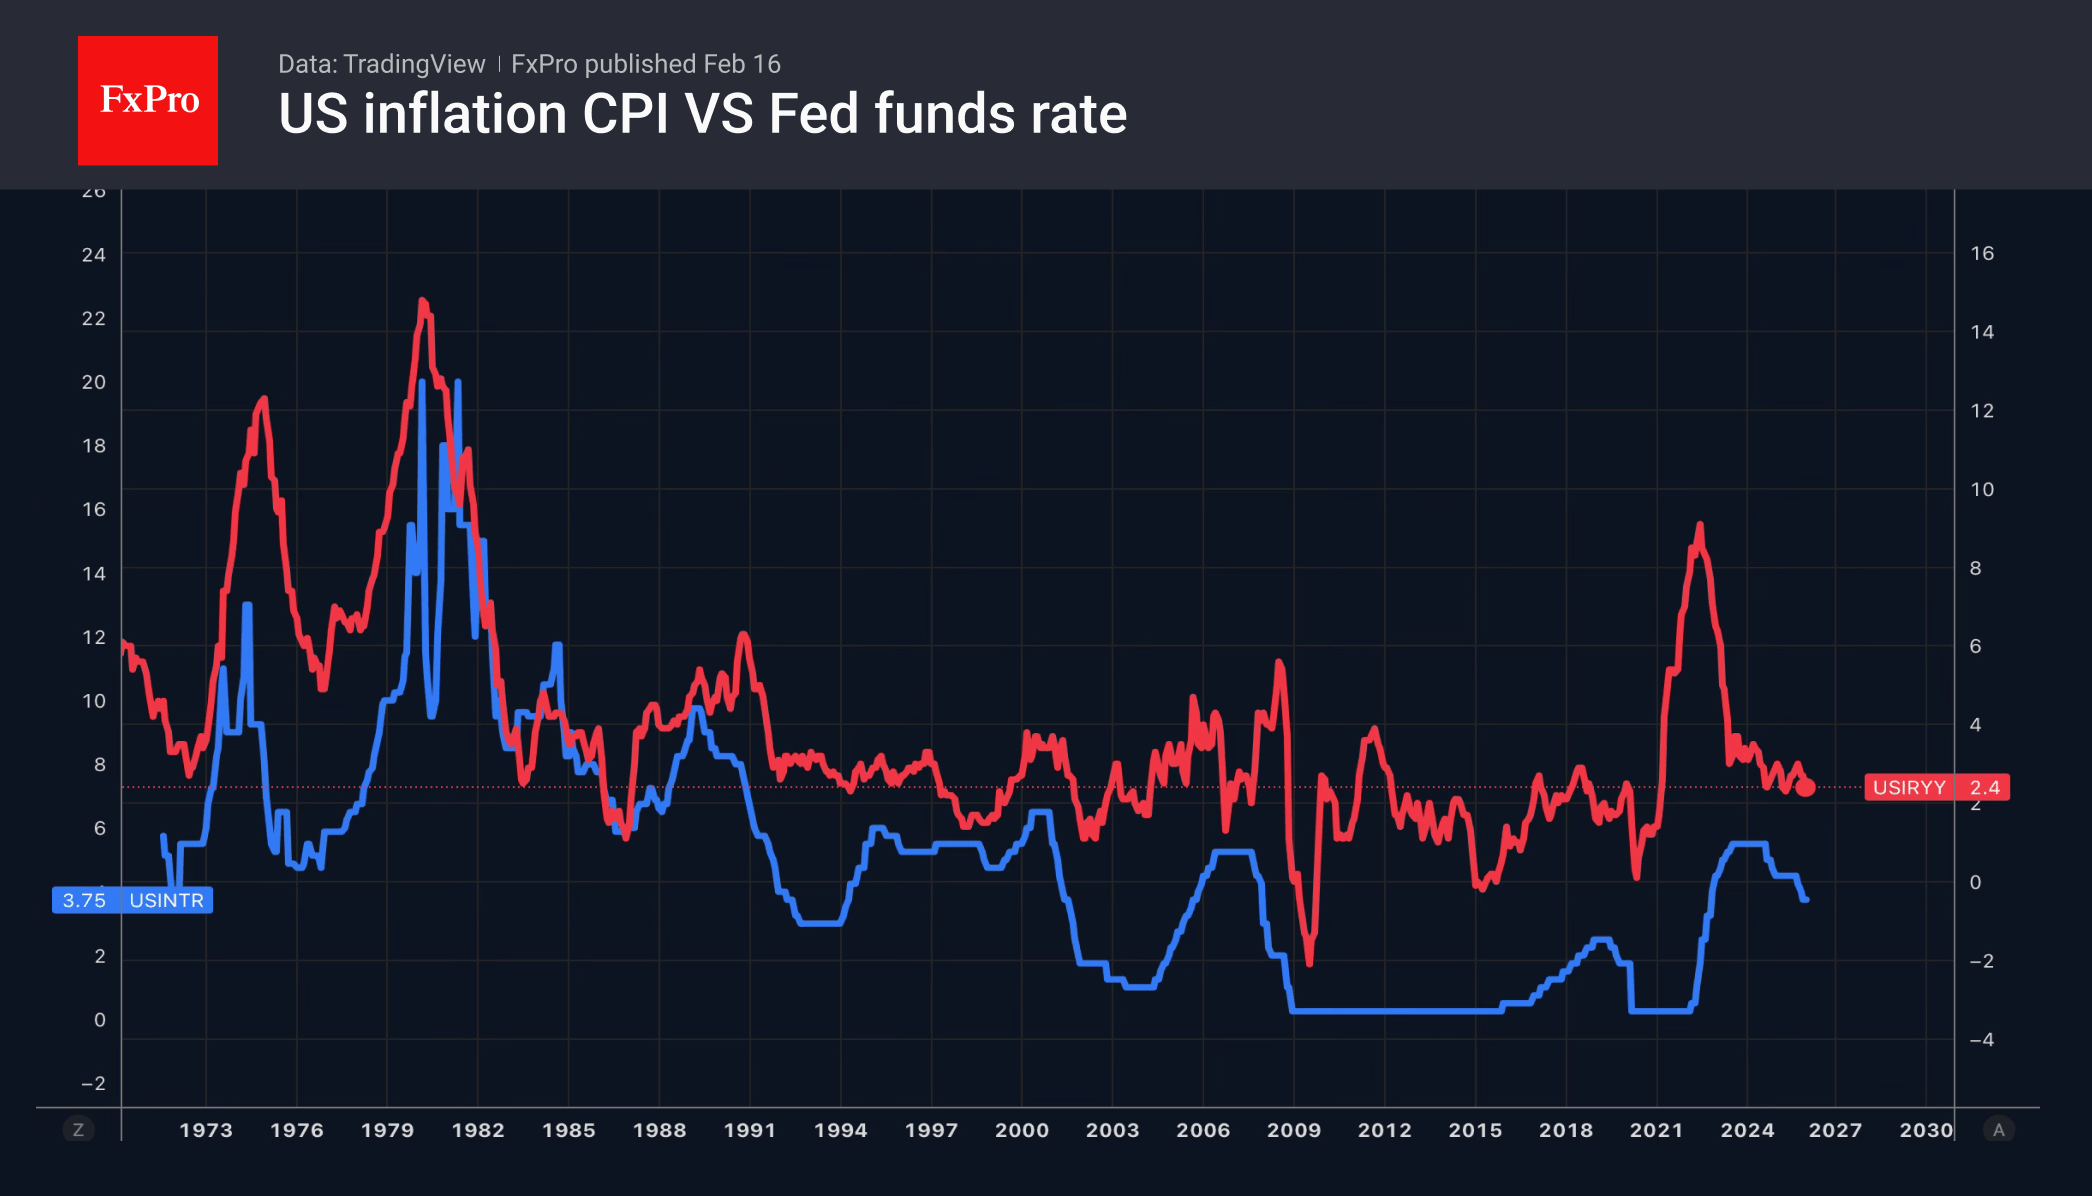
Minutes of RBA’s February 3 meeting revealed that while the case for holding rates was considered, members ultimately saw a stronger argument for raising the cash rate by 25 bps to 3.85%. The decision reflected growing concern that inflation pressures may prove more persistent than previously anticipated.
The Board judged that part of the recent rise in inflation likely reflects sustained "capacity pressure", and that financial conditions were "currently not restrictive enough " to return inflation to target within a reasonable timeframe. Data received since the previous meeting strengthened the view that, "without a policy response, inflation could remain persistently above target for too long."
Members also acknowledged that risks to both price stability and full employment objectives had "shifted materially". Staff forecasts show inflation staying above the midpoint of the target range for at least two more years, based on a market-implied path that assumes two additional hikes in 2026. If realized, that would extend the already prolonged period during which underlying inflation has exceeded target. At the same time, downside risks to the labor market were seen as having diminished.
Still, policymakers stressed "prevailing uncertainties meant it was not possible to have a high degree of confidence in any particular path for the cash rate." The minutes suggest the tightening bias remains intact, but future moves will hinge squarely on incoming data, particularly inflation and labor market developments.
(RBA) Minutes of the Monetary Policy Meeting of the Reserve Bank Board
Hybrid – 2 and 3 February 2026
Members participating
Michele Bullock (Governor and Chair), Andrew Hauser (Deputy Governor and Deputy Chair), Marnie Baker AM, Renée Fry-McKibbin, Ian Harper AO, Carolyn Hewson AO, Iain Ross AO, Alison Watkins AM, Jenny Wilkinson PSM
Others participating
Sarah Hunter (Assistant Governor, Economic), Christopher Kent (Assistant Governor, Financial Markets)
Anthony Dickman (Secretary), David Norman (Deputy Secretary)
Meredith Beechey Osterholm (Head, Monetary Policy Strategy), Sally Cray (Chief Communications Officer), David Jacobs (Head, Domestic Markets Department), Penelope Smith (Head, International Department), Tom Williams (Acting Deputy Head, Economic Analysis Department)
Financial conditions
Members commenced their discussion of financial conditions by considering ongoing uncertainty in the global environment. Members noted that a range of new geopolitical and institutional risks had emerged since the previous meeting, including military action, tariff developments and new threats to the independence of the US Federal Reserve. For the most part, these had prompted only modest and short-lived reactions in financial markets. That said, the US dollar had weakened against a range of currencies and there had been strong gains in precious metals prices over much of January. Some of these effects had unwound following the nomination of a new chair of the Board of Governors of the Federal Reserve System, but the US dollar remained lower and gold and silver prices higher than at the start of the year.
Compensation for risk in financial markets remained very low. Equity prices had risen in most major advanced economies over prior months, and measures of equity risk premia and expected future volatility were still near long-term lows. Corporate bond spreads had been little changed or had declined across advanced economies over that period. Members discussed why markets were demanding little compensation for risk despite the high level of uncertainty. They noted that this outcome could reflect in part the resilience of major economies, strong private sector balance sheets and fiscal and monetary easing in some economies. Market participants might also be finding it challenging to price genuine tail risks, given uncertainty around the probability, timing and scale of possible adverse events. It was also possible that market participants were factoring in an expectation of strong global central bank responses to any sharp downturn. Members nonetheless concluded that, with this starting point, any crystallisation of downside scenarios could cause a significant tightening of financial conditions. However, the scale and timing of any adjustment was difficult to predict.
Australian equity prices had underperformed other markets over preceding months, in part because of a significant rise in expectations for the cash rate and the associated increase in bond yields. That said, demand for securities being issued by Australian firms had remained strong, including from offshore investors.
Members noted that financial market participants’ expectations for central bank policy rates in the United States and the United Kingdom had drifted a little higher over preceding months, though cuts were still expected in 2026. By contrast, official interest rates were expected to rise – or be little changed – in a range of other countries. In New Zealand, markets now expected the policy rate to be increased in 2026, following a significant increase in market pricing in response to stronger economic data. Market participants also expected that the Bank of Japan would continue to increase its policy rate from very low levels, amid more durable inflation and expectations of some additional fiscal stimulus. In Canada and the euro area, where inflation was close to target, market pricing continued to imply only modest future increases in policy interest rates. Members noted that market expectations were for noticeably higher interest rates in Australia than in many peer economies. Some of that difference reflected the higher inflation target in Australia, but also likely a perception that Australia has faced stronger inflationary pressures.
Longer term government bond yields in the major advanced economies had, for the most part, moved broadly in line with policy rate expectations since the previous meeting. Yields had risen in Japan and New Zealand, and were little changed in the euro area and Canada, though they had declined slightly in the United States and the United Kingdom. Longer term bond yields in Australia had moved higher, reflecting changed expectations for the cash rate. Members noted that measures of longer term inflation expectations appeared well anchored and consistent with central banks’ inflation targets. However, measures of inflation expectations at the two-year horizon had increased, most noticeably in Australia.
In China, authorities had recently extended policies to support lending to targeted business sectors and there were signs that earlier measures had begun to lift business financing. By contrast, household demand for credit had weakened further, amid continued declines in property prices and soft labour market conditions. Total social financing had continued to increase relative to nominal GDP, reflecting strong growth in government bond issuance.
Members turned their discussion to considering the restrictiveness of financial conditions in Australia. They noted that the relevant indicators had presented an increasingly mixed picture since mid-2025, and that there was even less evidence than at the December meeting that financial conditions remained restrictive.
Several indicators suggested that monetary policy was no longer restrictive. Housing credit growth had picked up noticeably and now appeared to be growing faster than household incomes, driven by a pick-up in investor credit. Business debt had also continued to grow at its fastest pace since the global financial crisis and continued to outpace growth in GDP. Members observed that low risk premia in capital markets were contributing to favourable financing conditions for large firms, financial institutions and governments. The pick-up in inflation and steadying of conditions in the labour market had also suggested that monetary policy was not restrictive overall.
Members also considered the current level of the cash rate relative to various model-based estimates of the neutral interest rate. They observed that such estimates are inherently highly uncertain, sensitive to the choice of inputs and model structure, and had provided a misleading signal of the stance of monetary policy prior to the pandemic. As a result, they had provided no direct guide to monetary policy. Nonetheless, members noted that the cash rate was below the central estimate of several models but above the central estimate of others, given reductions in the cash rate in the previous year and a gradual rise in some model estimates.
By contrast, there were some signs that policy might be slightly restrictive. Households’ required mortgage payments (as a share of disposable income) were above the historical average and households were continuing to make larger payments into redraw and offset accounts. This behaviour – amid a high rate of household savings compared with the preceding few years – could have been consistent with policy still being somewhat restrictive. However, members also explored whether this additional saving might instead have reflected unexpectedly strong income growth, which households could, in due course, choose to spend.
Market expectations of the cash rate had risen noticeably since around August 2025 and were significantly higher than at the November meeting. These moves had taken place progressively over time, reflecting a range of stronger-than-expected data over the second half of 2025 and policy communications following the November and December meetings. Market pricing had implied a 70 per cent probability of a cash rate increase at the current meeting, with a further increase fully priced by the end of 2026. Most market economists tracked by the staff had also expected an increase in the cash rate in February, and a number had expected a second increase later in the year.
The Australian dollar had appreciated noticeably against a wide range of currencies over preceding months. The trade weighted exchange rate was around 5 per cent higher than at the November meeting. Members noted that this appreciation was broadly consistent with the pick-up in cash rate expectations and yields on Australian bonds relative to those in other countries, together with higher commodity prices; indeed, the exchange rate had still been within the range of model-based estimates of its long-run equilibrium value. Members noted that the implications of the appreciation of the exchange rate for financial conditions and the economic outlook would depend on the causes of the appreciation, which could not be known with certainty. But to the extent to which the appreciation had been in response to expectations of a higher cash rate path, the implied tightening in financial conditions should be thought of as consistent with, rather than additional to, the typical effects of the transmission of monetary policy expectations embodied in the market path.
Economic conditions
Members began their discussion of economic conditions by considering the stronger-than-expected inflation outcomes in the second half of 2025. Headline and underlying inflation in the December quarter had been higher than forecast in November, having also exceeded expectations in the September quarter. Inflation had clearly now exceeded the 2–3 per cent target range.
Members discussed the likely persistence of the rise in inflation. They noted that inflation in the second half of 2025 had been broadly based: the share of items in the basket with prices rising by an annualised rate of more than 2.5 per cent had increased sharply and was high by historical standards. The breadth of inflation was consistent with the staff’s assessment that economy-wide capacity pressures – which looked to have increased in the second half of 2025 – had contributed to some of the recent increase. The staff judged that the larger part of the increase had reflected less-persistent factors, including price volatility in categories such as electricity, travel and groceries, and some sector-specific demand and price pressures that had affected prices of new dwellings and durable goods. Inflation in administered prices (excluding electricity) was only a little above its historical average and had picked up only modestly.
Members discussed the evidence of an increase in economy-wide capacity pressures that was contributing to higher inflation. Survey measures of capacity utilisation had increased in the second half of 2025 and were above their historical average. Model-based estimates had also been revised higher over the second half of 2025 – indeed they now suggested that there was excess demand in the economy. In the labour market, there had been ongoing strength in unit labour costs, the unemployment rate had been lower than expected and measures of underemployment were historically low. The staff’s overall assessment was that the labour market was a little tighter than consistent with full employment. Collectively, these observations pointed to a progressive pick-up in underlying inflationary pressure in the economy over the preceding six months, as had been discussed at the November and December meetings.
Members considered the role that stronger-than-expected aggregate demand had played in adding to existing capacity pressures. Domestic private demand had been significantly stronger than expected in the September quarter, across most categories of expenditure. More recent indicators suggested that consumption growth was robust in the December quarter. While some of the expected strength in consumption in the December quarter was likely to have been due to households bringing forward spending to take advantage of sales promotions, the clear upward trend in year-ended consumption growth suggested that this could not provide the whole explanation. The strength in underlying consumption had also been underpinned by improving fundamental conditions. Real household disposable incomes had been growing strongly and recent upward revisions had implied that households were in better financial health than previously thought. In addition, the easing in monetary policy in 2025 had helped to support household spending, though the direct cash flow effects on household income growth (via lower net interest payments) had been small.
Business investment had also been surprisingly strong in the September quarter – particularly investment in data centres. In addition, firms’ expectations for future capital expenditure had increased. While part of the pick-up in the September quarter was expected to subside in the December quarter, the staff’s outlook for investment had risen. Members discussed the extent to which this increase in investment might support higher productivity growth, thereby expanding supply capacity. They noted that, while there might be some impact, the link between investment and productivity is not immediate or strong. A more substantial and sustained increase in investment would likely be needed before a meaningful effect on productivity could be discerned.
Global economic developments had also supported the domestic economy. Global growth had been unexpectedly resilient in 2025 and the outlook for major trading partner growth had again been revised up in the latest forecasts. Members noted that some of this was because the downside risks related to tariffs and trade policy uncertainty had not materialised, with effective tariff rates lower than initially feared and global trade flows and supply chains adapting faster than anticipated. Growth in China had remained in line with the authorities’ 2025 growth target, as strength in exports had offset ongoing weakness in domestic demand. Another factor was the role of technology-related spending in the global economy. Members noted that exports from east Asian economies had grown rapidly in response to strong investment demand related to AI and broader technology. Reflecting all this, growth in Australia’s major trading partners had picked up through 2025 and commodity prices had risen.
Developments in the labour market also pointed to a stronger Australian economy. Labour market conditions appeared to have stabilised in the second half of 2025, bringing the earlier period of easing to an end. Although part of the decline in the unemployment rate in the month of December was likely to reflect statistical noise, measures of unemployment and underemployment had been fairly steady over the preceding six months and leading indicators of the labour market suggested this would continue in the near term. Employment growth had continued to slow, but this was broadly in line with the slowing in labour supply as population growth eased and labour force participation declined somewhat. Private sector wages growth had slowed gradually.
While much of the apparent tightening in capacity pressures was likely to reflect stronger-than-expected demand, members noted that the staff’s assessment of supply capacity had also declined a little. The staff’s models continued to suggest a risk that there is less supply capacity in the economy than currently assessed.
Outlook
Members considered what these developments implied for the economic outlook. They noted that the latest forecasts produced by the staff were materially stronger than those produced in August and November.
The central forecast for GDP growth had been revised up, reflecting stronger consumption and investment, and was now above assumed growth in supply capacity throughout most of 2026. That implied a further tightening in capacity pressures in the near term. Under the standard technical assumption that the cash rate follows the (rising) market path, GDP growth was forecast to slow from late 2026 as the implied tightening in monetary policy contributed to bringing aggregate supply and demand back into balance. Members noted that the market path used to condition the latest forecasts implied an increase in the cash rate of around 60 basis points by the end of the forecast period; this was significantly different from the assumption in the November forecast, which was for a reduction of around 30 basis points. The forecasts also accounted for the 5 per cent appreciation of the exchange rate since November, which was assumed to dampen import prices and net exports.
The labour market was forecast to remain a little tight in the near term, before slowly easing as GDP growth dipped below its potential. The projections were for the unemployment rate to rise from around 4¼ per cent to around 4½ per cent by the end of the forecast period.
The forecast for inflation had been revised materially higher compared with that in the November Statement on Monetary Policy (which itself was higher than in the August Statement). The central projection for trimmed mean inflation now peaked at 3.7 per cent in mid-2026, with headline inflation at 4.2 per cent around that time (reflecting the ending of electricity rebates). Both underlying and headline inflation were projected to fall to a little below 3 per cent by mid-2027. Beyond that, the forecast was for inflation to fall to a little above the midpoint of the target range by mid-2028, on the assumption that the cash rate follows the market path. Members noted that the staff’s judgement about the extent of persistence in recent demand and inflation outcomes is key to this forecast, with material risks on both sides of the central projections.
Considerations for monetary policy
Turning to considerations for the monetary policy decision, members highlighted that a wide range of data received since the previous meeting had been stronger than expected, as had been the case in December. Broader financial conditions had also eased materially since mid-2025.
Members noted that inflation had picked up in the second half of 2025 and was currently too high. While the increase in underlying inflation was at odds with the central projection six months prior, it represented the crystallisation of what had been a growing risk highlighted by the Board, most recently at the December meeting. Members noted the staff’s judgement that, while the larger part of the increase probably reflected less-persistent factors that would fade over time, some of it was due to underlying inflationary pressure that would be likely to persist with current policy settings. In light of that judgement, the central projection for inflation had been revised materially higher, remaining above target throughout 2026 and only returning close to the midpoint of the target range around mid-2028 (on the assumption that the cash rate follows the market path).
Members highlighted the significant changes since the November Statement of model-based estimates of the extent of spare capacity in the economy, which were now somewhat closer to independent measures from business surveys. The staff assessed that aggregate demand now clearly exceeded aggregate supply and that the labour market remained a little tight. The tightening in overall capacity pressures over prior months appeared to be mostly a result of stronger-than-expected output growth, something that was forecast to persist in the coming few quarters. Labour market conditions had also proven a little stronger than expected, even after discounting the latest monthly outcome to some extent. And global economic growth had been much more resilient than expected some months earlier, especially in east Asia and the United States.
Members observed that developments over preceding months had added to their concerns that financial conditions may no longer be restrictive, even with the rise in market expectations for the cash rate and the consequent appreciation of the Australian dollar.
In light of these observations, members considered the arguments for leaving the cash rate target unchanged at this meeting. Doing so would allow the Board to accumulate even more evidence – an approach that might be appropriate if members judged the increase in inflation to be overwhelmingly temporary and likely to dissipate quickly. That case might be strengthened if members judged capacity pressures to be materially weaker than the staff assessed, the momentum in growth observed over the second half of 2025 as being likely to wane soon, or the pace of productivity growth – and hence supply capacity – as likely to pick up sharply.
Having considered these arguments, members agreed that there was a stronger case to increase the cash rate target by 25 basis points at this meeting. This case rested on their judgements that some part of the rise in inflationary pressures would persist (reflecting greater capacity pressure), that the risks around both the Board’s objectives (price stability and full employment) had shifted, and that financial conditions were currently not restrictive enough to bring inflation back to target within a reasonable period.
Regarding inflation, members judged that, while a sizeable portion of the recent increase was likely to wane over time, a reasonable portion reflected underlying inflationary pressures that would be likely to persist without a policy response. They noted that the increase in inflation had been broadly based across components of the CPI. Members agreed that capacity pressure in the economy was also greater than they had previously envisaged, reflecting both stronger-than-expected aggregate demand over the second half of 2025 and more longstanding weakness in the supply capacity of the economy. Members agreed that the data received since the previous meeting had strengthened their concern that, without a policy response, inflation could remain persistently above target for too long.
Members also judged that the risks surrounding the Board’s two objectives had shifted materially since the previous meeting, in ways that warranted tighter monetary policy. Regarding risks to meeting the Board’s inflation objective, members emphasised that the staff forecast is for inflation to stay above the midpoint of the target range for at least another two years. This forecast was constructed on the technical assumption that the cash rate follows the market path, which envisaged two increases in 2026 and a little more thereafter. Members observed that if this inflation outlook proved true, it would extend the already long period during which underlying inflation had mostly been above the target range.
In relation to risks to the Board’s full employment objective, members agreed that the downside risks to which they had been alert for some time appeared to have abated. Members noted that the persistent resilience of the labour market reduced their concern about the likelihood of a sharp deterioration in the near term. Wages growth had also slowed only gradually, and unit labour costs growth remained high, supporting the view that the labour market remained a little tight. And members observed that the outlook for output growth had strengthened over preceding months, which would support employment in the period ahead. This more positive outlook for near-term growth was underpinned by a strengthening in real household disposable income growth and a lessening of downside risks to the global economy, at least in the near term, providing more confidence that the pick-up in growth would be durable.
On financial conditions, members agreed that there had been a material easing since mid-2025. As a result, they judged that they could no longer be confident that conditions were restrictive. Members observed that banks were lending freely, and credit was growing strongly, such that credit to households and businesses had either stopped declining or was rising, relative to relevant metrics of income. The appreciation of the exchange rate since the previous meeting had offset some part of the easing in conditions in other markets. However, members noted that this was already incorporated in the staff’s forecasts and observed that the appreciation had been in response to expectations for tighter monetary policy, not independent of it.
Collectively, these observations led members to conclude that excess demand was unlikely to be corrected if the cash rate remained at 3.60 per cent.
In considering what these observations implied for upcoming decisions, members agreed that the prevailing uncertainties meant it was not possible to have a high degree of confidence in any particular path for the cash rate. They pointed to risks on both sides of the central projection for inflation. If demand growth proved weaker, supply capacity stronger, the pick-up in inflation largely a function of sector-specific shocks or the stance of policy more restrictive than believed, then inflation might abate more rapidly than projected. However, if demand growth continued to pick up, supply was more constrained than thought, longer term inflation expectations began to rise or policy was not restrictive, then inflation might prove more persistent than in the central case. Future policy decisions would need to respond to these evolving risks. Members noted that it was important to continue exploring what the incoming data reveal about their judgements in relation to these matters. Members agreed that their current strategy of seeking to bring inflation back to target within a reasonable timeframe while preserving as many of the gains in employment as possible is still appropriate. They judged the decision to raise the cash rate at this meeting to be consistent with implementing that strategy in an economy where the outlook and risks had materially shifted.
In finalising its statement, the Board agreed to continue to be attentive to the data and the evolving assessment of the outlook when making its decisions. The Board will remain focused on its mandate to deliver price stability and full employment and will do what it considers necessary to achieve that outcome.
The decision
The Board decided unanimously to raise the cash rate target by 25 basis points to 3.85 per cent.
WTI Holds Above $63 Amid Second Round of US-Iran Talks – US Oil Outlook
- Oil holds a high consolidation range, now remaining above $63
- WTI keeps an elevated risk-premium despite progress in US-Iran talks
- Exploring an in-depth Technical Analysis of the commodity
US markets are closed today in observance of Presidents Day, keeping volumes and volatility lighter than usual.
WTI crude, however, remains firmly on traders’ radar, up 1.40% and strongly holding above $63 at the weekly open.
A second round of US-Iran talks is underway in Geneva, with the UN nuclear watchdog meeting overnight with Iran’s top diplomat in search of a potential framework.
US conditions remain rigid, particularly as Iran’s current Islamic government faces internal pressure following recent unrest, with reports suggesting more than 30,000 protesters have been killed — and the true toll potentially higher.
Washington is pushing for a comprehensive deal, as reiterated by Israeli Prime Minister Netanyahu following his White House visit, demanding that Iran surrender its enriched uranium stockpile and dismantle its ballistic missile program.
Those headlines briefly pressured oil lower last week, but skepticism persists.
US Secretary Marco Rubio added that “it’s been very difficult for anyone to do real deals with Iran,” underscoring the fragile backdrop of negotiations.
Before tensions escalated, WTI was trading in the $56–$59 range.
Since then, the buildup of military assets in the region and Iran’s history of contentious agreements have kept a geopolitical risk premium embedded in prices.
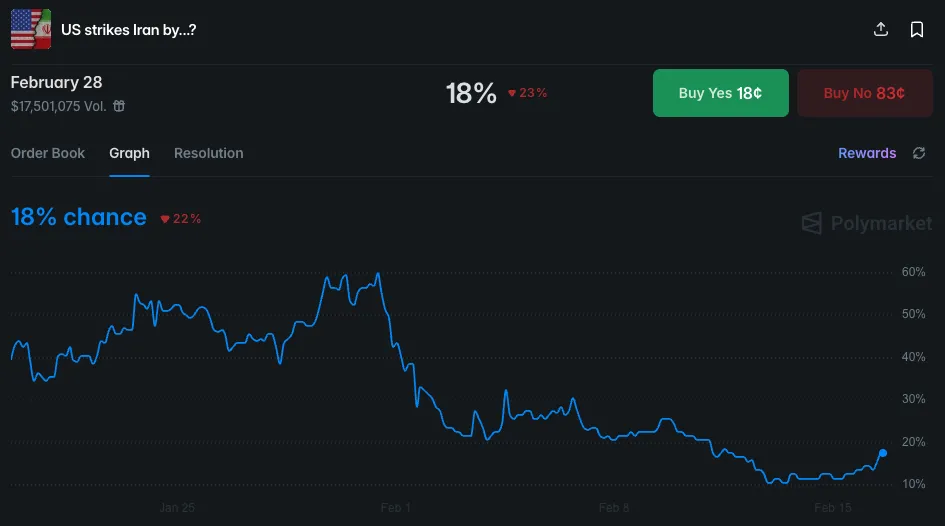
Odds for a US strike in Iran – Source: Polymarket. February 16, 2026
Polymarket-based odds for a strike before February 28 still remain around 30%.
Let's dive into a bottom-up multi-timeframe analysis of WTI (US) Oil to determine where the action currently stands.
US Oil Multi-Timeframe Analysis
WTI Daily Chart
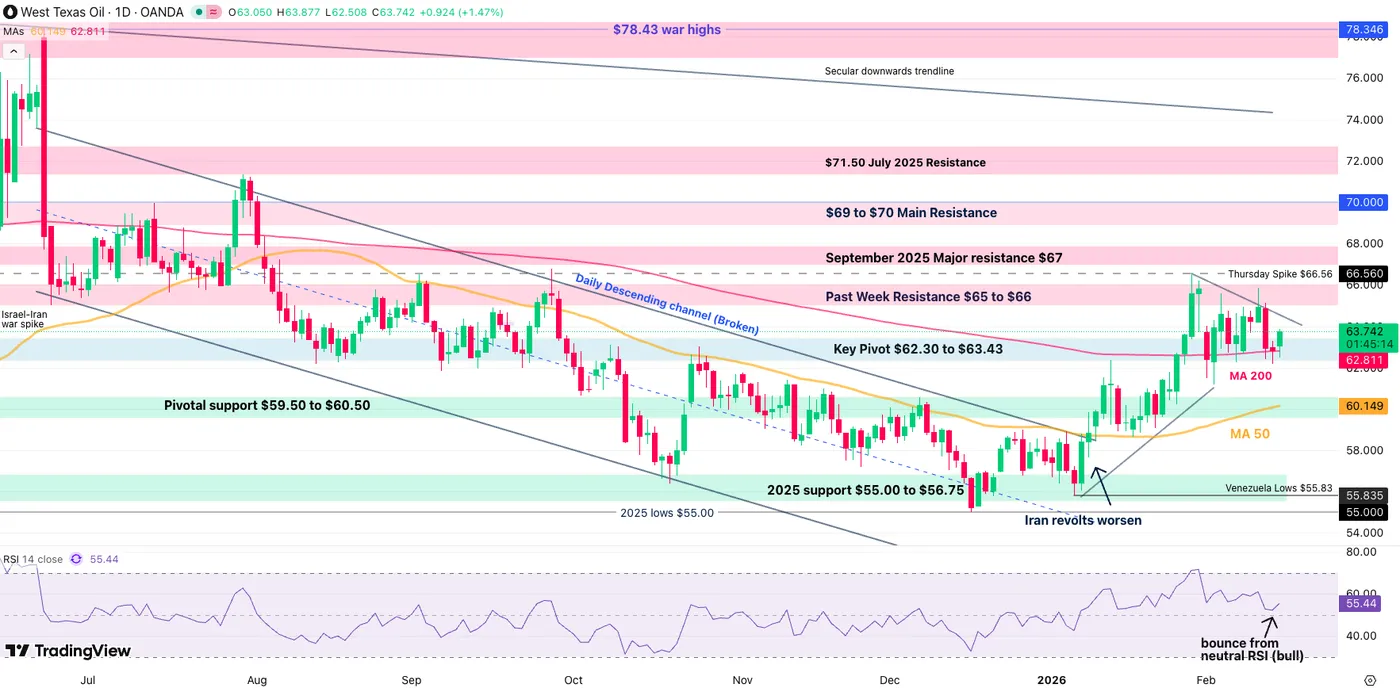
WTI Oil Daily Chart – February 16, 2026. Source: TradingView
Oil is now holding clear above its 200-Day moving average (currently at $62.81), acting as decisive support in the recent action.
Sellers attempted a lower push in the past week of action, but having failed to do so, the MA provides a clear level for technical analysis:
- Remaining above points to further chances of an upside breakout and implies that the Iran risk-premium holds.
- Breaking and closing below however would translate to a deal having been reached.
Angst remains elevated and odds for a deal are still realistically low, particularly considering that more warships are on the way to the Middle East, so this could simply be attempts to save some time – But Trump is the writer of the Art of the Deal, so naturally a deal is never fully out of the picture.
WTI 4H Chart and Technical Levels
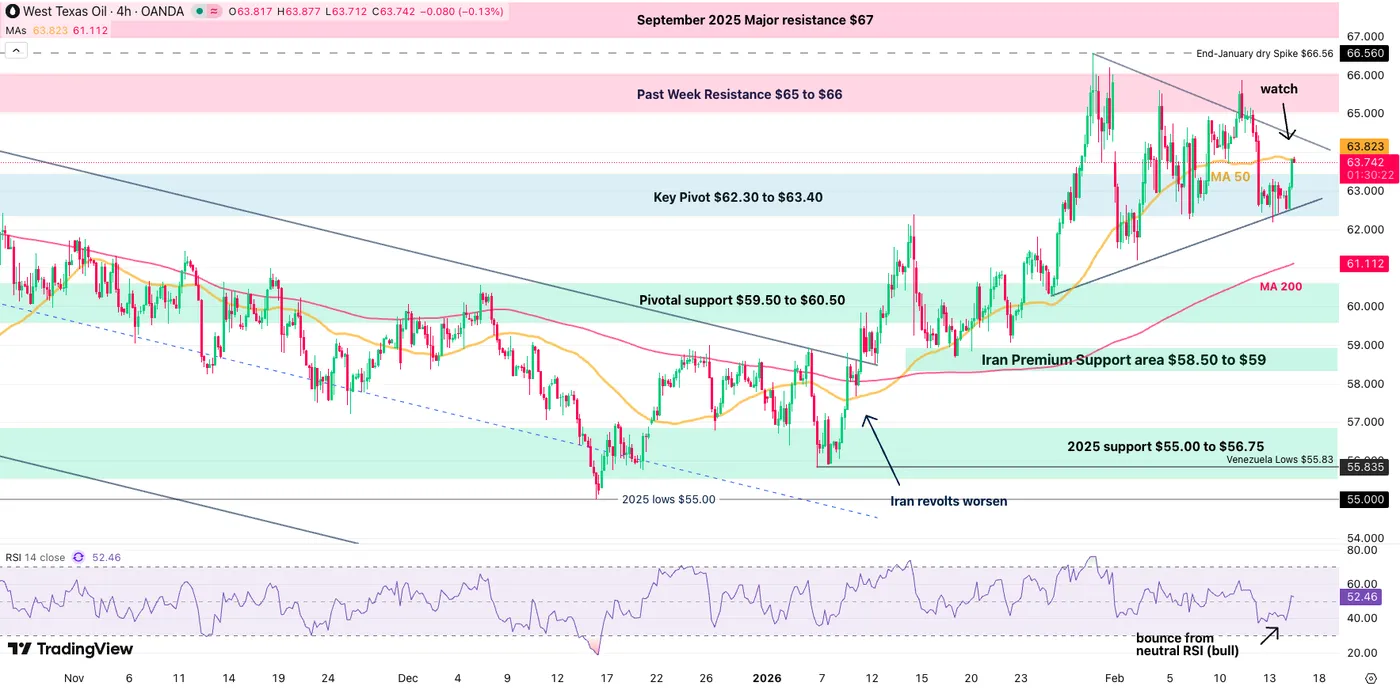
WTI Oil 4H Chart – February 16, 2026. Source: TradingView
The action rebounded well in this thin-volume Monday but key technical tests are ahead for bulls:
- The action remains in a triangle formation, indicating directionless behaviors and traders simply profiting by fading the spikes while nothing concrete occurs.
- The 4H 50-period MA ($63.82) is acting as key resistance on the intraday timeframe.
- Any clear push above with volume points to a breakout, in the meantime, profit-taking could easily occur here.
- Any deal could easily lead to regaining the $59 level and could face even further pressure towards early 2026 levels.
WTI Technical Levels
Levels to place on your WTI charts:
Resistance Levels:
- $63.83 4H 50-MA and session Highs
- Past week Spike $66.56
- Minor Resistance $65 to $66
- September 2025 Major resistance $67 (could get breached if US attacks)
- Psychological Resistance $70
- $78.43 12-Day War highs
Support Levels:
- Range Key Pivot/Support $62.30 to $63.40 (Iran Premium lows and 200-Day MA)
- 4H 200-period MA $61.11
- May Range lows support $59 to $60.5 Major support
- Iran Support area $58.50 to $59
1H Chart
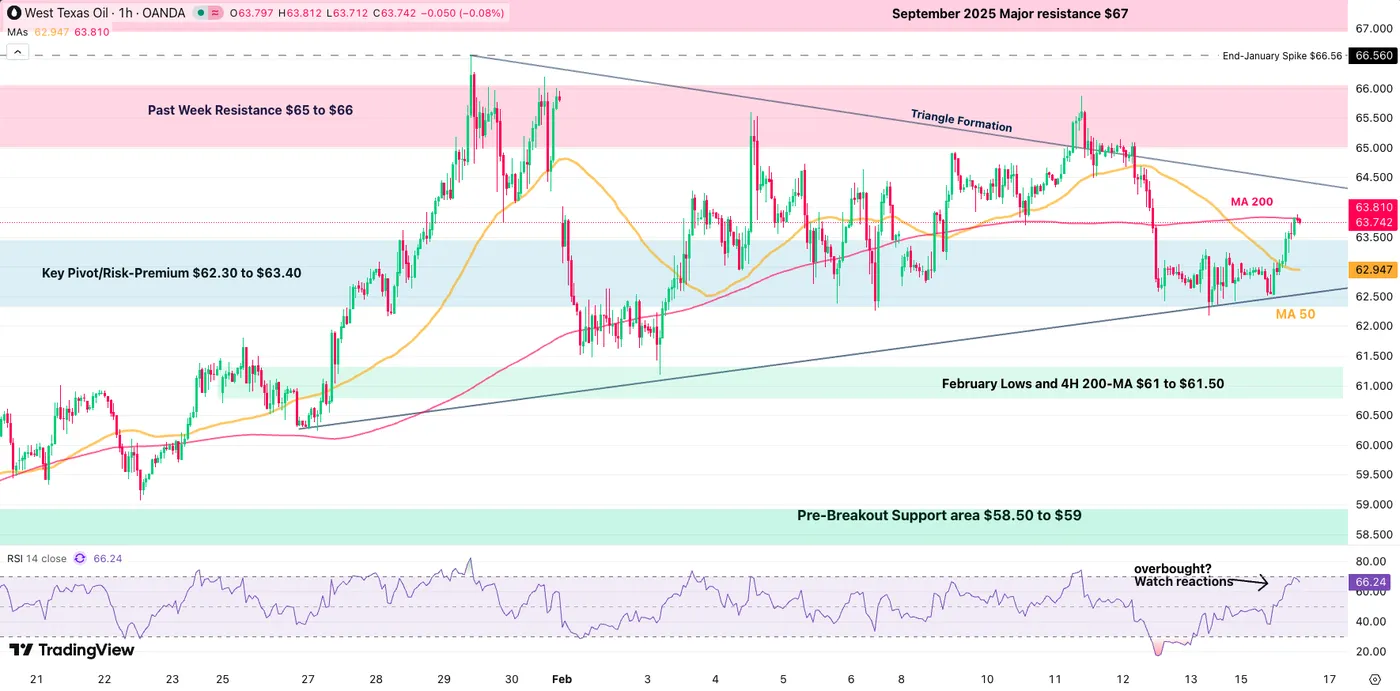
WTI Oil 1H Chart – February 16, 2026. Source: TradingView
On the shorter timeframe, Oil is reaching overbought level and with the 4H 50-period MA acting as immediate resistance, mean-reversion back to the Pivot Zone would not be shocking.
One thing to be wary of, is that ahead of a deal officially being reached, going short Oil holds immense risks, with stops which could largely be missed in case of a price jump or any sudden turmoil.
Safe Trades and a successful week!
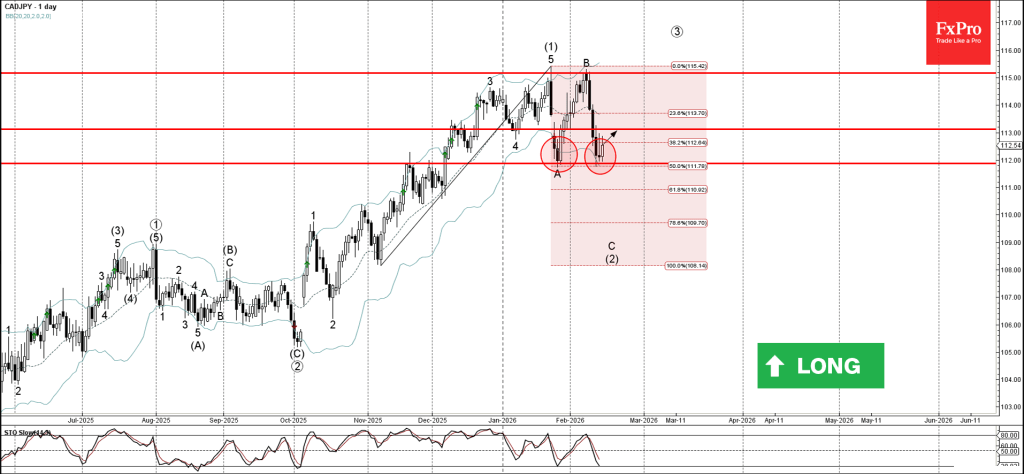
CADJPY Wave Analysis
CADJPY: ⬆️ Buy
- CADJPY reversed from support zone
- Likely to rise to resistance level 113.00
CADJPY currency pair recently reversed up from the support zone between the support level 112.00 (former low of wave A from January), lower daily Bollinger Band and the 50% Fibonacci correction of the upward impulse from November.
The upward reversal from this support zone is likely to form the daily Japanese candlesticks reversal pattern Morning Star.
Given the strong daily uptrend, CADJPY currency pair can be expected to rise to the next resistance level 113.00.
Eco Data 2/17/26
| GMT | Ccy | Events | Act | Cons | Prev | Rev |
|---|---|---|---|---|---|---|
| 00:30 | AUD | RBA Meeting Minutes | ||||
| 04:30 | JPY | Tertiary Industry Index M/M Dec | -0.50% | -0.30% | -0.20% | -0.40% |
| 07:00 | EUR | Germany CPI M/M Jan F | 0.10% | 0.10% | 0.10% | |
| 07:00 | EUR | Germany CPI Y/Y Jan F | 2.10% | 2.10% | 2.10% | |
| 07:00 | GBP | Claimant Count Change Jan | 28.6K | 22.8K | 17.9K | |
| 07:00 | GBP | ILO Unemployment Rate (3M) Dec | 5.20% | 5.10% | 5.10% | |
| 07:00 | GBP | Average Earnings Including Bonus 3M/Y Dec | 4.20% | 4.60% | 4.70% | 4.60% |
| 07:00 | GBP | Average Earnings Excluding Bonus 3M/Y Dec | 4.20% | 4.20% | 4.50% | 4.40% |
| 10:00 | EUR | Germany ZEW Economic Sentiment Feb | 58.3 | 65.2 | 59.6 | |
| 10:00 | EUR | Germany ZEW Current Situation Feb | -65.9 | -65.7 | -72.7 | |
| 10:00 | EUR | Eurozone ZEW Economic Sentiment Feb | 39.4 | 45.2 | 40.8 | |
| 13:30 | CAD | Wholesale Sales M/M Dec | 2.00% | 2.10% | -1.80% | |
| 13:30 | CAD | CPI M/M Jan | 0.00% | 0.10% | -0.20% | |
| 13:30 | CAD | CPI Y/Y Jan | 2.30% | 2.40% | 2.40% | |
| 13:30 | CAD | CPI Median Y/Y Jan | 2.50% | 2.50% | 2.50% | 2.60% |
| 13:30 | CAD | CPI Trimmed Y/Y Jan | 2.40% | 2.60% | 2.70% | |
| 13:30 | CAD | CPI Common Y/Y Jan | 2.70% | 2.70% | 2.80% | |
| 13:30 | USD | Empire State Manufacturing Feb | 7.1 | 8.9 | 7.7 | |
| 15:00 | USD | NAHB Housing Market Index Feb | 36 | 38 | 37 |
| 00:30 | AUD |
| RBA Meeting Minutes | |
| Actual | |
| Consensus | |
| Previous | |
| 04:30 | JPY |
| Tertiary Industry Index M/M Dec | |
| Actual | -0.50% |
| Consensus | -0.30% |
| Previous | -0.20% |
| Revised | -0.40% |
| 07:00 | EUR |
| Germany CPI M/M Jan F | |
| Actual | 0.10% |
| Consensus | 0.10% |
| Previous | 0.10% |
| 07:00 | EUR |
| Germany CPI Y/Y Jan F | |
| Actual | 2.10% |
| Consensus | 2.10% |
| Previous | 2.10% |
| 07:00 | GBP |
| Claimant Count Change Jan | |
| Actual | 28.6K |
| Consensus | 22.8K |
| Previous | 17.9K |
| 07:00 | GBP |
| ILO Unemployment Rate (3M) Dec | |
| Actual | 5.20% |
| Consensus | 5.10% |
| Previous | 5.10% |
| 07:00 | GBP |
| Average Earnings Including Bonus 3M/Y Dec | |
| Actual | 4.20% |
| Consensus | 4.60% |
| Previous | 4.70% |
| Revised | 4.60% |
| 07:00 | GBP |
| Average Earnings Excluding Bonus 3M/Y Dec | |
| Actual | 4.20% |
| Consensus | 4.20% |
| Previous | 4.50% |
| Revised | 4.40% |
| 10:00 | EUR |
| Germany ZEW Economic Sentiment Feb | |
| Actual | 58.3 |
| Consensus | 65.2 |
| Previous | 59.6 |
| 10:00 | EUR |
| Germany ZEW Current Situation Feb | |
| Actual | -65.9 |
| Consensus | -65.7 |
| Previous | -72.7 |
| 10:00 | EUR |
| Eurozone ZEW Economic Sentiment Feb | |
| Actual | 39.4 |
| Consensus | 45.2 |
| Previous | 40.8 |
| 13:30 | CAD |
| Wholesale Sales M/M Dec | |
| Actual | 2.00% |
| Consensus | 2.10% |
| Previous | -1.80% |
| 13:30 | CAD |
| CPI M/M Jan | |
| Actual | 0.00% |
| Consensus | 0.10% |
| Previous | -0.20% |
| 13:30 | CAD |
| CPI Y/Y Jan | |
| Actual | 2.30% |
| Consensus | 2.40% |
| Previous | 2.40% |
| 13:30 | CAD |
| CPI Median Y/Y Jan | |
| Actual | 2.50% |
| Consensus | 2.50% |
| Previous | 2.50% |
| Revised | 2.60% |
| 13:30 | CAD |
| CPI Trimmed Y/Y Jan | |
| Actual | 2.40% |
| Consensus | 2.60% |
| Previous | 2.70% |
| 13:30 | CAD |
| CPI Common Y/Y Jan | |
| Actual | 2.70% |
| Consensus | 2.70% |
| Previous | 2.80% |
| 13:30 | USD |
| Empire State Manufacturing Feb | |
| Actual | 7.1 |
| Consensus | 8.9 |
| Previous | 7.7 |
| 15:00 | USD |
| NAHB Housing Market Index Feb | |
| Actual | 36 |
| Consensus | 38 |
| Previous | 37 |
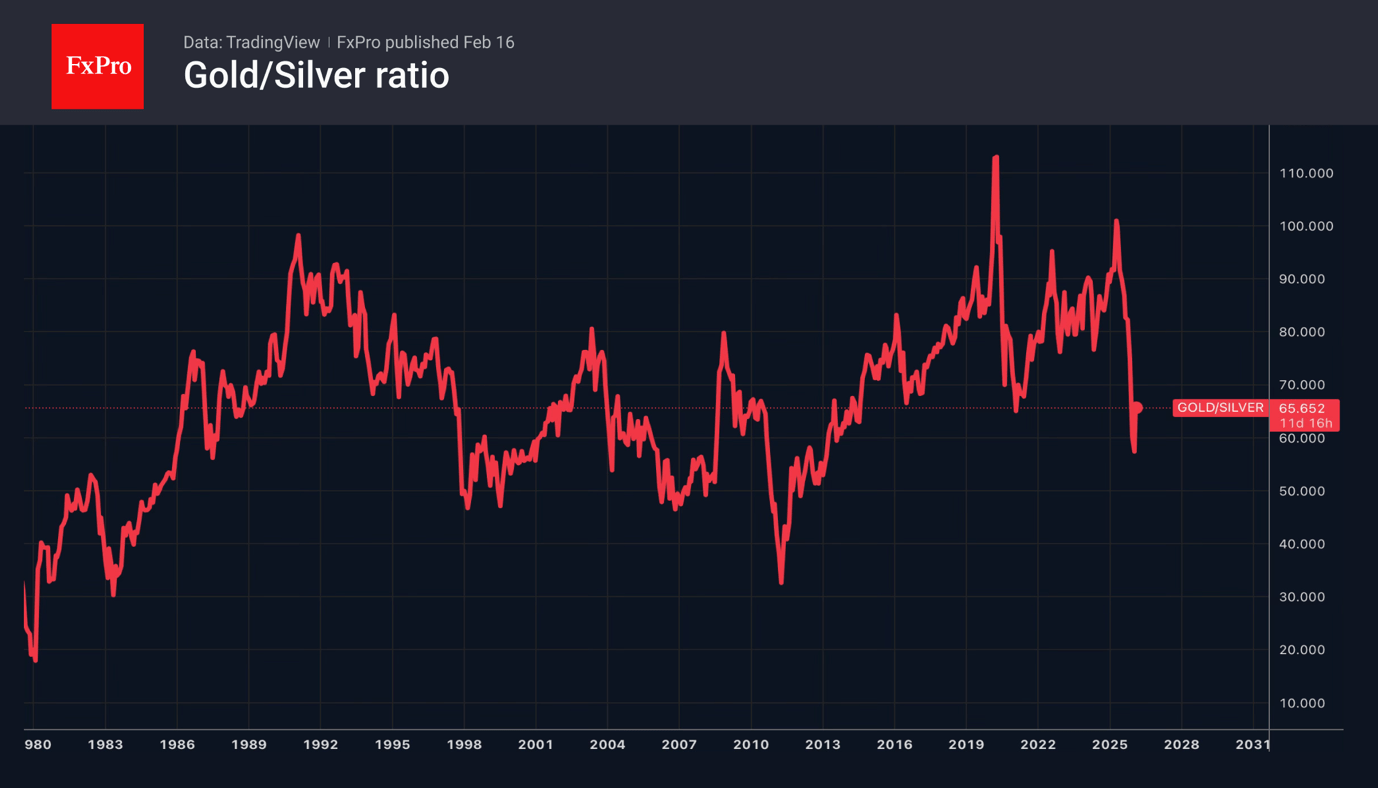
Silver Plays Its Own Game
- Precious metals are diverging due to different market structures.
- Dollar under pressure before US GDP and EU business activity releases.
The slowdown in US CPI from 2.7% to 2.4% has halted the advance of the US dollar. If inflation returns to its 2% target without a recession, the Fed will not need to keep rates at such high levels. The futures market has raised the chances of a resumption of the monetary expansion cycle to 29% in April and 67% in June. The fall in EURUSD that began after strong employment statistics has been put on hold.
In fact, the Fed is unlikely to change its outlook based on a single report. The central bank needs confirmation of labour market stabilisation and a disinflationary trend. According to Philadelphia Fed President Anna Paulson, prices must fall to 2%, so the central bank’s work is not finished yet. However, a pause in the Fed’s easing cycle plays into the hands of EURUSD bears.
Pressure on the US dollar is being driven by fears of a sharp slowdown in US GDP in the fourth quarter, from 4.4% to 3%, as well as by investor confidence in upbeat business activity reports from the eurozone. According to Capital Group, the currency bloc’s economic acceleration will drive inflation and force the ECB to raise its deposit rate by the end of this year. This will bring EURUSD back above 1.2.
The yen was the best performer among G10 currencies in the second week of February. Investors bet on political stability after the Liberal Democratic Party won the parliamentary elections and the associated repatriation of capital to Japan. However, Sanae Takaichi now needs to prove her government’s commitment to stabilising finances.
Gold returned above $5,000 per ounce amid mixed signals from the US labour market and inflation. Its path diverged from that of silver. The white metal is falling due to concerns that silver will not be able to return to $100. This is activating sellers of recycled silver. Increased supply amid declining demand from the industry and jewellery due to high prices could return the market to surplus after five years of deficit.
In addition, the gold-silver ratio fell to its lowest level in nearly 13 years at the end of January. The white metal looks expensive from this perspective.
Sunset Market Commentary
Markets
The absence of both US investors (President’s Day) and important eco data set the stage for a quiet start to the trading week. In the second (or even third) tier data category we found January wage tracker data from Indeed Hiring Lab. The data measure growth in wages advertised in job postings for selected country. The euro area series is an employment-weighted average of the five largest nations and Ireland. Data showed wage growth slowing from 2.43% Y/Y to 2.29% which equals the 3m moving average of 2.3% (stable from 2.28% in December; slowest pace since November 2021). On Friday, the ECB publishes more closely-watched quarterly negotiated wage data (Q4). One-off payments pulled the series from 4% Y/Y in Q2 to 1.9% Y/Y in Q3 with markets expecting a rebound to 2.9% Y/Y in Q4 2025. The central bank’s latest forward looking wage tracker, released last week, points to 2.1% wage growth in the first half of this year and 2.7% growth in H2. It still sees forward-looking information in line with negotiated wage growth that might level off at below 3% by the end of 2026. If realized, these kind of wage growth levels support the case for the ECB to hold the policy rate near a 2% neutral level. Wage growth figures for the UK showed a stabilization around 4.14% Y/Y in January with the 3m moving average extending its slide (since July 2024!) from 4.47% to 4.24%, matching the lowest level since March 2022. UK markets are unnerved as they also eye the bigger releases later this week. The labour market report opens the debates tomorrow with weekly earnings (excl) bonuses expect to mirror today’s numbers with a decrease to 4.2% which would be the lowest since January 2022. Any signs of disappointing job growth would be taken as confirmation that the Bank of England could implement its next rate cut as soon as in March. BoE governor Bailey, the decisive vote of late, saw scope for some further easing of policy. He’s growing more confident on the overall path of wage disinflation while also stressing on several occasions the difference between soft comments (on the labour market) coming from business contacts and actual data still pointing a somewhat less worrying picture. On Wednesday and on Friday, CPI inflation and retail sales round up this week’s UK numbers. EUR/GBP 0.8750 resistance is the one to watch if markets find more evidence to lift near term rate cut bets.
News & Views
The Swiss economy bounced back from the 0.5% decline registered in 2025Q3 with a 0.2% recovery (flash estimate). The expansion was less than the 0.3% expected though. Annual growth last year amounted to 1.4%, quickening from 2024’s 1.2% but well below average economic growth of 1.8% (since 1981), the State Secretariat for Economic Affairs said. Services sector growth from a quarterly perspective was muted and the industrial sector stagnated. In annual terms, however, services grew at an above-average rate, while the “challenging international environment” slowed the export-oriented industry. Growth numbers today came after last week’s sub-par (m/m) inflation readings but are unlikely to sway the central bank into more rate cuts short-term. With a 0% policy rate, the bar for the Swiss National Bank to go back into negative territory is high. The Swiss franc underperforms vs most peers today but remains strong from a long-term point of view. EUR/CHF is filling bids in the 0.913 area.
It happened all in silence, but the topic on joining the euro area is gaining traction in Sweden. Its finance minister Svantesson announced her backing for an inquiry into the pros and cons last month, at the request of the Liberal party. It would be another major U-turn, along with NATO accession in 2022 and testament to how the changing (geopolitical) world order is both ripping up and strengthening existing ties as well as forging new ones. Swedish voters back in 2003 rejected the common currency in a referendum and Svantesson suggested that any plans for euro adoption would again be put to a public vote. That poses significant hurdles for short-term accession with still nearly a majority of Swedes against and about one third in favor. That gap is nevertheless much smaller than a decade ago, when three in four Swedes opposed the euro. There is also some tough political opposition to overcome with the Greens, the Left and far-right all against. While the debate may grow, it is expected that the actual evaluation for euro accession (based on the inquiry) won’t start until after the September elections.
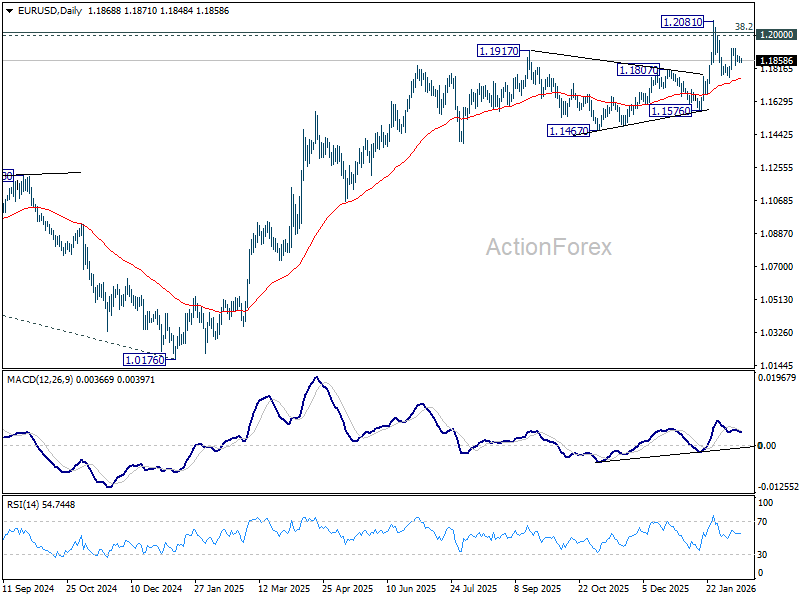
EUR/USD Mid-Day Outlook
Daily Pivots: (S1) 1.1849; (P) 1.1867; (R1) 1.1887; More….
EUR/USD is still bounded in sideway trading and intraday bias remains neutral. On the upside, above 1.1928 will target a retest on 1.2081 high. Decisive break there and sustained trading above 1.2 psychological level will carry larger bullish implications. On the downside, however, sustained trading below 55 D EMA (now at 1.1760) will raise the chance of reversal on rejection by 1.2, and target 1.1576 support for confirmation.
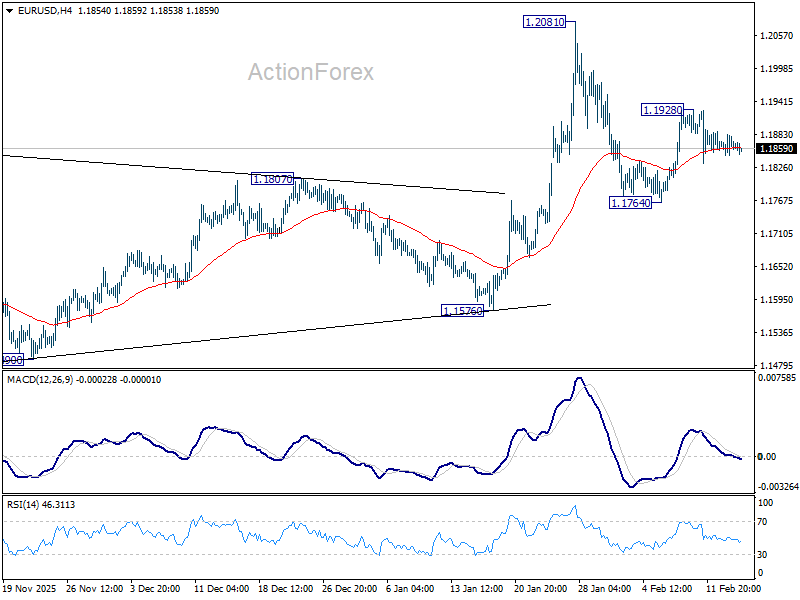
In the bigger picture, as long as 55 W EMA (now at 1.1485) holds, up trend from 0.9534 (2022 low) is still in favor to continue. Decisive break of 1.2 key psychological level will add to the case of long term bullish trend reversal. Next medium term target will be 138.2% projection of 0.9534 to 1.1274 from 1.0176 at 1.2581. However, sustained trading below 55 W EMA will argue that rise from 0.9534 has completed as a three wave corrective bounce, and keep long term outlook bearish.