Sample Category Title
USD/CHF Daily Outlook
Daily Pivots: (S1) 0.9600; (P) 0.9646; (R1) 0.9689; More...
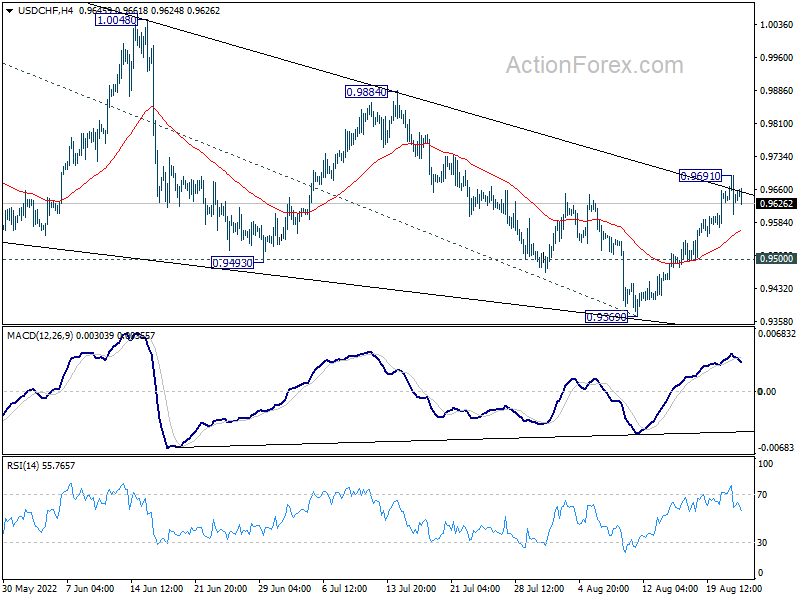
Intraday bias in USD/CHF is turned neutral with current retreat. Triangle correction from 1.0063 could have completed at 0.9369 already. Above 0.9691 will t target 0.9884 resistance next. Break there will argue that larger up trend is ready for resumption through 1.0063. On the downside, below 0.9500 minor support will dampen this view and turn bias back to the downside for 0.9369 support instead.
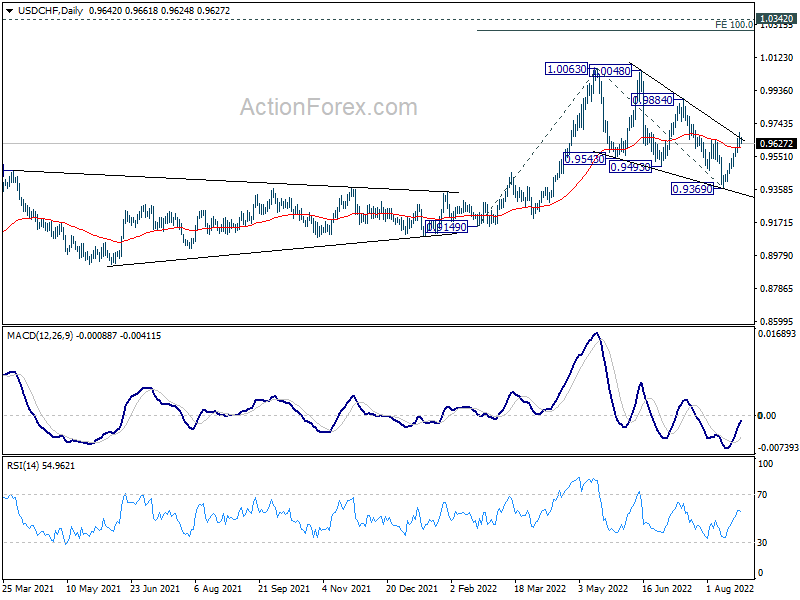
In the bigger picture, current development suggests that up trend from 0.8756 (2021 low) is still in progress. Sustained break of 1.0063 will target 100% projection of 0.9149 to 1.0063 from 0.9369 at 1.0283, and then 1.0342 (2016 high). For now, this will remain the favored case as long as 0.9369 support holds, even in case of deep pull back.
EUR/USD Daily Outlook
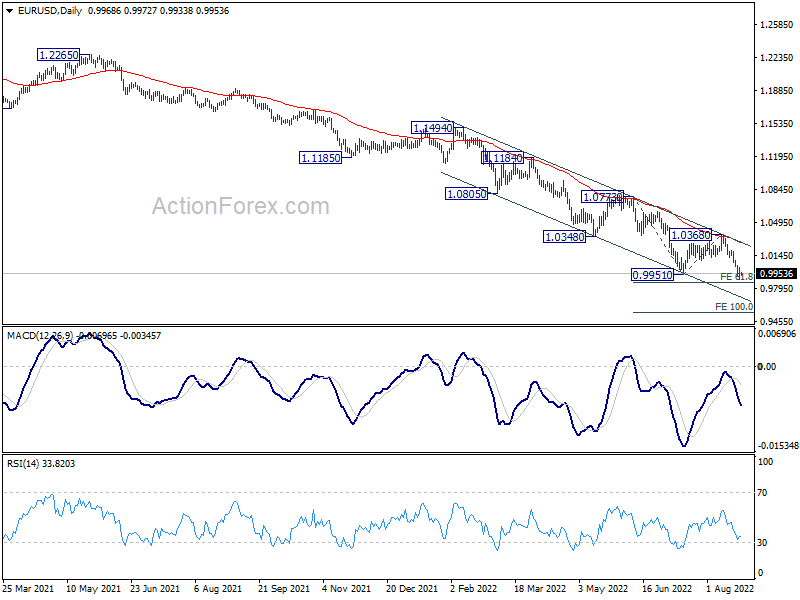
Daily Pivots: (S1) 0.9907; (P) 0.9962; (R1) 1.0024; More...
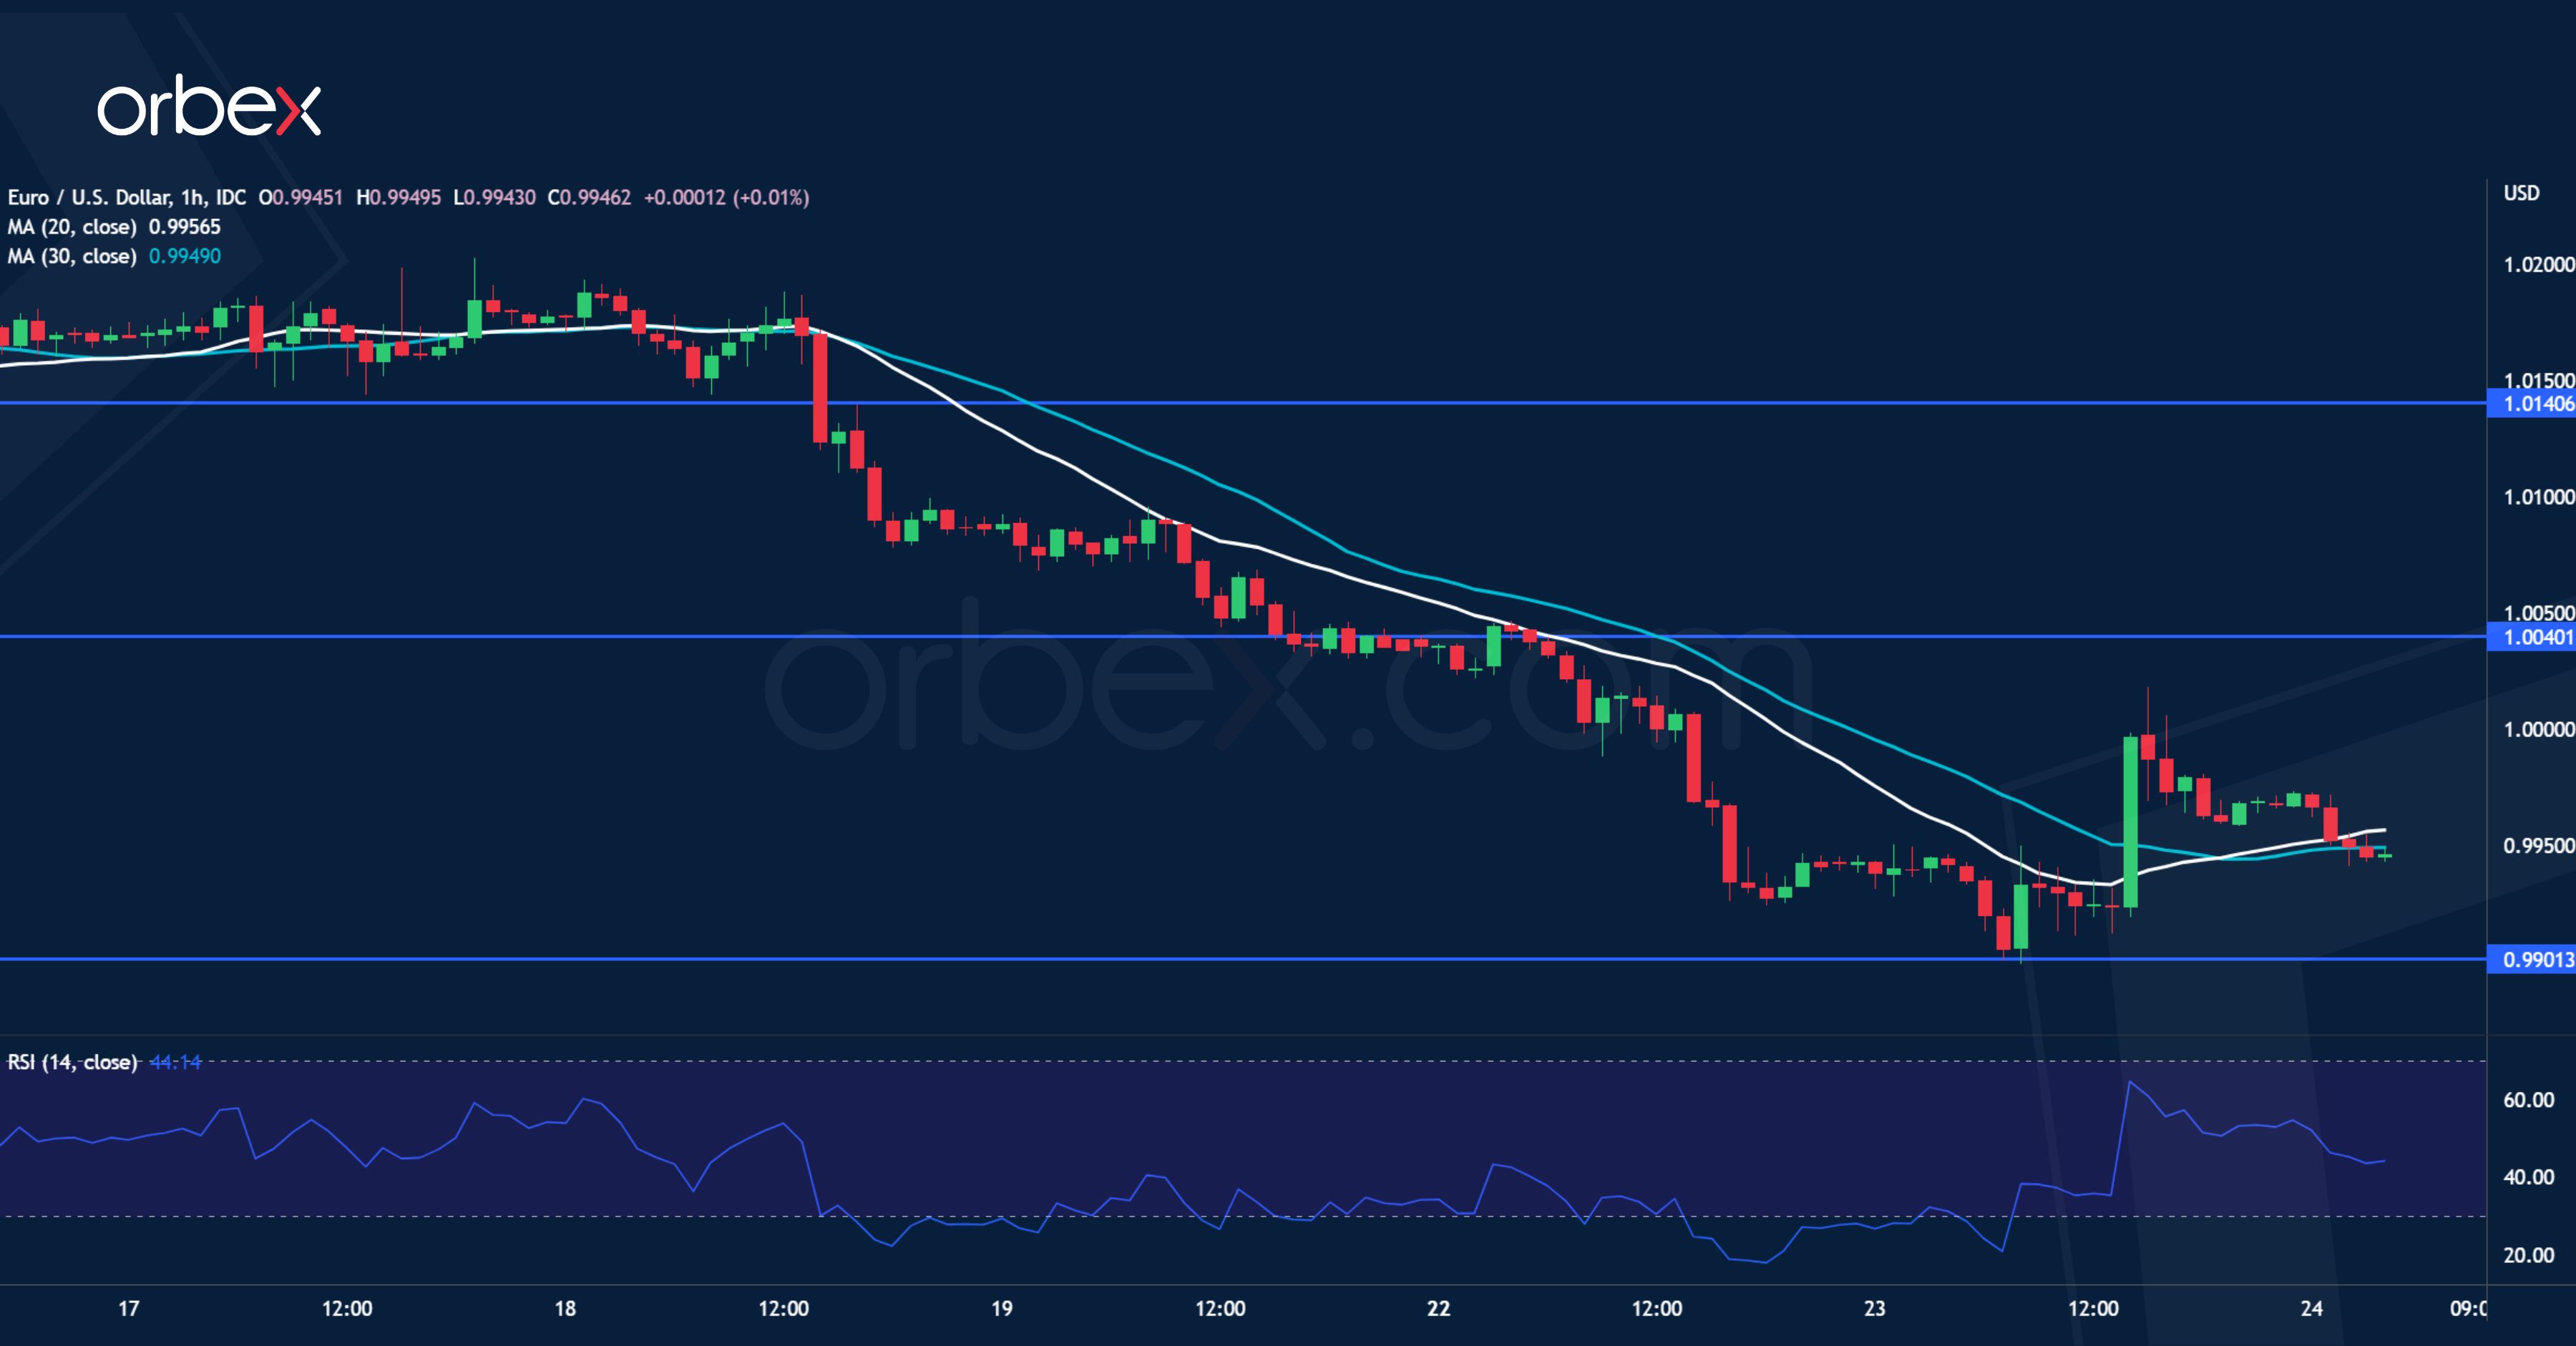
A temporary low as formed at 0.9899 with current recovery. Intraday bias in EUR/USD is turned neutral first. Recovery should be limited by 1.0121 minor resistance to bring another fall. Break of 0.9899 will resume larger down trend to 61.8% projection of 1.0773 to 0.9951 from 1.0368 at 0.9860. Firm break there should prompt downside acceleration to 100% projection at 0.9546.
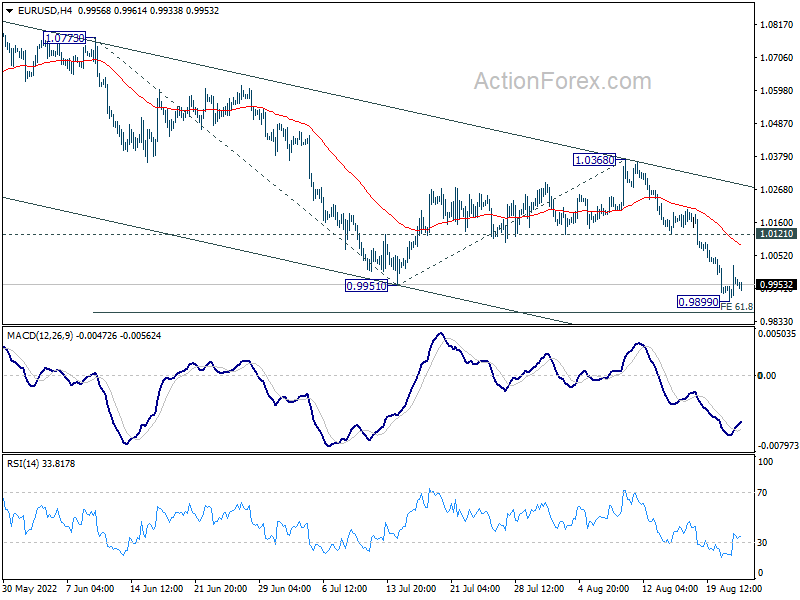
In the bigger picture, down trend from 1.6039 (2008 high) is still in progress. Next target is 100% projection of 1.3993 to 1.0339 from 1.2348 at 0.8694. In any case, outlook will stay bearish as long as 1.0368 resistance holds, in case of strong rebound.
Crypto Market’s Fragile Stability
Market picture
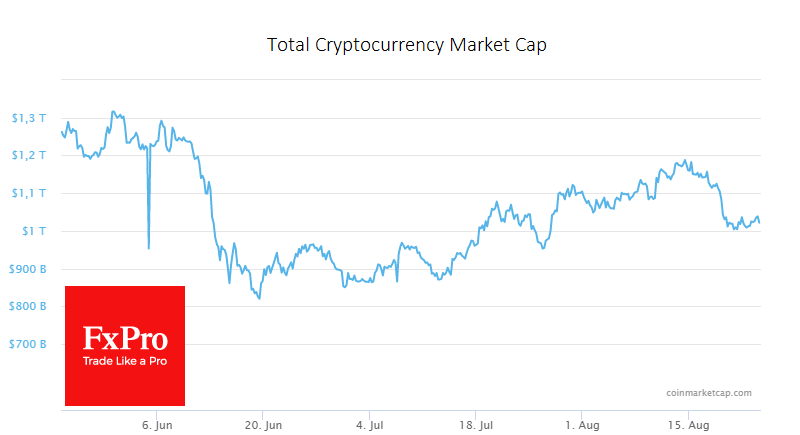
Bitcoin has added 2% in the past 24 hours to $21,400. Ethereum added 4.6% to $1640, while top altcoins added between 0.9% (Dogecoin) and 4.4% (Polkadot).
Total cryptocurrency market capitalization, according to CoinMarketCap, rose 2.2% to $1.03 trillion overnight. The Cryptocurrency Fear and Greed Index fell 3 points to 25 by Wednesday and went from “fear” to “extreme fear”.
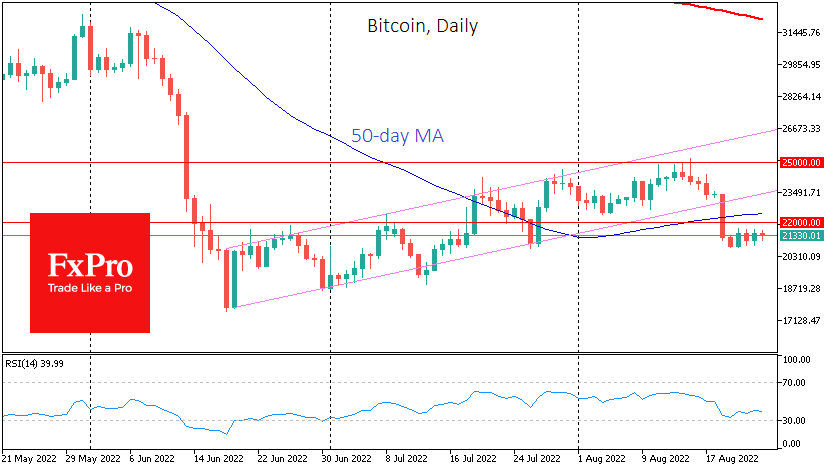
Unlike stock indices, Bitcoin has not fallen but has appeared as if it is disconnected from the market, having reached an equilibrium between the sell-off lows of late July at $20.5K and $22.5K.
The technical picture looks like a consolidation before a new downward momentum, potentially to the lows near 17600. BTCUSD could update that low if the decline gets caught up in the storm of falling stock markets. But it is too early to bet on this.
News background
CoinShares strategy director Meltem Demirors believes that because of the holiday season, we should not expect significant changes in the cryptocurrency market until the end of September.
According to SkyBridge Capital CEO Anthony Scaramucci, bitcoin cannot yet act as an asset to hedge inflation as adopting the first cryptocurrency is not enough.
According to Arcane Research, Bitcoin could become one of the world’s leading power consumers by 2040.
Developers of the Dogecoin Foundation have reported that a DOGE-ETH bridge will be launched by the end of the year to move DOGE from the Dogecoin blockchain to the Ethereum network and back again.
NZDUSD Erases Yesterday’s Rally; Could Weaken Further
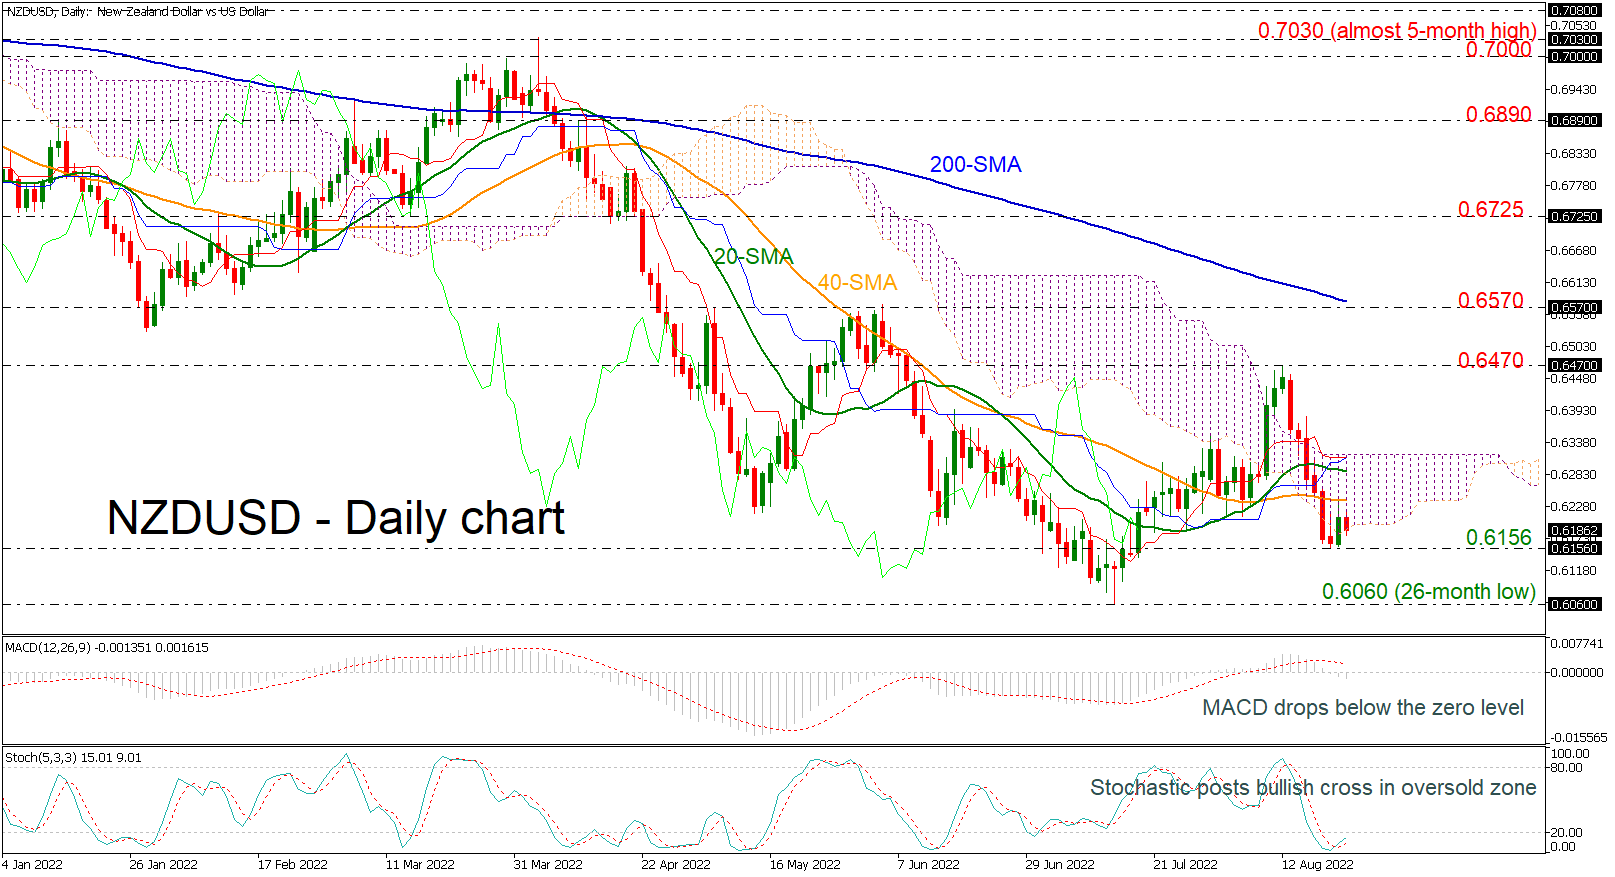
NZDUSD is continuing the selling interest despite the bounce off the 0.6156 support level in the preceding session. The price holds near the lower boundary of the Ichimoku cloud, while the 20- and 40-day simple moving averages (SMAs) are pointing downwards. The MACD oscillator is heading south as well, holding in the negative region. However, the stochastic oscillator posted a bullish crossover in the oversold area, suggesting the end of the bearish move.
Should the pair stretch south, Tuesday’s low of 0.6156 could provide immediate support before the pair touches the 26-month low of 0.6060. A significant step lower could bring the bearish sentiment back into play, sending the price probably towards 0.5920, which was a strong barrier back in May 2020.
On the flip side, the 20- and 40-day SMAs currently at 0.6240 and 0.6290 respectively may halt upside movements. If traders continue to buy the pair, the price could rise until the 0.6470 barrier, while steeper increases could also touch the 200-day SMA near 0.6570.
In the medium-term picture, NZDUSD has been trading bearish in the past four months and only a climb beyond the 200-day SMA may switch this outlook to bullish.
ECB Rehn: Digital native form of safe central bank money could enhance stability
ECB Governing Council member Olli Rehn said, "a digital euro would give people an additional choice about how to pay and would make it easier to do so in an increasingly digital economy."
"A digital native form of safe central bank money could enhance stability by providing the neutral trusted settlement layer in the future financial system," he added.
Rehn expected the investigation phase for digital Euro to conclude in October 2023.
USD/CHF: Final Cycle Wave Z Could Take a Zigzag Structure
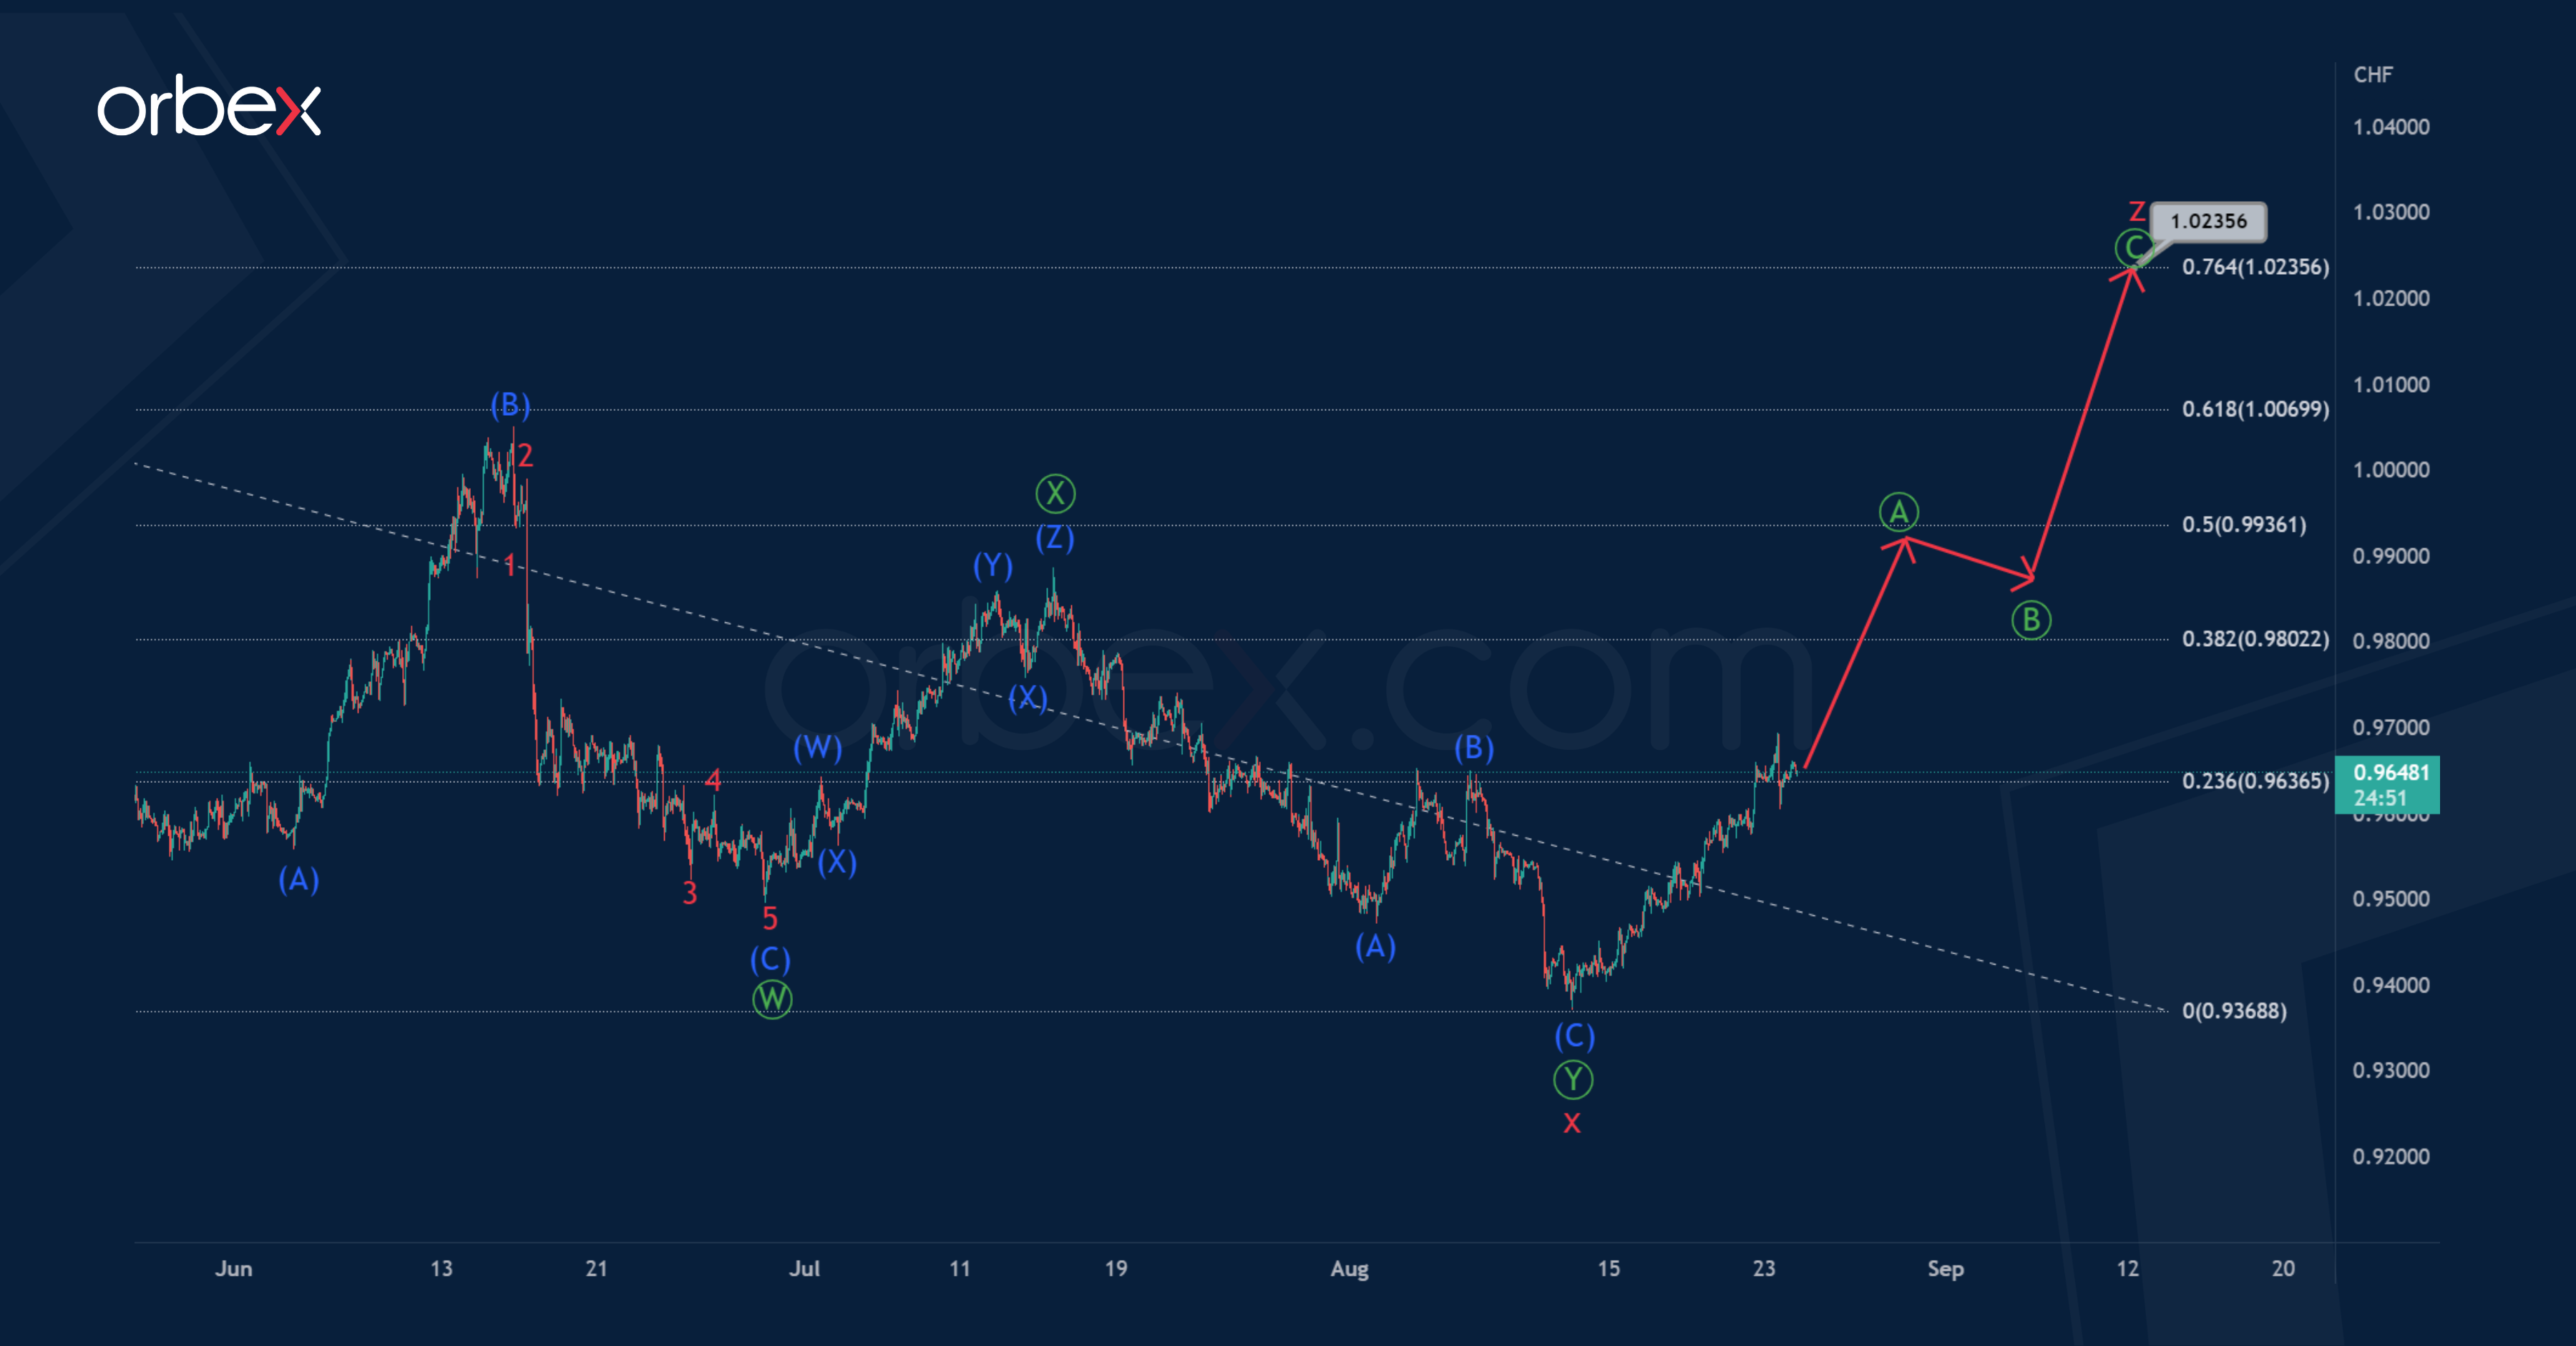
The current USDCHF structure on the 1-hour timeframe shows the final part of a large triple zigzag consisting of cycle sub-waves w-x-y-x-z.
It is possible that the price reduction in the intervening wave x, which is a double zigzag, has recently come to an end. Currently, there is a development of the actionary wave z of the cycle degree.
It is likely that the wave z will be a standard 3-wave zigzag of the primary degree.
It is assumed that in the next coming trading days, market participants could see the development of sub-waves, as shown on the chart, near 1.023.
At that level, cycle wave z will be at 76.4% of previous actionary wave y.
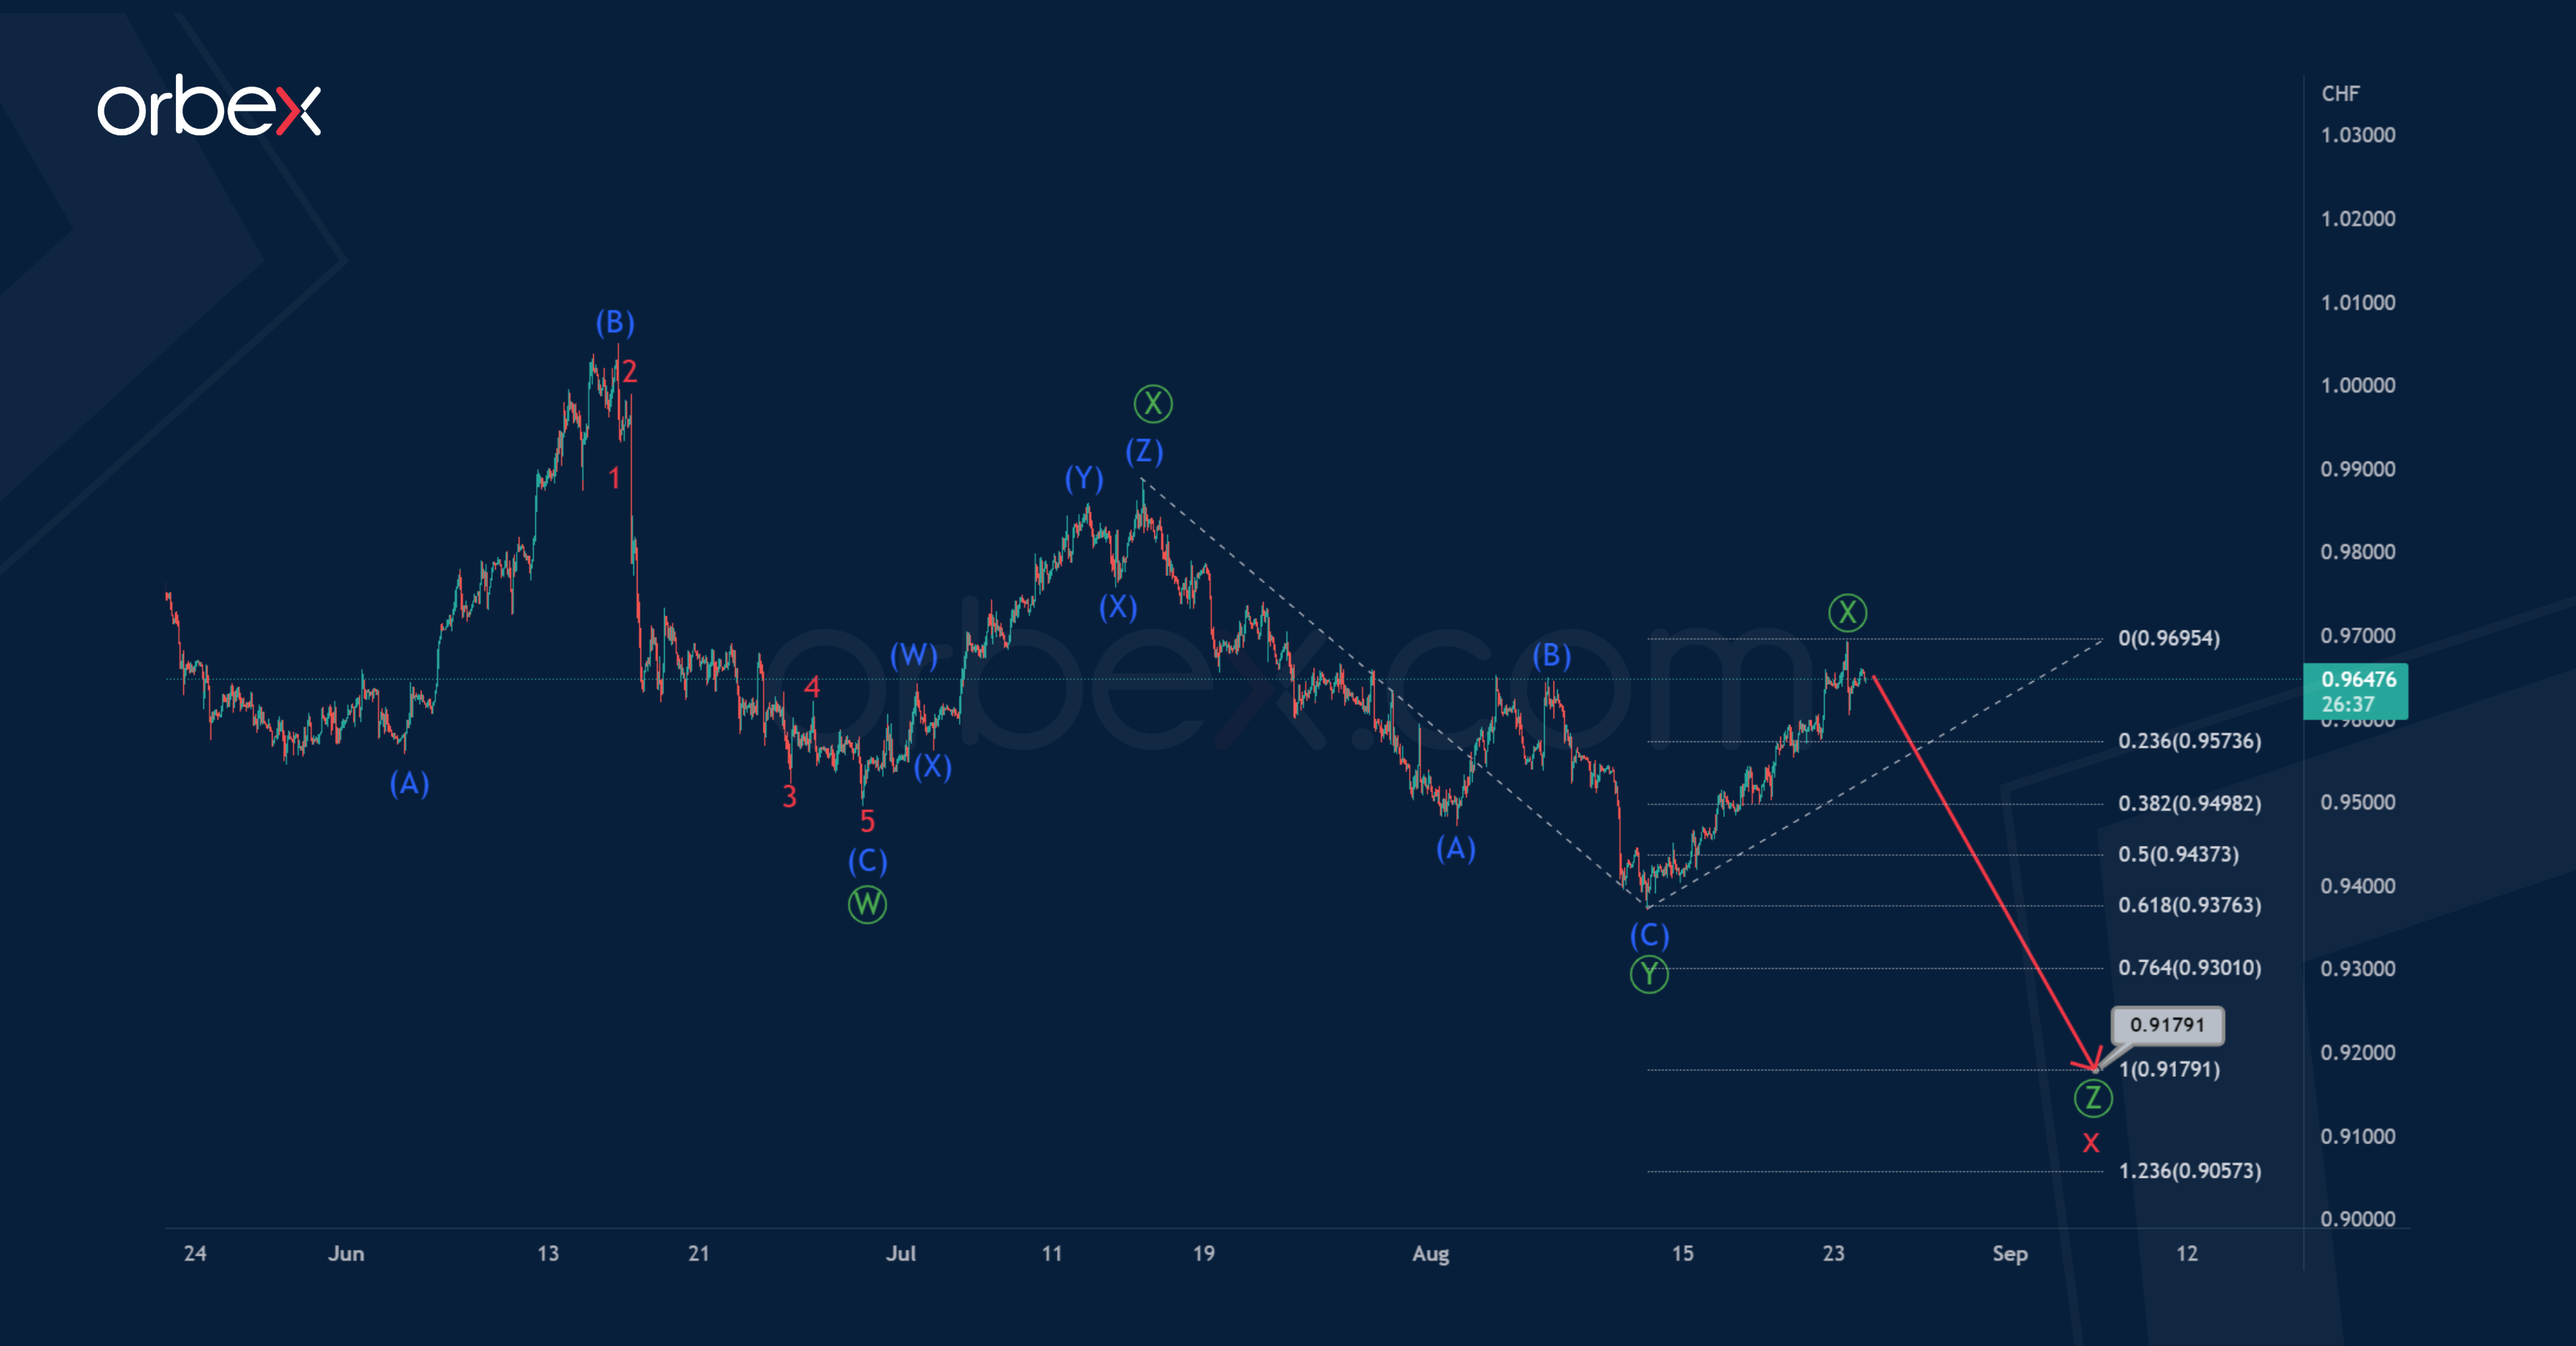
Alternatively, the construction of the bearish intervening wave x has not yet come to an end. This wave can be more complex in its form, that is, it may take the form of a triple zigzag rather than a double zigzag.
Thus, the confirmation of this option could be a reduction in the price and the construction of the final sub-wave.
It is possible that the wave will strive for equality with the previous actionary wave, and therefore its end is possible near the level of 0.917.
The probability of achieving this coefficient is high.
NAS 100 Struggles for Bids
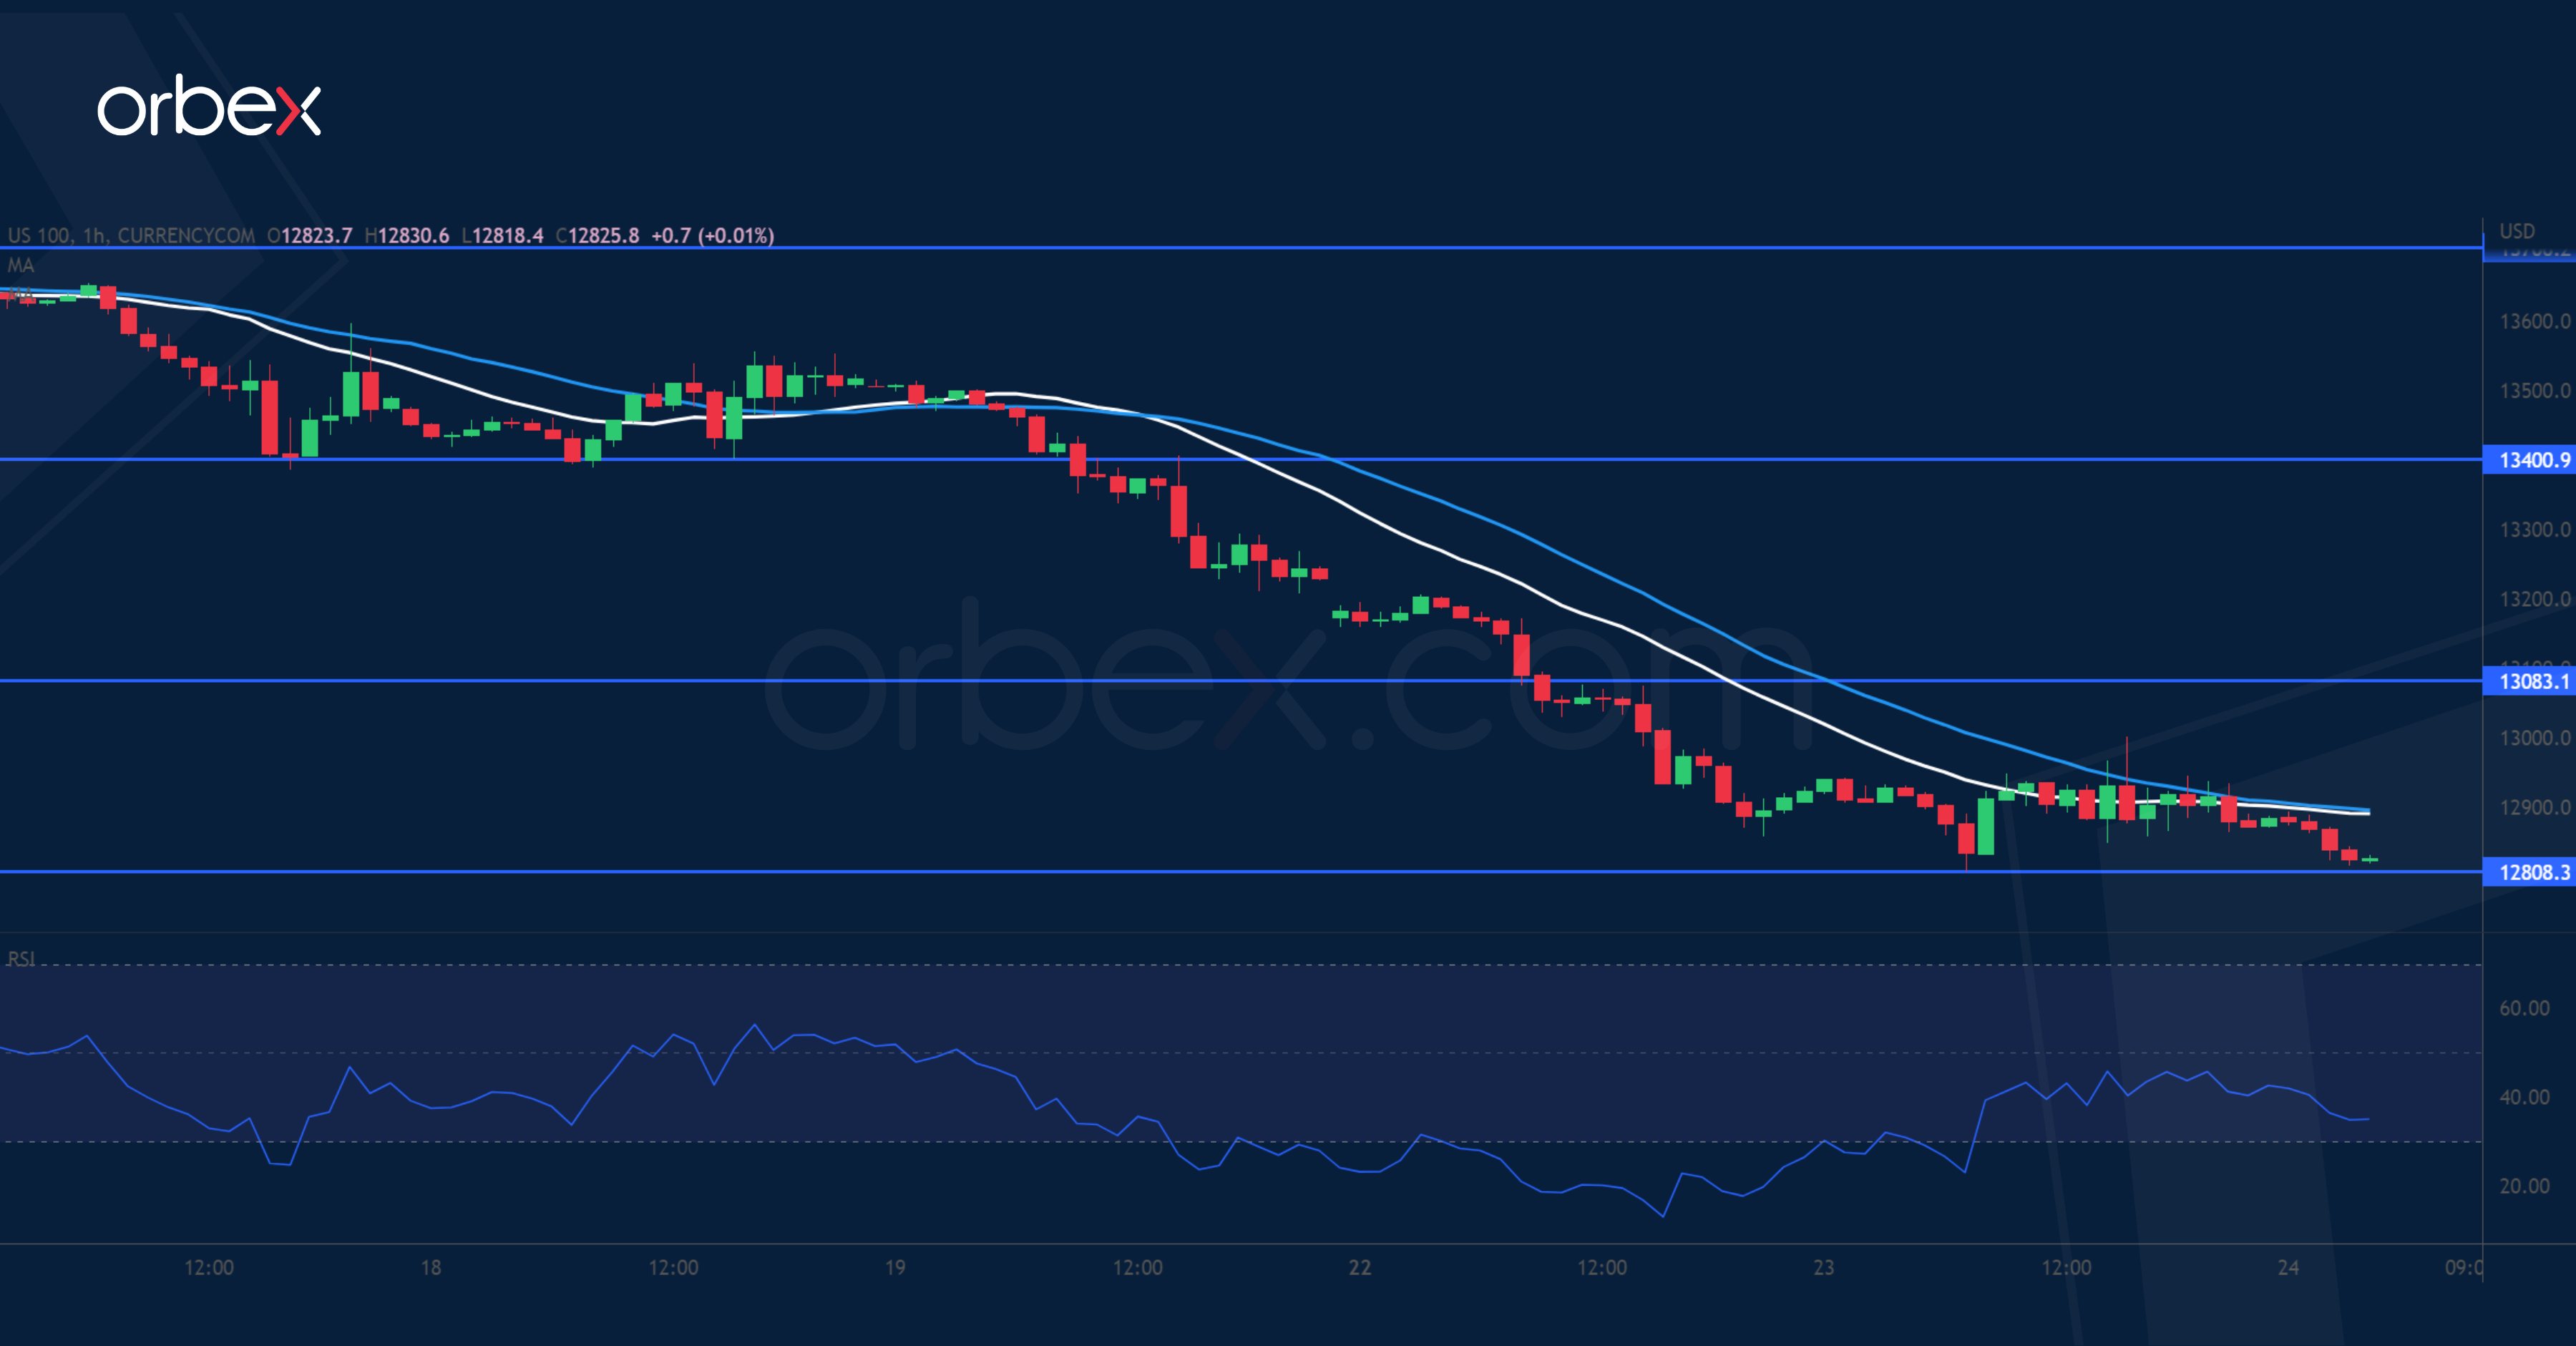
The Nasdaq 100 feels the pressure from signs of a slowing US economy. A break below the psychological tag of 13000 has put the bulls under pressure. 12800 on the 30-day moving average is another test of buyers’ resolve in the short term. 13080 has become a fresh supply area, and as the RSI recovers into the neutral area, renewed selling interest could cap a potential rebound. The bulls will need to reclaim 13400 before the index could secure a foothold again. Otherwise, it could be vulnerable to another round of sell-offs.
GBP/USD Breaks Daily Support
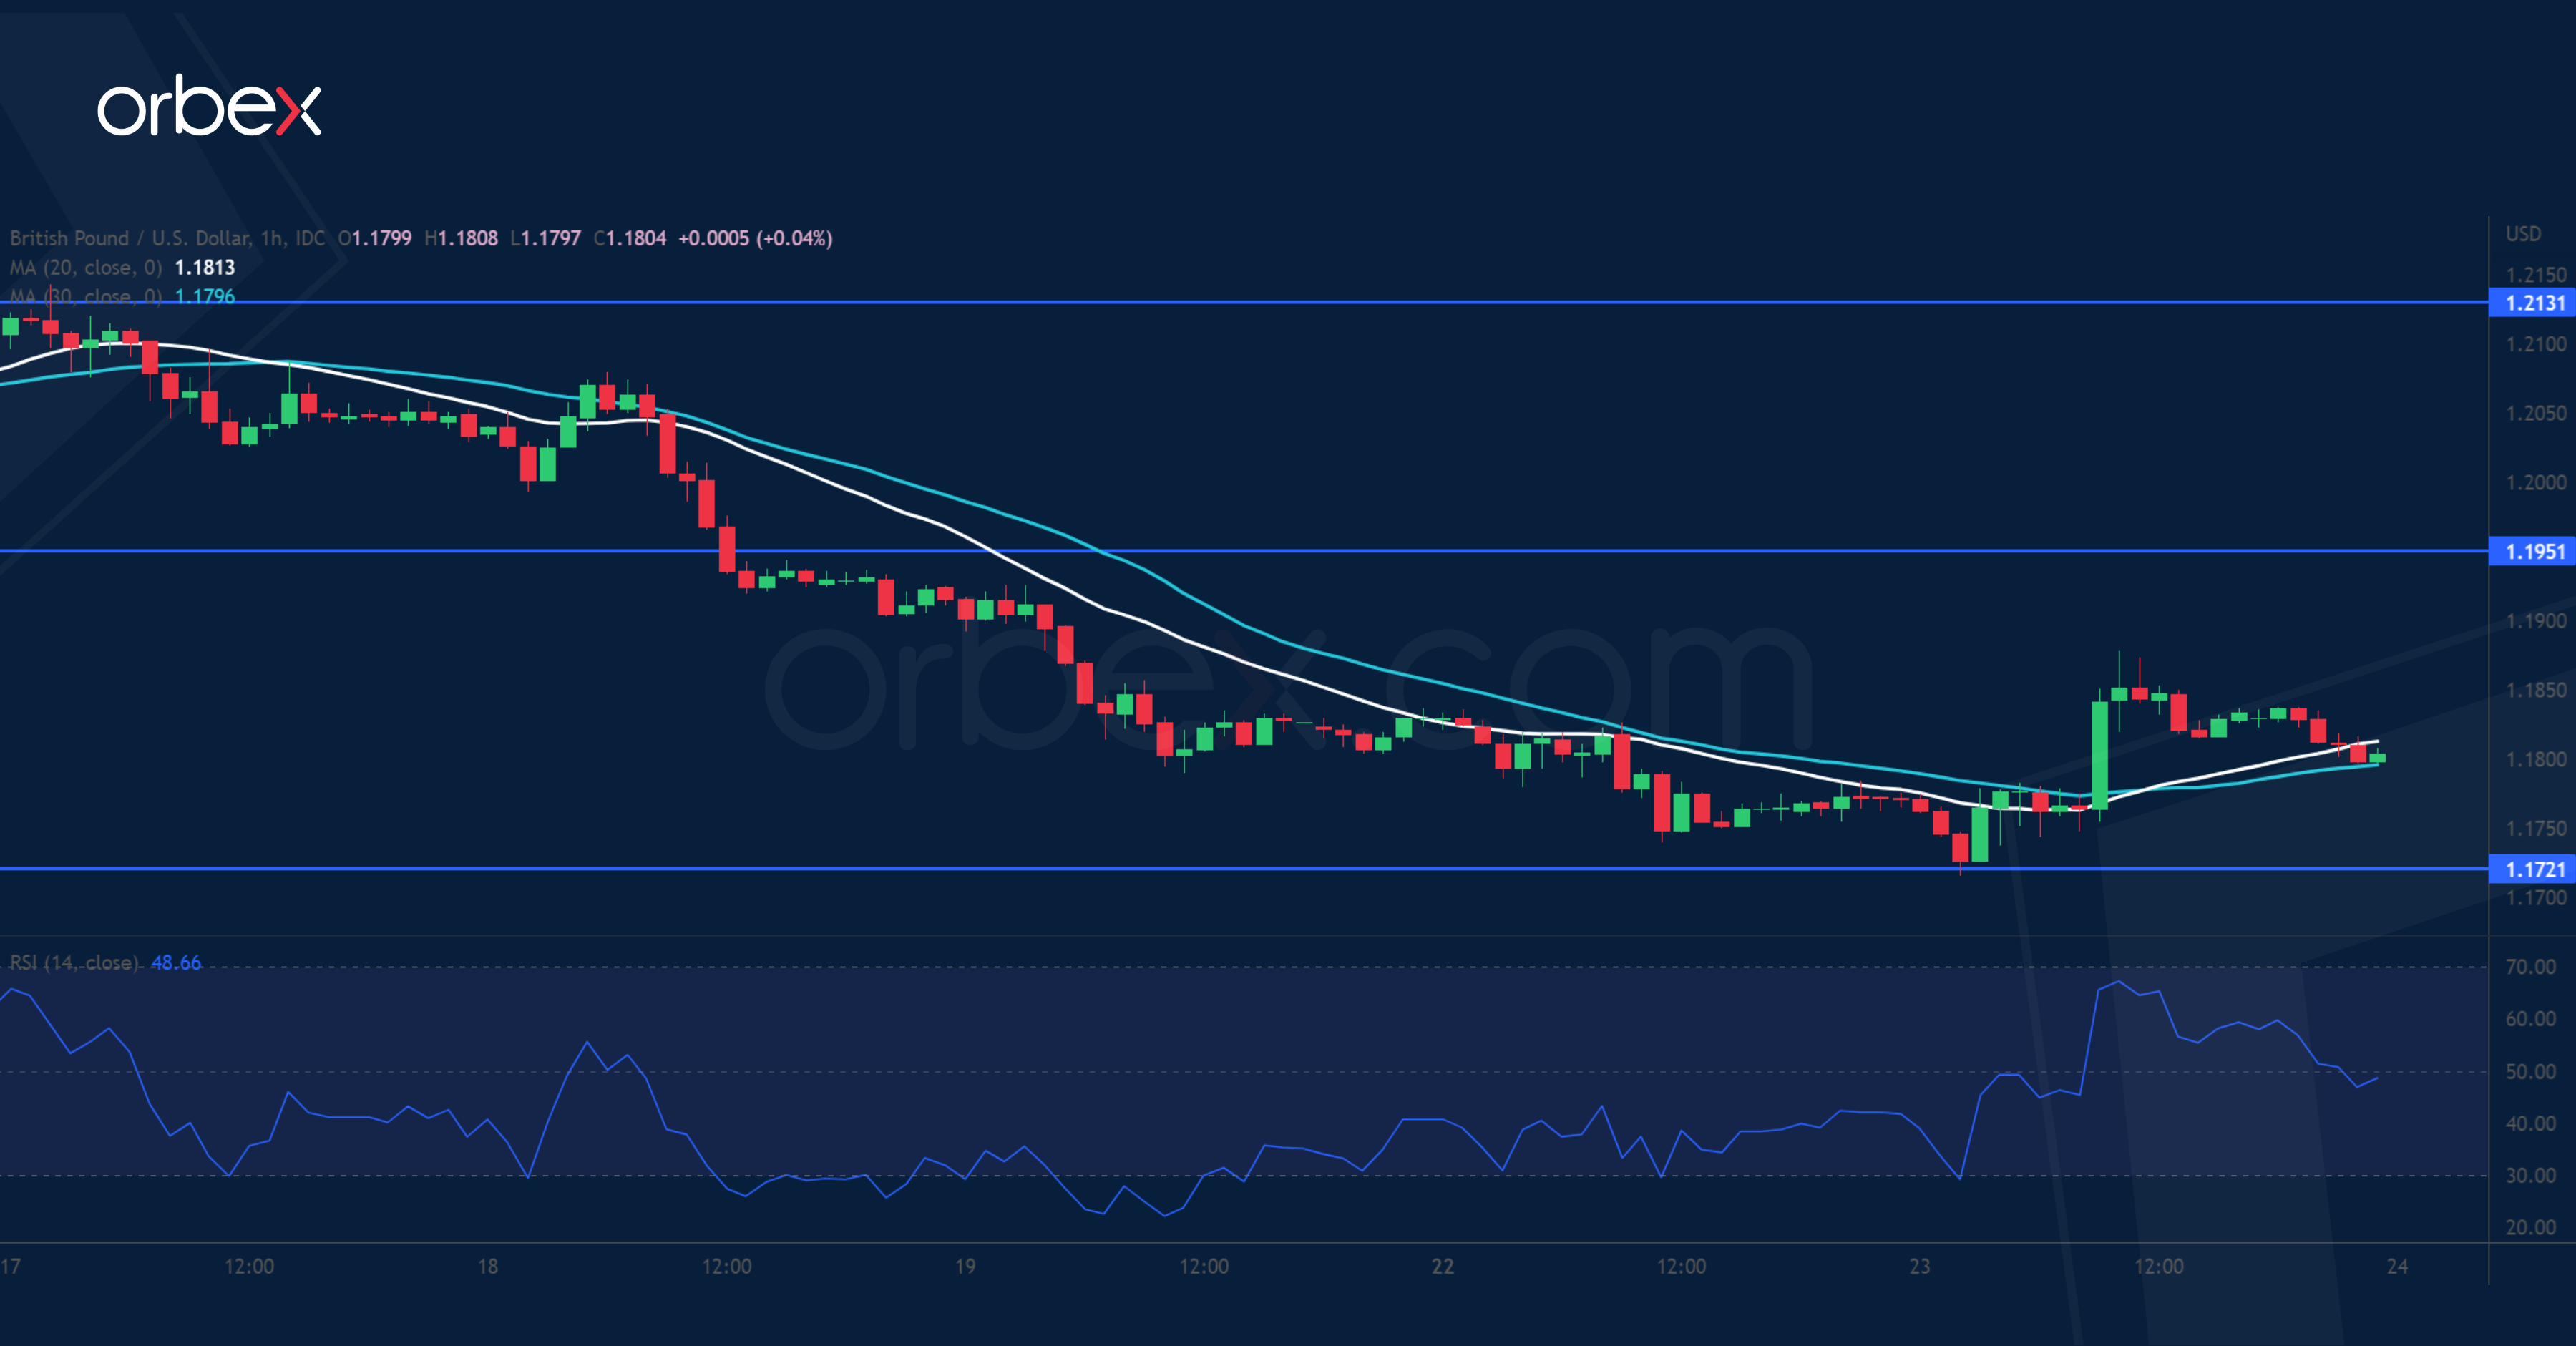
The pound bounces over upbeat services PMI. The pair had previously failed to clear the supply zone (1.2300) on the daily chart. The bears’ latest push below 1.1770 has invalidated the mid-July rebound. This is a confirmation that the downtrend could resume in the weeks to come, and the price action might be heading towards March 2020’s lows around 1.1400. 1.1720 is intermediate support in case of a brief consolidation. Stiff selling pressure could be expected at the support-turned-resistance at 1.1950.
EUR/USD Sees Limited Bounce
The US dollar retreated after PMI data showed a slowdown in business activity. However, the euro’s fall below parity and July’s low indicates that sellers are in control. As last month’s rally turned out to be a dead cat bounce, the path of least resistance would be down. After the RSI sank into oversold territory, 0.9900 from December 2002 saw some bargain hunting. Though the former demand zone around 1.0040 could be a tough level to crack. Renewed selling would send the single currency towards 0.9700.
Daily Technical Analysis
EUR/USD
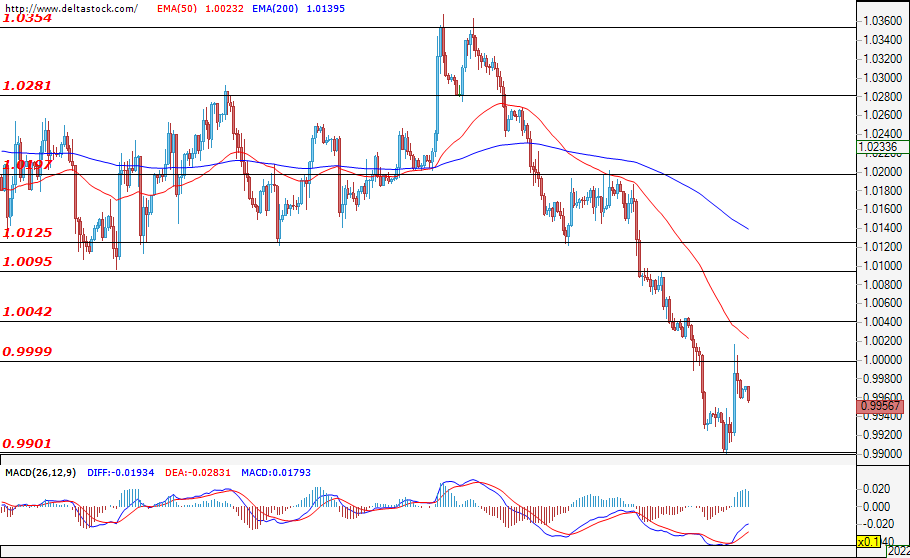
After successfully breaching the parity level at 1.0000, the euro continued to lose ground against the dollar, reaching the support at 0.9900. Apparently, during yesterday’s trading session, the pair managed to rebound from the mentioned support and recovered approx. 100 pips from its losses. Afterwards, the bulls made an unsuccessful attack on the critical resistance at 1.0000 and trading remained slightly below this critical zone. This impulsive upward move was a good opportunity for the sellers to take short positions at better entry levels in this falling market. The downtrend is expected to continue, but only a confirmed breach of the support at 0.9900 would strengthen the negative expectations for a further depreciation of the euro against the U.S. dollar. This scenario could also possibly suggest a stronger bearish presence that may head the price towards the bottom at 0.9800. Despite the positive sentiments for an appreciation of the dollar, a slight correction may develop and the pair may enter a consolidation phase in the range of 0.9900 – 1.0000. Market participants are not likely to aggressively take positions аs fake breakouts of the range are highly possible in these uncertain conditions. The support at 0.9900 may be considered as a good opportunity for the buyers to take short-term positions and wait for the pair to consolidate in the range of 0.9900 – 1.0000, gaining profits at the middle of this range. However, limiting losses closely below the support at 0.9900 via stop orders is highly recommended in case such positions are taken.
USD/JPY
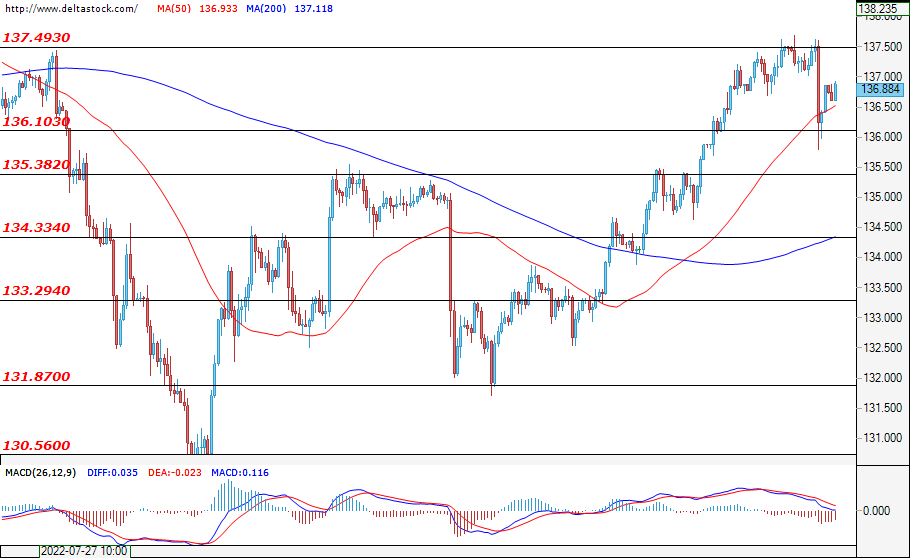
Since the beginning of the trading week, the bulls struggled to overcome the resistance at 137.50, but their attempts were unsuccessful and yesterday we witnessed an impulsive downward movement and a test of the support at 136.10. However, the mentioned support zone resisted the bears’ pressure and the pair is currently locked in the range of 136.10 – 137.50. Only a breach of either border of the range, however, would allow investors to decide on which positions to take next. If the resistance at 137.50 is breached, then we may witness a continuation of the uptrend towards the next support level lying at 138.00. In the opposite direction, if the bears manage to violate the support at 136.10, then the correction would continue downward towards the next one at 135.38.
GBP/USD
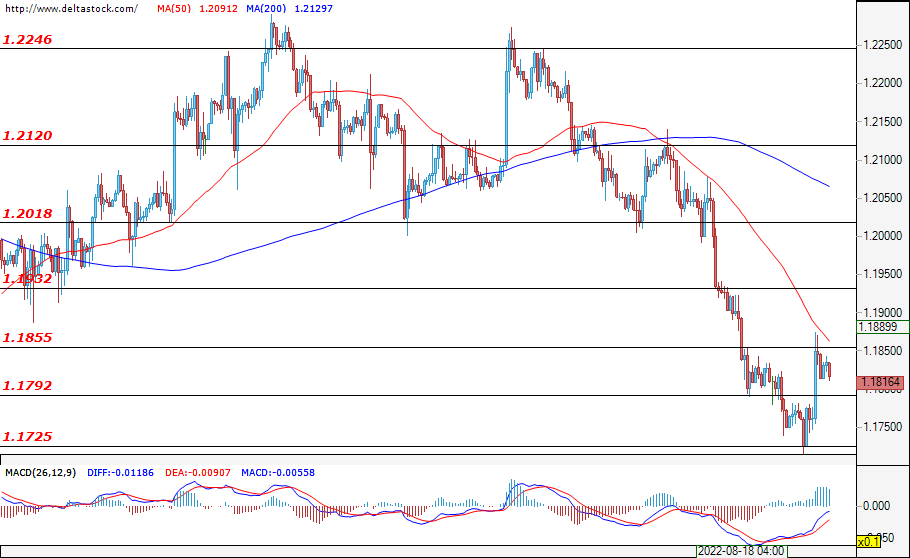
During the previous trading session, we witnessed an impulsive corrective move towards the resistance at 1.1855, but this level managed to resist the bulls’ attack and the pair is currently holding just below this level. The expectations are for the downtrend to continue and it is highly likely that the bears could make another attempt to overcome the support at 1.1725. A successful breach of this level may suggest a resumption of the downtrend, with the next target for the sellers being the psychological level at 1.1700. A consolidation in the range of 1.1725 – 1.1855 may be considered a highly possible scenario for today's trading session. On the other hand, a successful breach of the resistance at 1.1855 may lead to a deeper correction, which could pave the way for the pair towards the next critical resistance at 1.1932.
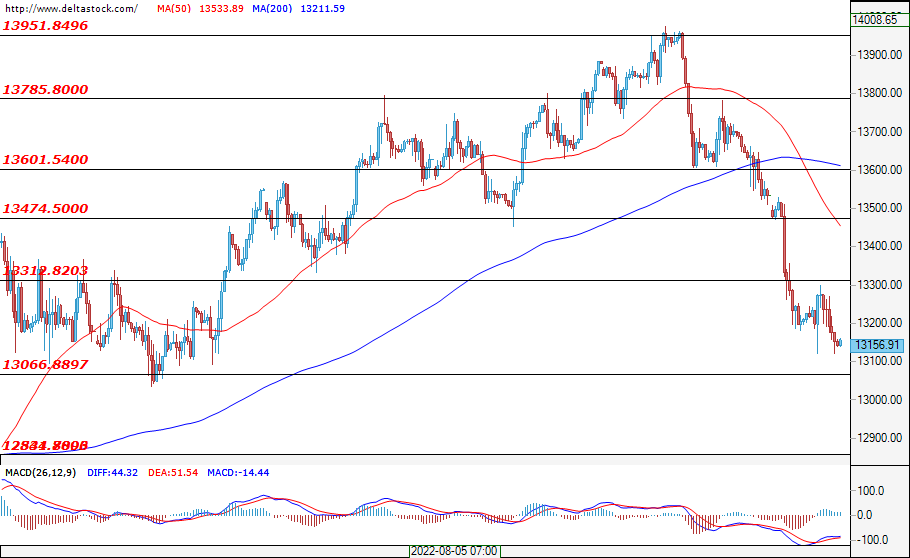
EUGERMANY40
The sell-off for the German index has been going on since last week, and in the early hours of today's trading session, the depreciation is still in full swing. A successful breach of the support area at 13066 would encourage the bears and help them lead the price towards the next significant support at 12844. A deepening of the sell-off is not excluded as a consequence of the persistent negative expectations of investors. A successful breach of the mentioned support, followed by the strong sell-offs, may both result in a consolidation in the range of 12844 – 13066. On the other hand, if the price reached the resistance at 13312, then this may be considered as an opportunity for the bears to enter the market at better levels, but a violation of the mentioned level would easily pave the way for the bulls towards the resistance at 13474.
US30
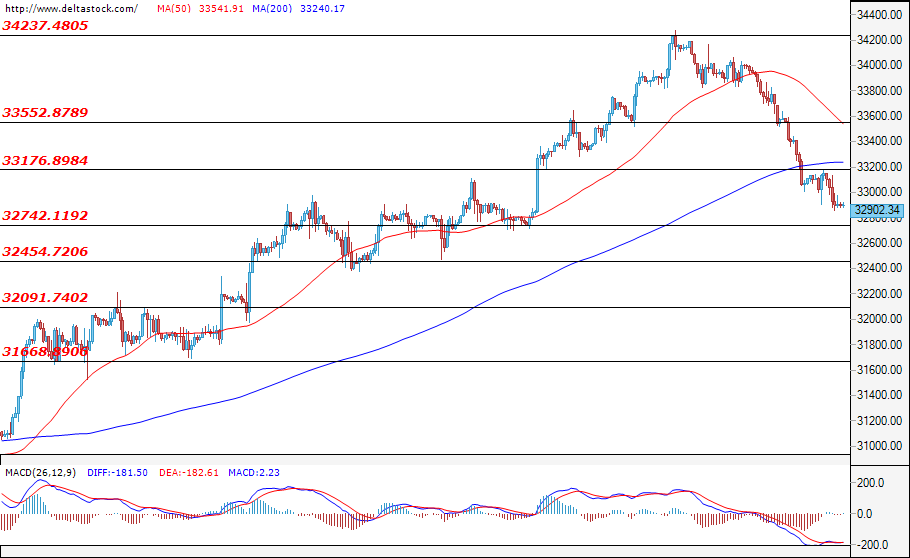
The U.S. blue-chip stock index continued to fall, resulting in a short-lived correction towards the resistance at 33176, but the price quickly rebounded from it. The index is currently headed towards the support at 32742 and a breach of this level would give the bears additional confidence to head the US30 towards the next significant support at 32454. However, if the bulls re-enter the market and successfully limit the sell-offs above the support at 32742, then it is highly possible to see a deepening of the correction that may lead the price in a positive direction. If this becomes the case and the bulls manage to overcome the resistance zone at 33176, then this could lead to a further appreciation and a test of the resistance at 33552. The sentiment at the moment remains rather negative, thus any possible correction would be considered as an opportunity for better entry levels for the sellers. In terms of economic events, market participants are currently looking forward to Fed Chair Jerome Powell's speech, as well as the Jackson Hole Symposium, both scheduled for Friday at 14:00 GMT.