Sample Category Title
Will Jackson Hole Strengthen the Dollar?
As is often the case, markets find themselves at important turning points ahead of significant scheduled events. One of the latter is the Monetary Policy Symposium in Jackson Hole, which starts later this week. This resort’s signs could break the Dollar’s rise or accelerate it by removing the final obstacle.
In FX, the Dollar index made a 20-year high above 109.2 earlier in the week and then we saw some profit-taking activity, which caused the Dollar to slide around 1% against a basket of major peers.
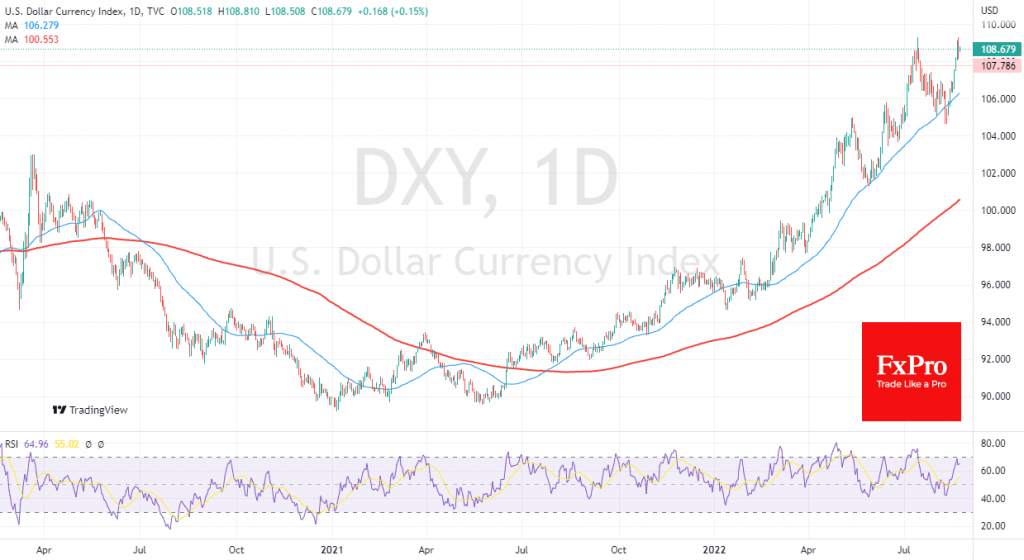
How the Dollar will close this week likely determines the dynamics for the next few months.
Fed officials have spent the last couple of weeks actively managing expectations, indicating that the central bank has a more hawkish approach to policy, denying the problems in the economy that investors so fear. Traders in the markets are speculating whether this means the risk of a third consecutive rate hike of 75 points in September.
In our view, the higher odds are that the Fed is leading exactly to that scenario and Powell’s comments will proclaim the ultimate victory of that scenario. The hawks have a strong labour market and the need to anchor inflation expectations on their side.
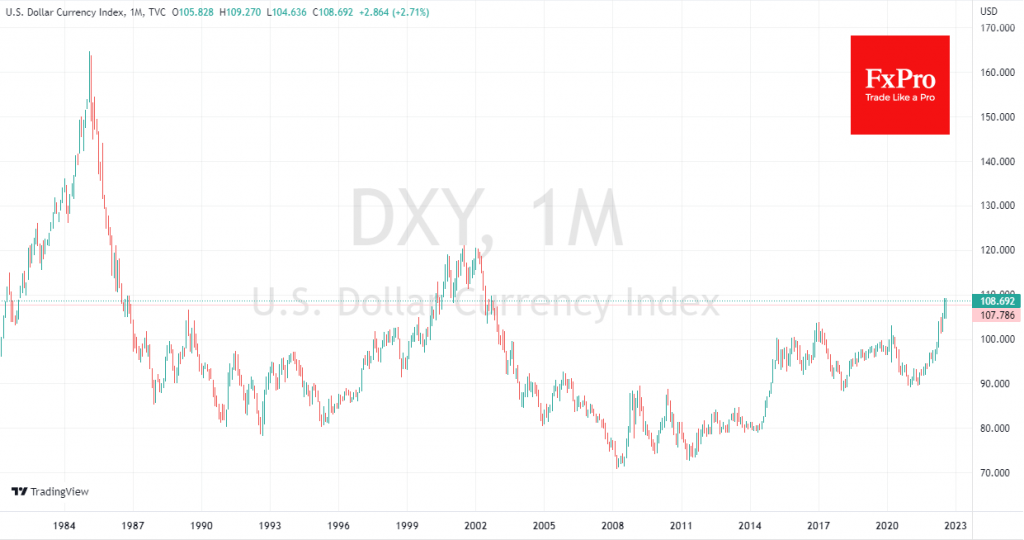
In this scenario, the dollar index is moving towards 120 (+10.5% to the current price), which is at its 2001-2002 highs. It is likely that on the approach to these levels, even the hawkish Fed and Treasury are concerned about a strong dollar. After all, along with lower inflation and faith in the main reserve currency, the world will get “side effects” in the form of extreme financial market volatility and a sharp slowdown of the global economy, which is also not in the interests of the USA.
An alternative scenario is that Powell has probably learned his lesson from 2018 and is now paying more attention to signals from the market. Back then, four years ago, he was pushing the idea of further rate hikes, which scared the markets. The S&P500 then fell almost 20% from its peak, touching its 200-week average at one point. Near those levels, Powell got softer, and just over six months later, he cut rates altogether.
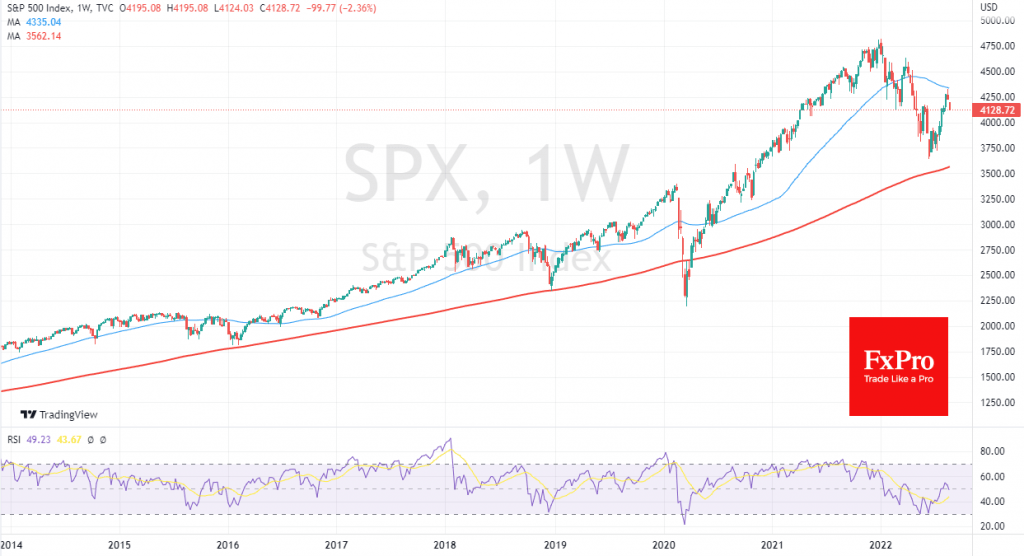
If Powell and Co. have concluded this story, they will pay more attention to market sentiment. In that case, the markets will hear another batch of vague promises, leaving all doors open for the committee on the next monetary policy steps.
Confirmation that the Fed is easing its pressure on the markets will form a double top in the DXY and reverse towards 103.7 – the 2020 peak. However, we cannot rule out that this will be the start of a longer and deeper dollar pullback.
USDJPY Pulls Below July’s Bar But Not Bearish Yet
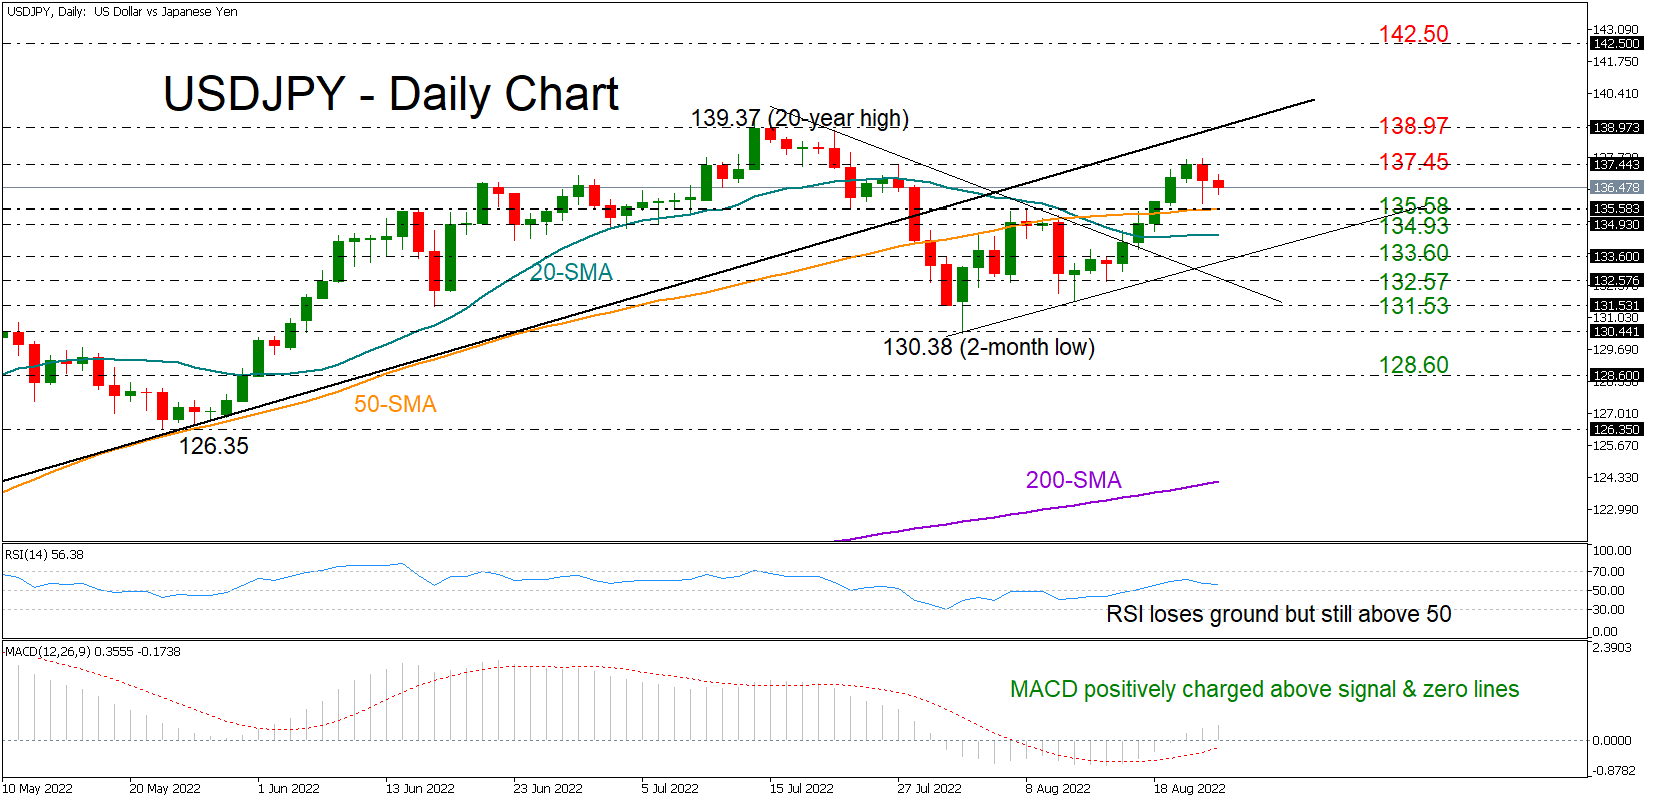
USDJPY turned red on Tuesday after its five-day bullish rally stalled near July’s resistance of 137.45, but the bears will probably need to work harder to stay in power.
Although the negative intersection between the 20- and 50-day simple moving averages (SMAs) keeps promoting a trend deterioration, the price is still trading above those lines. Meanwhile, the RSI and the MACD remain elevated within the bullish area despite softening a bit lately; the former comfortably above its 50 neutral mark and the latter positively charged above its red signal and zero lines.
A decisive extension below the 135.58 – 134.93 constraining zone, which encapsulates the 50-day SMA too, could raise negative risks, likely pressing the price towards the tentative short-term support trendline seen around 133.60. Moving lower, the broken resistance trendline drawn from July’s highs may next come on the radar at 132.57. If it proves fragile, the bears may attempt to attack the neutral short-term outlook below the 131.53 – 130.38 base.
Alternatively, buyers may try to push above the 137.45 bar once again and breach the 138.97 – 139.37 ceiling, where the ascending line from March lows is located. If they succeed, the uptrend may stretch towards the 142.50 restrictive territory last active during summer 1998. Beyond that, all attention will shift to the 1998 top of 144.38 – 147.71.
In brief, USDJPY may have another opportunity to resume its bullish momentum, but for that to happen the 135.58 – 134.90 area will need to add a strong footing under the price.
Pound Under Pressure, US Durable Goods Looms
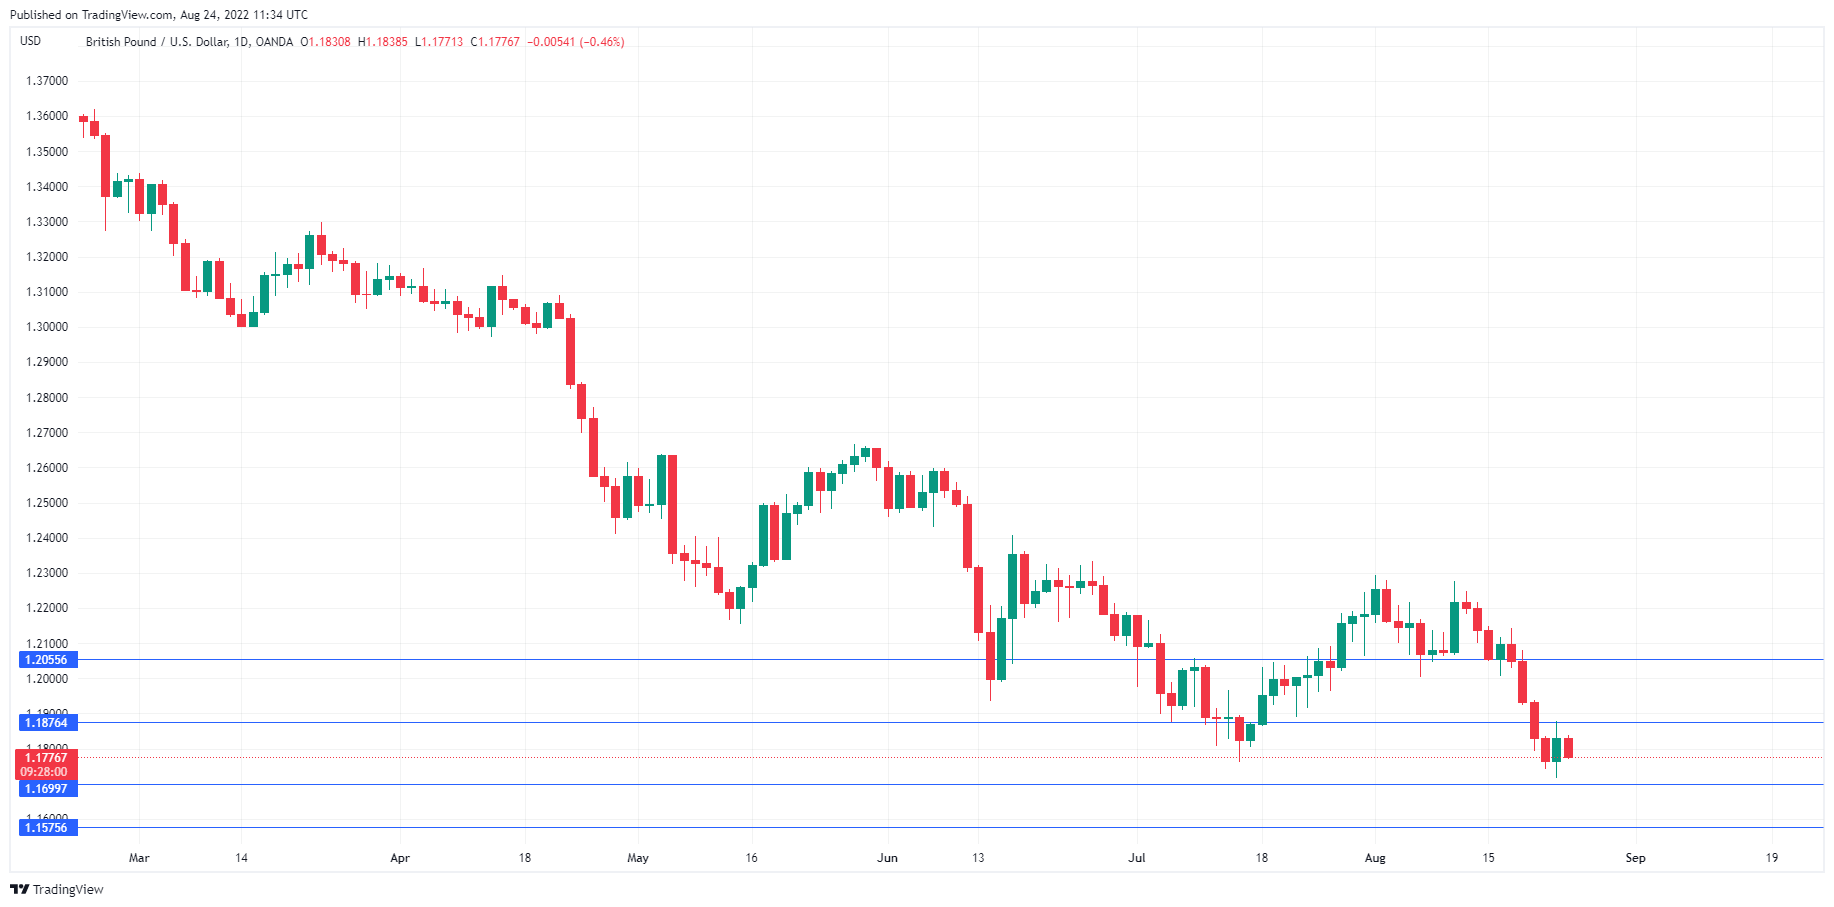
The British pound has reversed directions today and is in negative territory. In the European session, GBP/USD is trading at 1.1778, down 0.44%.
Weak US New Home Sales sends pound higher
Tuesday was an interesting day for the pound. Despite weak manufacturing data out of the UK, GBP/USD gained close to 1% before paring some of these gains. The reason for the pound’s spike came from across the pond, as US New Home Sales for July was much weaker than expected, with a reading of 511 thousand. This was below the estimate of 575 thousand and the June reading of 585 thousand.
The pound promptly jumped after this housing release, as soft data raised market hopes that the Federal Reserve would ease up on interest rates due to a cooling economy. We could see the pound react to upcoming key US releases – Durable Goods Orders today and Preliminary GDP on Thursday. If these readings are weaker than expected, I would not be surprised to see the pound gain ground.
The UK Manufacturing PMI slid into contraction territory in August. The index fell to 46.0, down from 52.1 in July and below the estimate of 51.1. The dismal reading is part of a pan-European downward trend in manufacturing, which has been made worse by the prolonged war in Ukraine. Output has been hampered by higher costs, a drop in demand and supply chain problems.
The week wraps up with Fed Chair Powell addressing the Jackson Hole Symposium. The Fed has been hammering out a hawkish message, saying it plans to continue raising rates, as the titanic battle against inflation is far from over. The markets haven’t listened all that carefully, ever since the drop in US inflation raised speculation that the Fed might make a U-turn and ease up on policy. It will be interesting to see how the markets react to what is expected to be a hawkish message from Powell.
GBP/USD Technical
- GBP/USD faces resistance at 1.1924 and 1.2005
- There is support at 1.1699 and 1.1568
XAU/USD: Larger Bears on Hold, Awaiting Stronger Signals from Jackson Hole Meeting
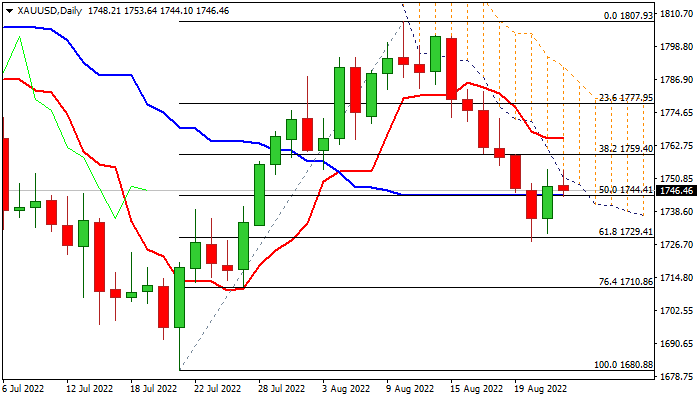
Spot gold price edges higher from new low at $1727 (the lowest since July 27) after disappointing US data on Tuesday temporarily deflated dollar, giving gold bears an opportunity to consolidate.
Tuesday’s bullish daily close (the first in seven days) completed bullish engulfing pattern on daily chart generating initial bullish signal, but fresh bulls so far lack strength for stronger recovery and remain capped by the base of falling thick daily Ichimoku cloud.
This keeps short-term bearish structure (bear-leg from Aug 10) intact for now, with daily MA’s in bearish setup and rising negative momentum, adding to scenario of limited correction ahead of fresh push lower.
However, markets slowed the pace ahead of highly anticipated Jackson Hole symposium on Friday.
All eyes are on Fed Chair Jerome Powell, whose comments are expected to define near-term direction of the US dollar that will directly influence the performance of the yellow metal.
Powell has not much space to move in the situation when soaring inflation hurts and the central bank has already acted aggressively in tightening its monetary policy, in fight with surging consumer prices.
Powell may opt to remain on strongly hawkish path and decide to raise rates for another 75 basis points that would help in curbing inflation but will have negative impact on growth, in the situation when economy is at the edge of recession.
On the other hand, the Fed chief may announce slower pace of raising interest rates, according to economic conditions that would result in prolonged tightening cycle.
The first scenario is likely to be dollar-supportive that would put gold price under fresh pressure, while less hawkish approach to the monetary policy tightening would prompt investors out of dollar and underpin metal’s price.
Res: 1751; 1756; 1770; 1777.
Sup: 1744; 1733; 1727; 1710.
GBP/USDStarted a Major Decline from $1.2000
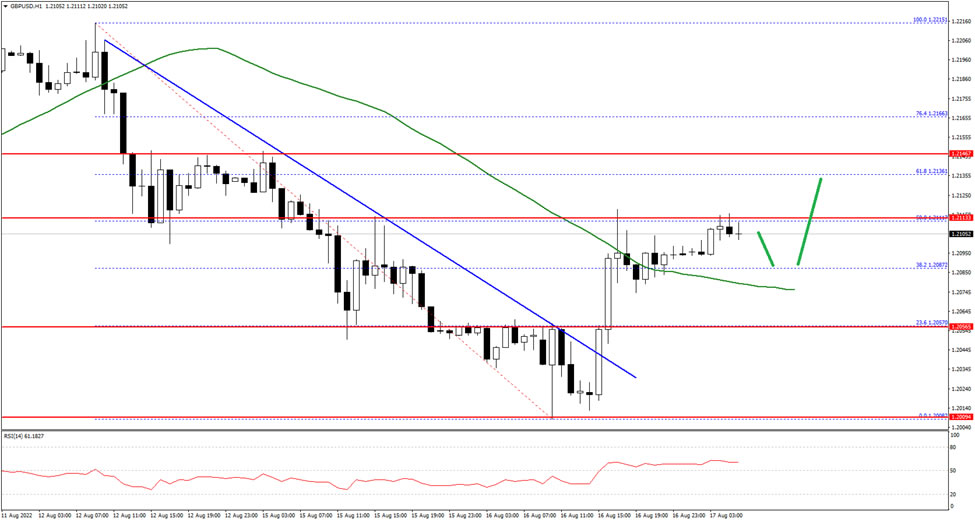
The British Pound started a major decline from the 1.2000 resistance zone against the US Dollar. The GBP/USD pair declined heavily below the 1.1900 and 1.1880 levels.
It traded as low as 1.1717 and recently started an upside correction. The pair climbed above a major bearish trend line with resistance near 1.1770 on the hourly chart. It is now trading above the 1.1800 level and the 50 hourly simple moving average. An immediate resistance is near the 1.1840 level.
The first major resistance sits near the 1.1880 zone. If there is a clear upside break above the 1.1880 resistance, the pair could rise steadily towards the 1.2000 level in the near term.
On the downside, an initial support is near 1.1790 on FXOpen. The main support is forming near the 1.1750 level. A break below the 1.1750 support could even push the pair below the 1.1700 support.
EUR/USD: Bears Taking a Breather But Remain Intact While Action Stays Below Parity
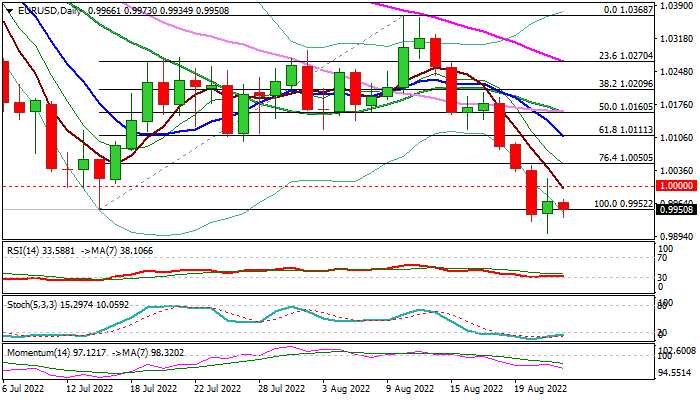
Bears are pausing for the second day but remain in play after hitting new lowest in two decades.
Tuesday’s bullish Doji and oversold conditions on daily chart suggest that the action may hold in a limited consolidation before resuming lower, as technical picture is bearish and heavily weighed by negative fundamentals.
Growing recession fears, fueled by possible energy supply crunch on deteriorating economic and geopolitical outlook, weigh on the single currency which is establishing below parity level against dollar.
Weaker than expected US PMI and housing data on Tuesday temporarily slowed dollar’s rally, giving the euro opportunity to take a breather, with upticks expected to remain below broken parity level, reverted to solid resistance, to keep bears intact and offer better levels to re-join bearish market.
Push through new low at 0.9900 would risk test of Fibo projections at 0.9853 and 0.9793 (123.6% and 138.2% respectively, of the downleg from 1.0368 top of Aug 10).
Only bounce through 1.0100/1.0134 pivots would put bears on hold for stronger correction.
Res: 0.9975; 1.0000; 1.0050; 1.0079
Sup: 0.9934; 0.9900; 0.9853; 0.9793
What Do Central Bankers Mean with Interest Rates at “Neutral Level”?
After a steep rise in interest rates around the world, it's natural to question at what point central banks will stop. This is where bankers start using a technical term: "neutral level". The thing is, what exactly constitutes a "neutral level" is a little more complicated and somewhat deliberately vague. And that can be a bit of a challenge for traders trying to position themselves.
The big deal with interest rates reaching a neutral level is that the entire market dynamics would shift. Right now, particularly currencies, are being driven by expectations around interest rates and inflation. That is particularly true of the EURUSD and GBPUSD, as the "real spread" (the differential in interest rates considering inflation) is one of the main explanations for dollar strength.
Finding neutral
The basic concept of "neutral level" for interest rates is fairly straight-forward. It's when we try to interpret that in the context of policy that things get a bit complicated. So, the general notion is that there is a certain interest rate where the influence from the central bank is "balanced". That is, interest rates aren't too low (which leads to higher inflation), nor too high (which hurts the economy).
The issue is that "too low" and "too high" are somewhat subjective and is changes all the time. So, while central bankers like to talk about achieving a "neutral level", they are typically very reluctant to say what that level is. 2.0%? 3.0%? 15%? "Well, we'll have to look at the data."
Applying it to trading
The problem for traders is that the value of currencies, especially now, are dependent on how much more rates are going to be increased. Take the Euro, for example. The current interest rate is 0%. If the ECB thinks that a "neutral rate" is around 2.0%, that means they will hike rates four times (or less, if by larger amounts) in the very near future. But if they think the neutral rate is 3.0%, then they will have to raise rates six times. And will be more likely to raise by 50 or even 75bps at a time. Obviously, that radically impacts the behavior of Euro pairs.
So, trying to figure out where central bankers think the neutral rate is helps with figuring out how markets will behave, and in turn how to position our trades. But typically, central bankers give more vague guidelines, like "still far from neutral", or "getting close to neutral", or "likely to reach neutral in the short term."
Putting some empiricism behind it
Central bankers are reluctant to give out a precise number, because that becomes a more concrete prediction. It's easier to keep raising rates, for example, if you said, "we're near neutral" at 1.50%; than saying, "neutral is at 2.0%" and then needing to raise rates to 2.25 or 2.50%.
The bottom line, however, is that the definition still determines the rate. Central bankers might have opinions on where the neutral rate should be, but all those opinions will converge as the data shows that inflation is starting to line up with the target and the economy is still growing. Or the opinions will start to diverge if the economy suffers, or inflation keeps increasing.
While it's worth speculating, unless inflation has a couple of months of concrete reduction, talking about the "neutral" rate is pretty much an academic exercise. But it's likely something central bankers will increasingly talk about as the time for slowing down or outright stopping rate hikes comes around.
Jackson Hole Clues to Direct Market Moves
Markets have clearly been anxious in the lead up to Jackson Hole, as investors and traders await the next policy clues out of Fed Chair Powell later this week.
The declines in equities and bonds of late suggest that Powell will strike a hawkish tone to fight rampant inflation, at the expense of economic growth. If Powell’s commentary forces markets to further price in more supersized Fed rate hikes, that might trigger more declines for equities and gold, while king dollar would continue to exert its dominance across the FX universe.
If Powell appears more dovish than envisaged, perhaps adopting a more cautious tone over the US economic outlook, that could reassert the narrative that the Fed will back off from larger rate hikes and potentially allow risk assets to resume their summer rally.
GBP/JPY Daily Outlook
Daily Pivots: (S1) 160.98; (P) 161.64; (R1) 162.47; More...
GBP/JPY is still extending the consolidation pattern from 168.67 and intraday bias remains neutral. On the upside, break of 163.91 will bring stronger rise to 166.31 resistance. On the downside, below 160.07 will turn bias to the downside for 159.42 and below.
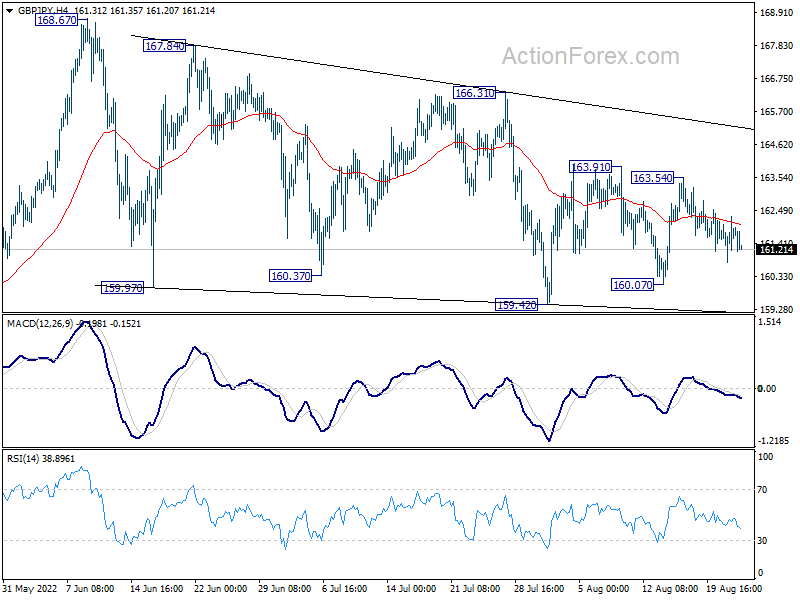
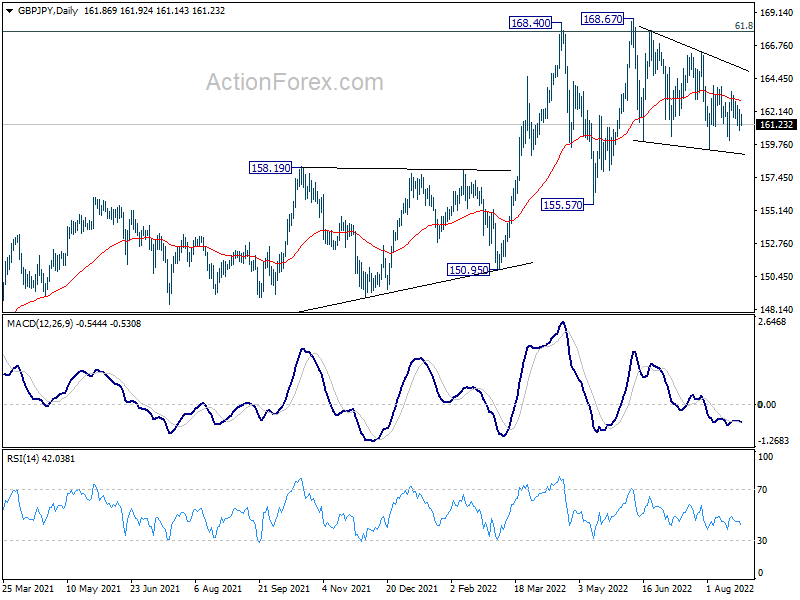
In the bigger picture, up trend from 123.94 (2020 low) is still in progress. Sustained break of 61.8% retracement of 195.86 (2015 high) to 122.75 (2016 low) at 167.93 will be a long term bullish signal, and could pave the way back to 195.86 high. This will remain the favored case as long as 155.57 support holds, even in case of deep pull back.
EUR/JPY Daily Outlook
Daily Pivots: (S1) 135.68; (P) 136.37; (R1) 137.00; More....
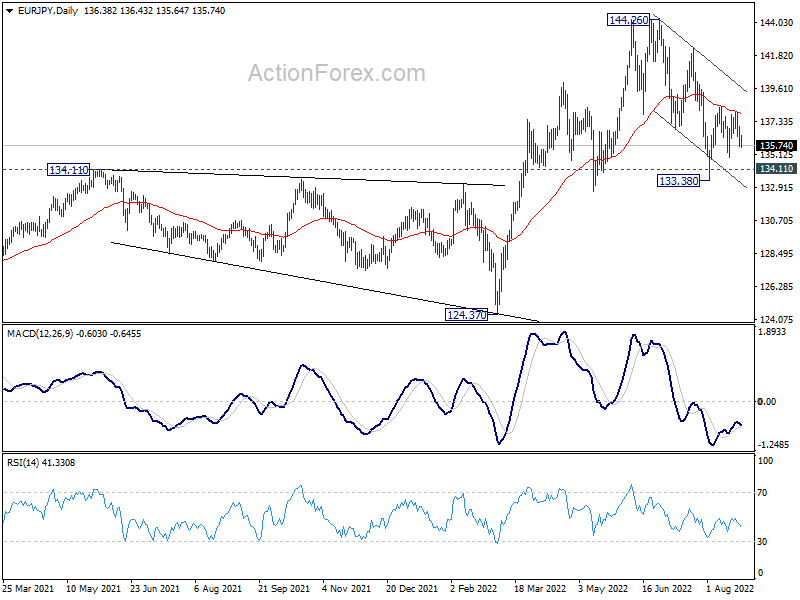
Intraday bias in EUR/JPY stays neutral at this point. On the upside, break of 138.38 resistance will resume the rebound from 133.38 towards 142.31 resistance. On the downside, break of 134.93 will turn bias back to the downside for 133.38 support. Overall, corrective pattern from 144.26 could extend further with more choppy trading.
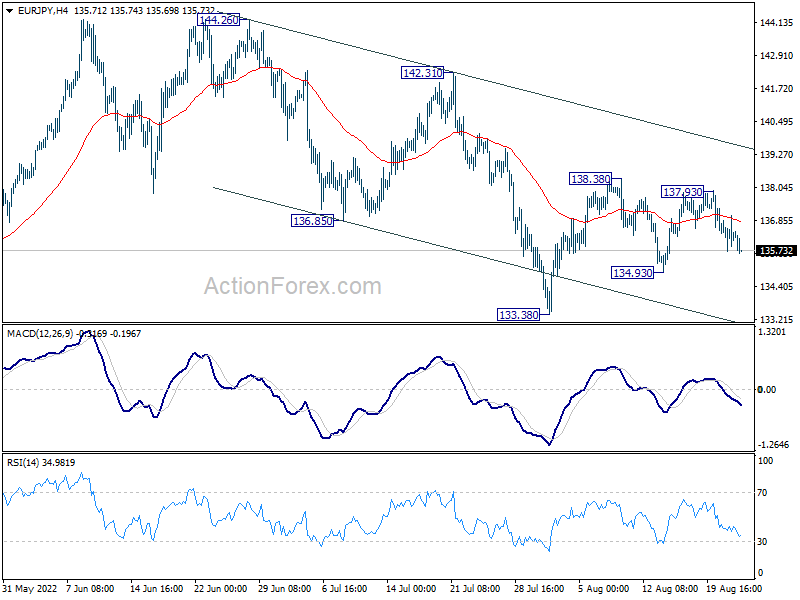
In the bigger picture, up trend from 114.42 (2020 low) is seen as the third leg of the pattern from 109.30 (2016 low). Further rally is in favor as long as 134.11 resistance turned support holds, even in case of deep pull back. Next target is 149.76 (2015 high). However, sustained break of 134.11 will be a sign of medium term bearish reversal and turn focus to 124.37 support for confirmation.