Sample Category Title
EUR/GBP Daily Outlook
Daily Pivots: (S1) 0.8409; (P) 0.8431; (R1) 0.8447; More...
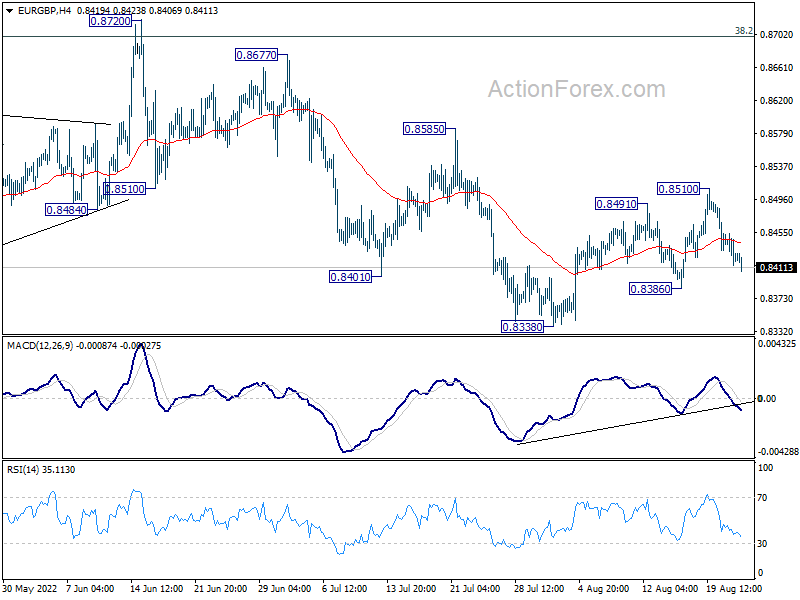
Intraday bias in EUR/GBP stays neutral for the moment. On the downside, break of 0.8386 minor support will resume the choppy fall from 0.8720 through 0.8338. On the upside, above 0.8510 will resume the rebound to 0.8585 resistance next.
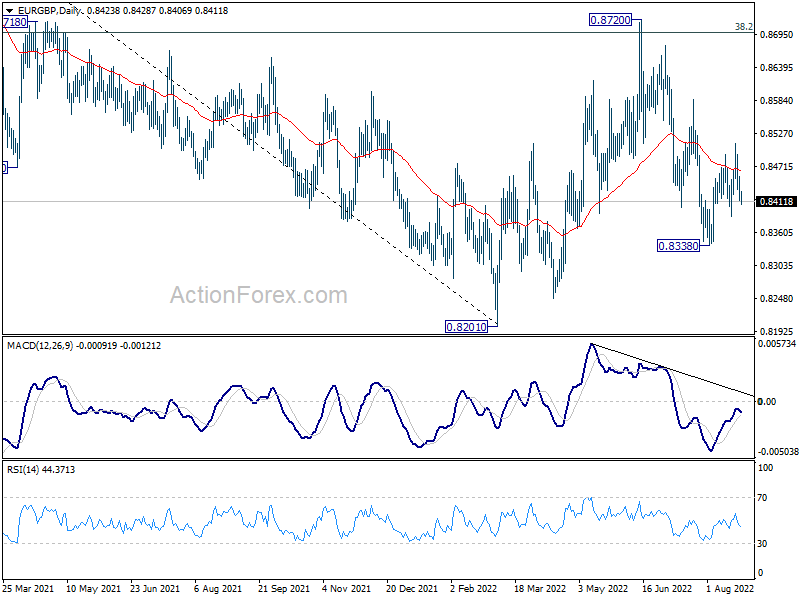
In the bigger picture, medium term bearishness is maintained with prior rejection by 38.2% retracement of 0.9499 to 0.8201 at 0.8697. Break of 0.8201 will resume larger down trend from 0.9499 (2020 high). Nevertheless, sustained break of 0.8697 will affirm the case that rise from 0.8201 is a medium term up trend itself.
EUR/AUD Daily Outlook
Daily Pivots: (S1) 1.4342; (P) 1.4406; (R1) 1.4451; More...
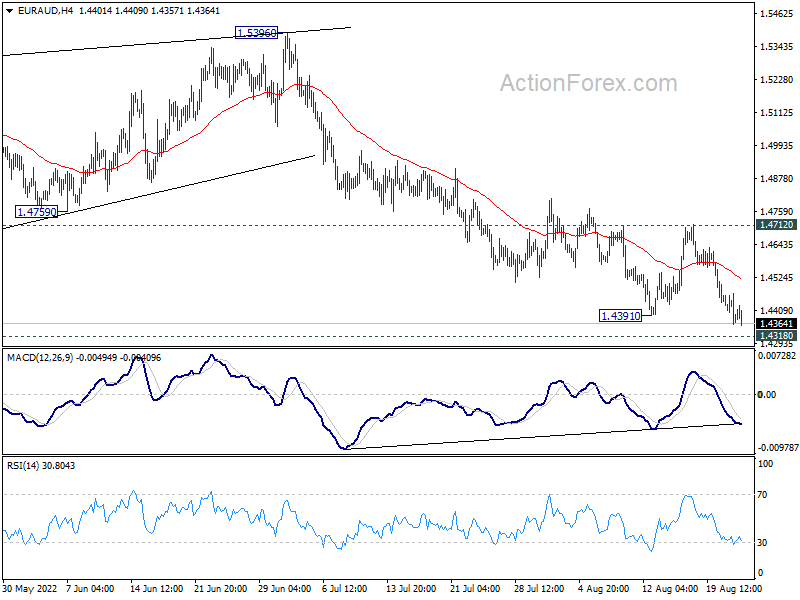
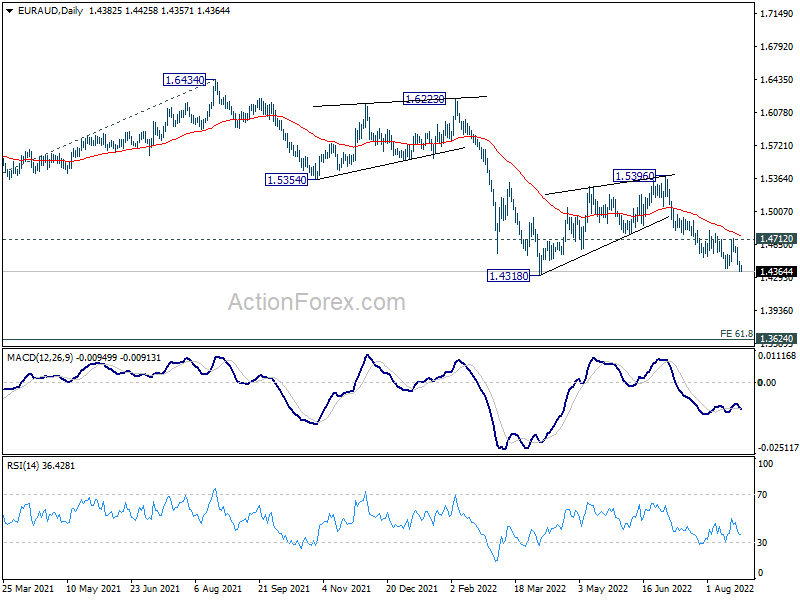
Intraday bias in EUR/AUD is back on the downside with break of 1.4391. Decisive break of 1.4318 low will resume larger down trend to medium term projection level at 1.3623. On the upside, break of 1.4712 resistance will delay the bearish case and turn bias to the upside for stronger rebound first.
In the bigger picture, down trend from 1.9799 is still in progress. Break of 1.4318 low will target 61.8% projection of 1.9799 to 1.5250 from 1.6434 at 1.3623, which is close to 1.3624 long term support (2017 low). This will remain the favored case now as long as 1.5396 resistance holds.
EUR/CHF Daily Outlook
Daily Pivots: (S1) 0.9562; (P) 0.9601; (R1) 0.9650; More....
Further decline is expected in EUR/CHF with 0.9698 resistance intact. Current down trend should now target 100% projection of 1.1149 to 0.9970 from 1.0513 at 0.9334. On the upside, break of 0.9698 resistance will indicate short term bottoming, and turn bias back to the upside for stronger rebound.

In the bigger picture, long term down trend from 1.2004 (2018 high) is still in progress. Next target is 138.2% projection of 1.2004 to 1.0505 to 1.1149 at 0.9033. On the upside, break of 0.9970 support turned resistance is needed to be the first sign of medium term bottoming. Otherwise, outlook will stay bearish in case of strong rebound.

USD/CAD Daily Outlook
Daily Pivots: (S1) 1.2907; (P) 1.2985; (R1) 1.3036; More...
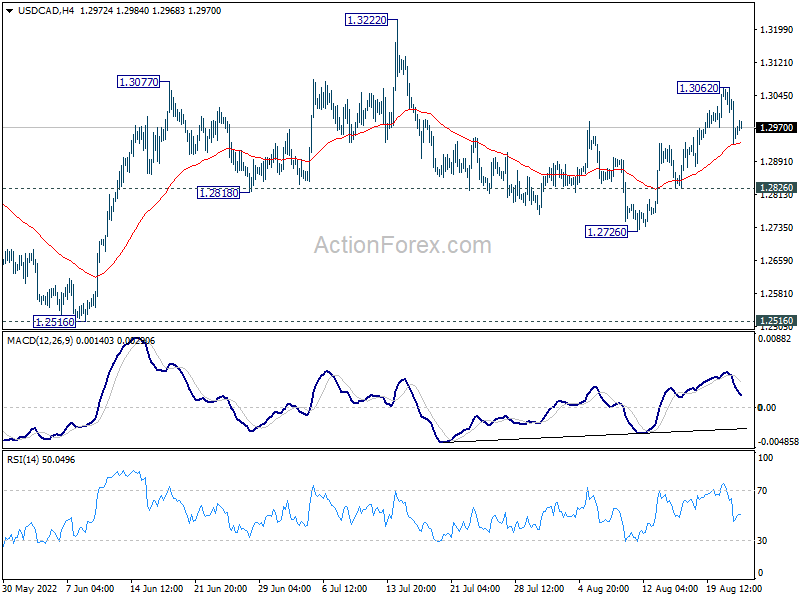
Intraday bias in USD/CAD is turned neutral with current retreat. Corrective decline from 1.3222 could have completed with three waves down to 1.2726. Above 1.3062 will resume the rebound to retest 1.3222 high. However, break of 1.2826 support will dampen this view and turn bias back to the downside for 1.2726 and possibly below.
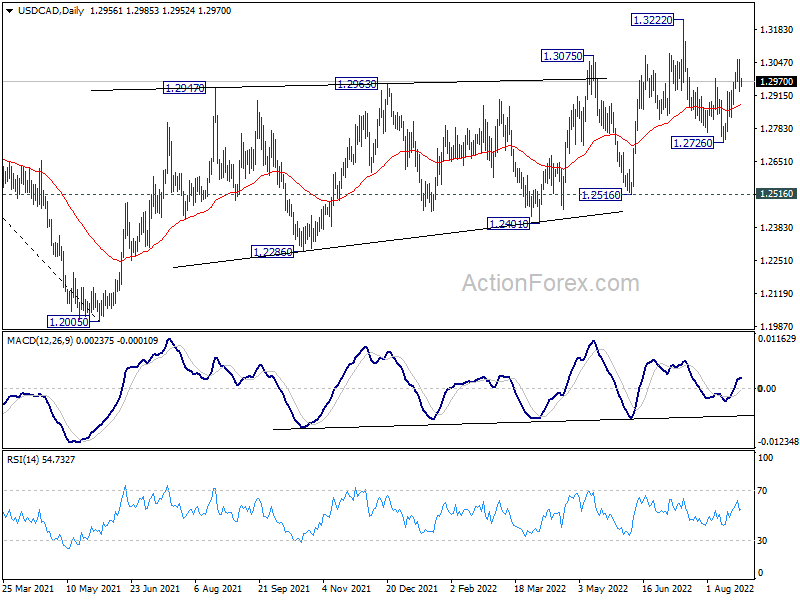
In the bigger picture, down trend from 1.4667 (2020 high) should have completed at 1.2005, after defending 1.2061 long term cluster support. Rise from there should target 61.8% retracement of 1.4667 to 1.2005 (2021 low) at 1.3650. This will remain the favored case now as long as 1.2516 support holds.
AUD/USD Daily Report
Daily Pivots: (S1) 0.6869; (P) 0.6916; (R1) 0.6976; More...
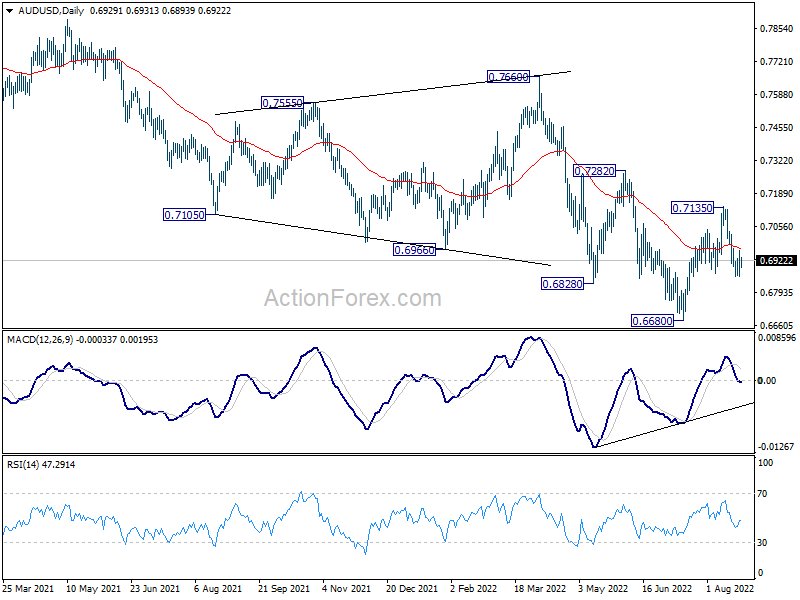
Intraday bias in AUD/USD is turned neutral with current recovery. Corrective rebound from 0.6680 could have completed with three waves up to 0.7135. Below 0.6855 will target a retest on 0.6680 low. However, break of 0.7135 will invalidate this view and resume the rebound from 0.6680 instead.
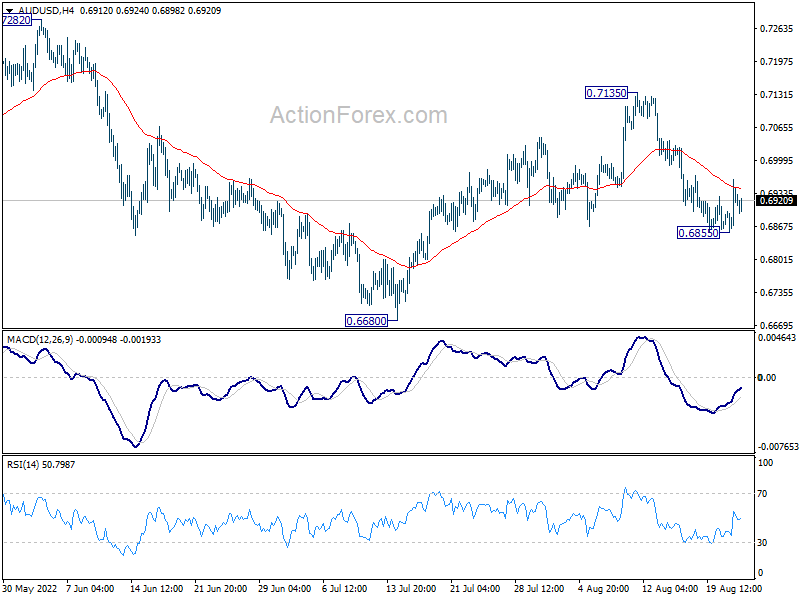
In the bigger picture, price actions from 0.8006 (2021 high) is seen more as a corrective pattern to rise from 0.5506 (2020 low). Or it could also be a bearish impulsive move. In either case, outlook will remain bearish as long as 0.7282 resistance holds. Next target is 61.8% retracement of 0.5506 to 0.8006 at 0.6461.
USD/JPY Daily Outlook
Daily Pivots: (S1) 135.80; (P) 136.76; (R1) 137.70; More...
Intraday bias in USD/JPY is turned neutral with current retreat. Overall, price actions from 139.37 are seen as a corrective pattern, with rise from 130.38 has the second leg. Above 137.70 will extend the rebound but upside should be limited by 139.37. On the downside, firm break of 135.57 will suggest that the third leg of the pattern has started, and turn intraday bias back to the downside for 131.72 support first.
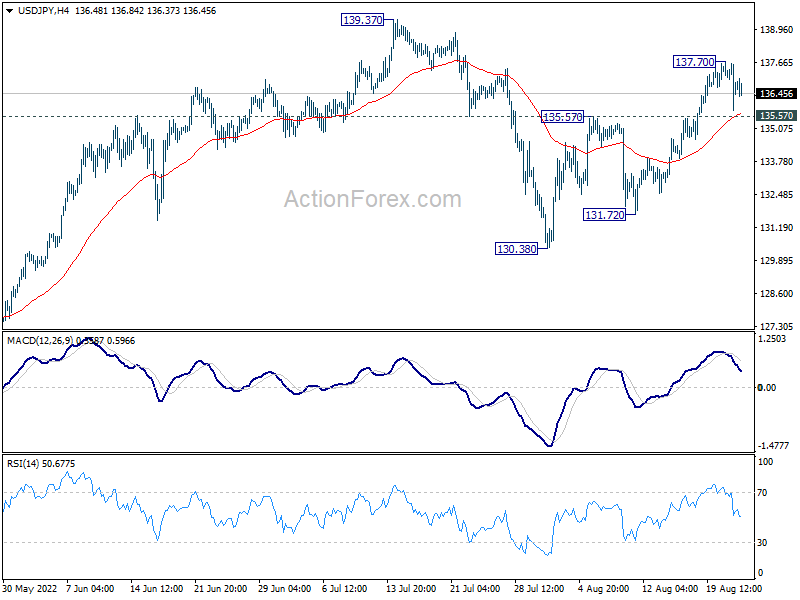
In the bigger picture, price actions from 139.37 medium term top are seen as a corrective pattern to up trend from 101.18 (2020 low). While deeper decline cannot be ruled out, outlook will stays bullish as long as 55 week EMA (now at 123.21) holds. Long term up trend is expected to resume through 139.37 at a later stage, after the correction finishes.

USD/CHF Daily Outlook
Daily Pivots: (S1) 0.9600; (P) 0.9646; (R1) 0.9689; More...
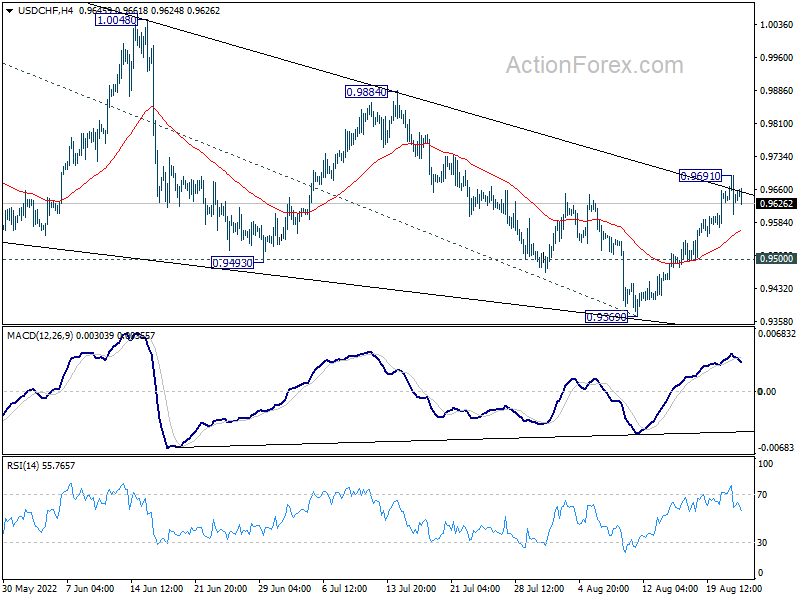
Intraday bias in USD/CHF is turned neutral with current retreat. Triangle correction from 1.0063 could have completed at 0.9369 already. Above 0.9691 will t target 0.9884 resistance next. Break there will argue that larger up trend is ready for resumption through 1.0063. On the downside, below 0.9500 minor support will dampen this view and turn bias back to the downside for 0.9369 support instead.
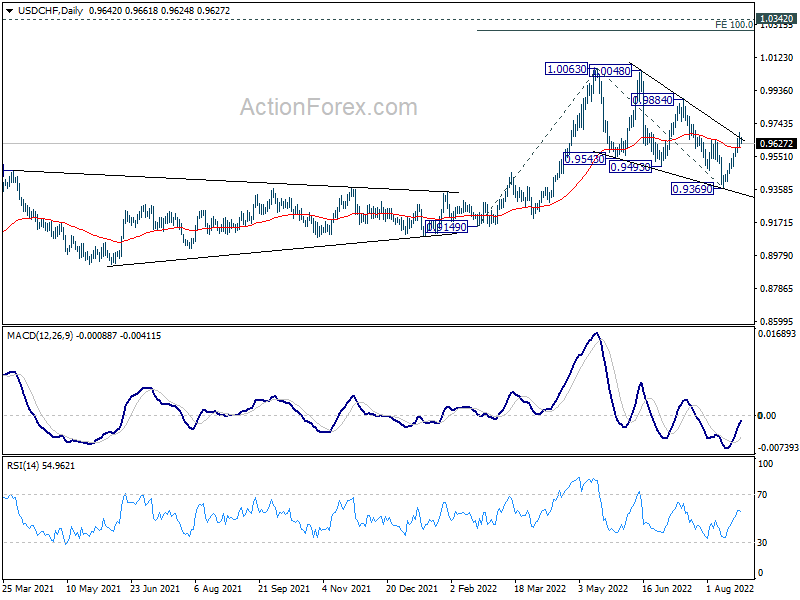
In the bigger picture, current development suggests that up trend from 0.8756 (2021 low) is still in progress. Sustained break of 1.0063 will target 100% projection of 0.9149 to 1.0063 from 0.9369 at 1.0283, and then 1.0342 (2016 high). For now, this will remain the favored case as long as 0.9369 support holds, even in case of deep pull back.
EUR/USD Daily Outlook
Daily Pivots: (S1) 0.9907; (P) 0.9962; (R1) 1.0024; More...
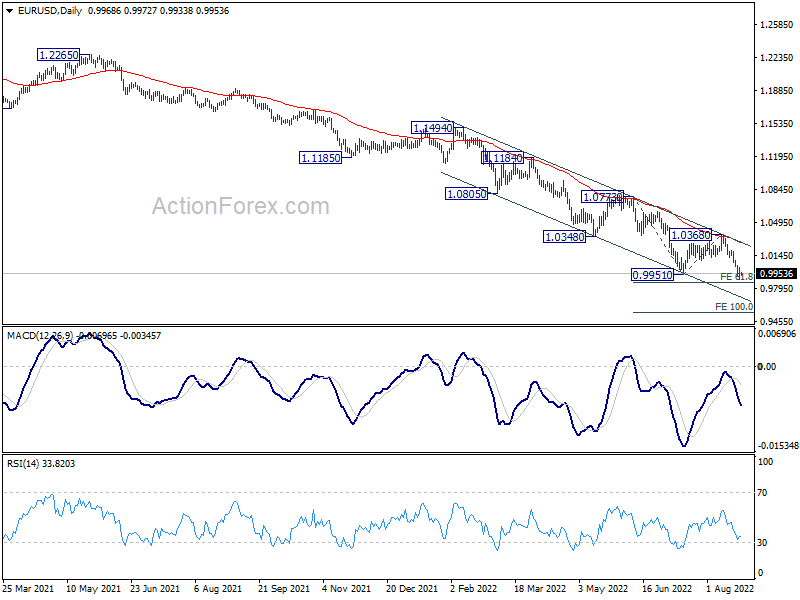
A temporary low as formed at 0.9899 with current recovery. Intraday bias in EUR/USD is turned neutral first. Recovery should be limited by 1.0121 minor resistance to bring another fall. Break of 0.9899 will resume larger down trend to 61.8% projection of 1.0773 to 0.9951 from 1.0368 at 0.9860. Firm break there should prompt downside acceleration to 100% projection at 0.9546.
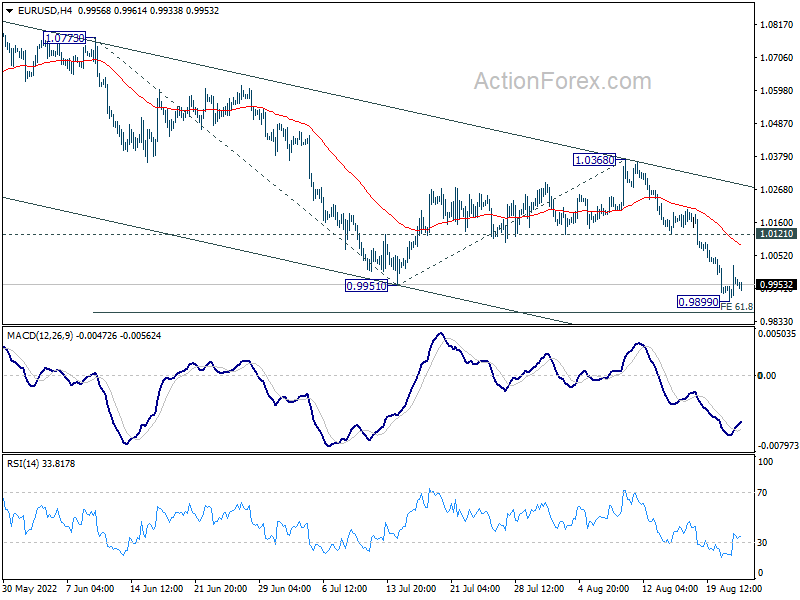
In the bigger picture, down trend from 1.6039 (2008 high) is still in progress. Next target is 100% projection of 1.3993 to 1.0339 from 1.2348 at 0.8694. In any case, outlook will stay bearish as long as 1.0368 resistance holds, in case of strong rebound.
Crypto Market’s Fragile Stability
Market picture
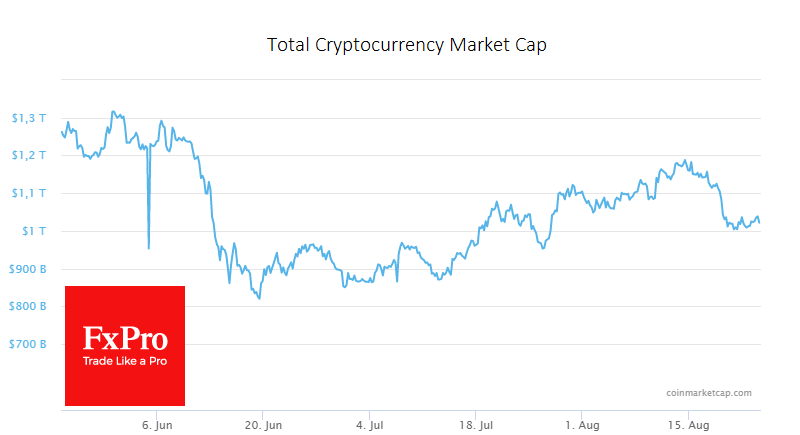
Bitcoin has added 2% in the past 24 hours to $21,400. Ethereum added 4.6% to $1640, while top altcoins added between 0.9% (Dogecoin) and 4.4% (Polkadot).
Total cryptocurrency market capitalization, according to CoinMarketCap, rose 2.2% to $1.03 trillion overnight. The Cryptocurrency Fear and Greed Index fell 3 points to 25 by Wednesday and went from “fear” to “extreme fear”.
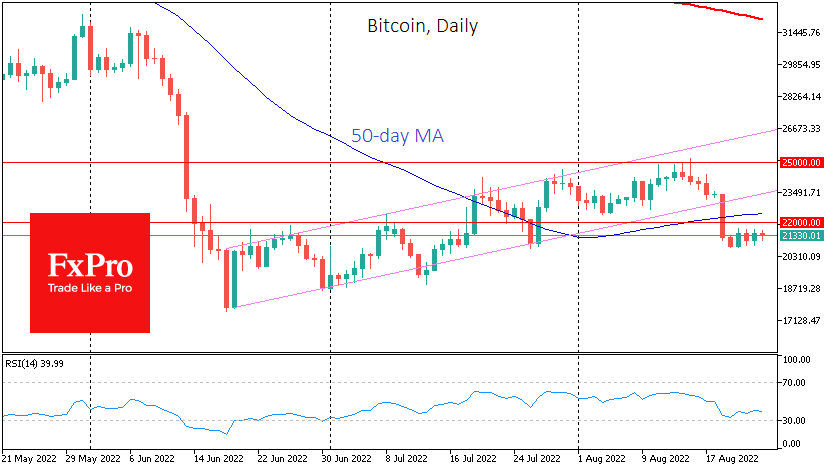
Unlike stock indices, Bitcoin has not fallen but has appeared as if it is disconnected from the market, having reached an equilibrium between the sell-off lows of late July at $20.5K and $22.5K.
The technical picture looks like a consolidation before a new downward momentum, potentially to the lows near 17600. BTCUSD could update that low if the decline gets caught up in the storm of falling stock markets. But it is too early to bet on this.
News background
CoinShares strategy director Meltem Demirors believes that because of the holiday season, we should not expect significant changes in the cryptocurrency market until the end of September.
According to SkyBridge Capital CEO Anthony Scaramucci, bitcoin cannot yet act as an asset to hedge inflation as adopting the first cryptocurrency is not enough.
According to Arcane Research, Bitcoin could become one of the world’s leading power consumers by 2040.
Developers of the Dogecoin Foundation have reported that a DOGE-ETH bridge will be launched by the end of the year to move DOGE from the Dogecoin blockchain to the Ethereum network and back again.
NZDUSD Erases Yesterday’s Rally; Could Weaken Further
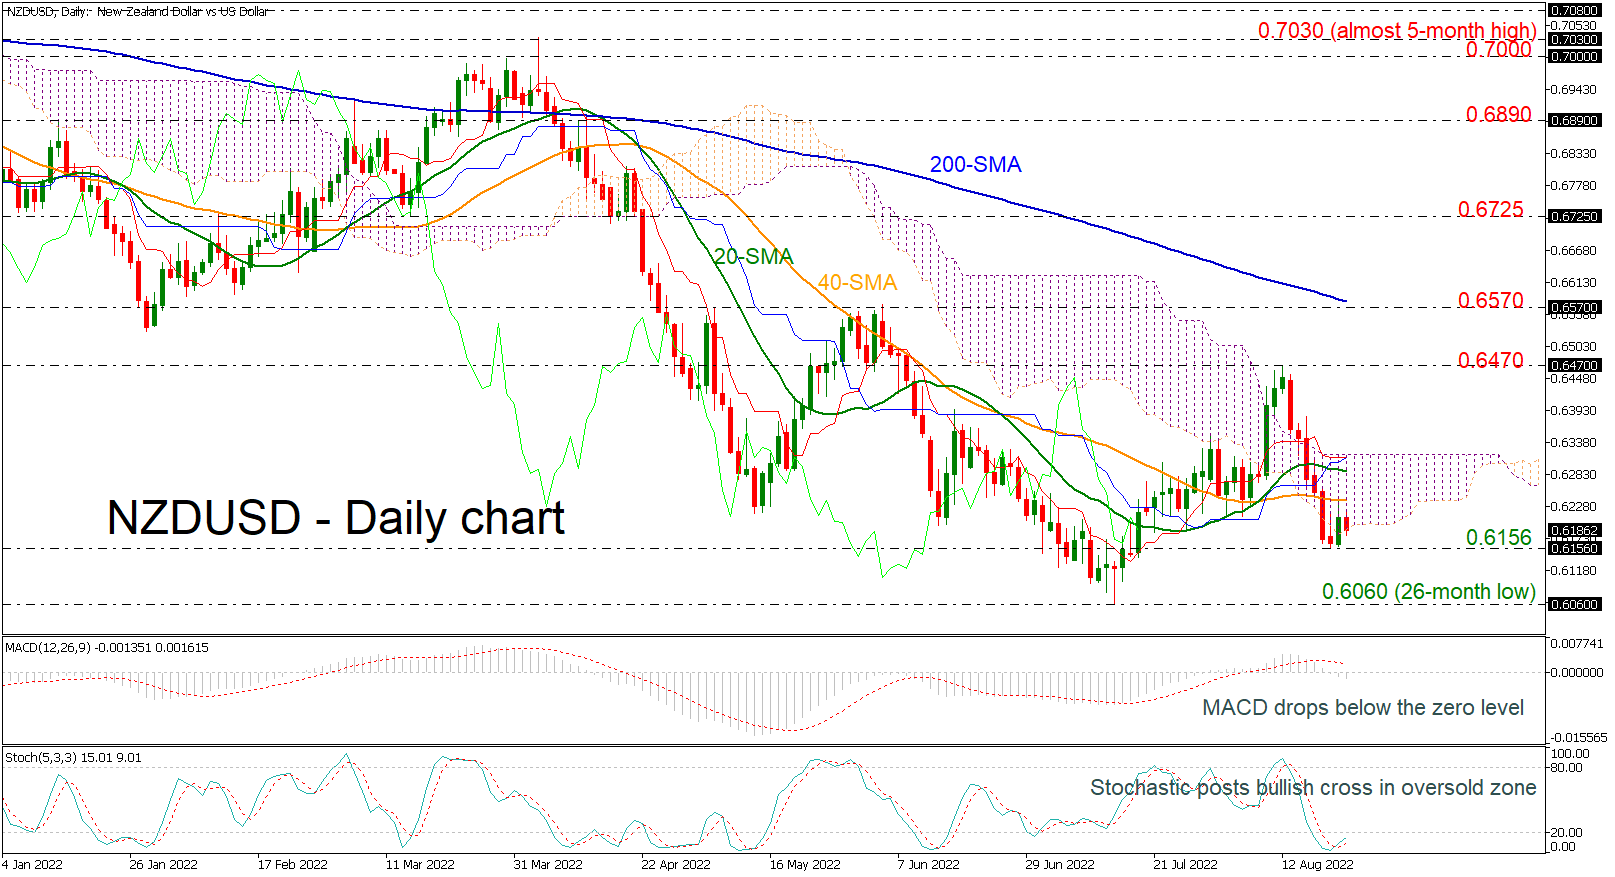
NZDUSD is continuing the selling interest despite the bounce off the 0.6156 support level in the preceding session. The price holds near the lower boundary of the Ichimoku cloud, while the 20- and 40-day simple moving averages (SMAs) are pointing downwards. The MACD oscillator is heading south as well, holding in the negative region. However, the stochastic oscillator posted a bullish crossover in the oversold area, suggesting the end of the bearish move.
Should the pair stretch south, Tuesday’s low of 0.6156 could provide immediate support before the pair touches the 26-month low of 0.6060. A significant step lower could bring the bearish sentiment back into play, sending the price probably towards 0.5920, which was a strong barrier back in May 2020.
On the flip side, the 20- and 40-day SMAs currently at 0.6240 and 0.6290 respectively may halt upside movements. If traders continue to buy the pair, the price could rise until the 0.6470 barrier, while steeper increases could also touch the 200-day SMA near 0.6570.
In the medium-term picture, NZDUSD has been trading bearish in the past four months and only a climb beyond the 200-day SMA may switch this outlook to bullish.