Sample Category Title
NZ First Impressions: Retail Trade June Quarter 2022
Retail spending was much softer than expected in the June quarter, signalling downside risk to our forecast for Q2 GDP growth and the RBNZ’s projections.
Q2 retail sales (volumes): -2.3% (Prev: -0.9%)
Westpac f/c: +0.3%, Market +1.7%
Q2 core retail sales (volumes): -1.6% (Prev: -0.3%)
Detail
Retail spending was much weaker than expected in the June quarter.
The volume of goods sold fell by 2.3%. That was lower than our forecast for a muted 0.3% rise, and well below the average analyst forecast for a 1.7% gain.
Today’s fall follows a 0.9% drop in spending in the March quarter, leaving spending volumes down 3% through the first half of the year. Spending in core categories (excluding vehicles and fuel) is down 2%.
Looking under the surface, households have been winding back their spending on durable items like electronics (down 6% over the past three months) and furnishings (down 8%). There has also been a fall in vehicle sales (down 6%). Those are the same categories where spending rose strongly when Covid-19 first arrived on our shores and measures to protect public health prompted a shift away from spending on services.
Now that health restrictions have been rolled back, and with the opening of the borders allowing tourists back into the country, we have seen increased spending on hospitality (+3%) and accommodation services (+10%). However, those increases have not offset the reduced spending in other areas.
Nominal spending levels have actually held steady since the start of this year. However, households’ spending power has been squeezed by large and widespread increases in consumer prices. On top of that, mortgage rates rose through the first half of this year and consumer confidence has plummeted.
Implications
We’ve been forecasting a slowdown in household spending for some time, with increases in mortgage interest costs signalling a significant squeeze on households’ budgets. However, that slowdown in spending has come through sooner than expected.
Importantly, many households have been shielded from the impact of interest rate increases to date due to the high level of mortgage fixing in the New Zealand market. Over the coming months, debt servicing costs will rise sharply for many households as they refix at higher interest rates. And coming on top of today’s soft result, that points to weak spending through the back part of the year.
The softer than anticipated retail spending result signals downside risk to our forecasts for a 1.0% rise in June quarter GDP. More importantly, it also signals significant downside risk to the RBNZ’s forecast for 1.8% growth. In its recent policy statement, the RBNZ highlighted the strength in inflation and need for further OCR increases. However, in our view the RBNZ gave little credence to the signs of softening demand that have been emerging.
Today’s result further reinforces our expectation that the OCR will peak at 4% by the end of this year, in contrast to the RBNZ’s projections which highlighted the risk of a higher peak.
We’ll firm up our forecast for GDP as other partial indicators are released over the next couple of weeks.
Fed’s Favorite Inflation Gauge Eyed ahead of Jackson Hole Event
The core PCE index due for release on Friday at 12:30 GMT will be the last piece of economic information ahead of the Jackson hole symposium. Hence, although investors have already gotten some taste of inflation in July and may not get surprised in the wake of a potential slowdown, personal consumption and income figures accompanying the survey might still be important to watch. If the figures mirror a fragile demand picture, the latest bearish correction in the dollar may gain another leg.
Investors vs Fed
Two contradictory scenarios are currently playing in investors’ minds. On the one hand, the latest pullback in the US CPI inflation immediately signaled a less hawkish Fed in the year ahead. On the other hand, the latest commentary from Fed policymakers surprisingly played down that case and backed additional aggressive rate hikes instead.
Well, markets have been in this confusing situation more or less a year ago when investors were increasingly foreseeing an inflationary period and higher interest rates ahead, whereas the Fed was seeing only a transitory growth in prices and a steady policy only to find later that it was wrong. The horizon is now dangerously cloudier than during the optimistic post-lockdown period as recession risks are more real than ever. Besides the ongoing pandemic negative spillovers, the climate and war-related constraints have further worsened the supply outlook for energy and other raw materials and the question that arises here is: will investors be correct for a slower monetary tightening this time?
Core PCE to inch down as US economy loses steam
The truth is that evidence from recent data is leaning towards a less hawkish side. After a miss in CPI inflation, July’s flash business PMI figures also diminished faster than analysts anticipated, with the services sector moving deeper in the contraction area. Softer hiring, subdued domestic and foreign demand conditions, and easing but still expensive input costs were a common drag in both the services and manufacturing indices, signaling that the cocktail of rising interest rates and above-target inflation has started to rein in consumers’ appetite to spend.
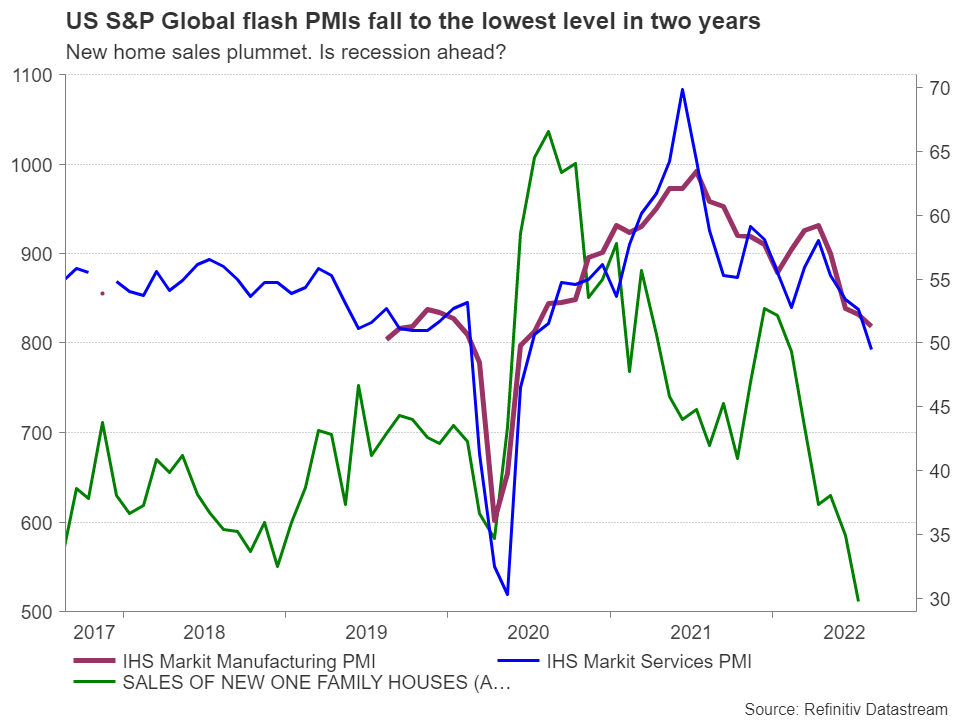
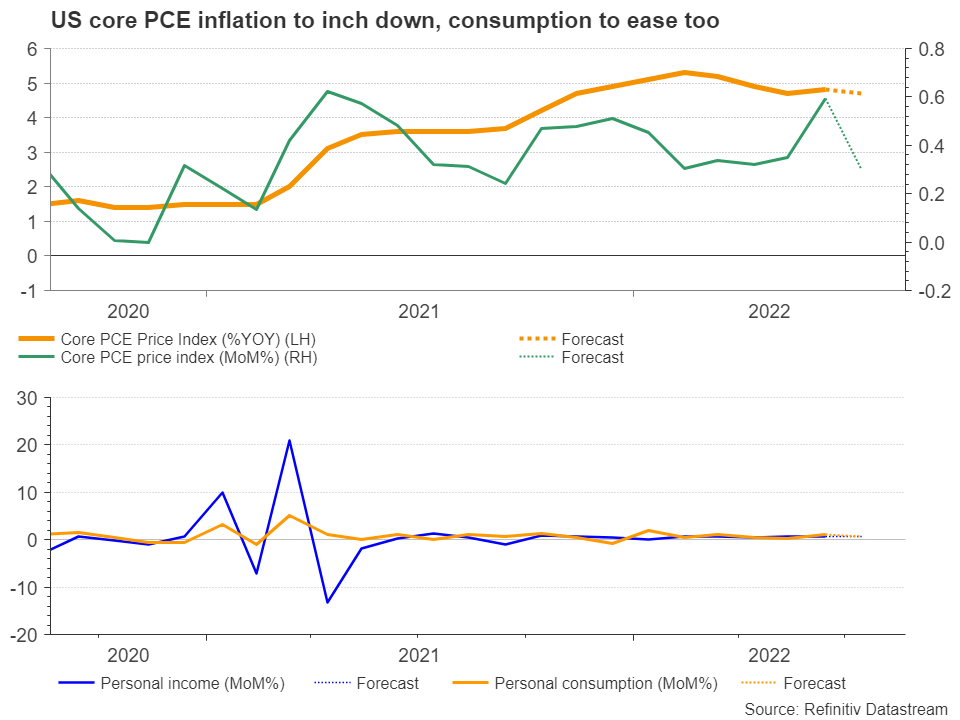
The Fed’s favorite inflation measure, the core PCE index, will shed more light on the above argument on Friday. Following the slight pickup in June, the measure is expected to flip slightly back to May’s level of 4.7% from 4.8% previously, remaining below the March peak of 5.3%. The monthly reading is also projected to ease from 0.6% to 0.3%.
Demand conditions closely monitored
Such a scenario would not be very surprising given July’s lower-than-expected CPI inflation data. Hence, investors may pay more attention to the monthly personal consumption and income stats as they are eager to learn whether demand has indeed switched to a downhill slope. Discouragingly, the former is expected to trim June’s rebound to return to 0.6% m/m from 1.1% previously, while the latter is forecast to stay steady at 0.6% m/m, reflecting little distress among consumers.
A worse-than-expected outcome could strengthen the case for a less hawkish Fed in September, making the US dollar lose some of its shine.
Inflation remains top priority
Currently, future markets are indecisive between a 75 bps and 50 bps rate hike in September, with the former priced at a probability of 58%. Perhaps any data surprises could easily shift the odds accordingly, but traders will likely seek stronger signs of commitment when the Fed chief Jerome Powell delivers his Jackson Hole speech on Friday. Probably that will not be his last word before the September FOMC policy meeting as the central bank will wisely wait for the next nonfarm payrolls and inflation reports to get a clearer picture on the economy before announcing any critical twists in guidance.
Still, given the Fed’s priority to cool the still monstrously high inflation as fast as it can, and the hot labor market, policymakers may not hesitate to repeat July’s 75 bps rate increase in September and Powell will likely avoid any big changes in guidance this week until further notice.
EUR/USD
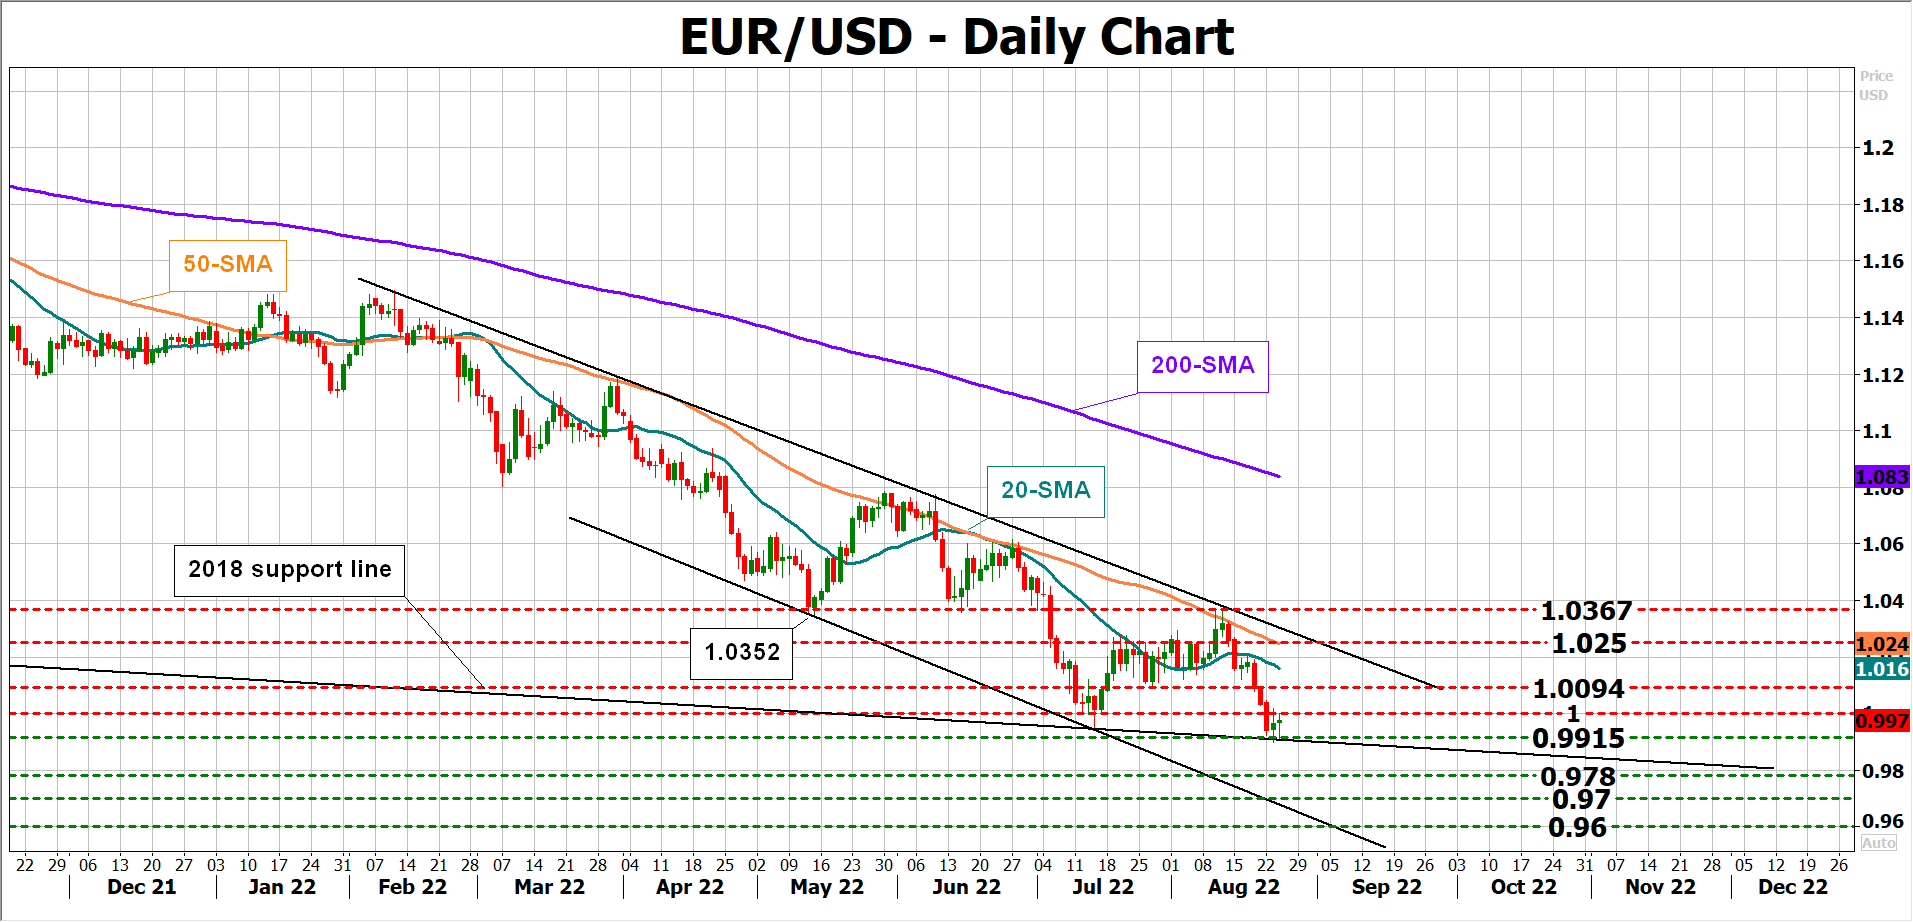
Looking at EUR/USD, the pair is trading bearish within a downward-sloping channel just below parity at 0.9913, holding its feet above the long-term support line that joins the lows from 2018. If the upcoming data increases the stakes for a slower Fed tightening, the pair could pivot northwards to test parity and then the 1.0094 barrier. Higher, the 20-day simple moving average (SMA) at 1.0157 could add some pressure ahead of the channel's upper boundary and the 50-day SMA around 1.0250.
Alternatively, should the stats promote a continuation of the current rate hike pace, the pair could plummet towards the 0.9780 – 0.9700 support region taken from 2002, where the channel’s lower boundary is also positioned.
Technical Outlook and Review
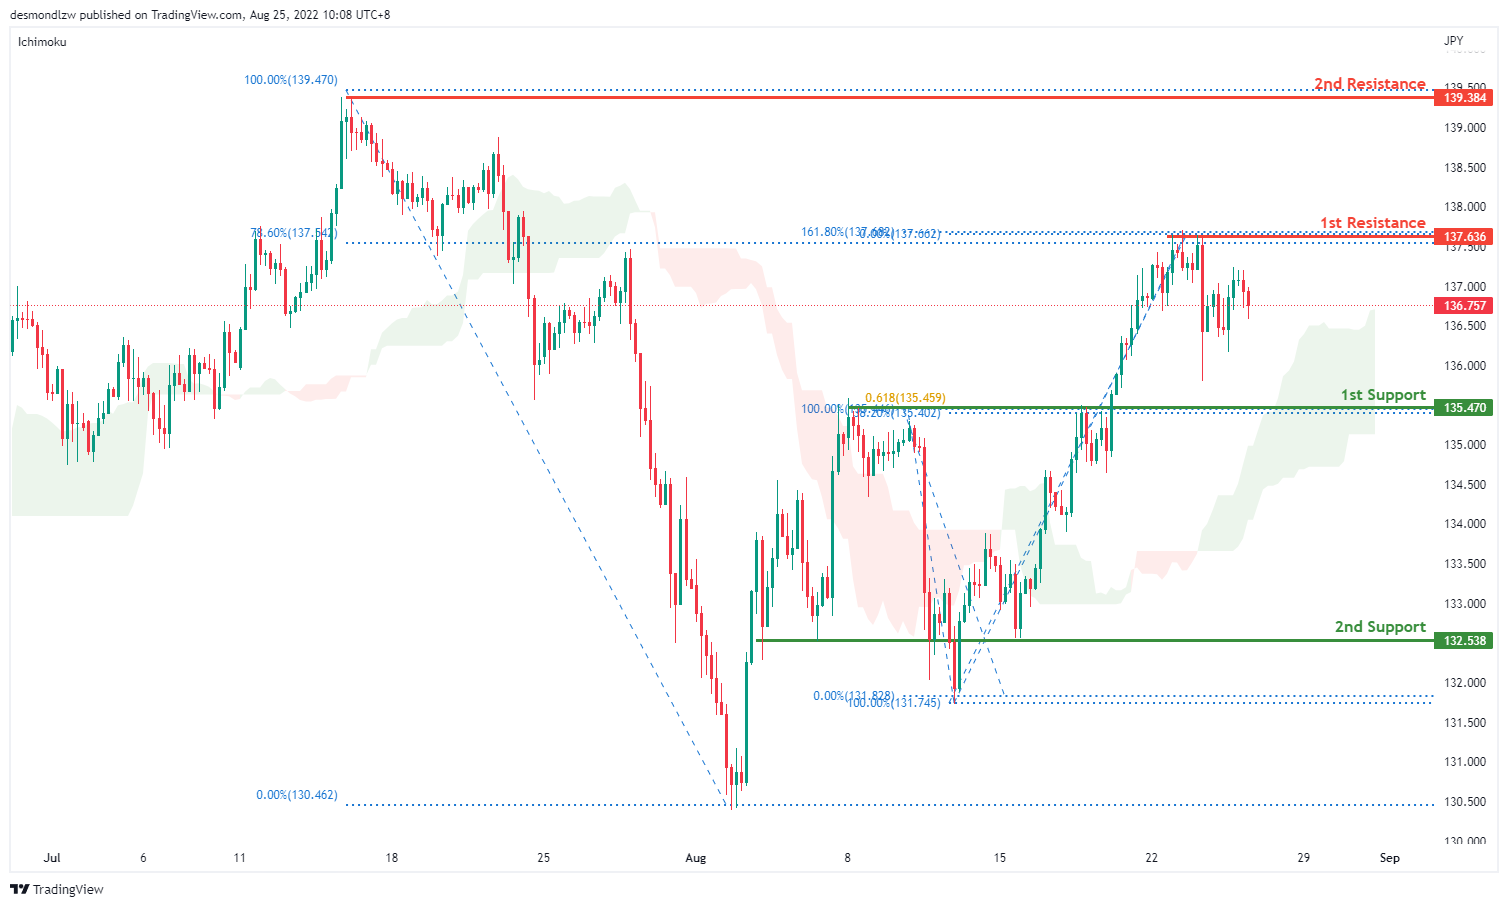
USD/JPY:
On the H4 chart, price has confirmed a bullish momentum breaking the previous high. We are bullish bias and are looking at price testing the first resistance at 137.636 where the 78.6% fibonacci retracement and 161.8% extension sits. It has pulled back slightly but if bullish momentum continues, it will bring the price to 139.397 where the swing high sits. Alternatively if price pulls back, it should test the first support at 135.470 where the 61.8% projection sits and the second support at 132.538 where the swing low sits
Areas of consideration:
- H4 time frame, 1st resistance at 137.636
- H4 time frame, 1st support at 135.470
DXY:
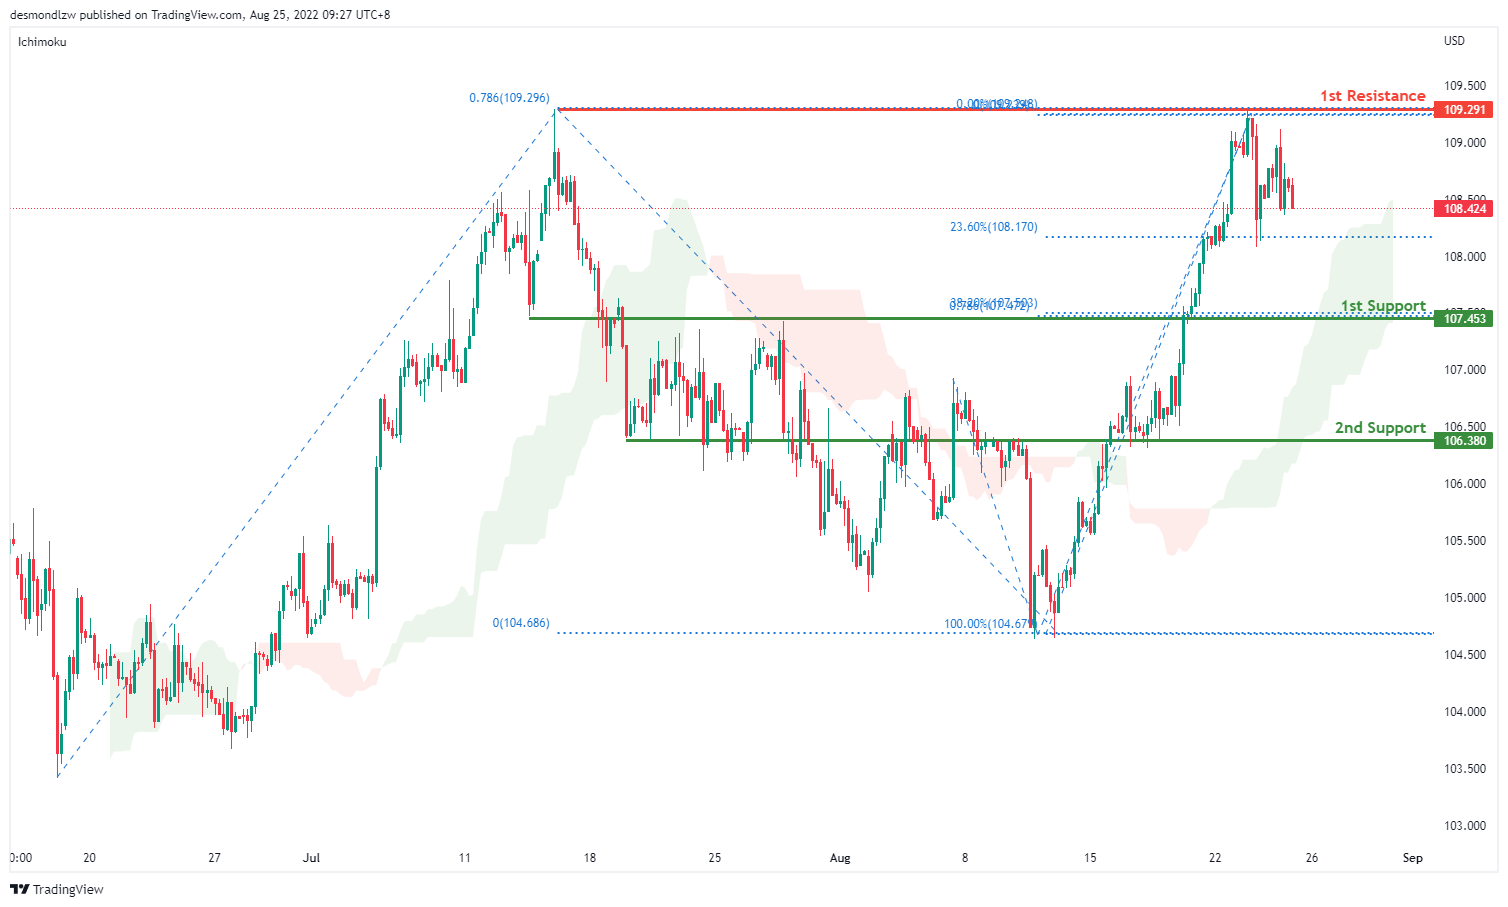
On the H4, prices are still moving in an ascending trend and is in a bullish momentum. Price has tested first resistance at 109.291 where the 78.6% Fibonacci projection and the previous swing high sits and has pulled back slightly to the 23.6% retracement levels. If price fails to break the first resistance, it should pull back to test the first support at 107.453 where the 38.2% retracement and 78.6% projection sits and subsequently the second support at 106.380 where the 61.8% retracement sits
Areas of consideration:
- H4 time frame, 1st resistance at 109.291
- H4 time frame, 1st support at 107.453
EUR/USD :
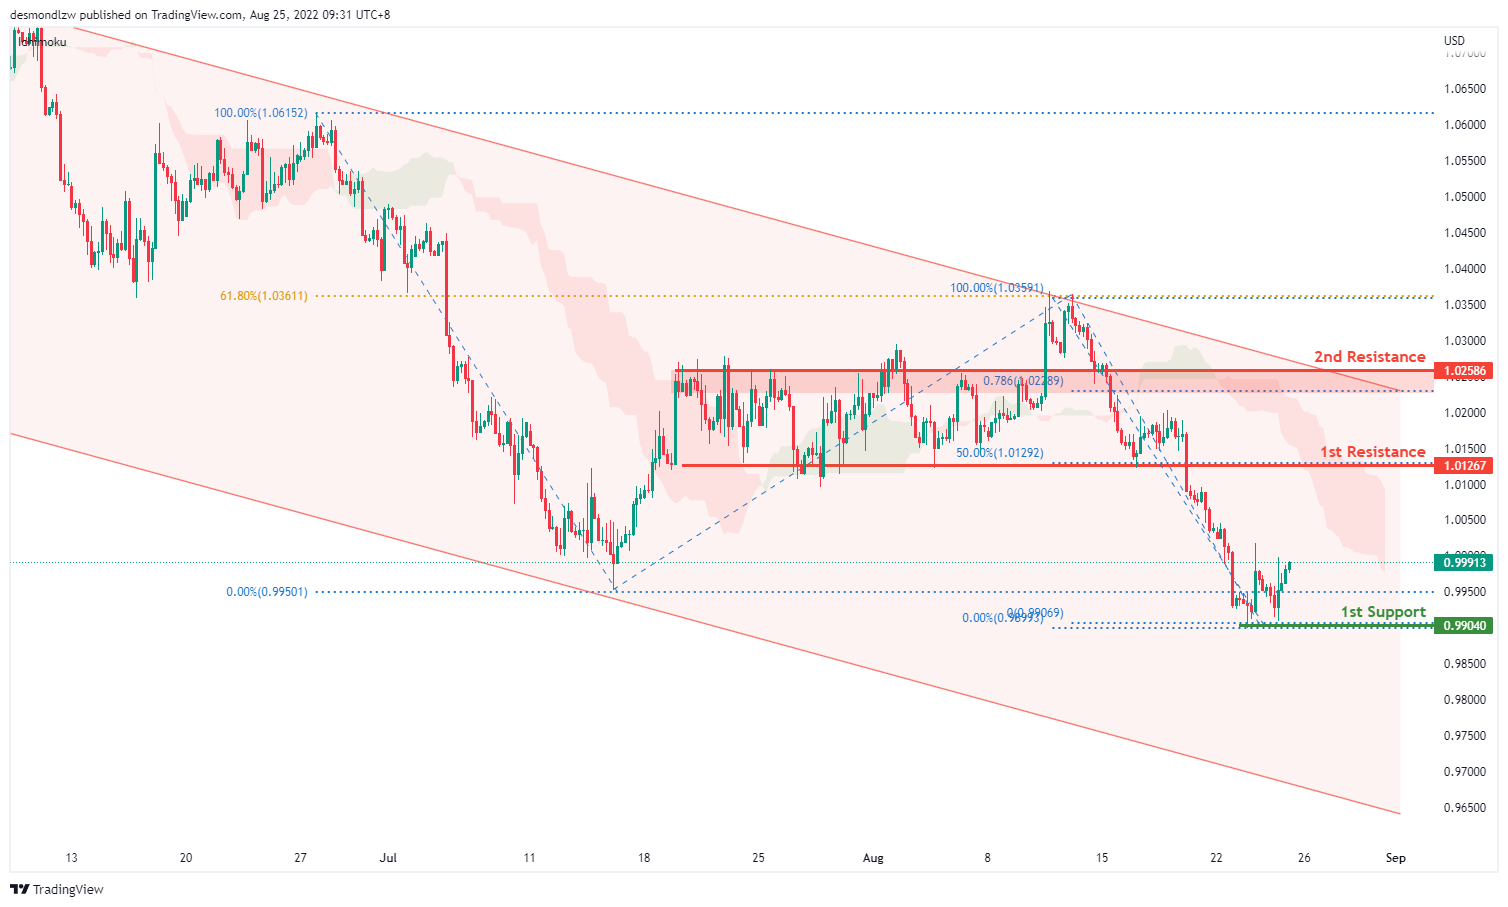
On the H4, prices are still in a descending trend and are below the ichimoku indicator, we are bearish bias. Prices have tested the first support at 0.9904 where the 61.8% projection sits. If it fails to break the first support, prices could pull back to test the first resistance at 1.0126 where the previous swing low and 50% retracement sits and subsequently the second resistance at 1.0258 where the 78.6% retracement and swing high sits
Areas of consideration :
- H4 1st resistance at 1.0126
- H4 1st support at 0.9904
GBP/USD:
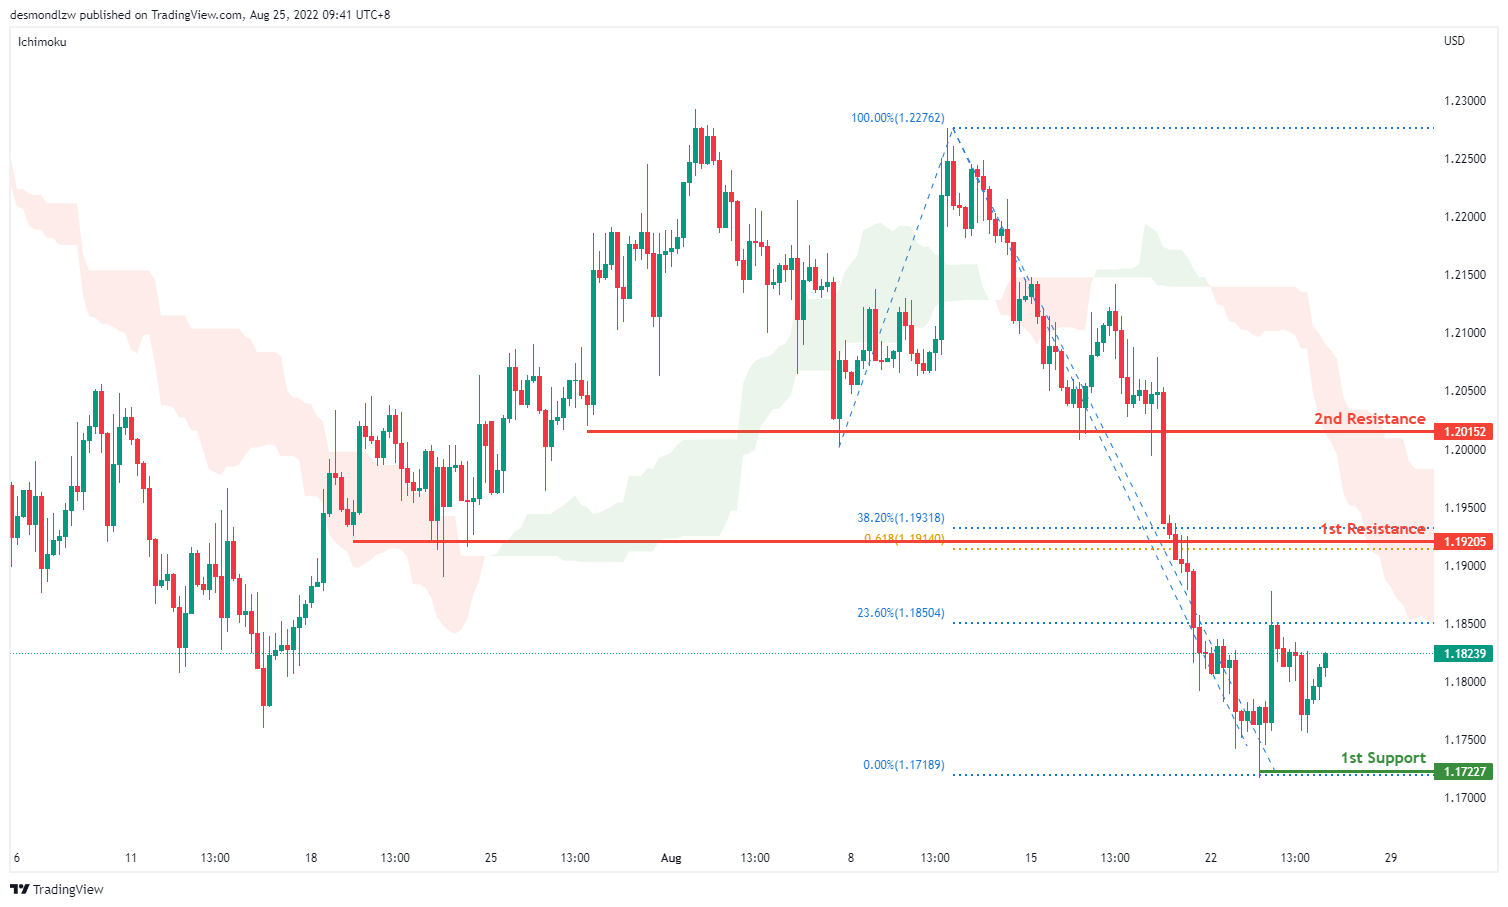
On the H4, prices seem to be in a bearish momentum and respecting the ichimoku cloud. It has tested the first support at 1.1722 where the swing low sits and has now slightly reversed. Alternatively, if price fails to break the first support at 1.1722, it can pull back to test the first resistance at 1.1920 where the 38.2% retracement and 61.8% projection sits. Subsequently testing the second resistance at 1.2015 where the swing low sits
Areas of consideration:
- H4 1st resistance at 1.1920
- H4 1st support at 1.1722
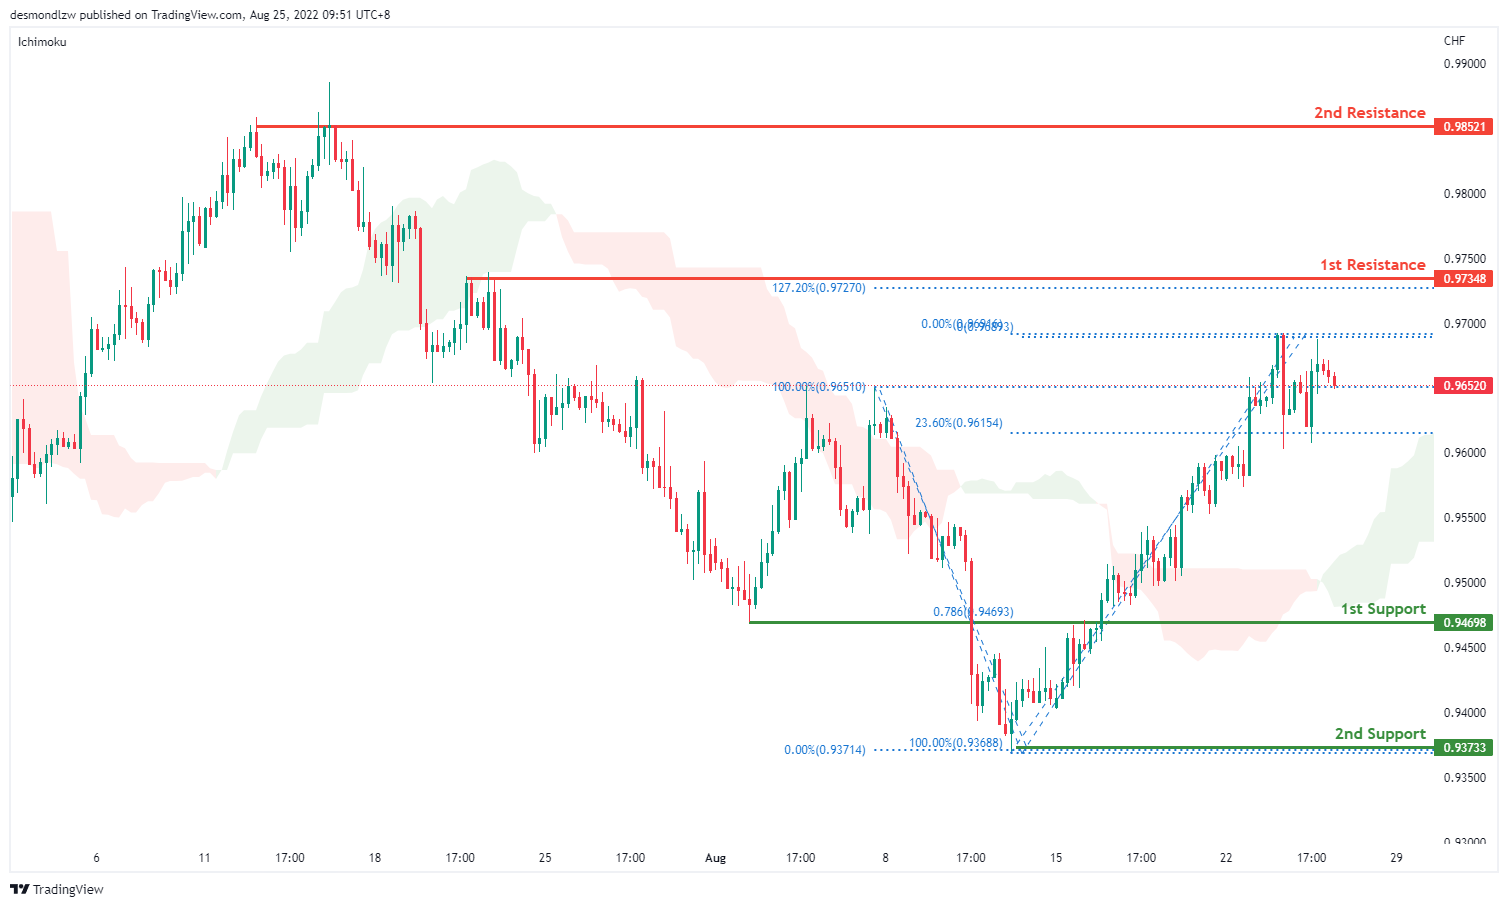
USD/CHF:
On the H4, with prices moving above the ichimoku cloud and breaking the descending trend, we are bullish bias. We’re looking at price to test the first resistance at 0.9734 where the 127.2% extension sits. If price continues with bullish momentum, it will bring price to second resistance at 0.9852. Alternatively, prices could test the intermediate support at 0.95500 where the swing low sits and then the first support at 0.9469 where the 78.6% fibonacci retracement sits
Areas of consideration
- H4 1st support at 0.9469
- H4 1st resistance at 0.9734
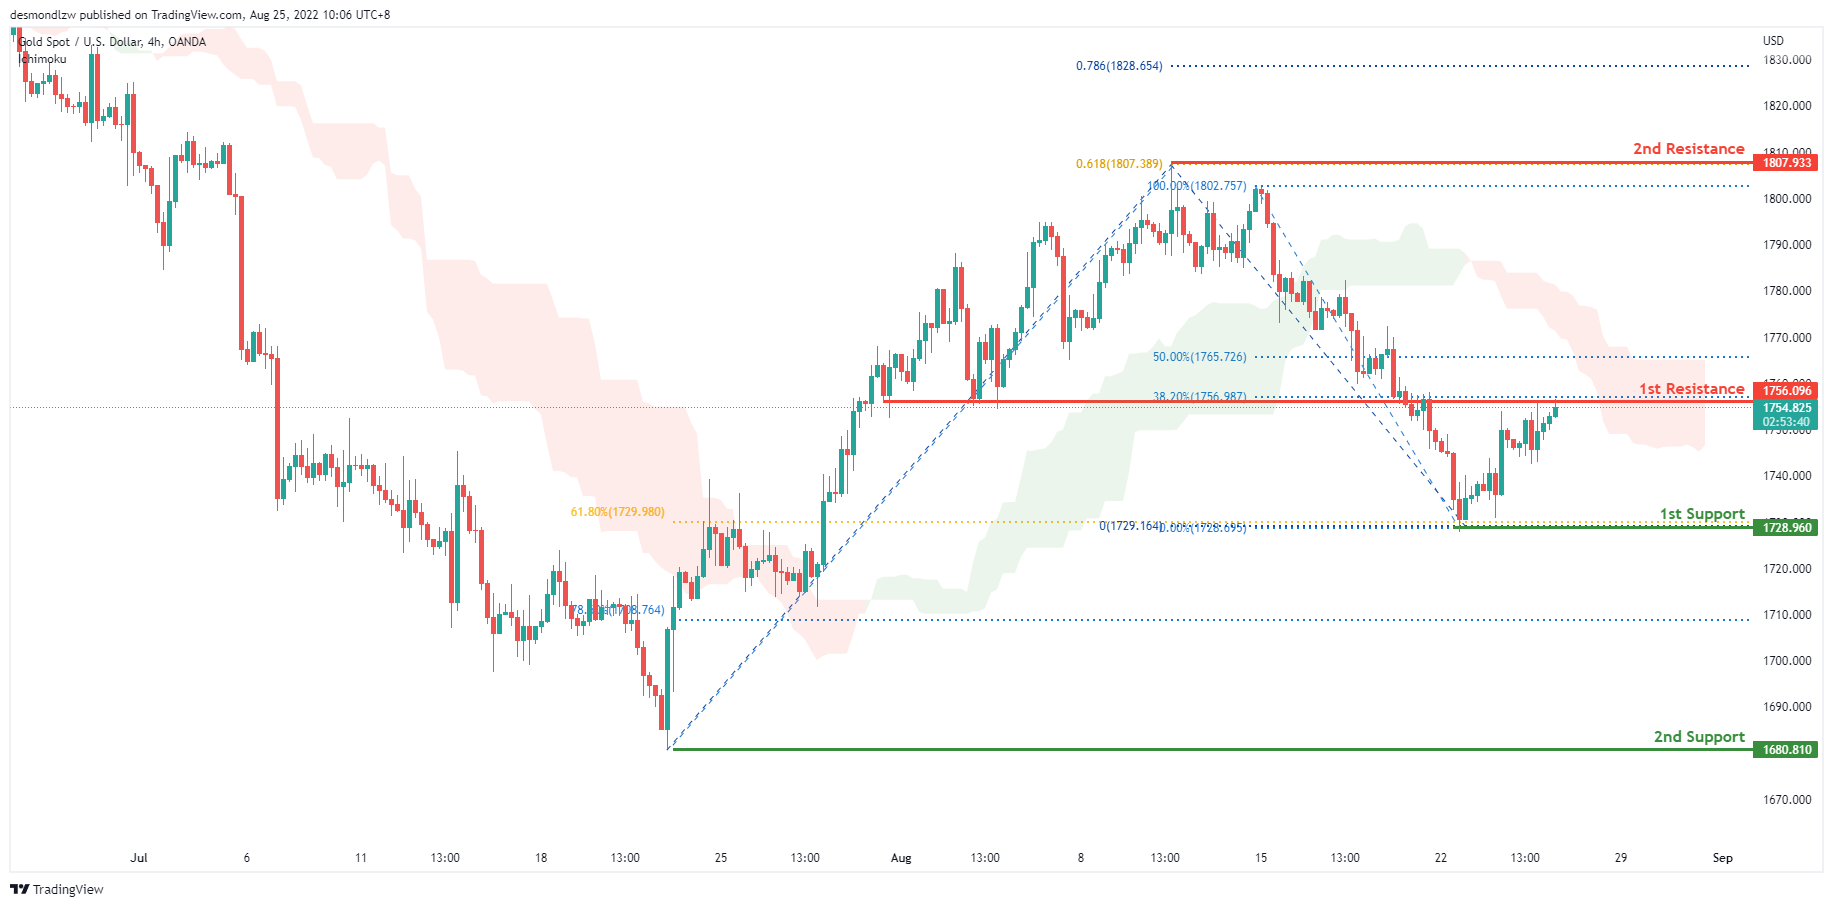
XAU/USD (GOLD):
On the H4, with prices moving within the descending trendline, below ichimoku cloud, we have a bearish bias. Prices are now pulling back slightly to test at the first resistance 1756.096 levels where the 38.2% retracement sits. If prices breaks this resistance, it may pull back further to test at the second resistance 1817.933 where the 61.8% projection sits. Alternatively, price should continue with the bearish trend, testing the first support at 1728.960 then the second support at 1680.810
Areas of consideration:
- H4 time frame, 1st support at 1728.960
- H4 time frame, 2nd support at 1680.810
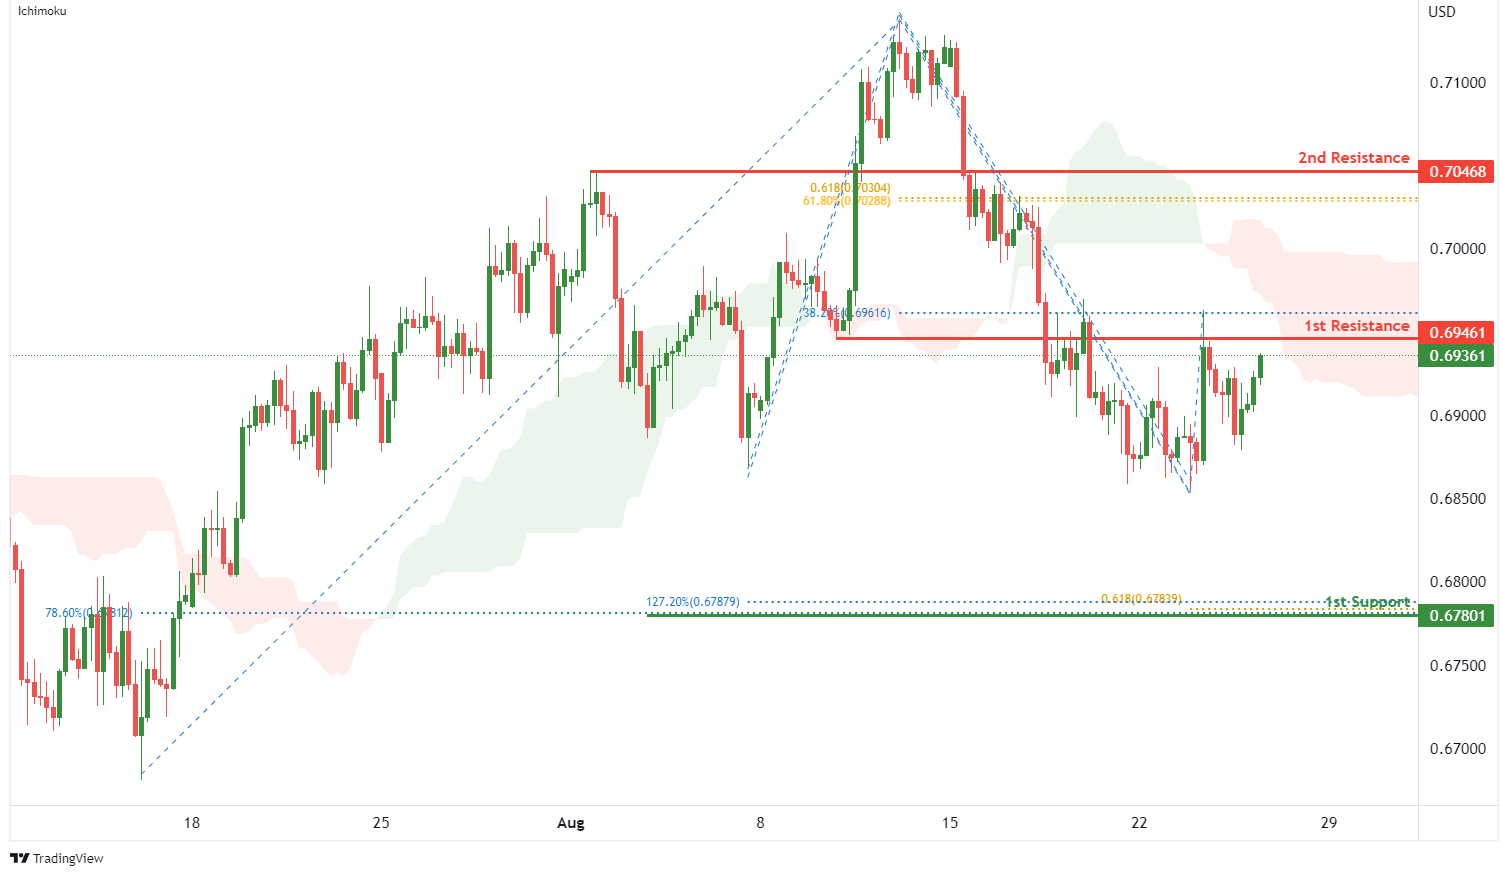
AUD/USD:
On the H4, with the price moving below ichimoku cloud, we have a bearish bias that the price will drop from 1st resistance at 0.69461 where the overlap resistance and 38.2% fibonacci retracement are to the 1st support at 0.67801 where the 78.6% fibonacci retracement, 127.2% fibonacci extension and 61.8% fibonacci projection are. Alternatively, price could break 1st resistance structure and rise to 2nd resistance at 0.70468 where the pullback resistance, 61.8% fibonacci retracement and 61.8% fibonacci projection are.
Areas of consideration
- H4 1st support at 0.67801
- H4 1st resistance at 0.69461
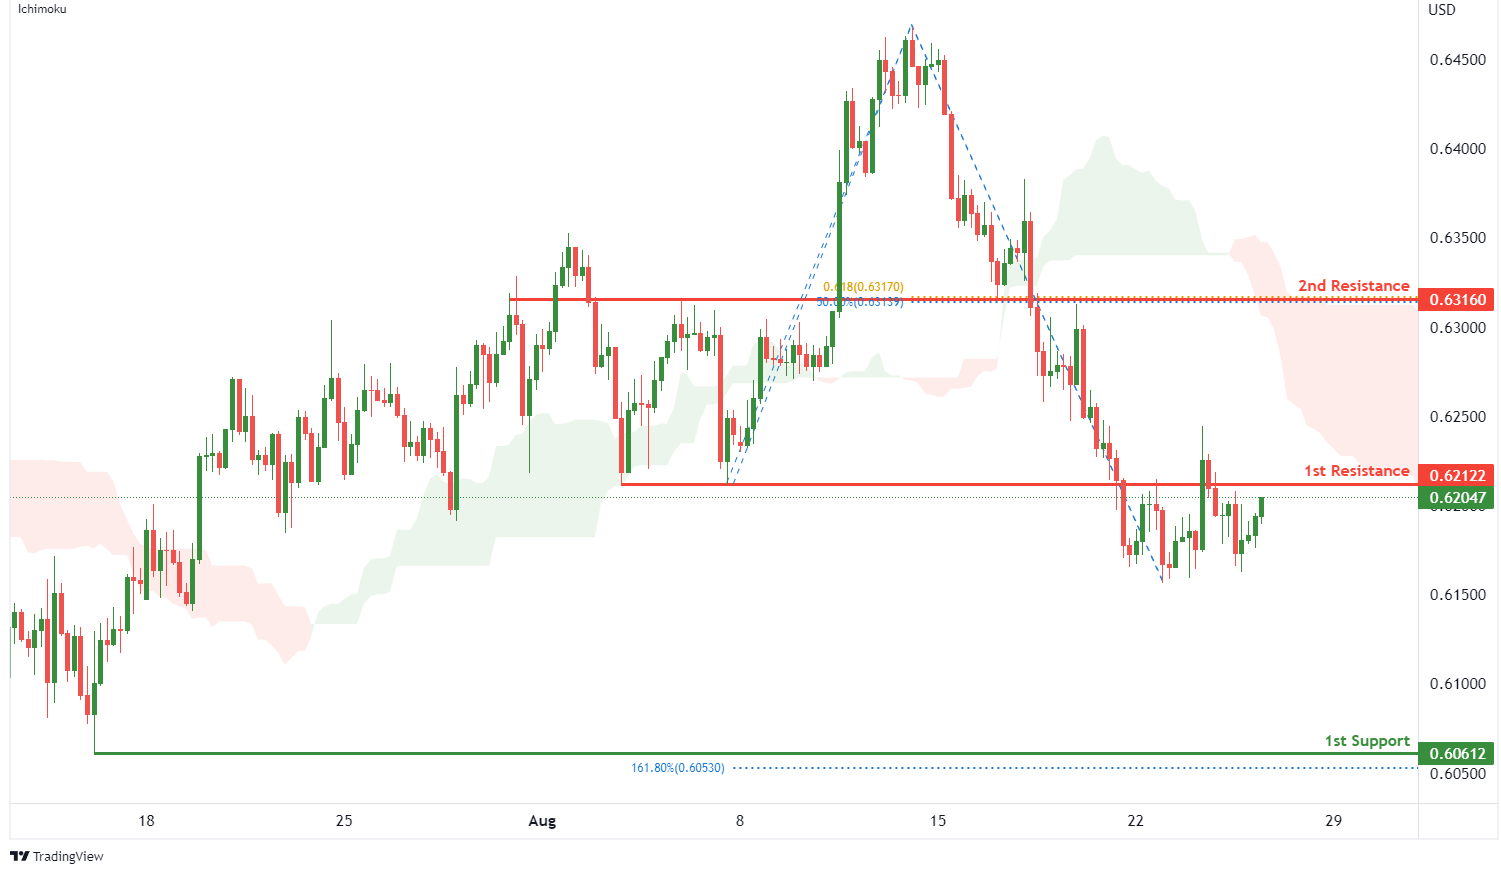
NZD/USD:
On the H4, with price moving below the ichimoku indicator, we have a bearish bias that price will drop from 1st resistance at 0.62122 where the pullback overlap resistance is to the 1st support at 0.60612 where the swing low support and 161.8% fibonacci extension are. Alternatively, price could break 1st resistance and rise to 2nd resistance at 0.63160 where the overlap resistance, 50% fibonacci retracement and 61.8% fibonacci projection are.
Areas of consideration:
- H4 time frame, 1st support at 0.60612
- H4 time frame, 1st resistance at 0.62122
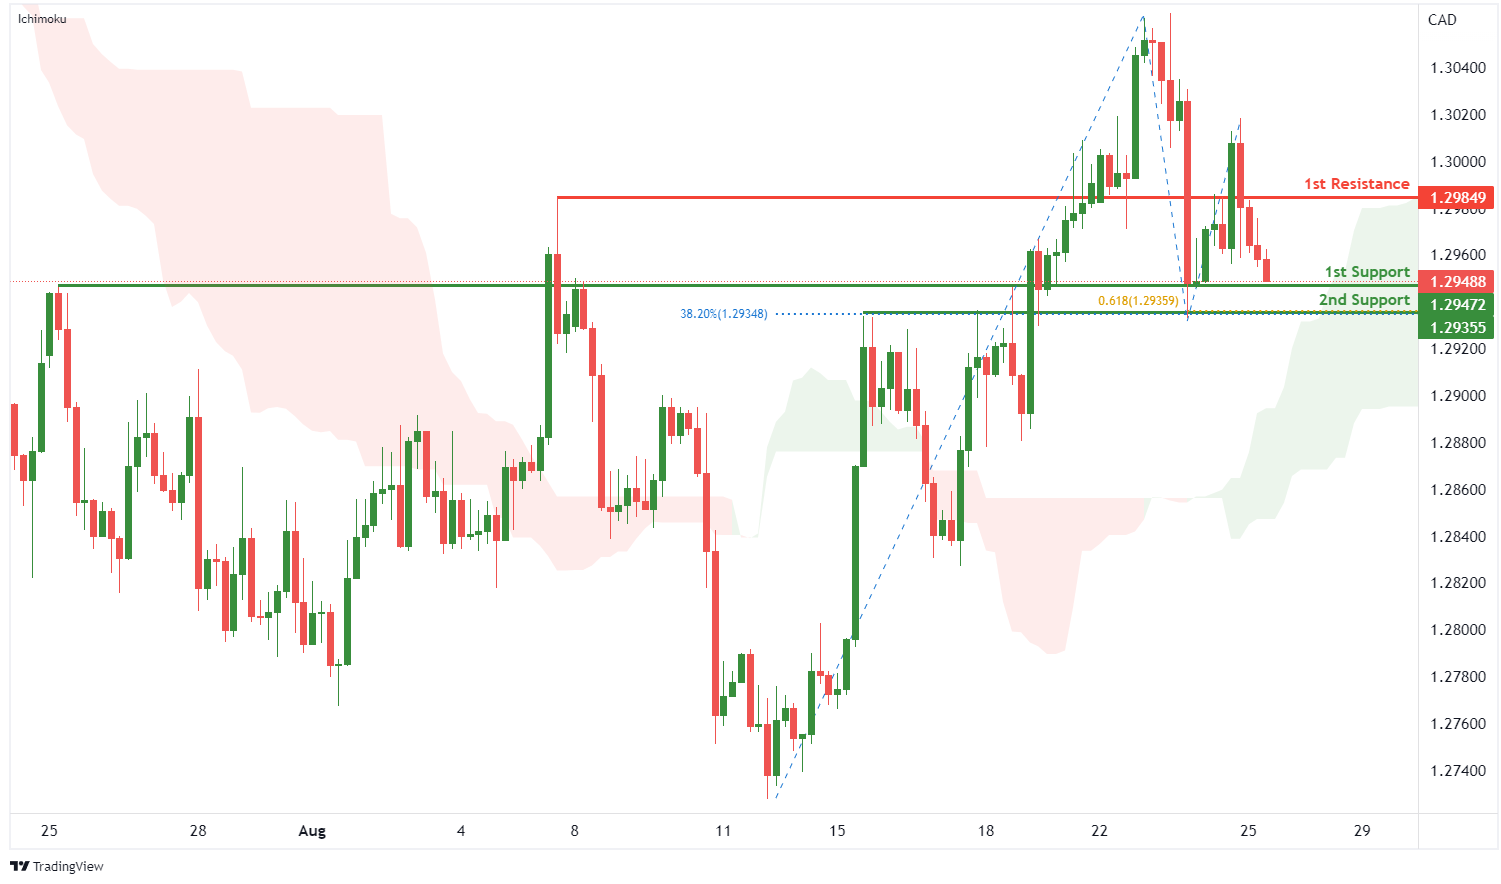
USD/CAD:
On the H4, with the price above the ichimoku cloud, we have a bullish bias that the price will rise from 1st support at 1.29472 where the overlap support is to the 1st resistance at 1.29849 where the pullback resistance is. Alternatively, price could break 1st support and drop to 2nd support at 1.29355 where the overlap support, 38.2% fibonacci retracement and 61.8% fibonacci projection are.
Areas of consideration:
- H4 time frame, 1st resistance at 1.29849
- H4 time frame, 1st support at 1.29472
OIL:
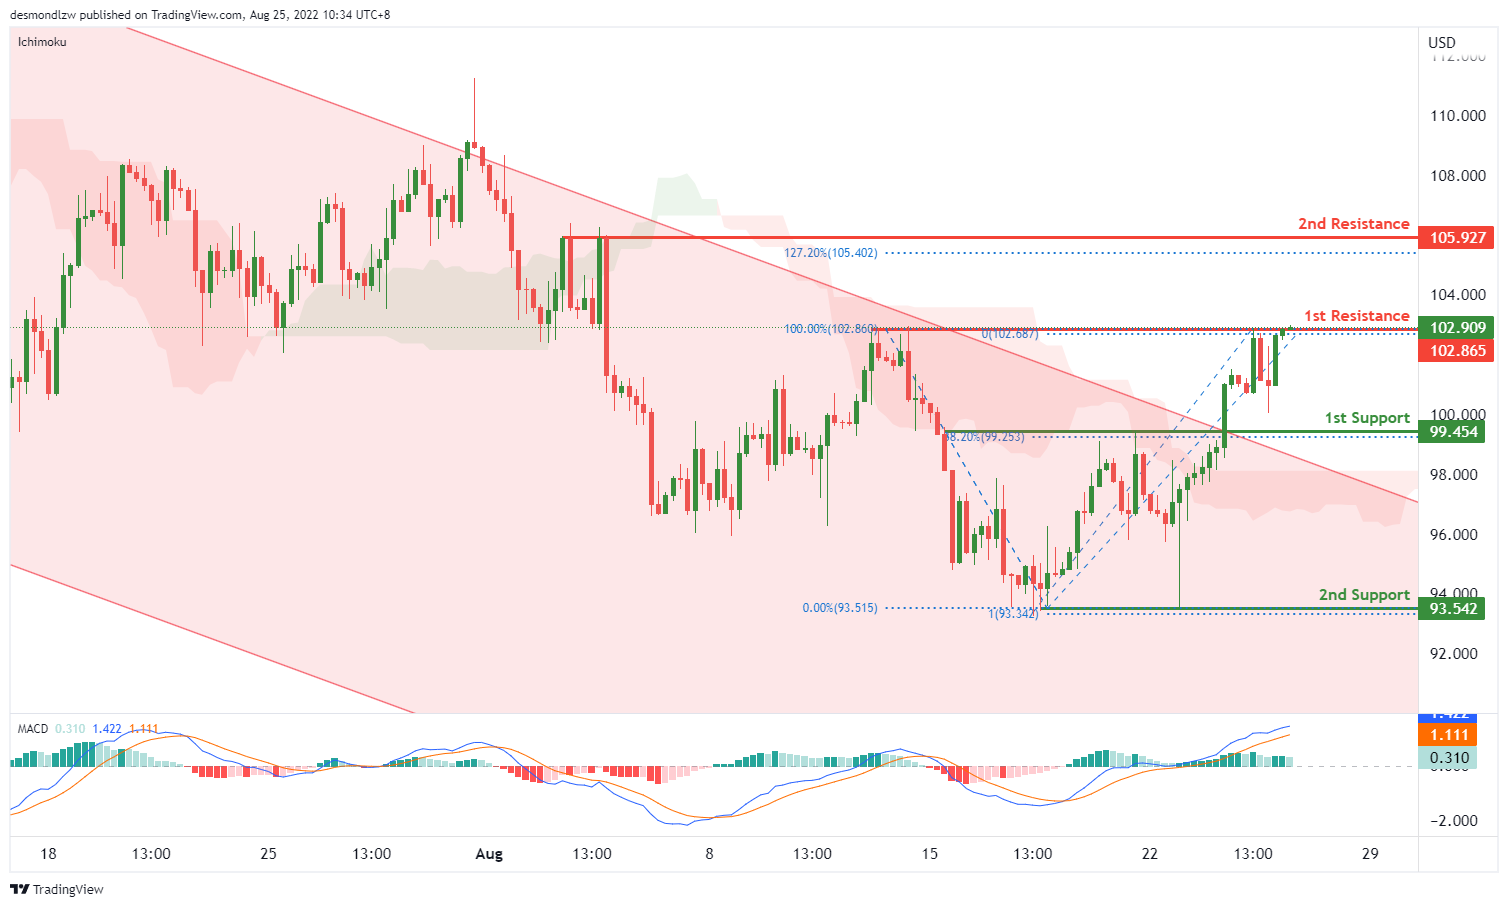
On the H4, with price breaking the descending channel and above ichimoku cloud, we have a bullish bias. Prices are testing the 1st resistance at 102.453, where the 100% fibonacci projection and overlap resistance are. If the price breaks this level, we can expect the price to rise to the 2nd resistance at 105.927, where the 127.2% extension and swing highs are. Alternatively, the price may drop to the 1st support at 99.454, where the 23.6% fibonacci retracement and pullback support are.
Areas of consideration:
- H4 time frame, 1st resistance at 102.453
- H4 time frame, 2nd resistance at 105.927
Dow Jones Industrial Average:
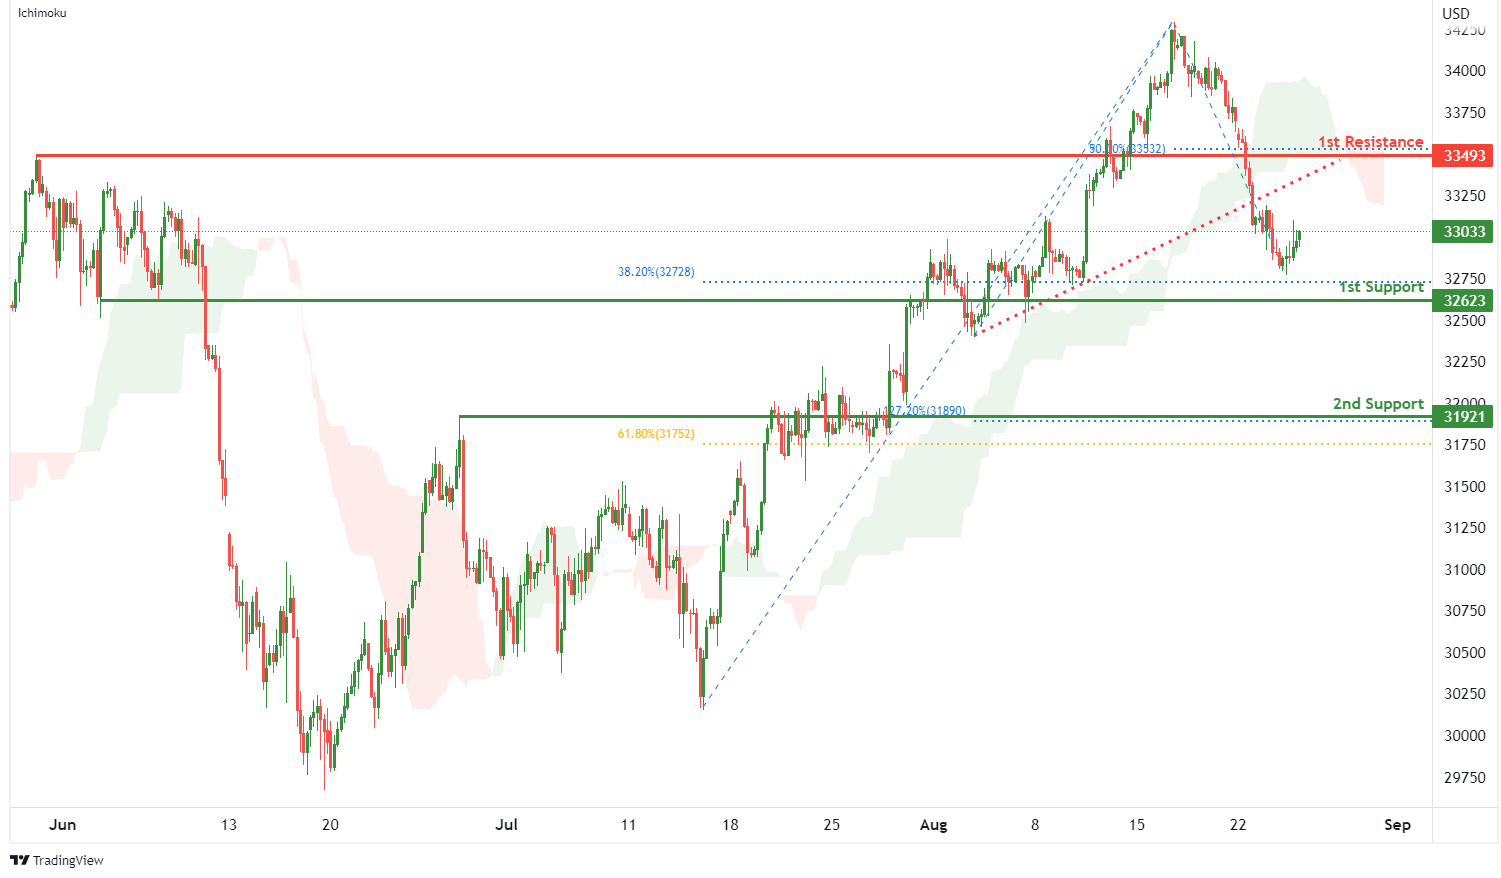
On the H4, with price breaking out of the ascending trendline and moving below the ichimoku indicator, we have a bearish bias that price will drop to 1st support at 32623 where the pullback support and 38.2% fibonacci retracement are. Once there is downside confirmation of price breaking 1st support, we would expect bearish momentum to carry price to 2nd support at 31921 where the pullback support, 61.8% fibonacci retracement and 127.2% fibonacci extension are. Alternatively, price could rise to 1st resistance at 33493 where the pullback resistance and 50% fibonacci retracement are.
Areas of consideration:
- H4 time frame, 1st resistance of 33493
- H4 time frame, 1st support at 32623
DAX:
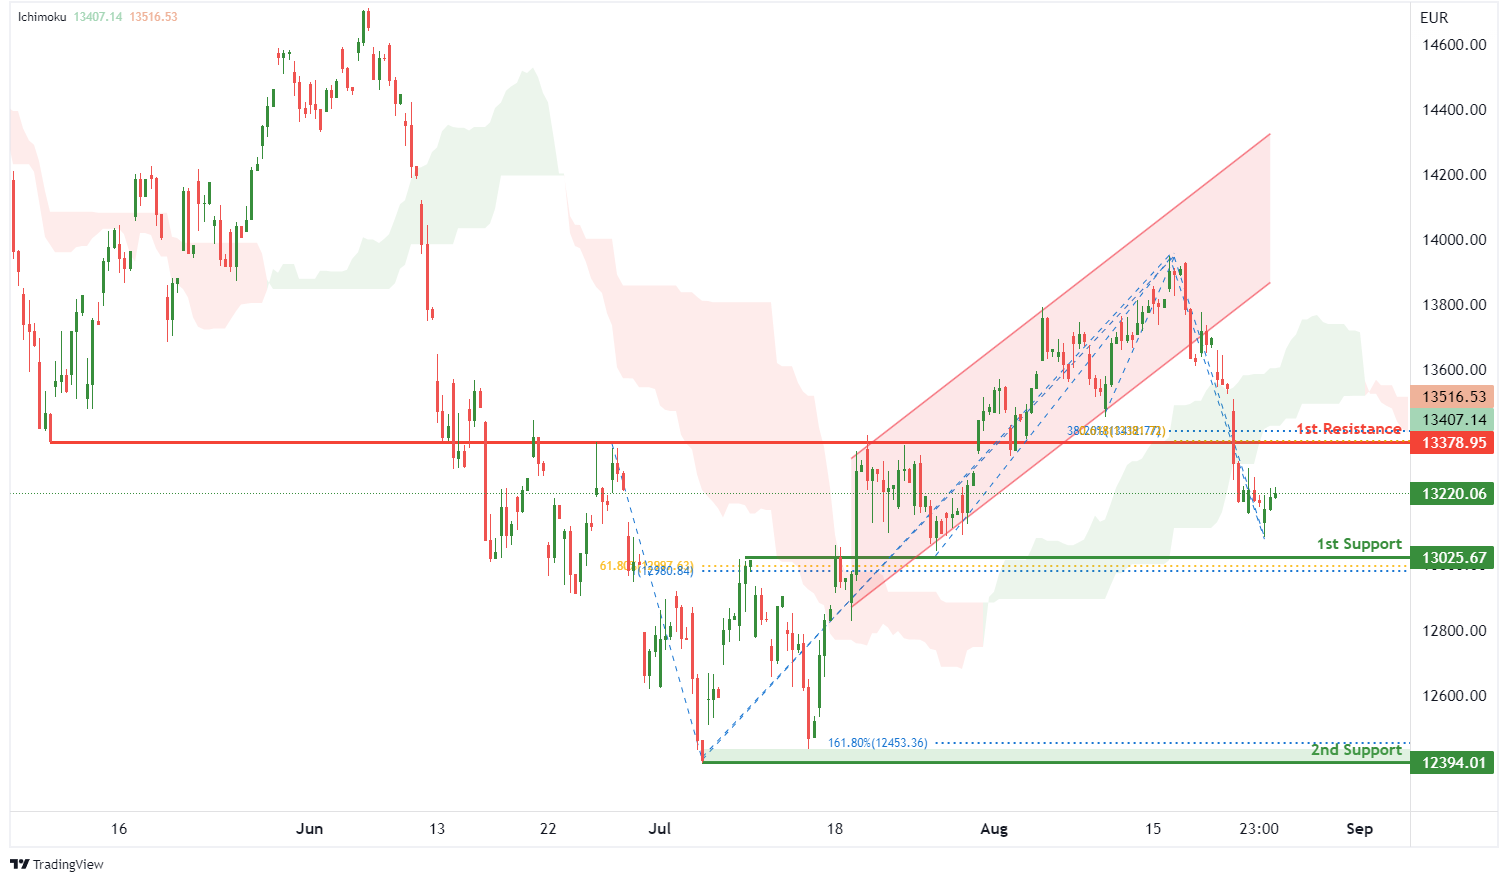
On the H4, with price breaking out of an ascending channel and moving below the ichimoku indicator, we have a bearish bias that price will drop to the 1st support at 13025.67 where the pullback support, 61.8% fibonacci retracement and 100% fibonacci projection are. Once there is downside confirmation that price has broken 1st support, we would expect bearish momentum to carry price to 2nd support at 12394.01 where the swing low support and 161.8% fibonacci extension are. Alternatively, price could rise to 1st resistance at 13378.95 where the overlap resistance, 38.2% fibonacci retracement and 61.8% fibonacci projection.
Areas of consideration:
- H4 time frame, 1st resistance of 13378.95
- H4 time frame, 1st support at 13025.67
ETHUSD:
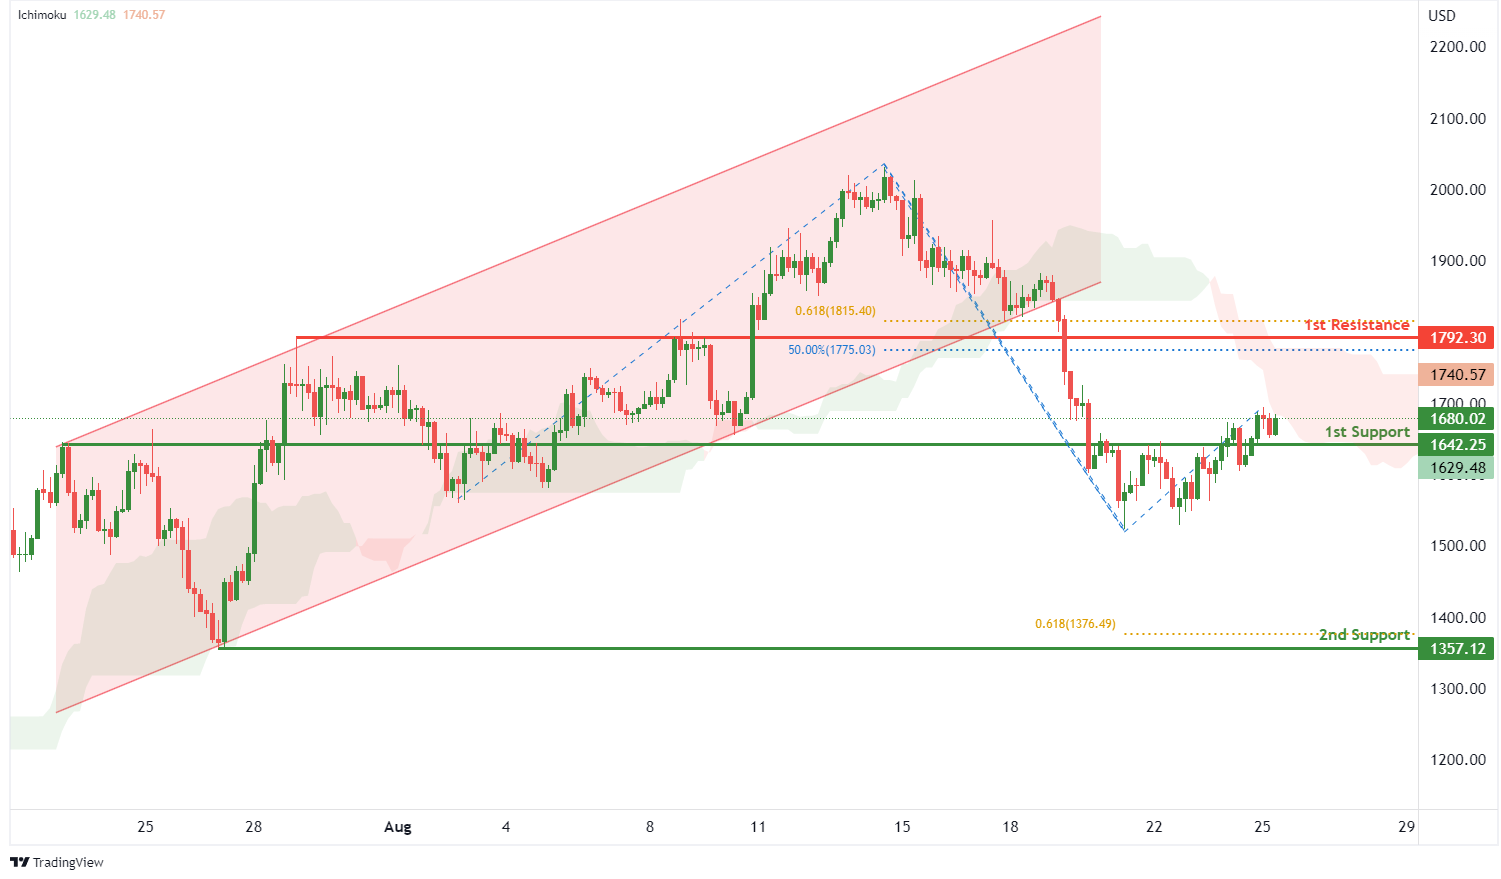
On the H4, with price breaking out of an ascending channel and moving below the ichimoku indicator, we have a bearish bias that price will drop to the 1st support at 1642.25 where the pullback support is. Once there is downside confirmation that price has broken 1st support, we would expect bearish momentum to carry price to 2nd support at 1357.12 where the swing low support and 61.8% fibonacci projection are. Alternatively, price could rise to 1st resistance at 1792.30 where the overlap resistance, 50% fibonacci retracement and 61.8% fibonacci projection are.
Areas of consideration:
- H4 time frame, 1st resistance of 1792.30
- H4 time frame, 1st support at 1642.25
BTCUSD:
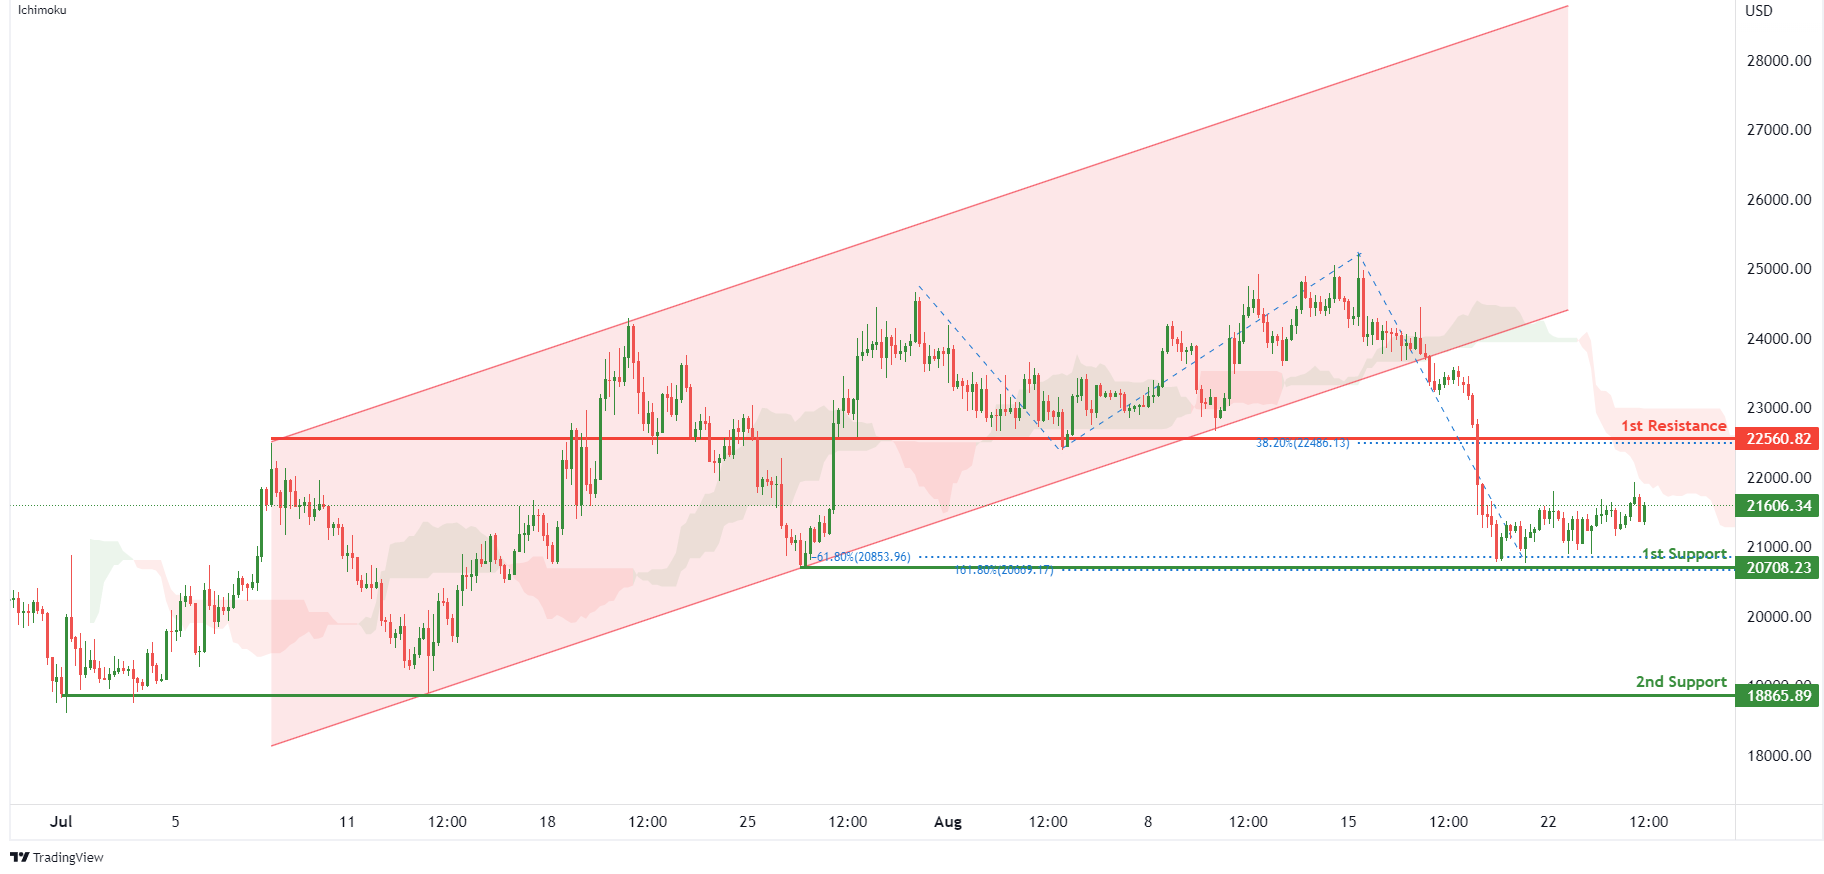
On the H4, with price breaking out of a bullish channel and moving below the ichimoku indicator, we have a bearish bias that price will drop to 1st support at 20708.23 where the -61.8% fibonacci expansion, 161.8% fibonacci extension and swing low support are. Once we have downside confirmation of price breaking 1st support structure,we would expect bearish momentum to carry price to 2nd support at 18865.89 where the swing low support is. Alternatively, price could rise to 1st resistance at 22560.82 where the pullback resistance and 38.2% fibonacci retracement are.
Areas of consideration:
- H4 time frame, 1st resistance of 22560.82
- H4 time frame, 1st support at 20708.23
S&P 500:
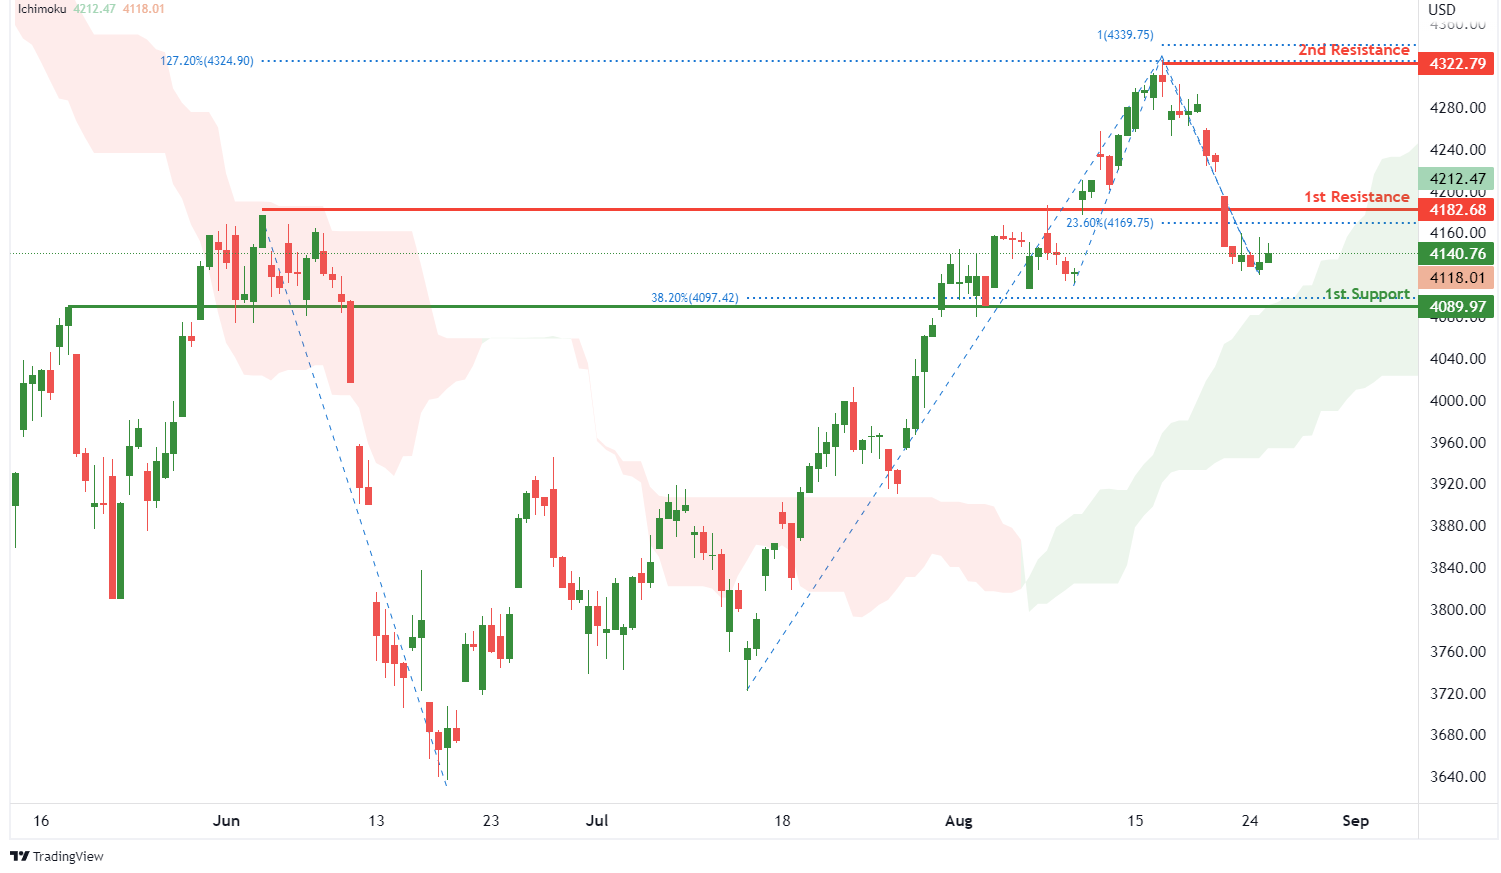
On the H4, with prices moving above the ichimoku indicator, we have a bullish bias that the price will rise to 1st resistance at 4182.68 where the pullback resistance and 23.6% fibonacci retracement are. Once there is upside confirmation of price breaking 1st resistance structure, we would expect bullish momentum to carry price to 2nd resistance at 4322.79 where the swing high resistance, 100% fibonacci projection and 127.2% fibonacci extension are. Alternatively, price could drop to 1st support at 4089.97 where the pullback support and 38.2% fibonacci retracement are.
Areas of consideration:
- H4 time frame, 1st resistance of 4182.68
- H4 time frame, 1st support at 4089.97
USD/CAD Eyes More Gains, US GDP Next
Key Highlights
- USD/CAD gained pace and tested the 1.3060 resistance zone.
- A major bullish trend line is forming with support near 1.2965 on the 4-hours chart.
- EUR/USD and GBP/USD remain at a risk of more downsides.
- The US GDP could contract 0.8% in Q2 2022 (Preliminary).
USD/CAD Technical Analysis
The US Dollar formed a base above the 1.2740 level against the Canadian Dollar. USD/CAD climbed above the 1.2880 and 1.2900 resistance levels to move into a positive zone.
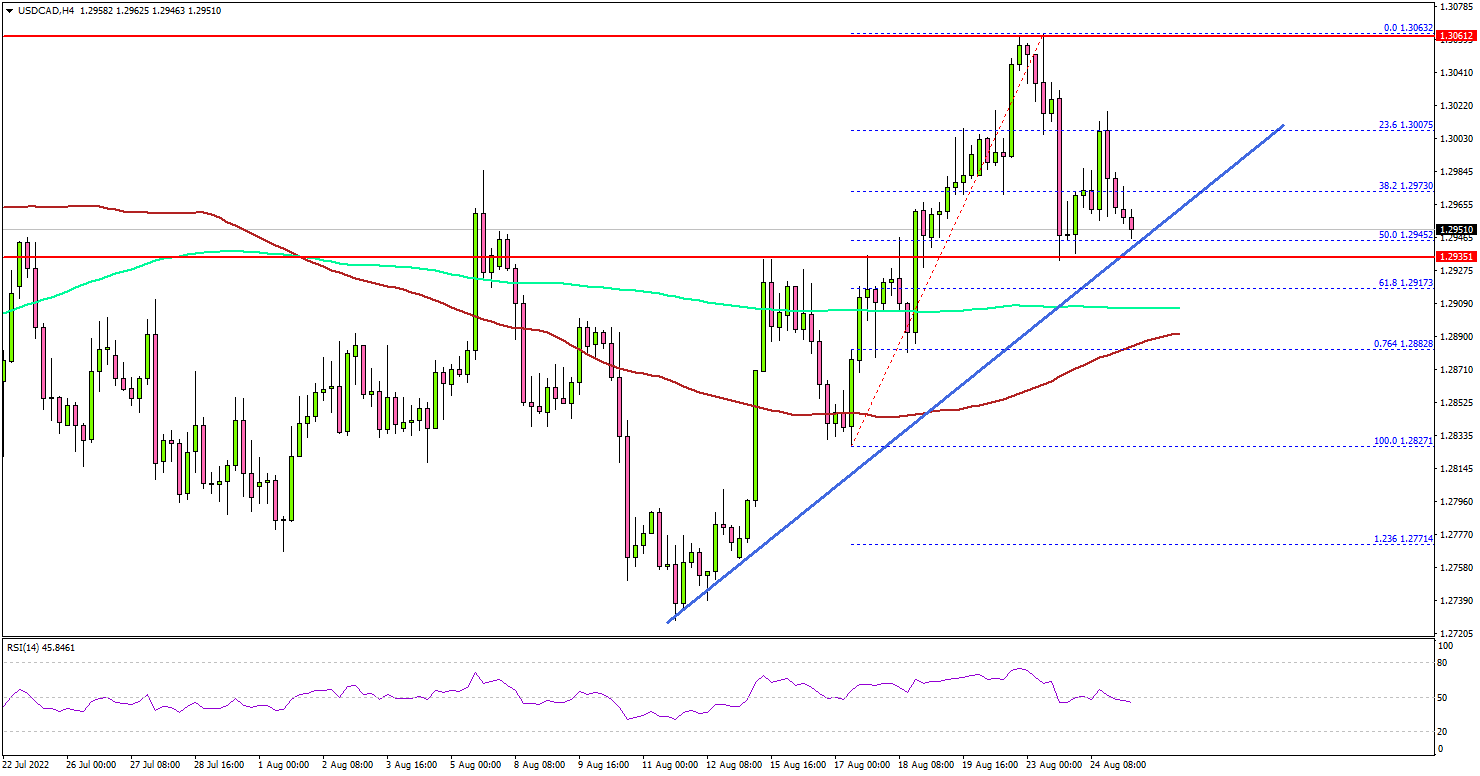
Looking at the 4-hours chart, the pair settled above the 1.2900 zone, the 100 simple moving average (red, 4-hours), and the 200 simple moving average (green, 4-hours). The pair even broke the 1.3000 resistance zone.
However, the bears were active near the 1.3060 zone. A high was formed near 1.3063 and the pair started a downside correction. There was a move below the 1.3000 support.
The pair even traded below 1.2980, but the bulls were active above 1.2950. There is also a major bullish trend line forming with support near 1.2965 on the same chart. If there is a downside break below the trend line, the pair could decline towards the 1.2880 support and the 100 simple moving average (red, 4-hours).
Conversely, the pair might rise again above 1.3040. On the upside, the pair is facing resistance near the 1.3060 level. The next major resistance is near the 1.3120 level. A clear move above the 1.3120 resistance might send the pair higher towards the 1.3200 level.
Looking at EUR/USD, the pair remained below the parity level and might extend losses below 0.9900. Similarly, GBP/USD might dive below the 1.1720 support.
Economic Releases
- German IFO Business Climate Index for August 2022 – Forecast 86.8, versus 88.6 previous.
- US Gross Domestic Product Q2 2022 (Preliminary) – Forecast -0.8% versus previous -0.9%.
- US Initial Jobless Claims - Forecast 253K, versus 250K previous.
- Jackson Hole Symposium.
EURAUD Wave Analysis
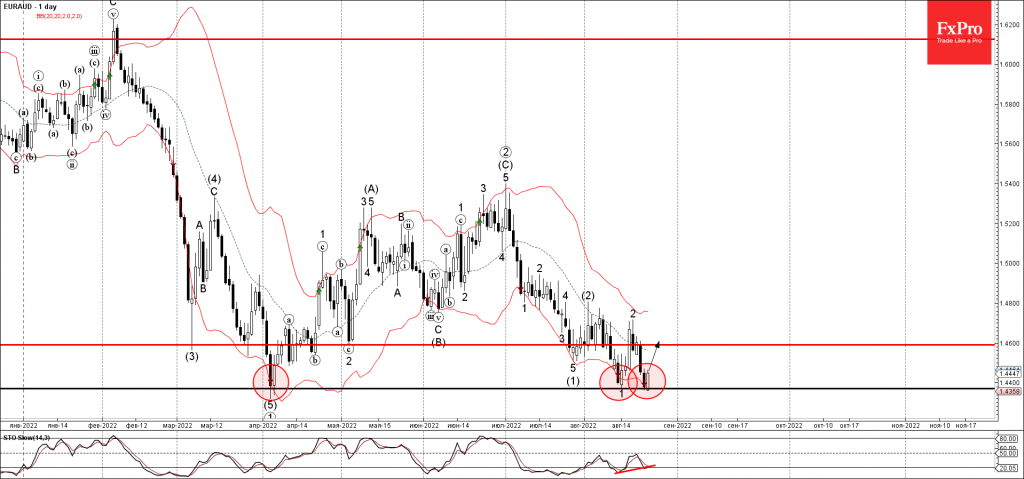
- EURAUD reversed from support level 1.4370
- Likely to rise to resistance level 1.4600
EURAUD currency pair recently reversed up from the support level 1.4370 (which stopped the sharp downtrend in April) intersecting with the lower daily Bollinger Band.
The upward reversal from the support level 1.4370.10 stopped the previous short-term downward impulse wave 3, which belongs to wave (3) from the start of August.
Given the clear bullish divergence on the daily Stochastic, EURAUD currency can be expected to rise further toward the next resistance level 1.4600.
AUDNZD Wave Analysis
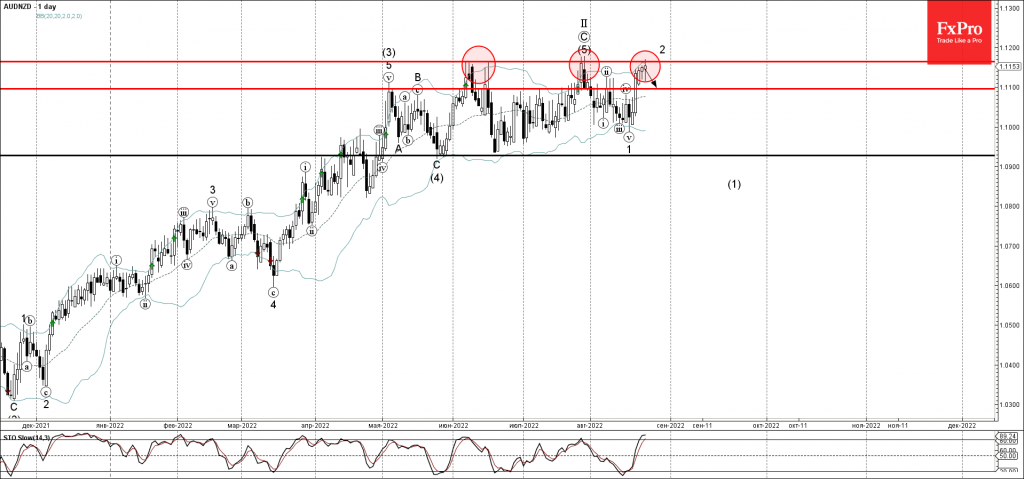
- AUDNZD reversed from resistance level 1.1165
- Likely to fall to support level 1.1100
AUDNZD currency pair is currently testing the resistance level 1.1165 (which has been steadily reversing the price from the start of June), strengthened by the upper daily Bollinger Band.
The downward reversal from the resistance level 1.1165 will stop the previous short-term upward correction 2.
Given the strength of the resistance level 1.1165 and the overbought reading on the daily Stochastic indicator, AUDNZD currency can be expected to fall further toward the next support level 1.1100.
Eco Data 8/25/22
[php_everywhere instance="1"]
ETHUSD Aims for Recovery as 50-day SMA Caps Decline
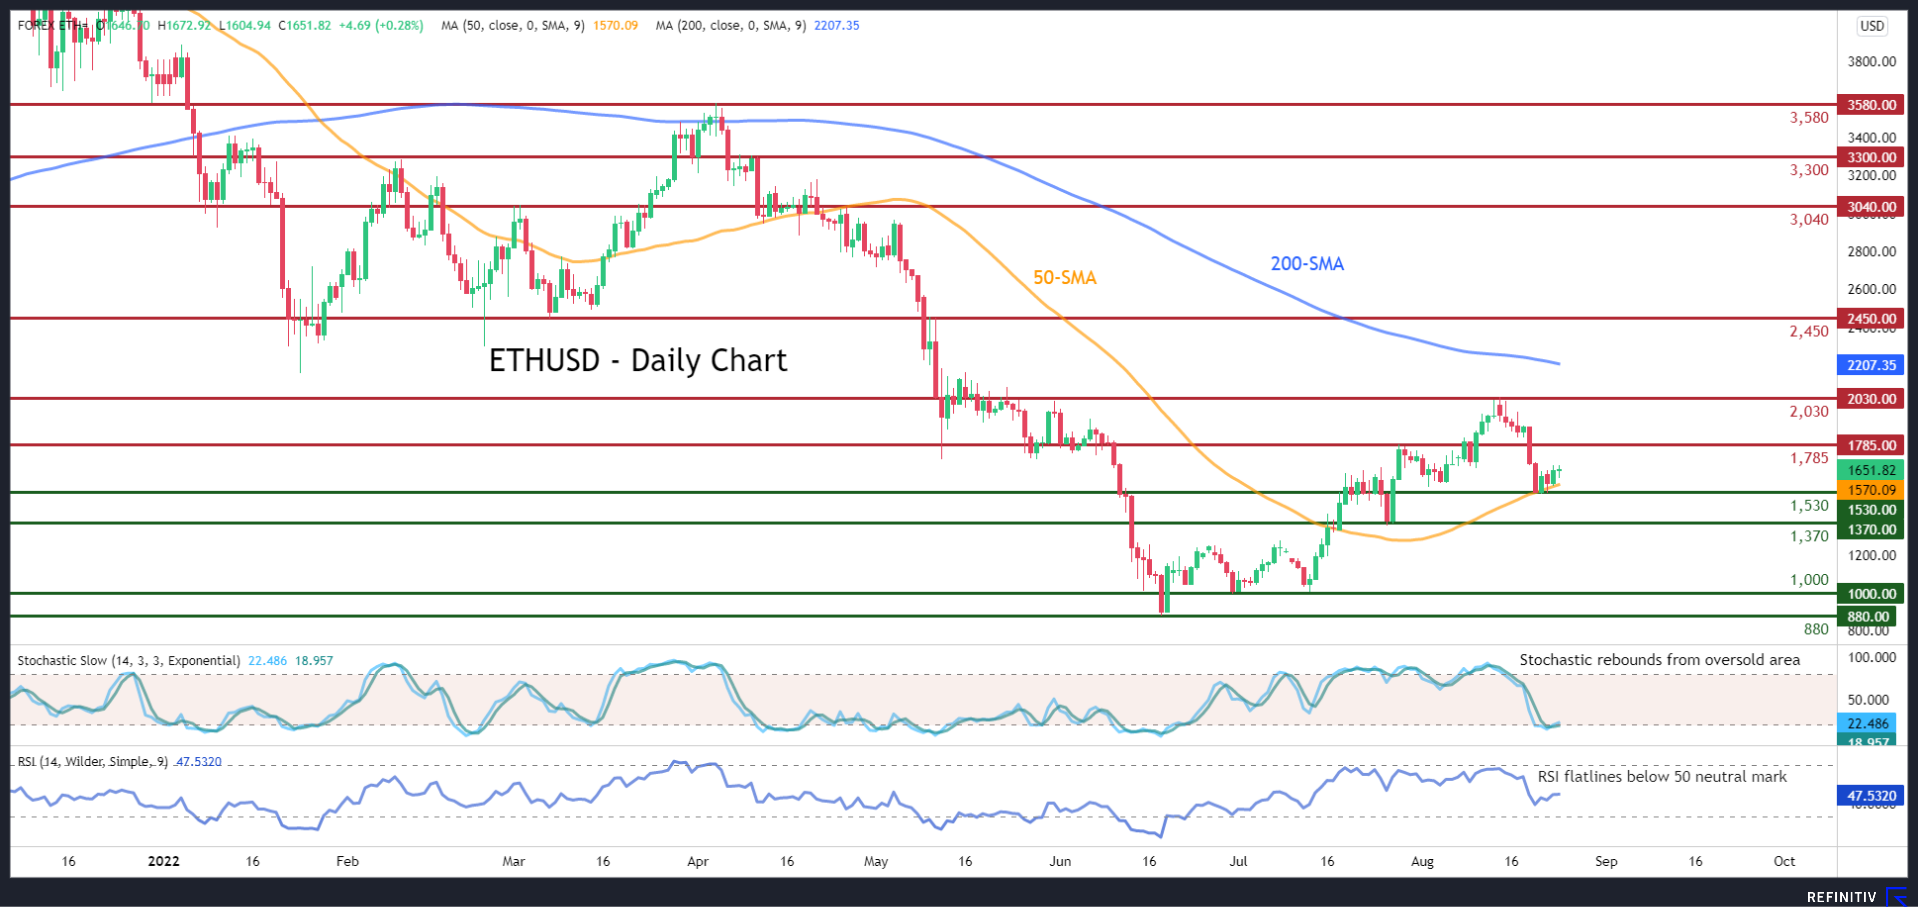
ETHUSD (Ethereum) has been experiencing a downside correction after its short-term uptrend failed to cross above the 2,030 region. However, the cryptocurrency found strong support at its 50-day simple moving average (SMA) and is currently attempting to rebound.
The momentum indicators suggest that bullish forces are gaining strength but risks remain tilted to the downside. Specifically, the stochastic oscillator is ascending after rebounding from the 20-oversold zone, while the RSI’s advance paused before reaching the 50-neutral mark.
Should buying pressure intensify, the price could encounter initial resistance at the 1,785 barrier. Piercing through this region, the bulls could aim for the recent peak of 2,030 before the spotlight shifts to 2,450. Even higher, the 3,040 hurdle, which has acted both as resistance and support, could come under examination.
On the flipside, if the price enters a new declining phase, the recent reversal point of 1,530 may act as the first line of defence. Sliding beneath that floor, the August support of 1,370 could be the next obstacle for the bulls to overcome. Failing to halt there, the crucial 1,000 psychological mark might cease any further declines.
Overall, even though ETHUSD has experienced a slight retracement its bullish short-term picture remains intact. Therefore, for the recovery to resume, the price needs to initially jump above the 2,030 ceiling.
GBPAUD Breaks Back Below the Lower End of a Range
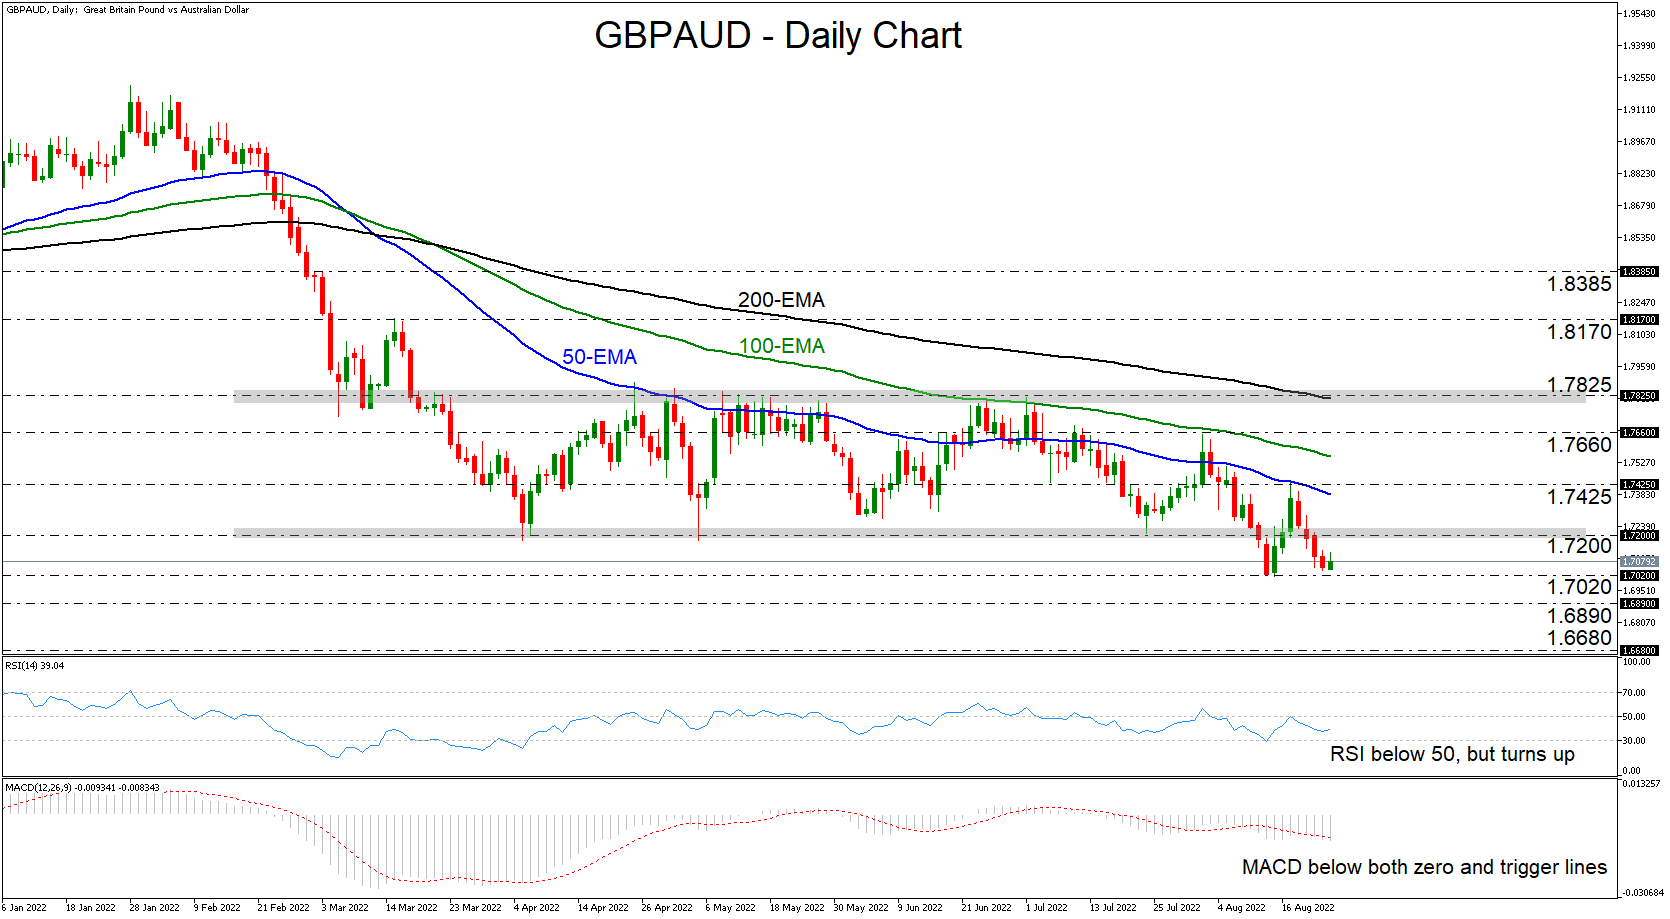
GBPAUD came under selling interest after it hit resistance at the crossroads of the 1.7425 level and the 50- exponential moving average (EMA) on August 17. The slide took the pair below the 1.7200 barrier, which acted as the lower bound of the sideways range it had been trading within between March 18 and August 11. This implies that the bears are not willing to give up any time soon.
Both the daily oscillators detect downside speed, adding to the notion of further declines. The RSI lies below 50, while the MACD runs below both its zero and trigger lines, pointing down. That said, the RSI has ticked up today, which raises the risk of a possible bounce before the next leg south.
A clear and decisive break below 1.7020, marked by the lows of August 12 and 15, would confirm a lower low and may encourage declines towards the 1.6890 level, marked by the low of November 2, 2017. If the bears are not willing to stop there either, a dive towards the 1.6680 area may be possible. That zone attracted the buyers back on October 20, 2017.
The outlook may start turning bullish upon a break above 1.7825, the upper boundary of the aforementioned range. A breach of that zone could see scope for advances towards the March 15 high of 1.8170, the break of which may pave the way towards the 1.8385 area, defined as a resistance by the inside swing low of December 9 and the high of March 3.
All in all, GBPAUD slid back below the lower bound of a medium-term sideways range, which paints a negative picture. However, the move that could increase the likelihood of more declines may be a dip below 1.7020.
GBP/USD: Pound May Fall Further if Conditions Continue to Weaken
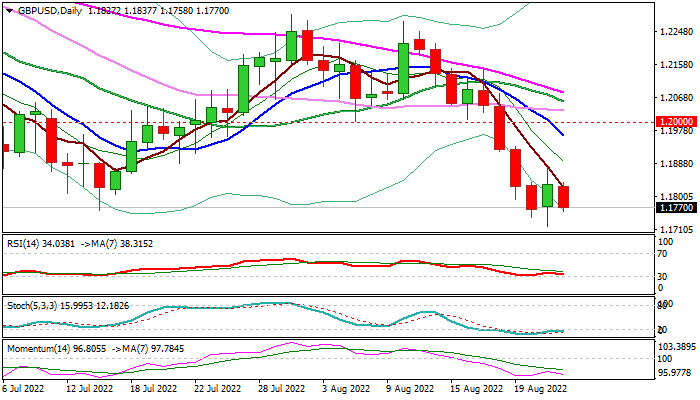
Cable returned to red after limited bounce on Tuesday, sparked by downbeat US data, signaling that short consolidation is likely to precede fresh push lower.
Initial negative signal on break below 2022 low (1.1760) that hit new lowest since March 2020 (1.1717), needs confirmation on repeated close below 1.1760 pivot and open way for continuation of a bear-phase from 1.2293/76 double-top.
Sterling remains heavily pressured by surging inflation which already hit a double-digit value and forecast show it may rise to 18% next year, built on the base of a massive amounts of money pumped in the economy to keep it afloat during coronavirus pandemic.
Soaring inflation undermined a pillars of the households – housing market and a cost of living that is likely to drive the pound lower, as economic activity is slowing sharply and bringing the economy into conditions last seen during 2008 recession.
Below 1.1760, bears see no significant obstacles en-route towards pandemic low at 1.1410, with increased risk of stronger bearish acceleration if current situation deteriorates that can not be ruled out.
The upside so far remains well protected and only sustained break above 1.20 zone (psychological / base of thick daily cloud) would be a game changer.
Res: 1.1837; 1.1877; 1.1916; 1.1963.
Sup: 1.1717; 1.1700; 1.1634; 1.1556.