Sample Category Title
NZ Dollar Soars on China Stimulus Plan
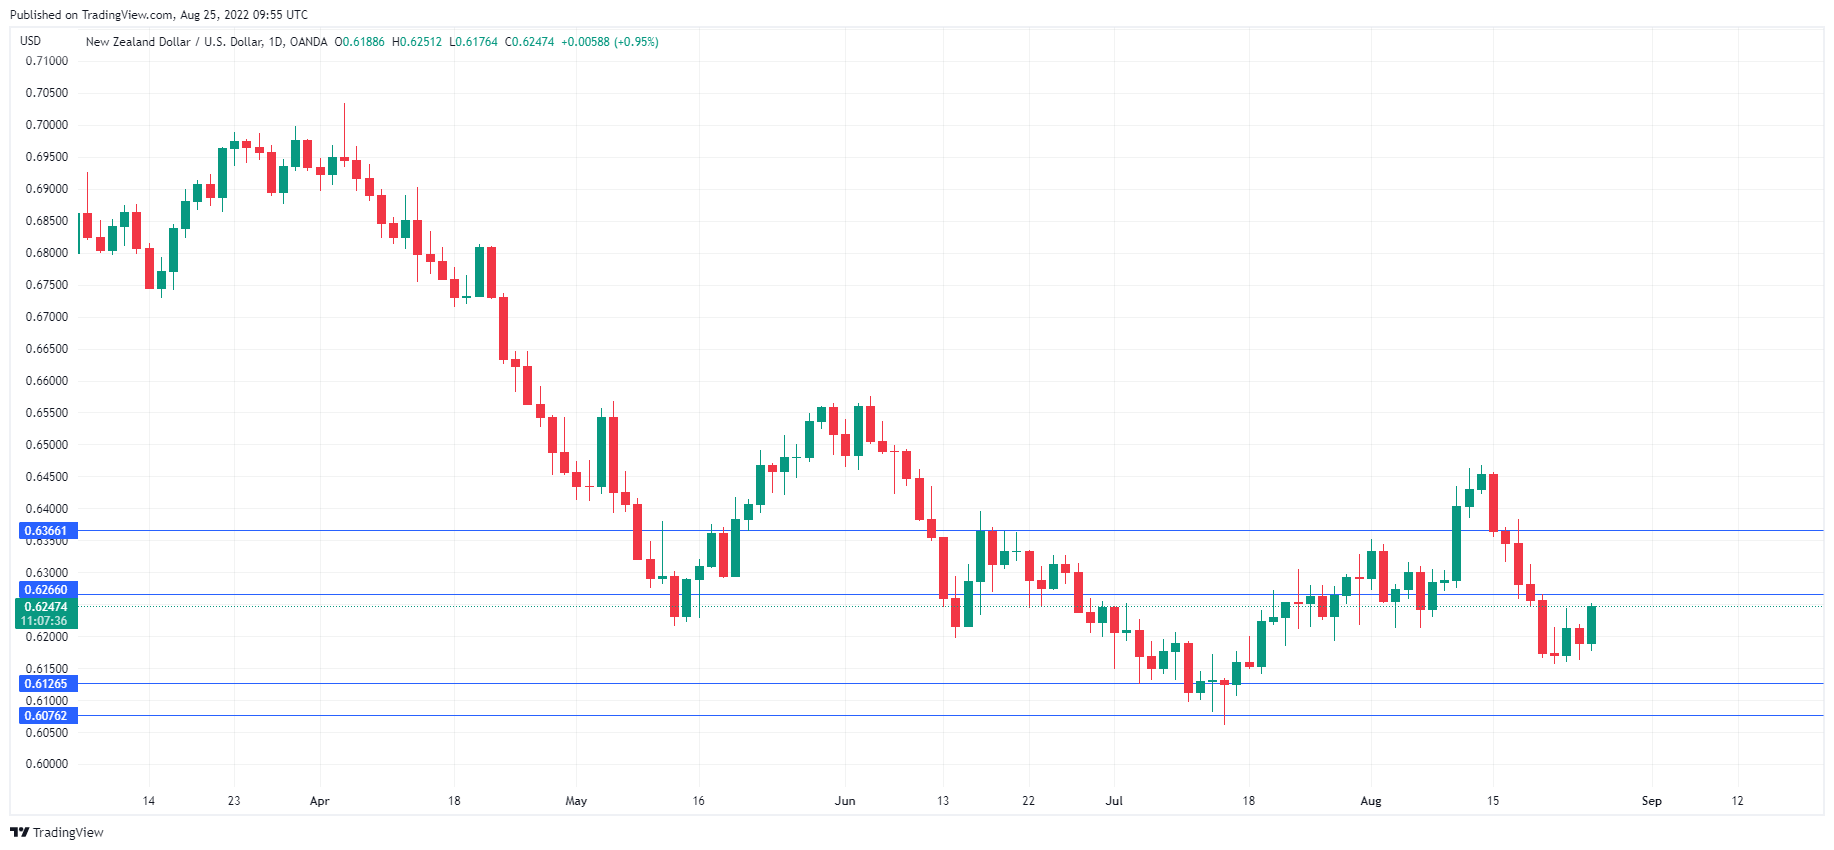
NZD/USD has climbed sharply today. In the European session, NZD/USD is trading at 0.6247, up 0.95% on the day.
China announces stimulus
The New Zealand dollar received a welcome boost from China, which announced a 19-point policy package to stimulate economic growth. The world’s second-largest economy has been dragged down by its strict zero-Covid stance, which included lockdowns in Shanghai and elsewhere. The global slowdown triggered by the Russian invasion of Ukraine as made things even worse. China’s GDP rose just 0.4% in Q2, and this has hurt New Zealand’s economy, with 1/3 of its exports going to China. However, the Chinese government has responded with stimulus measures. Earlier in August, the People’s Bank of China lowered interest rates on lending facilities and the latest announcement will pour 1 trillion yuan ($146 billion) into infrastructure and other programs. If the Chinese economy can get back on track, it will be good news for the New Zealand economy and the kiwi.
Investors gave a thumbs-up to the New Zealand dollar after China’s stimulus announcement, shrugging off a dismal retail sales report for the second quarter. After a -0.9% in Q1, the markets had forecast a strong rebound of 1.7%. Instead, retail sales slid to -2.3%, as consumers continue to cut back on spending. Higher interest rates and rising inflation have hammered consumers who are pessimistic about the economic outlook. Consumer spending is a key driver of the economy, and if GDP for Q2 is negative, it would mark a second straight quarter of negative growth, which would mean that technically the economy has been in a recession for the first half of the year.
The New Zealand dollar has been very active this week, and there could be more drama to come, with RBNZ Governor Orr addressing the Jackson Hole Symposium today and Fed Chair Powell on Friday. Investors will be listening carefully and both speeches should be treated as market-movers for NZD/USD.
NZD/USD Technical
- 0.6266 is under pressure in resistance. 0.6366 is the next line of resistance
- There is support at 0.6126 and 0.6075
What Will Happen at the Jackson Hole Symposium?
The markets are waiting with bated breath for what Fed Chair Powell will say during his presentation at the Jackson Hole Symposium. The event starts today and lasts through Saturday, with a host of speakers that could all shake up the markets a little bit. But the star of the show will definitely be Powell's speech, tentatively scheduled for Friday.
The conflicting views
The thing is, there are two options that could come from Powell's speech, and both could be pivotal for how the markets behave for the next month. And there are few indicators to incline expectations in favor of one or the other, so when he speaks, there could be a pretty strong reaction in the market.
The first part is that as the Fed has been aggressively hiking, at some point the pace is going to have to first moderate. After that would be stopping the tightening, and then presumably loosening policy. This process is known as the Fed "pivot".
Figuring out what he'll say
Several Fed officials have said they believe that interest rates are getting near the neutral rate, which we discussed yesterday. The Symposium offers an excellent platform to start giving the markets the idea that tightening is about to come to an end. Jackson Hole has been the setting for these changes in the past, so there is certainly the element of precedent.
On the other hand, Powell might take a completely different tactic. In the past, he has shown he believes that inflation is guided by the "credibility" of central banks to fight inflation. This is a common notion among central bankers these days and is likely shared by many other members of the FOMC.
Explaining the comments
This is probably why so many came out over the last couple of weeks to insist that the Fed will keep hiking rates, even at the risk of a recession. The idea is that if the market thinks the Fed will vacillate in its fight against higher prices, then prices will keep going up. Therefore, it's important to maintain the "credibility" of the Fed by insisting that it will keep raising rates.
It's unlikely that there will be an indication of how much the Fed will raise at the next meeting. Since CPI figures come out in the black-out period ahead of the meeting, it's unlikely the Fed really knows at this point whether 50bps or 75pbs is appropriate.
The potential market reaction
The issue at play is whether the Fed will keep hiking for the rest of the year, or will "top" sometime before that. The market appears to be pricing in the latter scenario, even expecting rate cuts in the first quarter of next year. This in response to the majority of economists forecasting an official recession in 2023.
If Powell insists that rates will keep rising, then that could push expectations for the "pivot" forward, and be considered a risk-off event. On the other hand, if Powell talks about moderating the pace of rates, this could be seen as a risk-on opportunity.
Daily Technical Analysis
EUR/USD
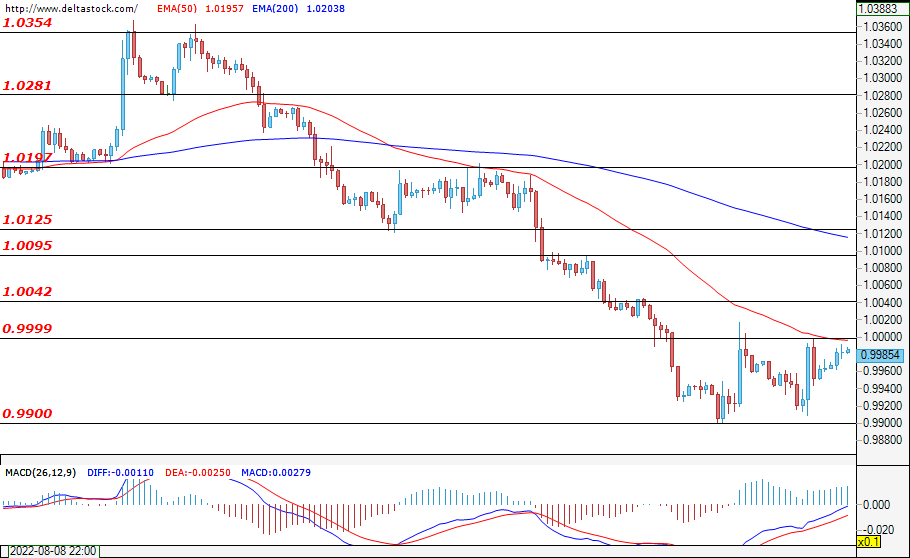
During the past session, the movement of the currency pair remained in a narrow range between the support at 0.9901 and the resistance at 0.9999. The long-term downtrend is probably not over yet, even though the upper limit of the range was reached. A potential breakout and a test of the next target — the resistance at 1.0042 — could be a signal that the bulls are trying to get back into the market. If the price fails to hold above the support at 0.9901, then we may witness yet another depreciation of the euro against the dollar towards the levels from 20 years ago. Important data that may have an impact on the market is the IFO business climate report for Germany (08:00 GMT) and the initial jobless claims numbers for the U.S. (12:30 GMT).
USD/JPY
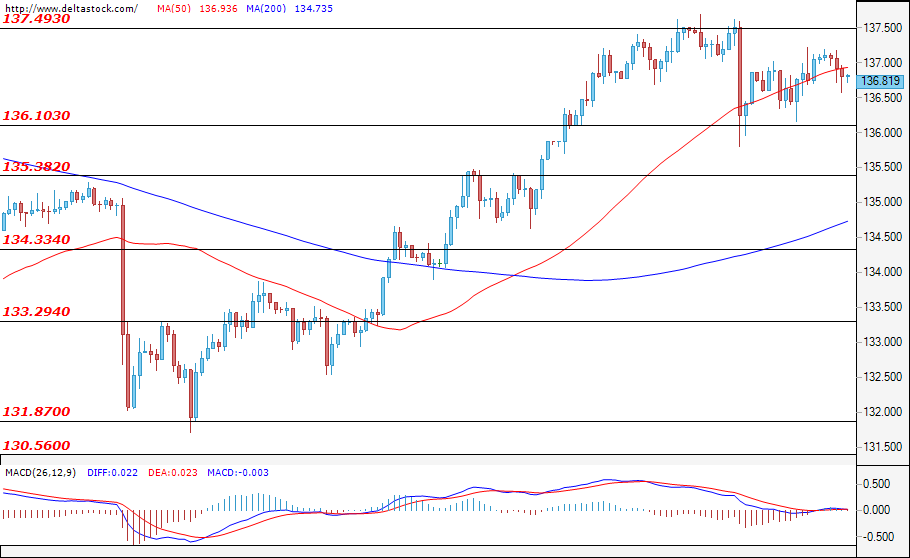
The consolidating movement of the currency pair between the support at 136.10 and the resistance at 137.49 continued during the past trading session and the beginning of the new one. The bulls are currently in control of the market and a successful breach of the 137.49 level would likely not surprise anyone. Conversely, if the support at 136.10 is breached, then this would pave the way for the bears to reach the next zone at 135.38, where the bulls should intervene and fight them off.
GBP/USD
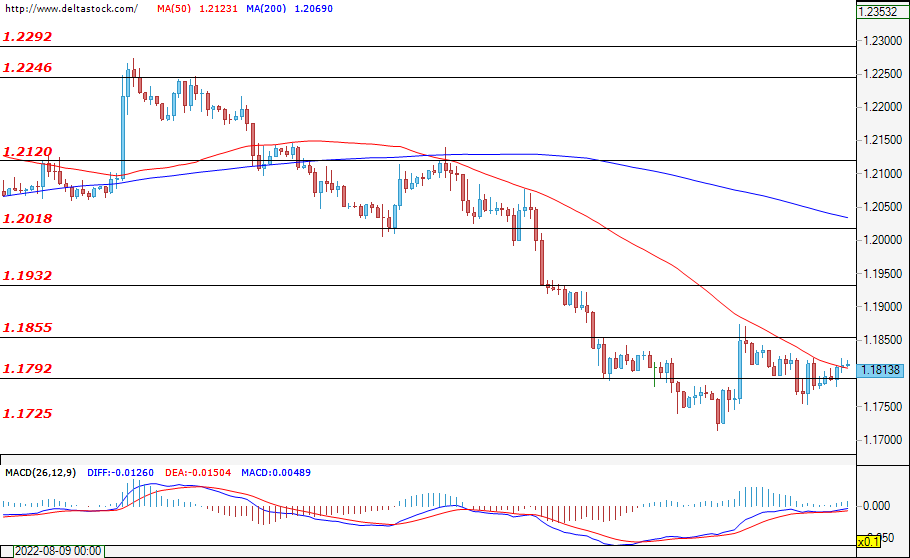
Trading in the past session was calm and for now the price of the currency pair manages to hold above the support at 1.1792. We may see a range move and a retracement towards the resistance at 1.1855. However, the bears have settled permanently in the market, and so if the level at 1.1792 does not hold, then the next support at 1.1407 would be easily reached as well. A signal that the bulls may return to the market for a longer time period would be a breach of both resistances at 1.1932 and at 1.2018.
EUGERMANY40
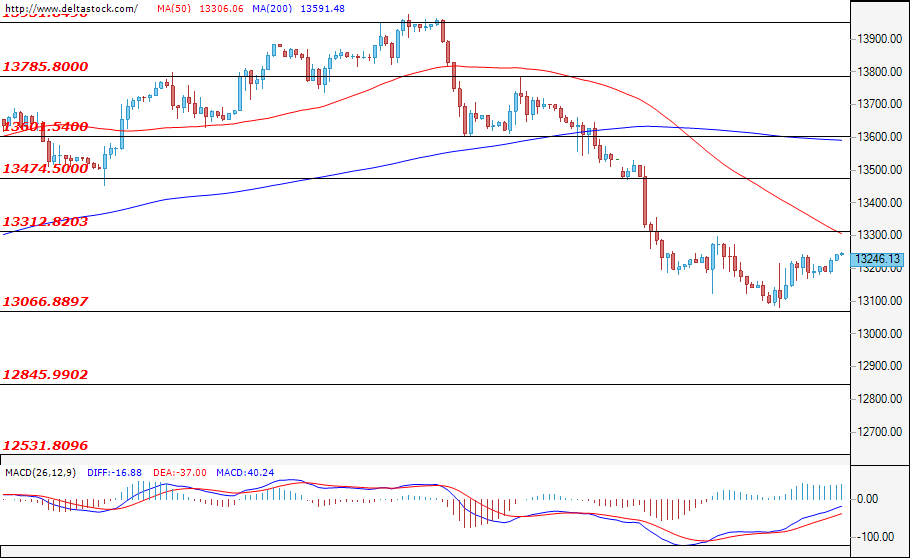
During the past session, the price of the German index consolidated in the range between the levels of 13066 and 13312. If the bears manage to overcome the supports at 13066 and at 12844, then it is possible to see a return of the negative trend. However, if the resistance at 13312 is overcome, then the next target for the bulls would be the level of 13474. Important data that may influence the market today is the aforementioned IFO business climate report for Germany and the unemployment claims data for the U.S.
US30
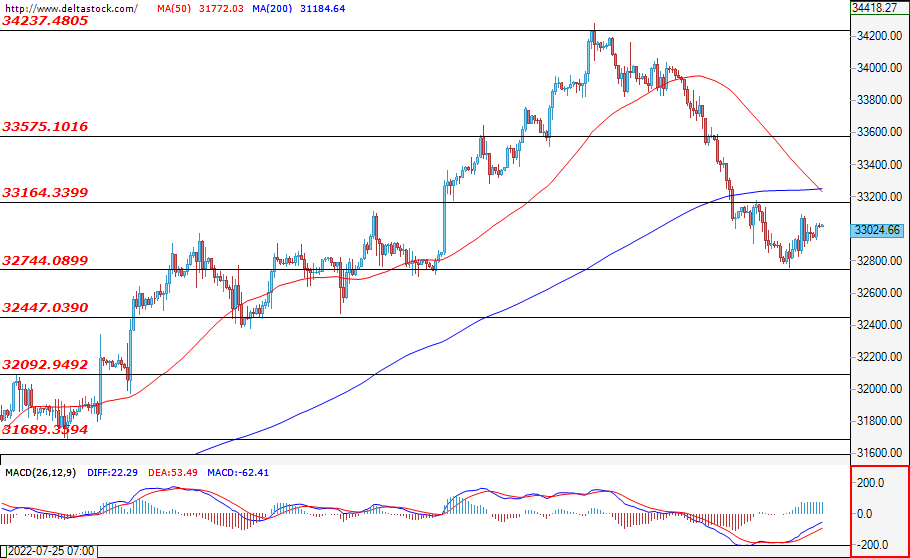
The U.S. blue-chip index managed to hold above the important support at 32742 and the bulls will likely have a new target — the level of 33176. However, we should not completely rule out the possibility of the bears returning to the market as well. This, however, could only happen if the support levels at 32742 and at 32454 are both breached.
BTCUSD Regains Ground after Sharp Drop
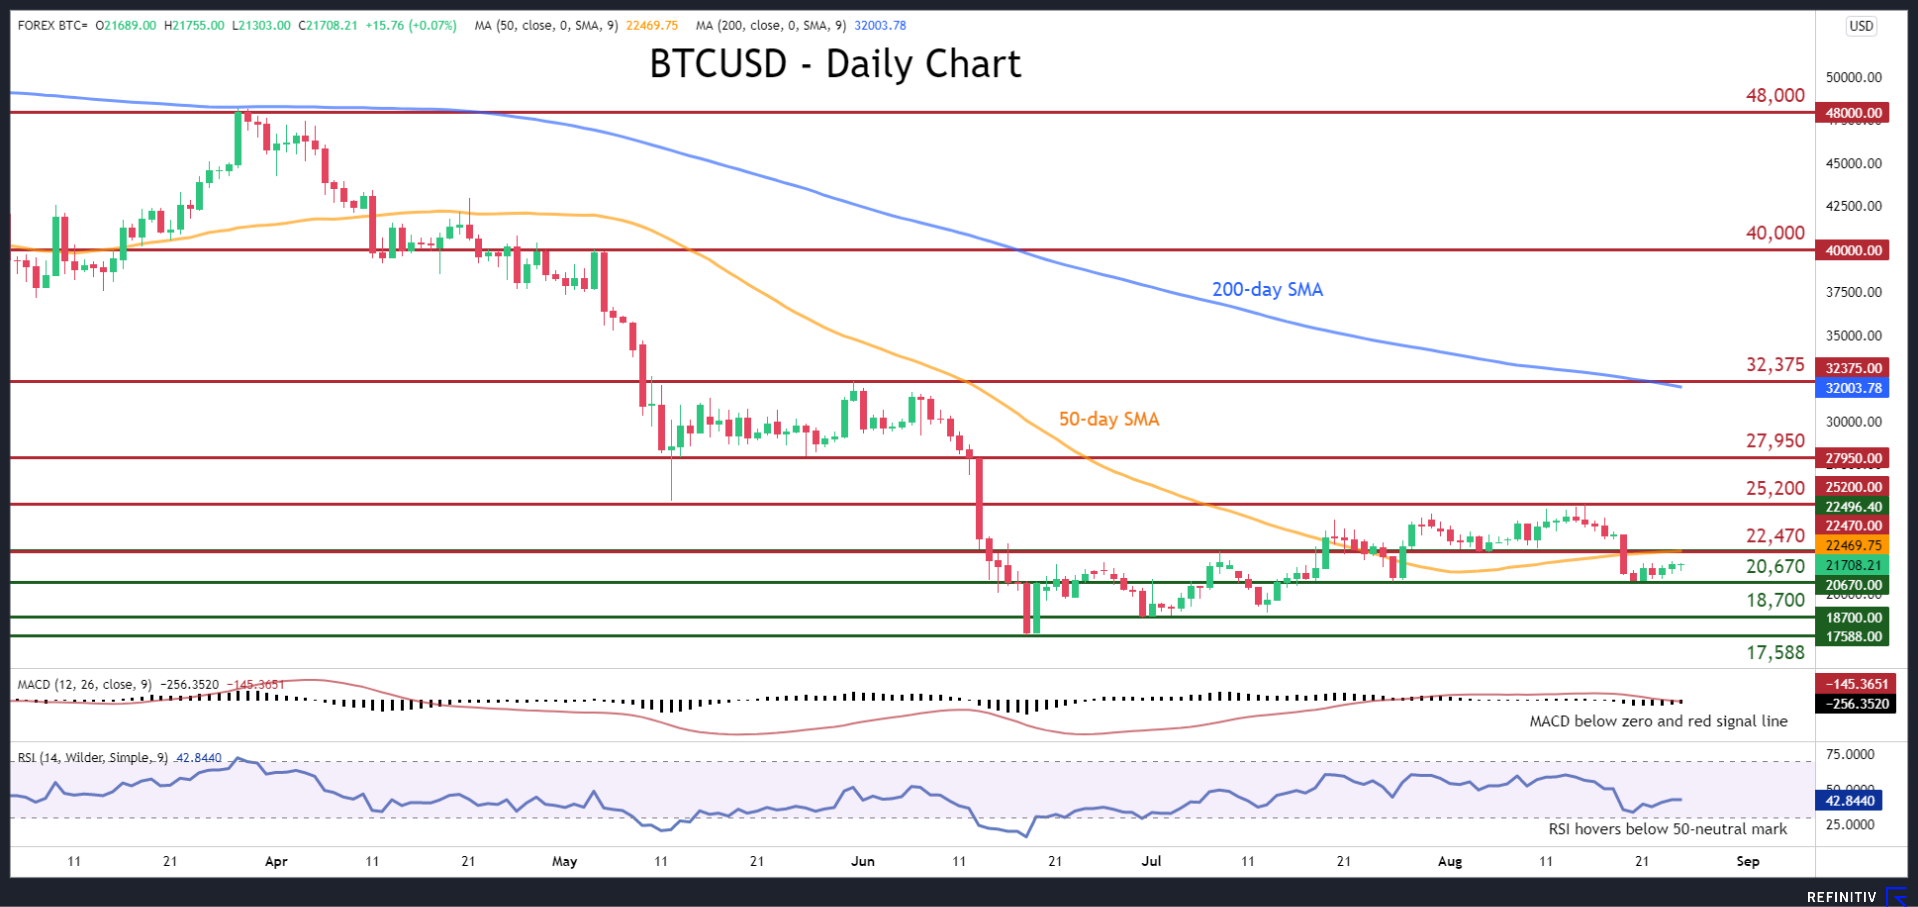
BTCUSD (Bitcoin) has been experiencing a downside correction after its recent advance failed to jump above the 25,200 barrier. Although the cryptocurrency managed to find its feet and recoup some losses in the last few daily sessions, it is still trading beneath its 50-day simple moving average (SMA).
The short-term oscillators currently suggest that bearish forces are in control. Specifically, the MACD histogram is currently below both zero and red signal line, while the RSI is hovering below its 50-neutral mark.
Should selling pressures intensify, the price could encounter initial support at the recent low of 20,670. Diving beneath that region, the spotlight may turn to the 18,700 barrier. A violation of the latter could open the door for the 20-month low of 17,588.
To the upside, if buyers regain control and propel the price higher, the 50-day SMA currently at 22,470 could act as the first resistance region. Conquering this barricade, further upside moves might stall at the recent rejection point of 25,200 before 27,950 comes under examination. Even higher, the May peak of 32,375 could prove to be a tough obstacle for the price to overcome.
Overall, BTCUSD appears to be gaining some strength, but its short-term picture remains bearish. For that to alter, the price needs to initially close above the 50-day SMA.
WTI Oil: Extended Recovery Tests Pivotal 200DMA Resistance
WTI oil extends rebound from seven-month low and hits three-week high on Thursday, after receiving fresh boost from signals that OPEC+ cartel is willing to cut production and significantly stronger than expected drop in the US crude inventories that added to persisting supply concerns.
Saudi Arabia’s energy minister said that production cut will support prices, with Iran exports still being halted due to nuclear program talks, adding to the sentiment, though analysts think that even Iran’s return to the market would have limited impact, as oil market will remain tight, following cut of Russian supply on sanctions.
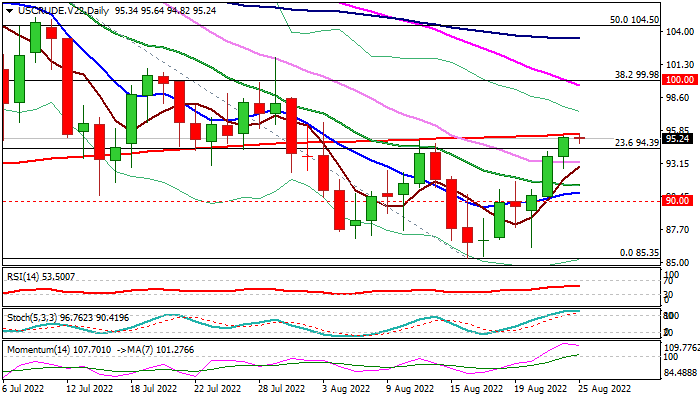
Recovery tests key barrier at $95.61 (200DMA) and faces strong headwinds here, signaled by overbought stochastic and fading bullish momentum on daily chart.
If recovery stalls here that would signal that correction is likely over and keep larger bears intact for fresh push lower, with return below $90 to confirm the action.
Violation of 200DMA, on the other hand, would further weaken larger bearish structure and open way for stronger correction, with lift above $100 (psychological / Fibo 38.2% of $123.65/$85.35) to add to bullish signals.
Res: 95.61; 96.54; 97.45; 99.58.
Sup: 94.39; 93.31; 91.34; 90.75.
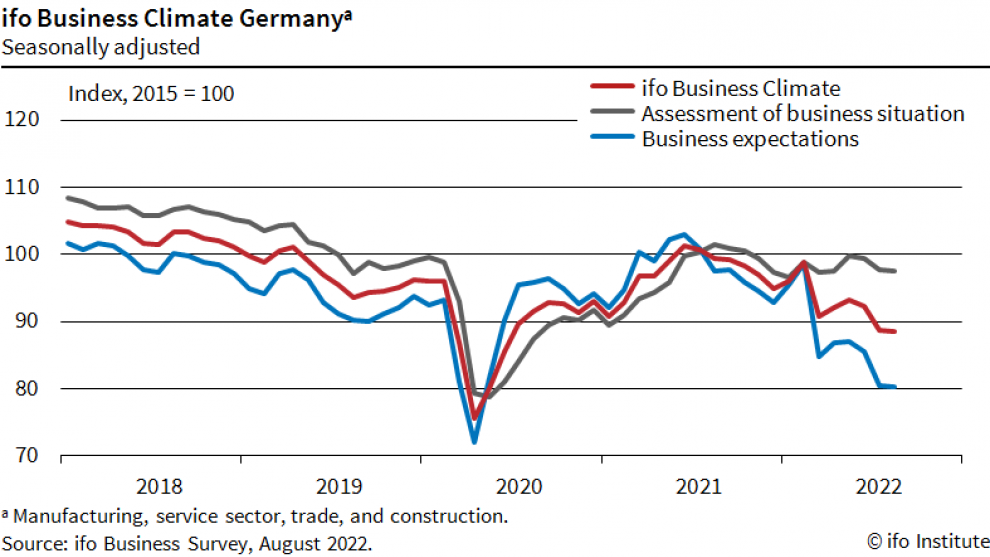
Germany Ifo Business Climate ticked down to 88.5, trade deteriorates further
Germany Ifo Business Climate dropped slightly from 88.7 to 88.5 in August, above expectation of 86.7. Current Assessment index ticked down from 97.7 to 97.5. Expectations Index also edged down from 80.4 to 80.3.
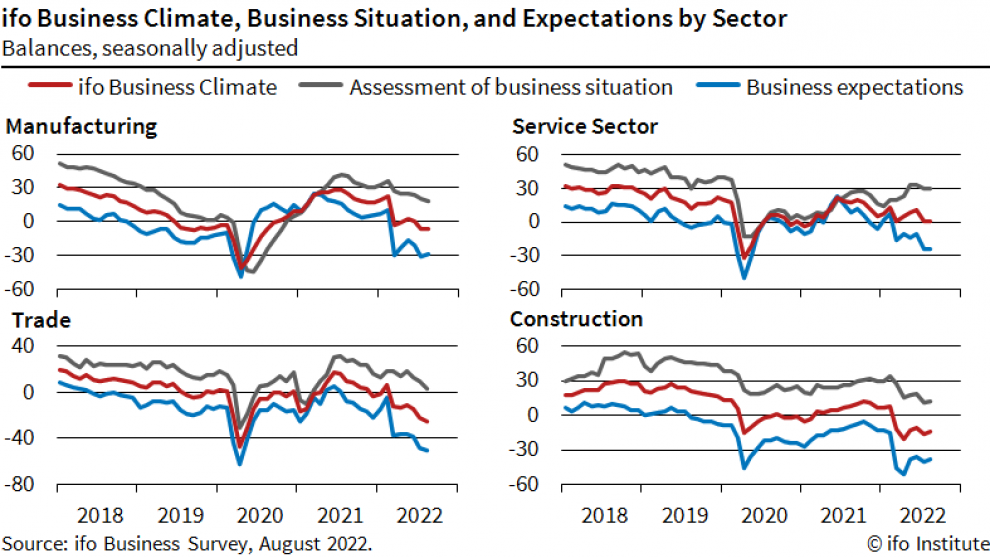
By sector, manufacturing was unchanged at -6.9. Services rose from 1.0 to 1.3. Trade dropped further from -21.6 to -25.8. Constructions improved from -16.2 to -14.5.
Ifo said, "uncertainty among the companies remains high, and the German economy as a whole is expected to shrink in the third quarter."
For trade, Ifo said that "many enterprises are facing a dilemma: high inflation is dragging down their business, but they can hardly avoid raising prices due to increased costs."
GBP/JPY Daily Outlook
Daily Pivots: (S1) 161.11; (P) 161.51; (R1) 162.17; More...
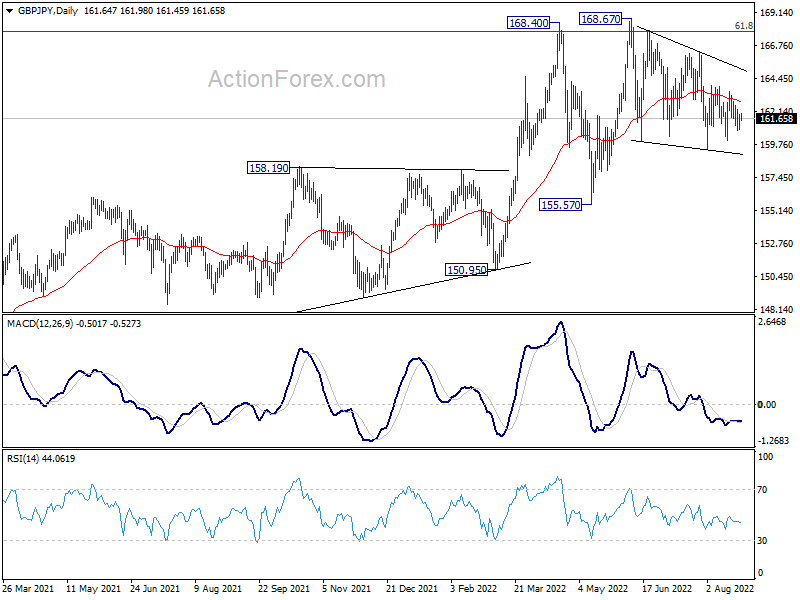
Range trading continues in GBP/JPY and intraday bias remains neutral. Corrective pattern from 168.67 would extend for a while. On the upside, break of 163.91 will bring stronger rise to 166.31 resistance. On the downside, below 160.07 will turn bias to the downside for 159.42 and below.
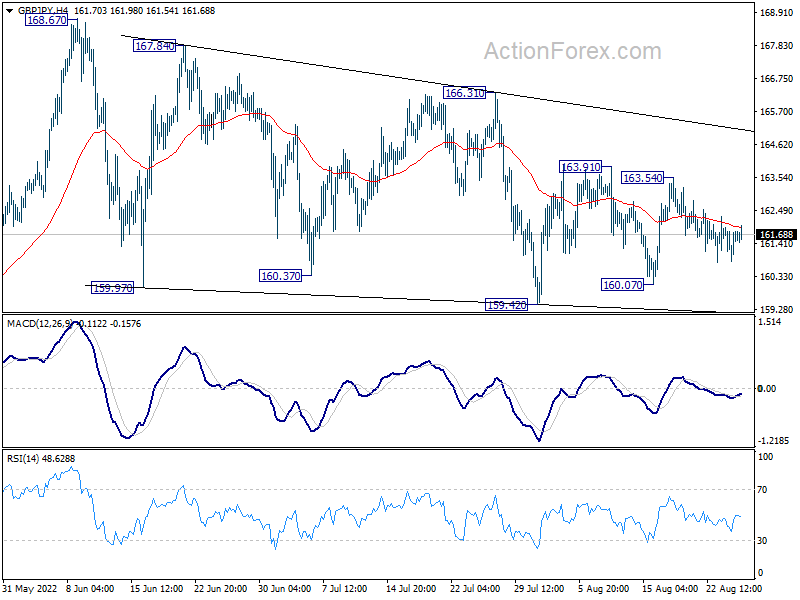
In the bigger picture, up trend from 123.94 (2020 low) is still in progress. Sustained break of 61.8% retracement of 195.86 (2015 high) to 122.75 (2016 low) at 167.93 will be a long term bullish signal, and could pave the way back to 195.86 high. This will remain the favored case as long as 155.57 support holds, even in case of deep pull back.
EUR/JPY Daily Outlook
Daily Pivots: (S1) 135.88; (P) 136.34; (R1) 137.15; More....
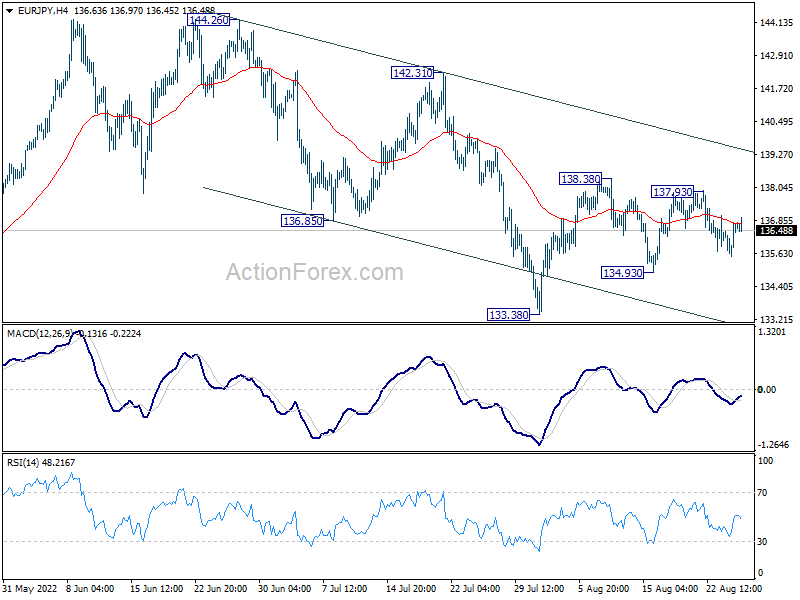
Range trading continues in EUR/JPY and intraday bias remains neutral. On the upside, break of 138.38 resistance will resume the rebound from 133.38 towards 142.31 resistance. On the downside, break of 134.93 will turn bias back to the downside for 133.38 support. Overall, corrective pattern from 144.26 could extend further with more choppy trading.
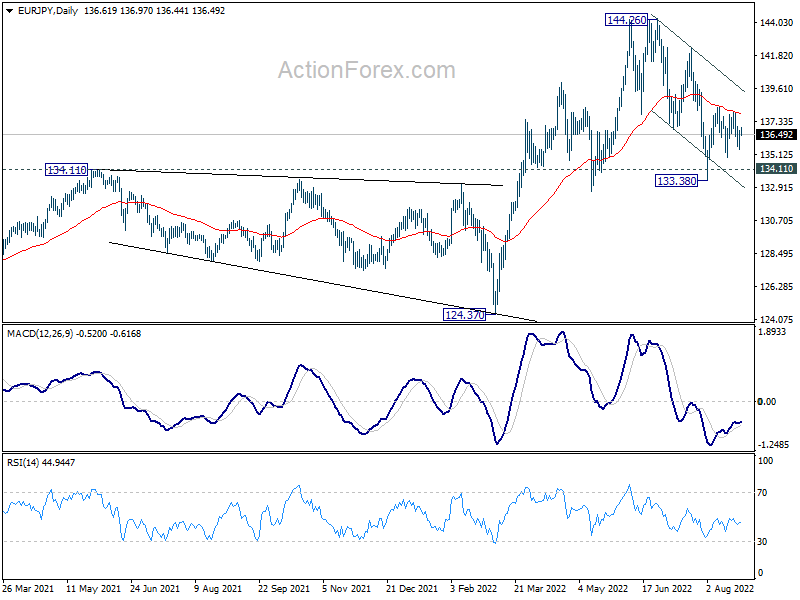
In the bigger picture, up trend from 114.42 (2020 low) is seen as the third leg of the pattern from 109.30 (2016 low). Further rally is in favor as long as 134.11 resistance turned support holds, even in case of deep pull back. Next target is 149.76 (2015 high). However, sustained break of 134.11 will be a sign of medium term bearish reversal and turn focus to 124.37 support for confirmation.
EUR/GBP Daily Outlook
Daily Pivots: (S1) 0.8420; (P) 0.8438; (R1) 0.8468; More...
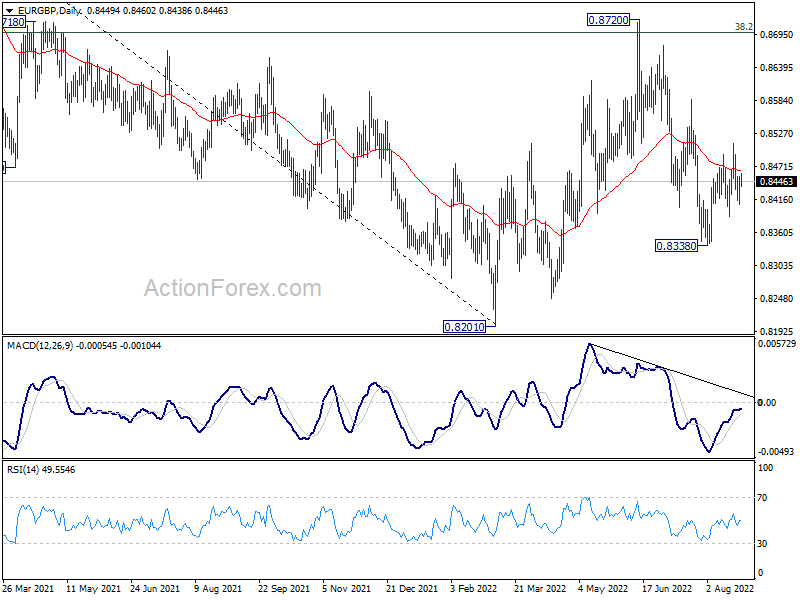
Range trading continues in EUR/GBP and intraday bias remains neutral. On the downside, break of 0.8386 minor support will resume the choppy fall from 0.8720 through 0.8338. On the upside, above 0.8510 will resume the rebound to 0.8585 resistance next.
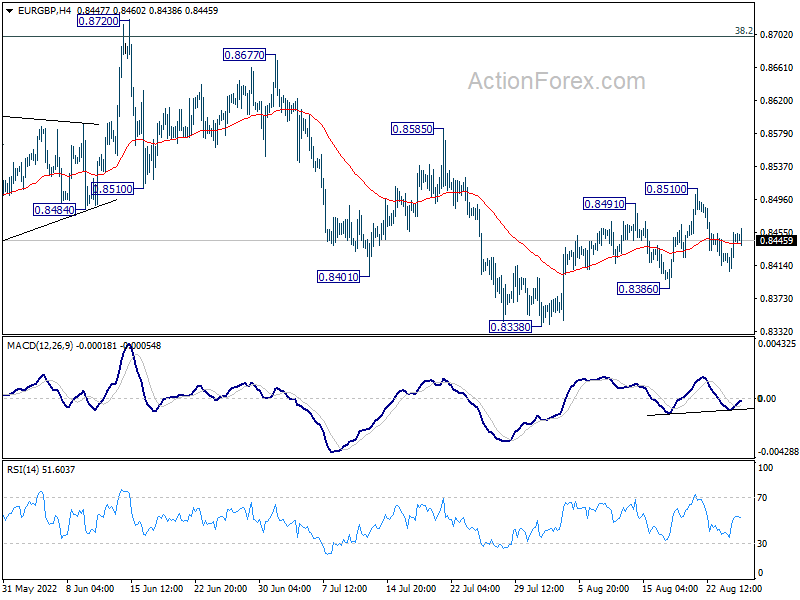
In the bigger picture, medium term bearishness is maintained with prior rejection by 38.2% retracement of 0.9499 to 0.8201 at 0.8697. Break of 0.8201 will resume larger down trend from 0.9499 (2020 high). Nevertheless, sustained break of 0.8697 will affirm the case that rise from 0.8201 is a medium term up trend itself.
EUR/AUD Daily Outlook
Daily Pivots: (S1) 1.4370; (P) 1.4418; (R1) 1.4476; More...
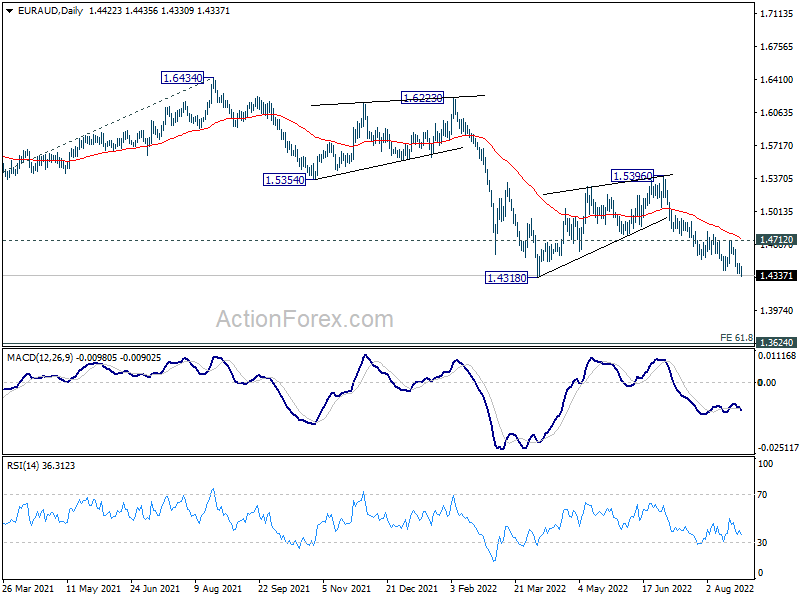
Intraday bias in EUR/AUD stays on the downside for 1.4318 support. Decisive break there will resume larger down trend to medium term projection level at 1.3623. On the upside, break of 1.4712 resistance will delay the bearish case and turn bias to the upside for stronger rebound first.
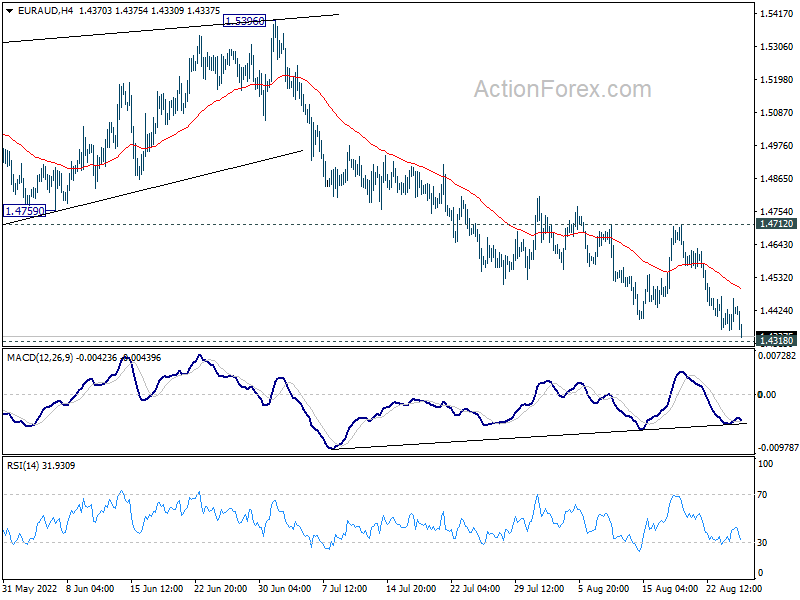
In the bigger picture, down trend from 1.9799 is still in progress. Break of 1.4318 low will target 61.8% projection of 1.9799 to 1.5250 from 1.6434 at 1.3623, which is close to 1.3624 long term support (2017 low). This will remain the favored case now as long as 1.5396 resistance holds.