Sample Category Title
GBPAUD Wave Analysis
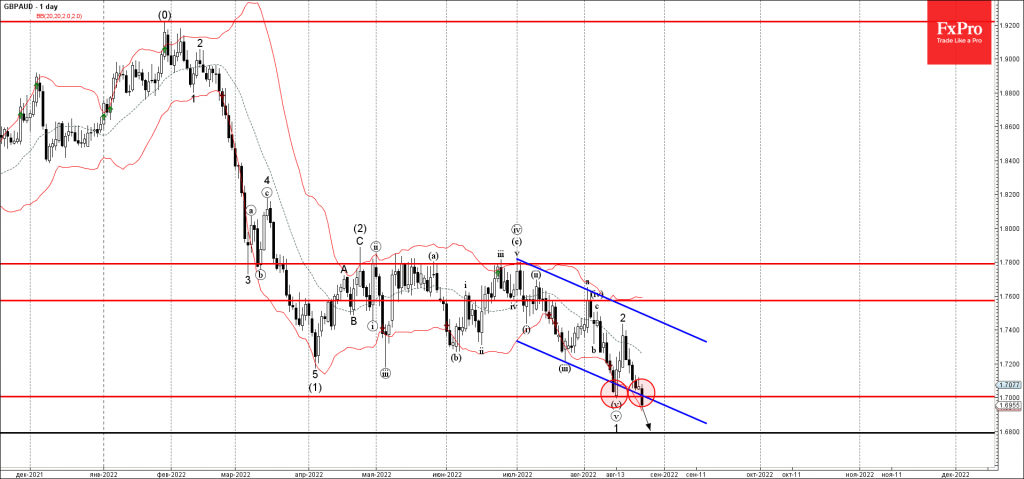
- GBPAUD broke support level 1.7000
- Likely to fall to support level 1.6800
GBPAUD currency pair recently broke the support level 1.7000 (which stopped the previous minor impulse wave 1 from the start of August).
The breakout of the support level 1.7000 coincided with the breakout of the daily down channel from the start of July – which accelerated the active impulse wave 3.
Given the clear daily downtrend, GBPAUD currency can be expected to fall further toward the next support level 1.6800.
Eco Data 8/26/22
[php_everywhere instance="1"]
Fed George: Too soon to decide September’s rate hike
Kansas City Fed President Esther George told CNBC it's "too soon to say" regarding September's rate hike, "because we have some important data that's coming up."
"I don't think we know yet where [the terminal rate for interest rates] may have to settle out, but it will be higher than it is today for sure," she said.
"We still have high inflation. We saw some easing in the July numbers, but I think it remains broad-based, so there is more work to be done," George said.
Fed Harker wants rate to get above 3.4%, open to higher
Philadelphia Fed President Patrick Harker told CNBC today, "I'd like to see us get to, say, above 3.4% - that was the last median in the SEP (Summary of Economic Projections) - and then maybe sit for a while."
"But if the data says we need to keep increasing, we keep increasing. We've got to get inflation under control. That is Job One," he added.
As for September meet, "whether it's 50 or 75 I can't say right now," he said. But he noted that a 50bps hike is still a "substantial" one.
Sunset Market Commentary
Markets:
Minutes of the July ECB meeting provided some distraction in the countdown to tomorrow’s Jackson Hole address by Fed Chair Powell. They showed that the decision to break guidance of a 25 bps inaugural rate hike and instead lift-off with a 50 bps move was backed by a very large numbers of members. Some argued for the flagged 25 bps with recession risks looming. The 50 bps move had a strong signaling function. It needed to show the ECB’s determination to act and to fulfill its (inflation) mandate. The worsening inflation outlook was the obvious other reason to frontload policy normalization. It’s also the reason why Lagarde and co won’t back down at upcoming policy meetings. EMU money markets currently discount a continuation of the 50 bps pace in September and October. The ECB refrained on purpose from providing such specific guidance for upcoming meetings. Giving forward guidance on interest rates was a powerful instrument in times when interest rates were close to the effective lower bound, but its usefulness was judged as being significantly diminished in the normalization phase. Specific guidance would excessively constrain the central bank’s optionality, flexibility and data-dependence. Markets didn’t react to the release of the Minutes. Neither did they pay any attention to stabilizing August German business sentiment or slightly lower than expected weekly jobless claims in the US. Overall, we’ve seen some relief on recent bond market sell-off. UK yields drop 4.8 bps (30-yr) to 13.4 bps (2-yr) in a daily respective. German yields return up to 7 bps at the front end of the curve. The decline of US yields ranges from 0.3 bps for the 30-yr and 2.4 bps for the 2-yr. European stock markets started strong but couldn’t hold on to this momentum. They are currently turning intraday gains into intraday losses. US equities open mixed with Dow Jones 0.2% weaker and Nasdaq 0.5% stronger. The dollar initially suffered some follow through weakness following yesterday’s failure to set new highs, but gradually restores the balance throughout dealings. EUR/USD changes hands around 0.9965. Sterling remains in technical no-man’s land at EUR/GBP 0.8450. Brent crude holds strong above the $100/b barrier ($102).
News Headlines:
The British retail sector, according to a monthly survey of the Confederation of British Industry (CBI), showed remarkable strength in August. The retail sales balance indicator unexpectedly jumped from -4 in July to 37. Orders placed at suppliers also improved from -13 to 1. Expected sales for September improved from -14 to 31. At the same time, questions from a quarterly survey indicated that inflationary pressures continue building with the indicator of selling prices rising from 77 in May to 87 in August, the highest level on record. A CBI economist indicated that despite sales growth in August, companies were the most downbeat on activity in the next three months since the 2020 first COVID lockdown. The business situation index declined to -22 from -13 in May. Retailers’ downbeat investment intentions is also seen as a sign of difficult times ahead for the sector.
In the minutes of its July meeting, the National bank of Poland assessed that economic conditions in Q2 remained favorable even as growth decelerated. The historically low unemployment rate was accompanied by significant wage rises even as this process showed signs of slowing. Slower growth was seen curbing wage growth beyond 2022. Inflation was expected to stay high in the coming quarters but “the coming years would see a gradual decline in inflation towards the NBP target, which would be supported by the expected weakening of economic conditions, along with the fading of the impact of the shocks that were currently boosting prices as well as the NBP interest rate hikes implemented so far”. The MPC also hopes a stronger zloty in line with fundamentals to help to curb inflation. Certain Governing Council members judged that the disinflationary process might proceed slower than indicated in the projection, due to, among others, the possible fiscal policy easing. After a setback recently, the zloty today slightly rebounded to EUR/PLN 4.755.
US: Second Estimate of Q2 GDP Still Points to Contraction in Economic Growth
The second estimate of second quarter real GDP declined by 0.6% quarter-over-quarter (q/q, annualized). This was a slight upgrade from the -0.9% reported in the advance estimate released last month. The reading came in a touch above the consensus forecast which called for a decline of 0.9%.
Consumer spending rose by 1.5%, up from the advance estimate (1.0%). Gains were concentrated in services spending (3.6%), while goods expenditures (-2.4%) were lower on the quarter. Declines were primarily concentrated in non-durables (-3.7%), while durable goods (-0.1%) were flat.
Business investment was also flat in the second quarter, an improvement from the previous estimate (-3.9%). Declines were concentrated across structures (-13.2%) and equipment spending (-2.7%), while investment in intellectual property products (10%) was up last quarter.
Residential investment was down 16.2% and shaved 0.8 percentage points (pp) from headline growth.
Government spending (-1.8%) fell for the third consecutive quarter, as spending at both the federal (-3.9%) and state & local (-0.6%) level registered declines. In terms for federal outlays, declines were entirely concentrated in non-defense (-10.4%) spending. Defense outlays were up 1.1%.
Exports surged by 17.6%, largely unchanged from the previous estimate. Gains were spread across exports of services (25.4%) and goods (14.6%). Conversely, import growth (2.8%) moderated last quarter, with all the gains coming from the import of services (21.5%), while goods imports (-0.4%) were a touch lower. Overall, the trade deficit narrowed in the second quarter, adding 1.4pp to headline growth.
Inventory investment was revised a touch higher, now subtracting 1.8pp (previously 2pp) from GDP growth.
Real Gross Domestic Income increased by 1.4% in the second quarter, compared with an increase of 1.8% in the first quarter. Corporate profits were up 26.7%, more than offsetting last quarter's 8.4% decline. Measured as a share of GDP, corporate profits currently sit at 12.2% – up 0.4pp from last quarter.
Key Implications
After incorporating a more complete set of data, the second estimate of Q2 GDP was little changed from what was suggested by last month's advance release. Despite GDP having contracted in each of the last two quarters, we continue to believe that the U.S. economy remains in expansionary territory.
Perhaps the most anticipated data point of today's release was the Q2 reading of Gross Domestic Income (GDI). Differences between GDP and GDI have historically been small, however, the two measures have shown considerable divergence more recently. Because GDI has historically been less susceptible to large revisions, it seems likely that GDP could be suffering from some measurement error, which is overstating the current level of weakness. We suspect the more comprehensive benchmark revisions (due out on September 29th) will show GDP being revised higher, helping to narrow the gap.
While domestic demand slowed through the first half of the year, our current tracking suggests both consumer spending (2%) and business investment (4%) are set to accelerate in the third quarter. However, a sizeable drag from residential investment (estimated to shave over 1pp from growth) and further giveback on inventory investment will likely keep Q3 growth hovering in the 0%-0.5% range.
EUR/GBP: Near-Term Action Moves in Directionless Mode Around 200DMA
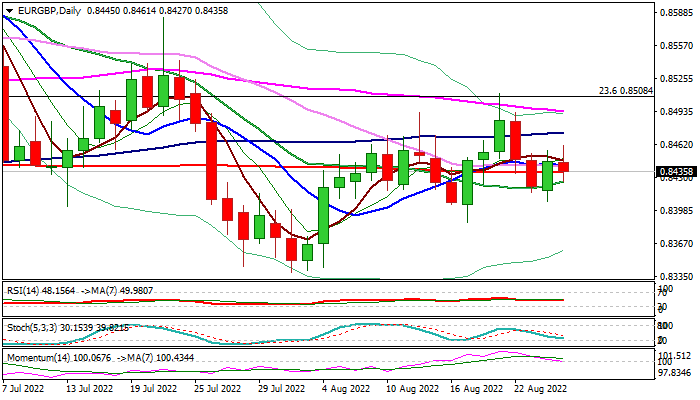
The cross continues to trade in a choppy and directionless near-term mode, moving around pivotal sideways moving 200DMA (0.8435).
Daily Ichimoku studies remain bearishly aligned, but neutral 14-d momentum and RSI add to notion of lack of clearer direction that suggests traders to stand aside for now and await clearer signal.
Firm break of 200DMA would weaken near-term structure but drop and close below the floor of current range (0.8387) is needed to confirm that bears gained control for attempt at Aug 2 low at 0.8339.
Conversely, holding above 200DMA would keep in play hopes for possible rally, though fresh bulls will look for confirmation on lift above range top at 0.8511 (Aug 19).
Res: 0.8461; 0.8473; 0.8493; 0.8511.
Sup: 0.8426; 0.8407; 0.8387; 0.8360.
CHFJPY Struggles to Beat All-Time High
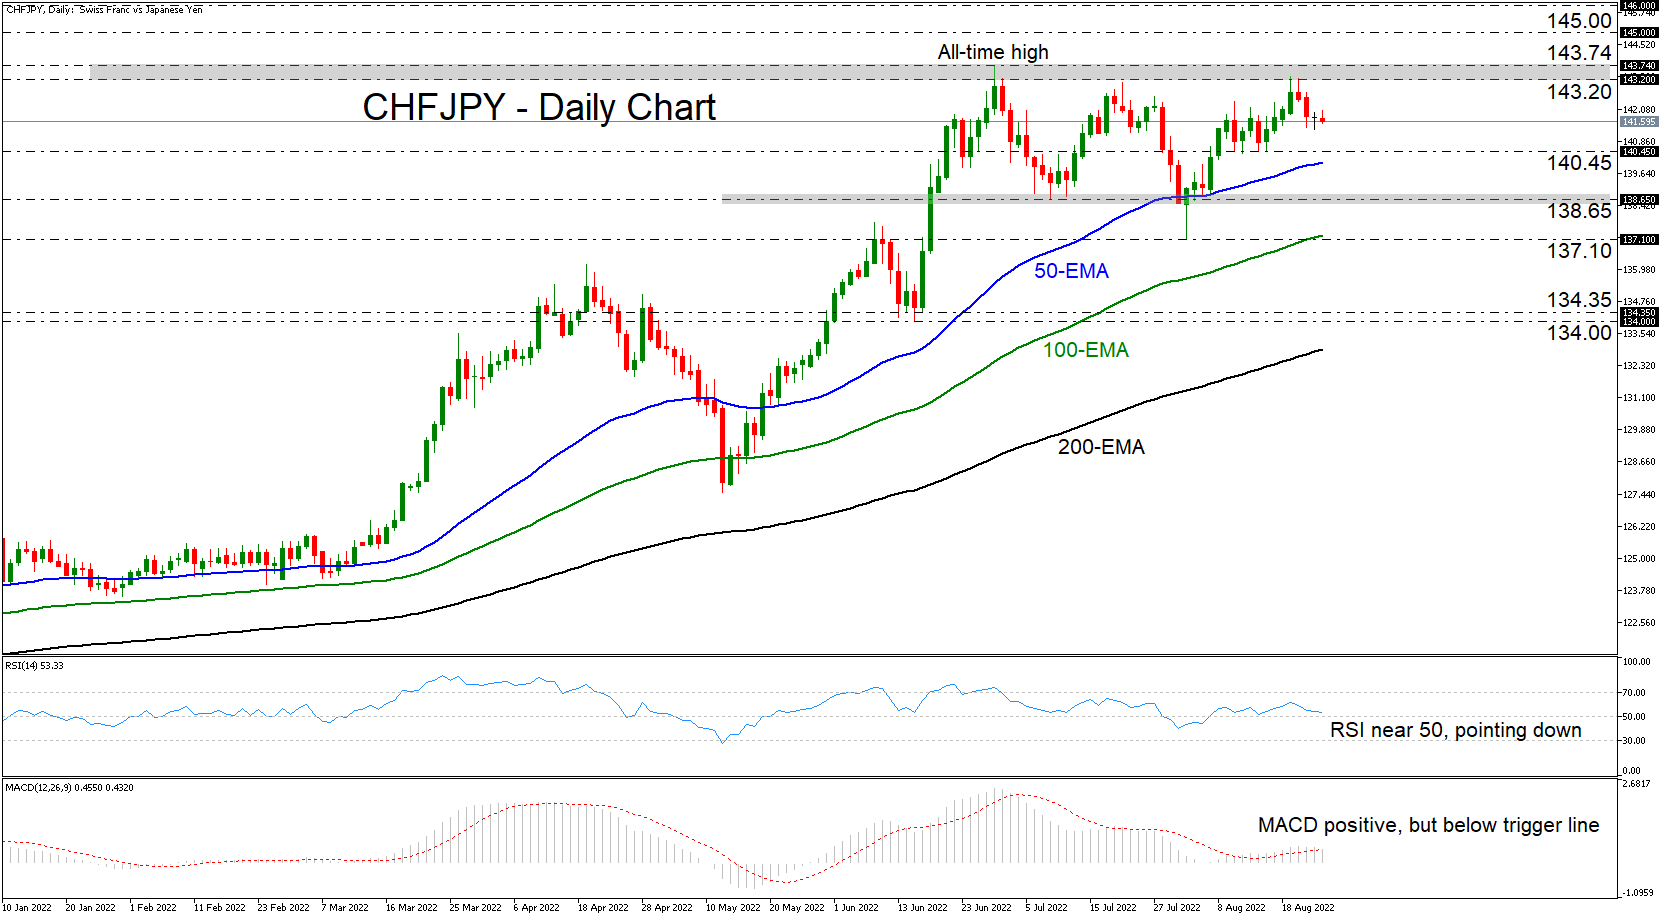
CHFJPY started drifting lower on Monday, after it hit resistance once again at 143.20, a zone which has been preventing the bulls from climbing higher since June 30, a day after the pair hit its record high at 143.74. This, combined with the fact that the pair has been mostly trading above 138.65 since June 17, suggests a sideways range, and thereby paints a neutral picture.
The daily oscillators indicate a lack of, or little, directional momentum, which adds credence to the narrative of a neutral outlook. The RSI has turned down and appears ready to touch its equilibrium 50 line, while the MACD, although slightly positive, crossed below its trigger line and is pointing south as well.
For the prevailing longer-term uptrend to continue, a break above the record peak of 143.74 may be needed. This will take CHFJPY into uncharted territory, and with no prior highs or inside swing lows to mark potential new resistance zones, such a role may be played by the psychological number of 145.00 and the 146.00 area.
On the downside, a break below 138.65 may confirm the completion of a ‘triple top’ formation, and thereby signal a trend reversal. Initially, the bears could aim for the 137.10 level, marked by the low of August 2, the break of which could set the stage for larger declines, perhaps towards the 134.00/35 zone, defined by the lows of June 15 and 16 respectively.
To recap, CHFJPY bulls have repeatedly failed to overcome the pair’s record of 143.74, finding strong resistance at 143.20. That ceiling and the key support of 138.65 are forming a sideways range that’s been containing most of the price action since June 17.
EUR/USD Mid-Day Outlook
Daily Pivots: (S1) 0.9919; (P) 0.9959; (R1) 1.0008; More...
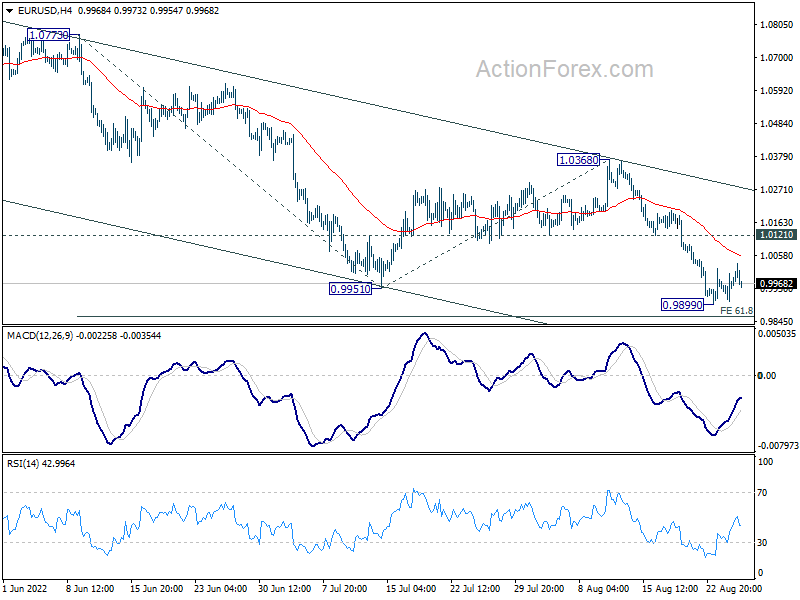
Intraday bias in EUR/USD stays neutral at this point. Upside of recovery should be limited by 1.0121 minor resistance to bring another fall. Break of 0.9899 will resume larger down trend to 61.8% projection of 1.0773 to 0.9951 from 1.0368 at 0.9860. Firm break there should prompt downside acceleration to 100% projection at 0.9546.
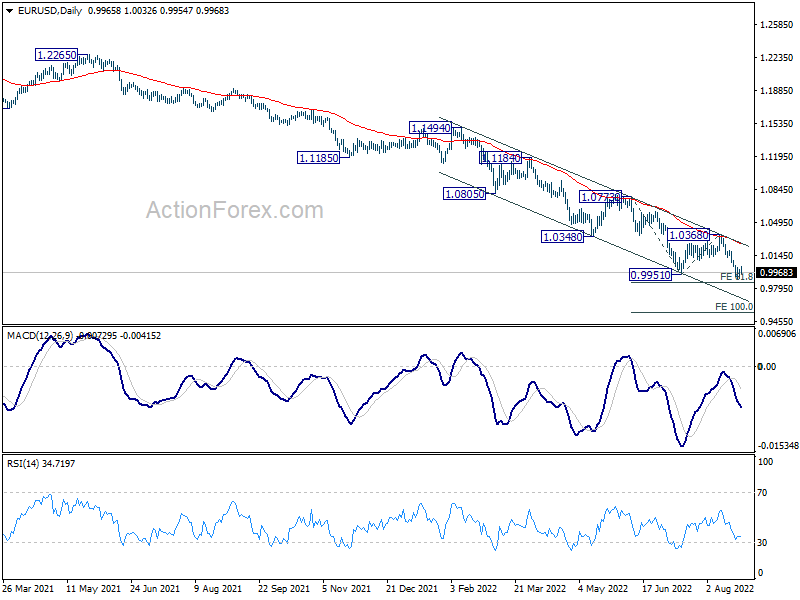
In the bigger picture, down trend from 1.6039 (2008 high) is still in progress. Next target is 100% projection of 1.3993 to 1.0339 from 1.2348 at 0.8694. In any case, outlook will stay bearish as long as 1.0368 resistance holds, in case of strong rebound.
GBP/USD Mid-Day Outlook
Daily Pivots: (S1) 1.1753; (P) 1.1797; (R1) 1.1839; More...
GBP/USD is staying in consolidation from 1.1716 and intraday bias remains neutral for the moment. Upside of recovery should be limited by 1.2002 support turned resistance to bring another fall. Break of 1.1716 will resume larger down trend to 1.1409 long term support.
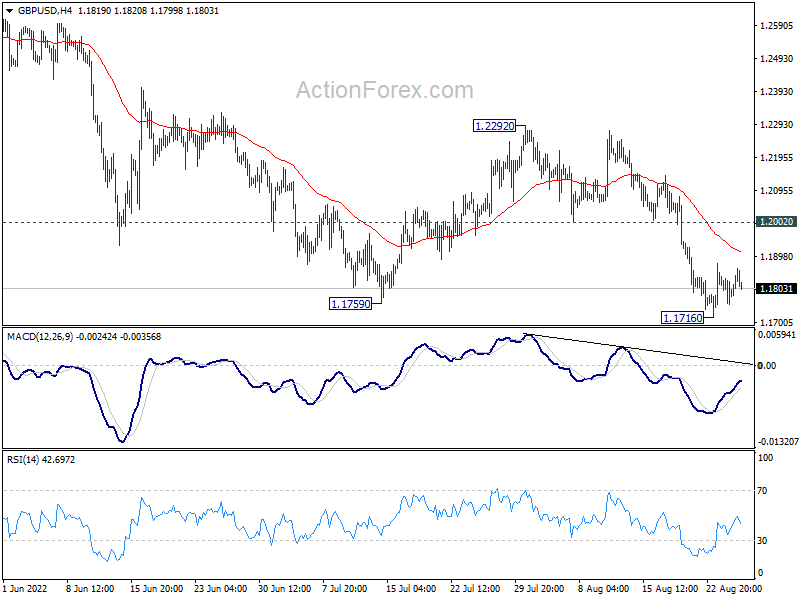
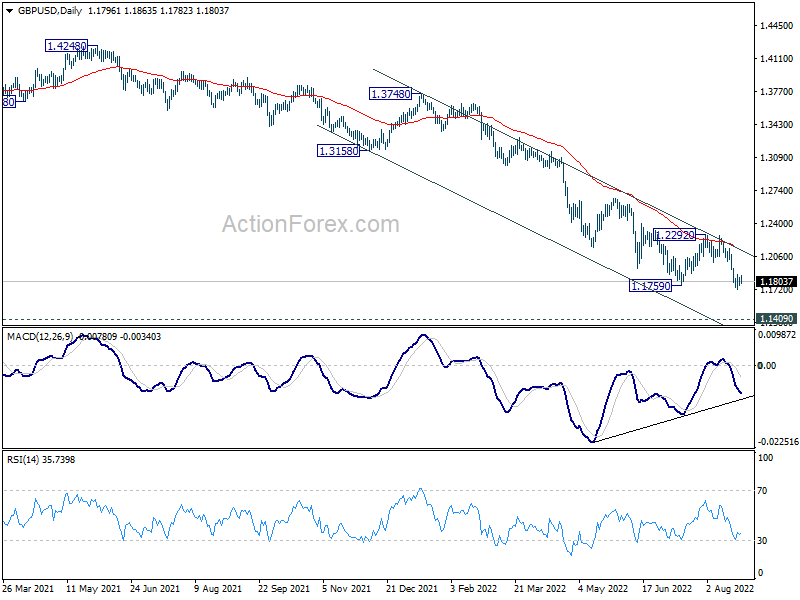
In the bigger picture, fall from 1.4248 (2018 high) could be a leg inside the pattern from 1.1409 (2020 low), or resuming the longer term down trend. Deeper decline is expected as long as 1.2292 resistance holds. Next target is 1.1409 low. However, firm break of 1.2292 will bring stronger rise back to 55 week EMA (now at 1.2859).