

Sample Category Title
GBP/USD Daily Outlook
Daily Pivots: (S1) 1.1791; (P) 1.1828; (R1) 1.1871; More...
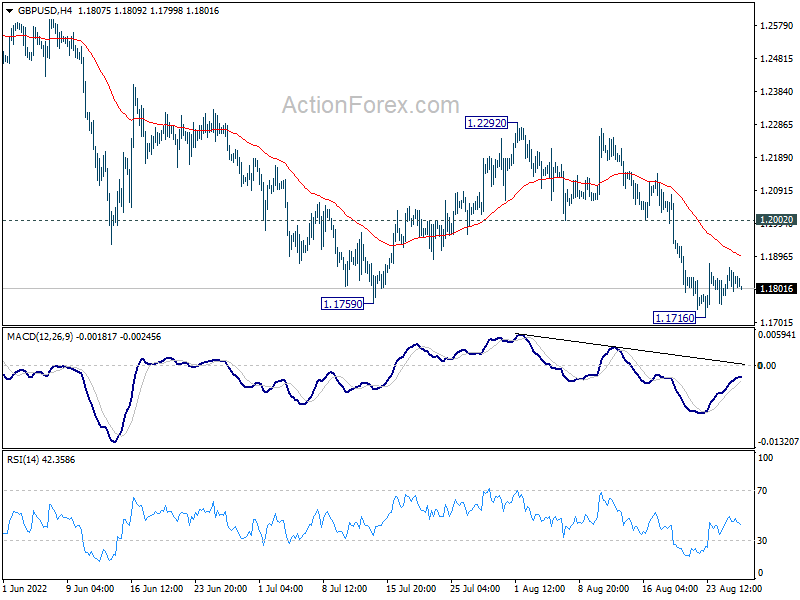
Intraday bias in GBP/USD remains neutral and outlook is unchanged. Consolidation from 1.1716 could extend, but upside of recovery should be limited by 1.2002 support turned resistance to bring another fall. Break of 1.1716 will resume larger down trend to 1.1409 long term support.
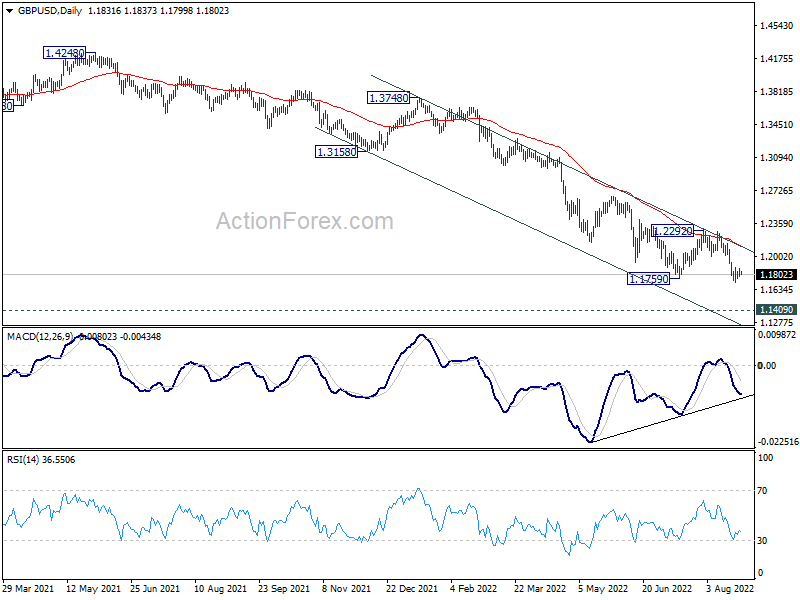
In the bigger picture, fall from 1.4248 (2018 high) could be a leg inside the pattern from 1.1409 (2020 low), or resuming the longer term down trend. Deeper decline is expected as long as 1.2292 resistance holds. Next target is 1.1409 low. However, firm break of 1.2292 will bring stronger rise back to 55 week EMA (now at 1.2859).
USD/JPY Daily Outlook
Daily Pivots: (S1) 136.15; (P) 136.68; (R1) 137.03; More...
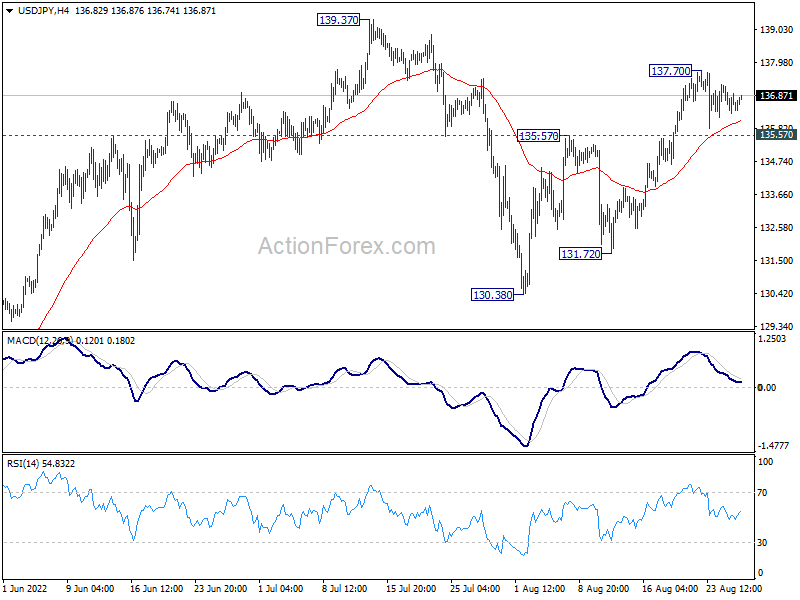
Intraday bias in USD/JPY stays neutral and outlook is unchanged. Overall, price actions from 139.37 are seen as a corrective pattern, with rise from 130.38 as the second leg. Above 137.70 will extend the rebound but upside should be limited by 139.37. On the downside, firm break of 135.57 will suggest that the third leg of the pattern has started, and turn intraday bias back to the downside for 131.72 support first.
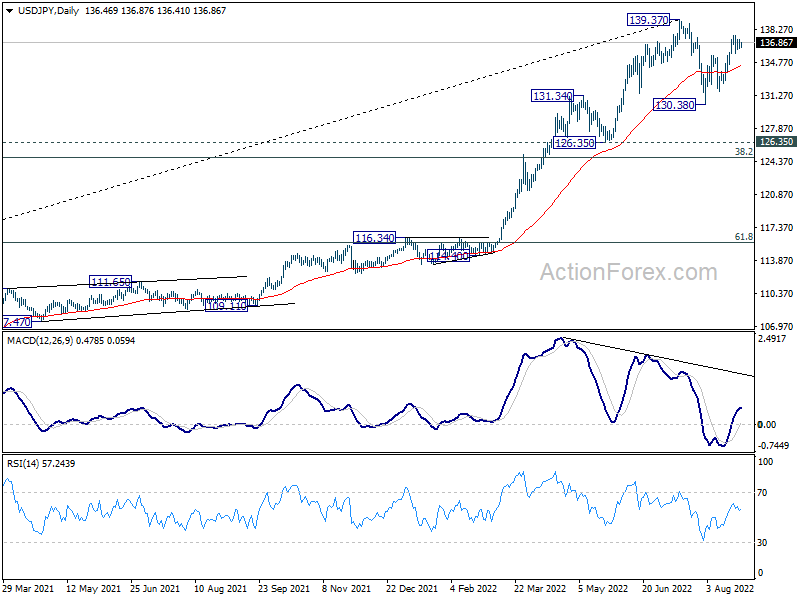
In the bigger picture, price actions from 139.37 medium term top are seen as a corrective pattern to up trend from 101.18 (2020 low). While deeper decline cannot be ruled out, outlook will stays bullish as long as 55 week EMA (now at 123.21) holds. Long term up trend is expected to resume through 139.37 at a later stage, after the correction finishes.
USD/CHF Daily Outlook
Daily Pivots: (S1) 0.9605; (P) 0.9641; (R1) 0.9670; More...
Intraday bias in USD/CHF remains neutral at this point. Outlook is unchanged that triangle correction from 1.0063 could have completed at 0.9369 already. Above 0.9691 will resume the rise from 0.9369 and target 0.9884 resistance next. Break there will argue that larger up trend is ready for resumption through 1.0063. On the downside, below 0.9551 minor support will dampen this view and turn bias back to the downside for 0.9369 support instead.
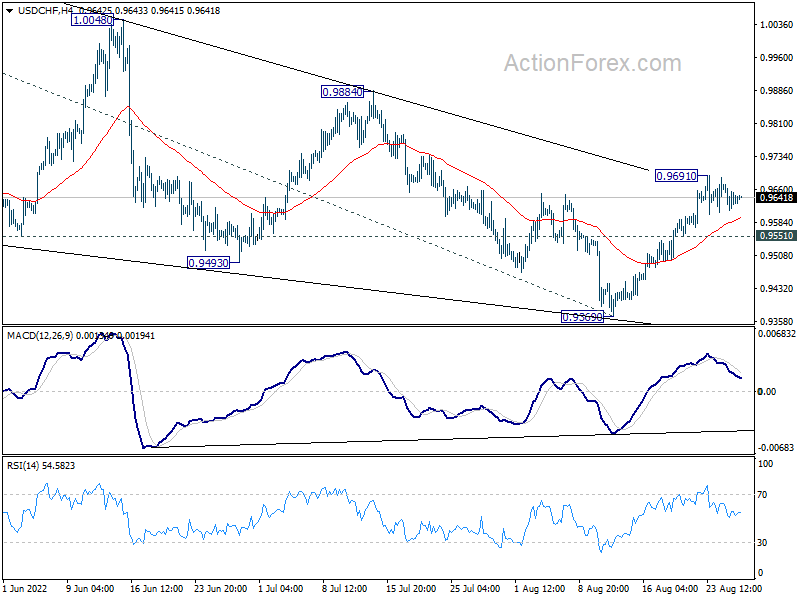
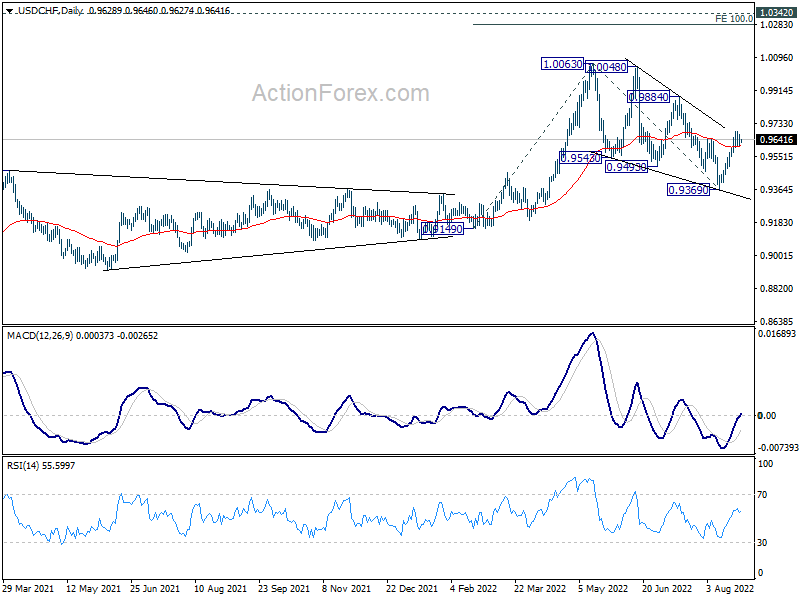
In the bigger picture, current development suggests that up trend from 0.8756 (2021 low) is still in progress. Sustained break of 1.0063 will target 100% projection of 0.9149 to 1.0063 from 0.9369 at 1.0283, and then 1.0342 (2016 high). For now, this will remain the favored case as long as 0.9369 support holds, even in case of deep pull back.
Dollar Mixed Awaiting Fed Powell, Europeans Staying Soft
The forex markets are generally steady in Asian session today, as traders are still holding their bets ahead of Fed Chair Jerome Powell's Jackson Hole speech. US stocks staged a rebound overnight, but there was little reaction elsewhere. For the week, commodity are currently the strongest, led by Aussie. European majors are the worst performers, led by Euro. Dollar and Yen are mixed.
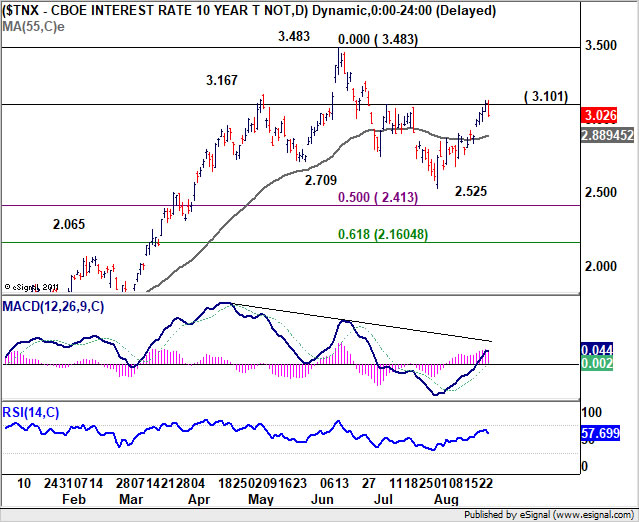
Technically, 10-year yield breached 3.101 resistance this week but couldn't sustain above there so far. Rejection by 3.101, followed by break of gap support at 2.952, will suggest that corrective pattern from 3.483 is already starting a third leg down towards 2.525 low. In this case, USD/JPY could be dragged down as a corresponding move. Nevertheless, firm break of 3.101 will send TNX towards 3.483, taking USD/JPY higher for a test on 139.37.
In Asia, at the time of writing, Nikkei is up 0.69%. Hong Kong HSI is up 0.70%. China Shanghai SSE is up 0.09%. Singapore Strait Times is up 0.36%. Japan 10-year JGB yield is down -0.007 at 0.223. Overnight, DOW rose 0.98%. S&P 500 rose 1.41%. NASDAQ rose 1.67%. 10-year yield dropped -0.080 to 3.026.
Fed Bullard: Front-loading rate hike could show you are serious about inflation fighting
St. Louis Fed President James Bullard reiterated he would like interest rate to be raised from current 2.25-2.50% to 3.75-4.00% by the end of the year. He added that "front-loading" these rate hikes could "show you are serious about inflation fighting."
"A baseline would probably be that inflation will be more persistent than many on Wall Street expect, and that's going to be higher for longer and that's a risk that is underpriced in markets today," Bullard added.
Fed George: Too soon to decide September's rate hike
Kansas City Fed President Esther George told CNBC it's "too soon to say" regarding September's rate hike, "because we have some important data that's coming up."
"I don't think we know yet where [the terminal rate for interest rates] may have to settle out, but it will be higher than it is today for sure," she said.
"We still have high inflation. We saw some easing in the July numbers, but I think it remains broad-based, so there is more work to be done," George said.
Fed Harker wants rate to get above 3.4%, open to higher
Philadelphia Fed President Patrick Harker told CNBC, "I'd like to see us get to, say, above 3.4% – that was the last median in the SEP (Summary of Economic Projections) – and then maybe sit for a while."
"But if the data says we need to keep increasing, we keep increasing. We've got to get inflation under control. That is Job One," he added.
As for September meet, "whether it's 50 or 75 I can't say right now," he said. But he noted that a 50bps hike is still a "substantial" one.
Looking ahead
Germany Gfk consumer sentiment and Eurozone M3 money supply will be released in European session. Later in the day, US will publish personal income and spending with PCE inflation, and goods trade balance.
USD/CHF Daily Outlook
Daily Pivots: (S1) 0.9605; (P) 0.9641; (R1) 0.9670; More...
Intraday bias in USD/CHF remains neutral at this point. Outlook is unchanged that triangle correction from 1.0063 could have completed at 0.9369 already. Above 0.9691 will resume the rise from 0.9369 and target 0.9884 resistance next. Break there will argue that larger up trend is ready for resumption through 1.0063. On the downside, below 0.9551 minor support will dampen this view and turn bias back to the downside for 0.9369 support instead.
In the bigger picture, current development suggests that up trend from 0.8756 (2021 low) is still in progress. Sustained break of 1.0063 will target 100% projection of 0.9149 to 1.0063 from 0.9369 at 1.0283, and then 1.0342 (2016 high). For now, this will remain the favored case as long as 0.9369 support holds, even in case of deep pull back.
Economic Indicators Update
| GMT | Ccy | Events | Actual | Forecast | Previous | Revised |
|---|---|---|---|---|---|---|
| 23:30 | JPY | Tokyo CPI Core Y/Y Aug | 2.60% | 2.50% | 2.30% | |
| 06:00 | EUR | Germany Gfk Consumer Confidence Sep | -31.5 | -30.6 | ||
| 08:00 | EUR | Eurozone M3 Money Supply Y/Y Jul | 5.60% | 5.70% | ||
| 12:30 | USD | Personal Income M/M Jul | 0.60% | 0.60% | ||
| 12:30 | USD | Personal Spending M/M Jul | 0.40% | 1.10% | ||
| 12:30 | USD | PCE Price Index M/M Jul | 1.00% | |||
| 12:30 | USD | PCE Price Index Y/Y Jul | 6.80% | |||
| 12:30 | USD | Core PCE Price Index M/M Jul | 0.30% | 0.60% | ||
| 12:30 | USD | Core PCE Price Index Y/Y Jul | 4.70% | 4.80% | ||
| 12:30 | USD | Wholesale Inventories Jul P | 1.50% | 1.80% | ||
| 12:30 | USD | Goods Trade Balance (USD) Jul P | -99.0B | -98.6B | ||
| 14:00 | USD | Michigan Consumer Sentiment Index Aug F | 55.2 | 55.1 |
Fed Bullard: Front-loading rate hike could show you are serious about inflation fighting
St. Louis Fed President James Bullard reiterated he would like interest rate to be raised from current 2.25-2.50% to 3.75-4.00% by the end of the year. He added that "front-loading" these rate hikes could "show you are serious about inflation fighting."
"A baseline would probably be that inflation will be more persistent than many on Wall Street expect, and that's going to be higher for longer and that's a risk that is underpriced in markets today," Bullard added.
Technical Outlook and Review
USD/JPY:
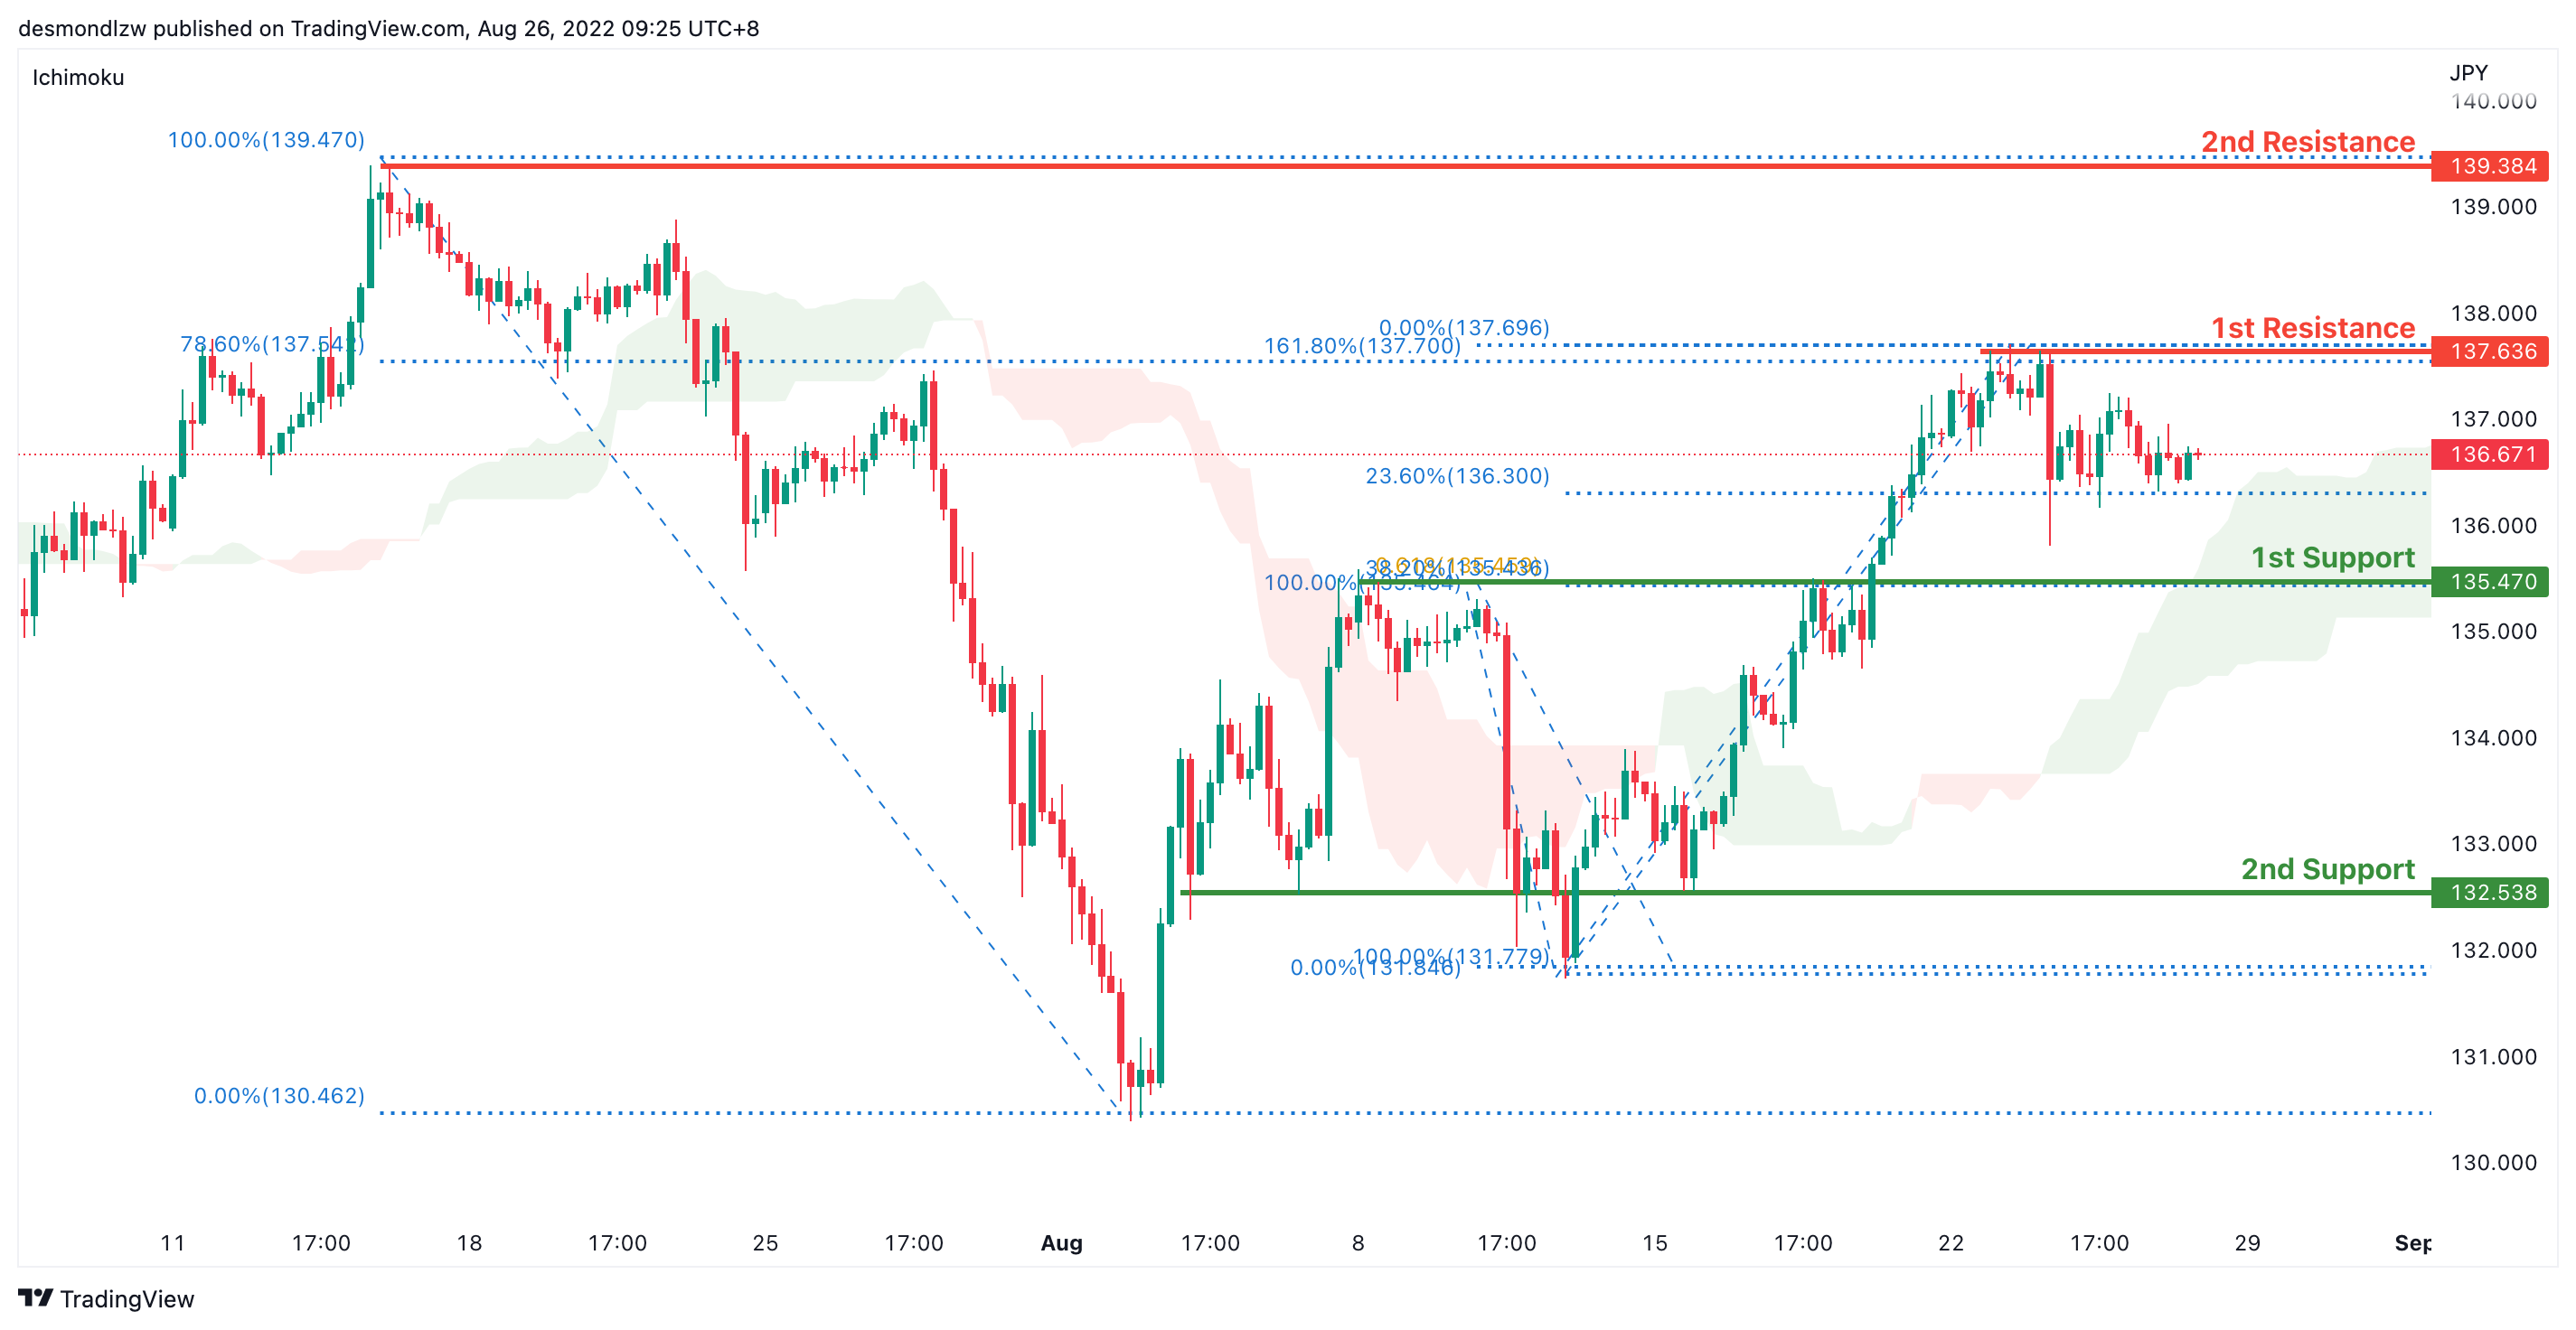
On the H4 chart, price has confirmed a bullish momentum breaking the previous high. We are bullish bias- Price is testing the 23.6% retracement levels now at 136.671 and is failing to break level. We are looking at price testing the first resistance at 137.636 where the 78.6% fibonacci retracement and 161.8% extension sits. It has pulled back slightly but if bullish momentum continues, it will bring the price to 139.397 where the swing high sits. Alternatively if price pulls back, it should test the first support at 135.470 where the 61.8% projection sits and the second support at 132.538 where the swing low sits
Areas of consideration:
- H4 time frame, 1st resistance at 137.636
- H4 time frame, 1st support at 135.470
DXY:
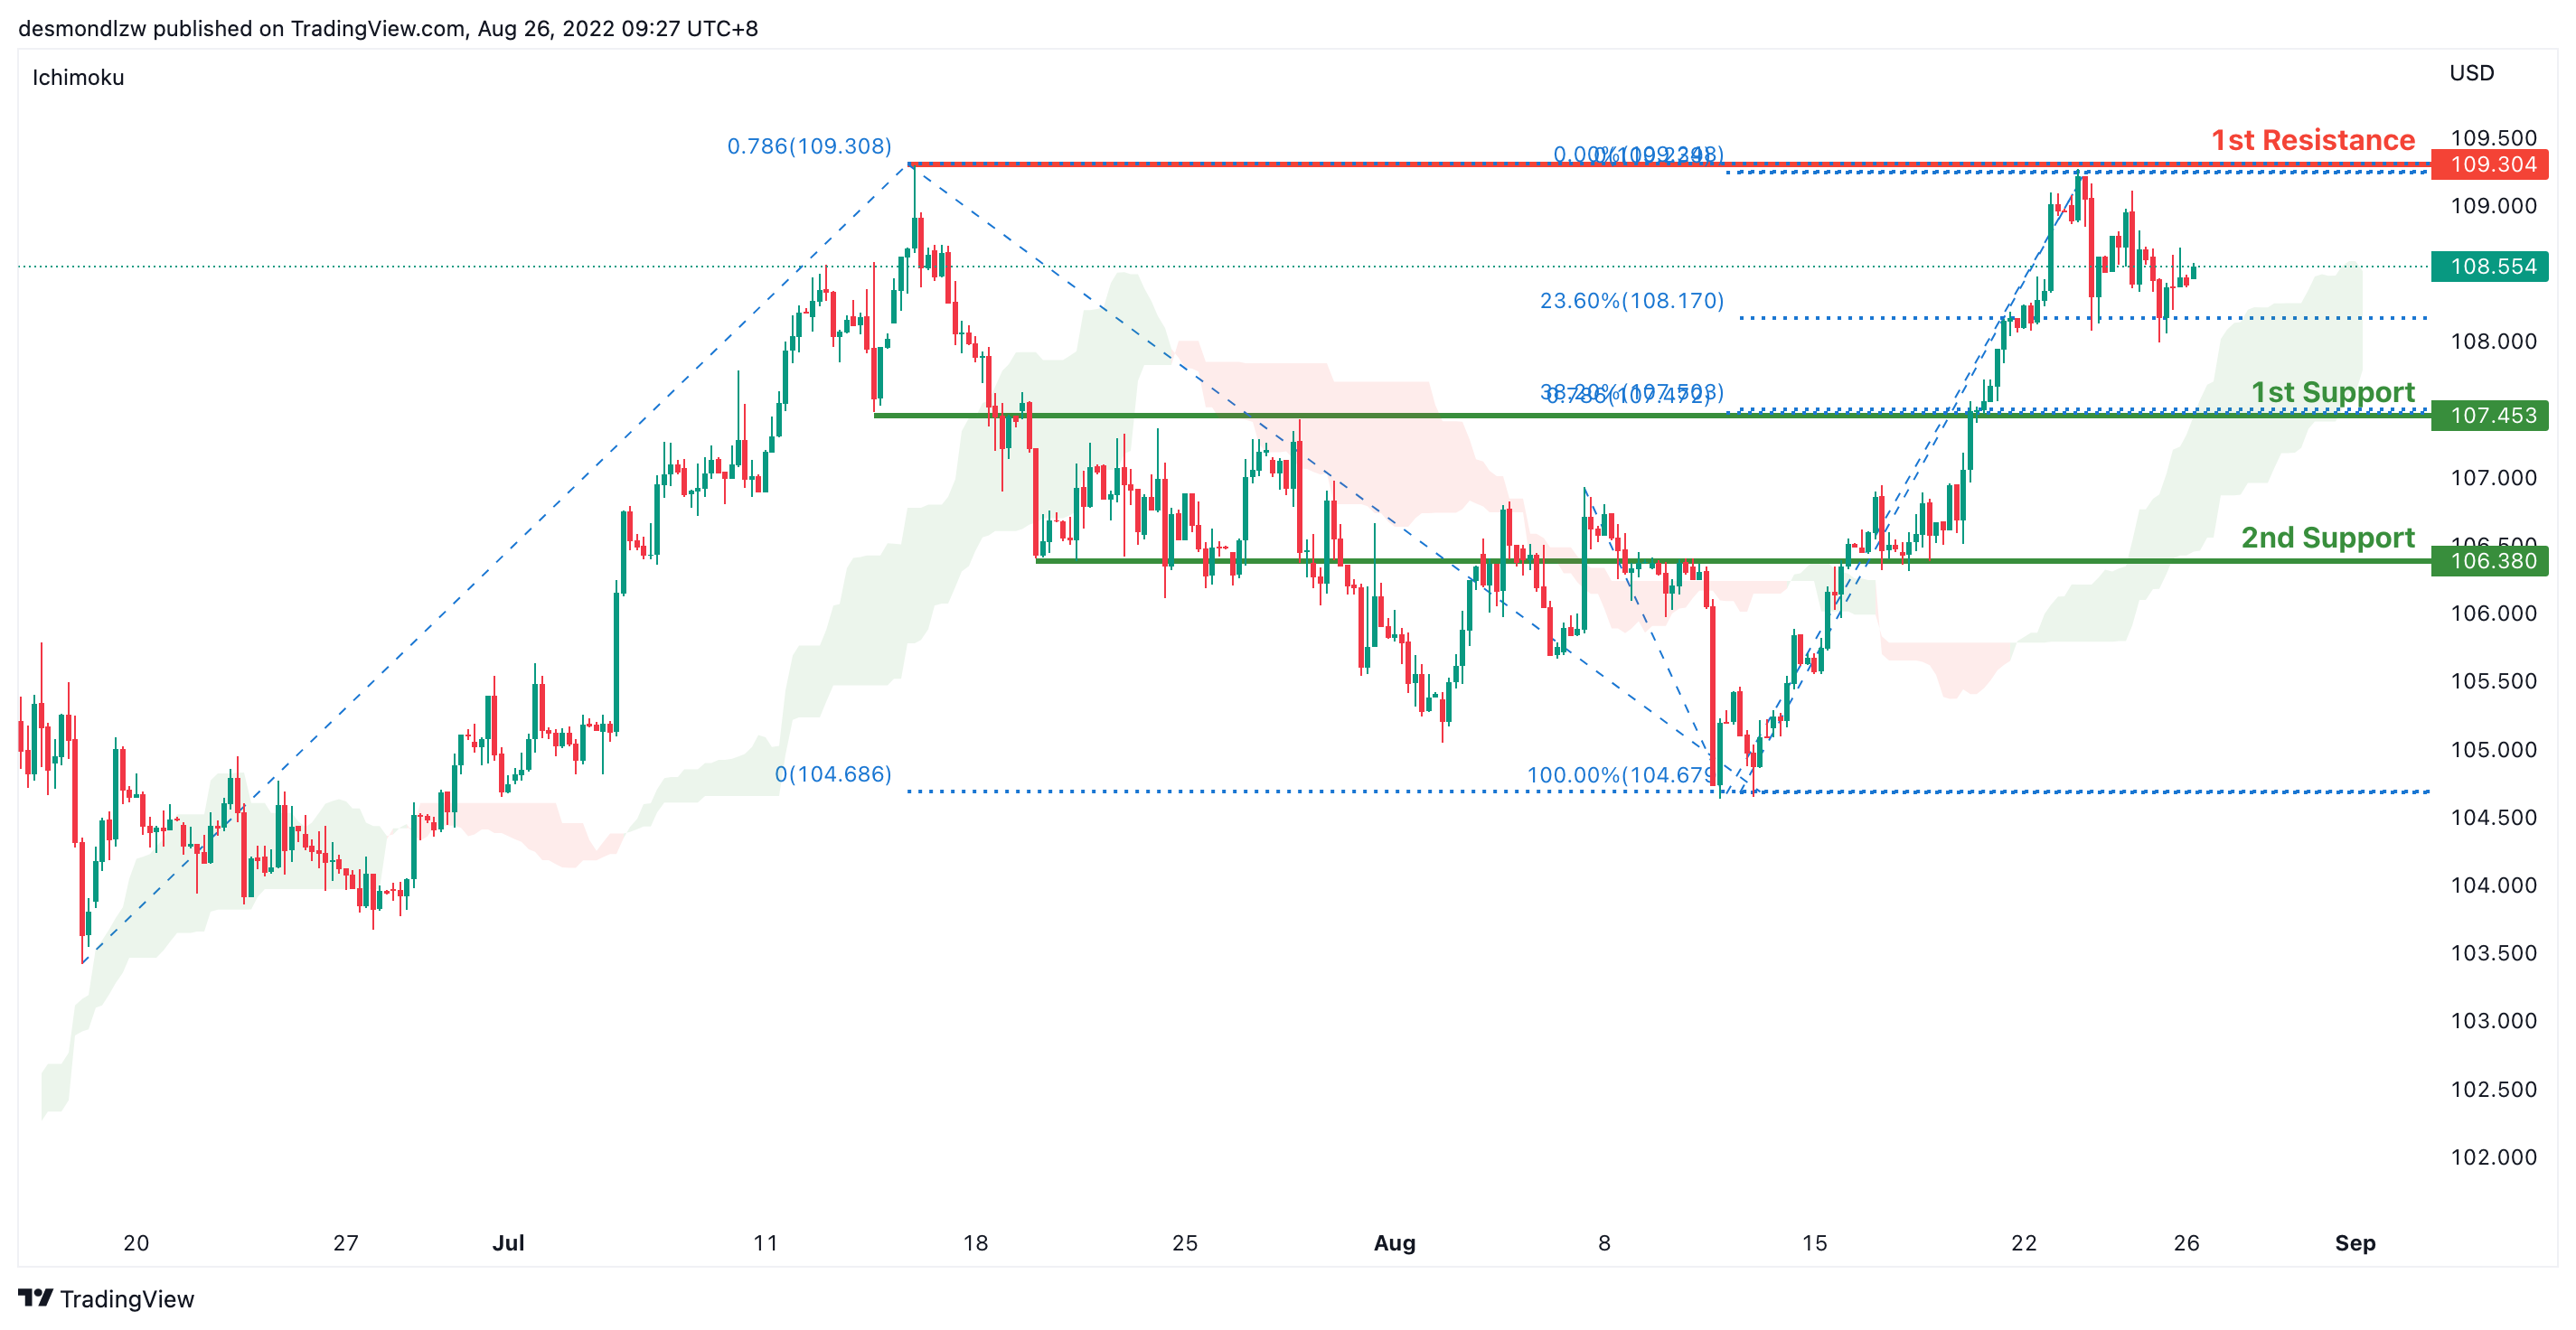
On the H4, prices are still moving in an ascending trend and is in a bullish momentum. Price has tested first resistance at 109.304 where the 78.6% Fibonacci projection and the previous swing high sits and has pulled back slightly to the 23.6% retracement levels. If price fails to break the first resistance, it should pull back to test the first support at 107.453 where the 38.2% retracement and 78.6% projection sits and subsequently the second support at 106.380 where the 61.8% retracement sits
Areas of consideration:
- H4 time frame, 1st resistance at 109.304
- H4 time frame, 1st support at 107.453
EUR/USD :
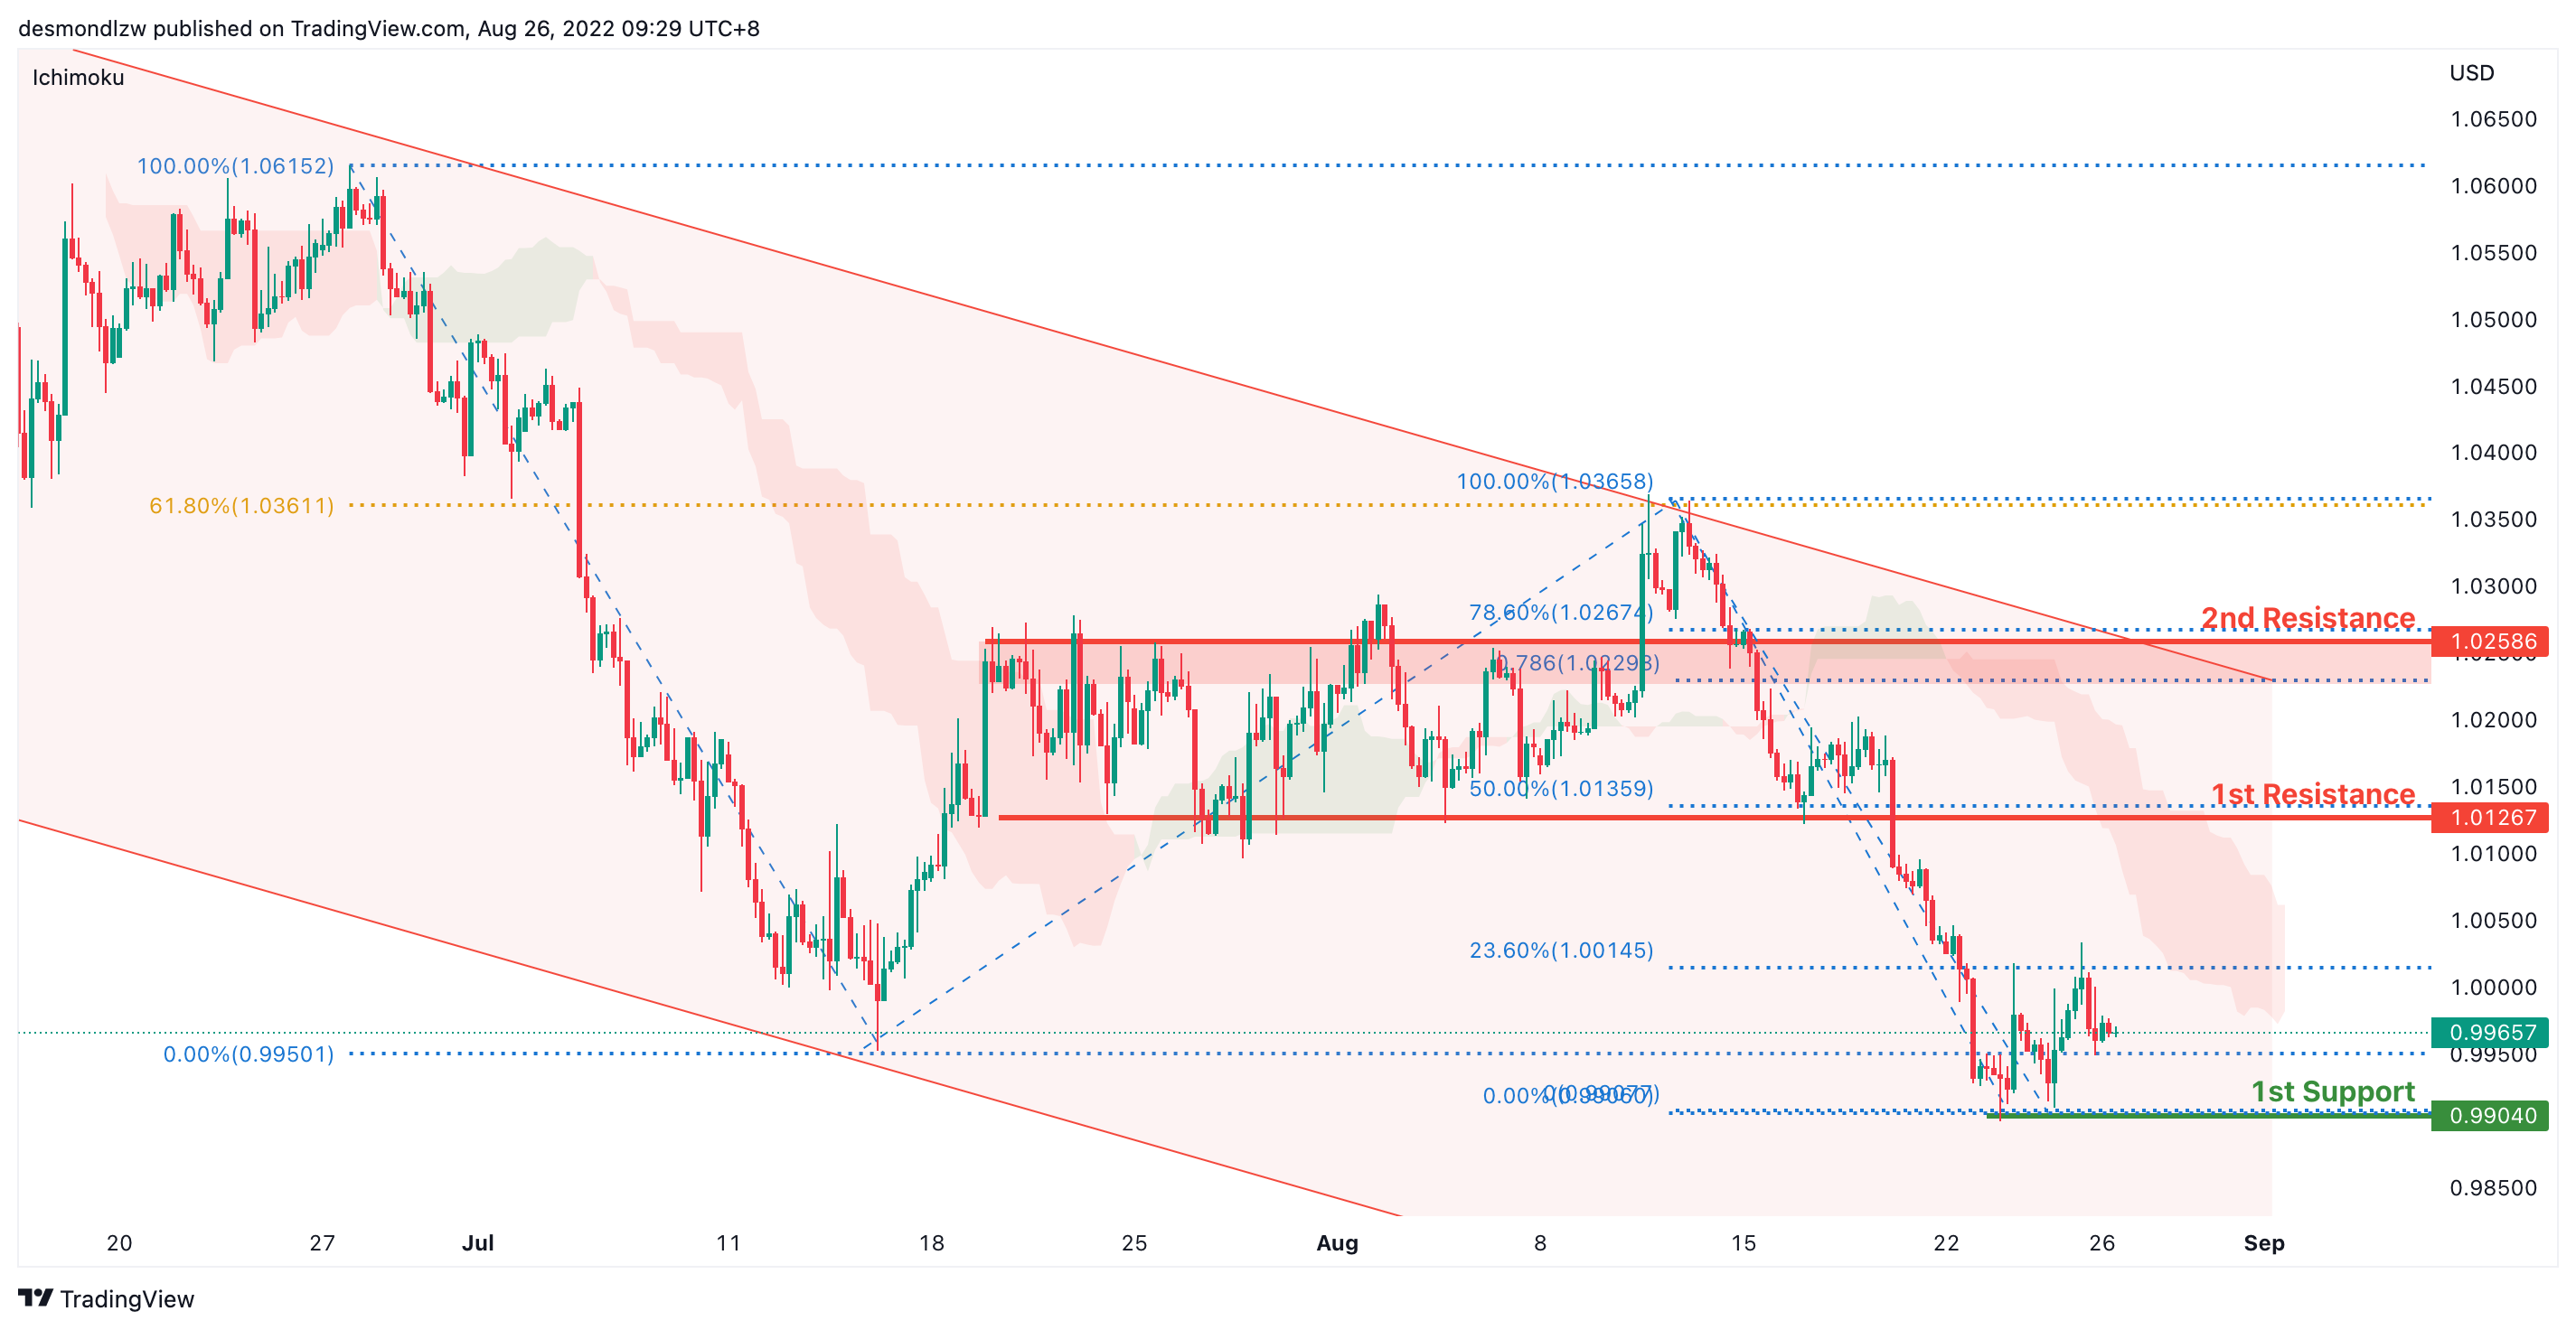
On the H4, prices are still in a descending trend and are below the ichimoku indicator, we are bearish bias. Prices have tested the first support at 0.9904 where the 61.8% projection sits. If it fails to break the first support, prices could pull back to test the first resistance at 1.0126 where the previous swing low and 50% retracement sits and subsequently the second resistance at 1.0258 where the 78.6% retracement and swing high sits
Areas of consideration :
- H4 1st resistance at 1.0126
- H4 1st support at 0.9904
GBP/USD:
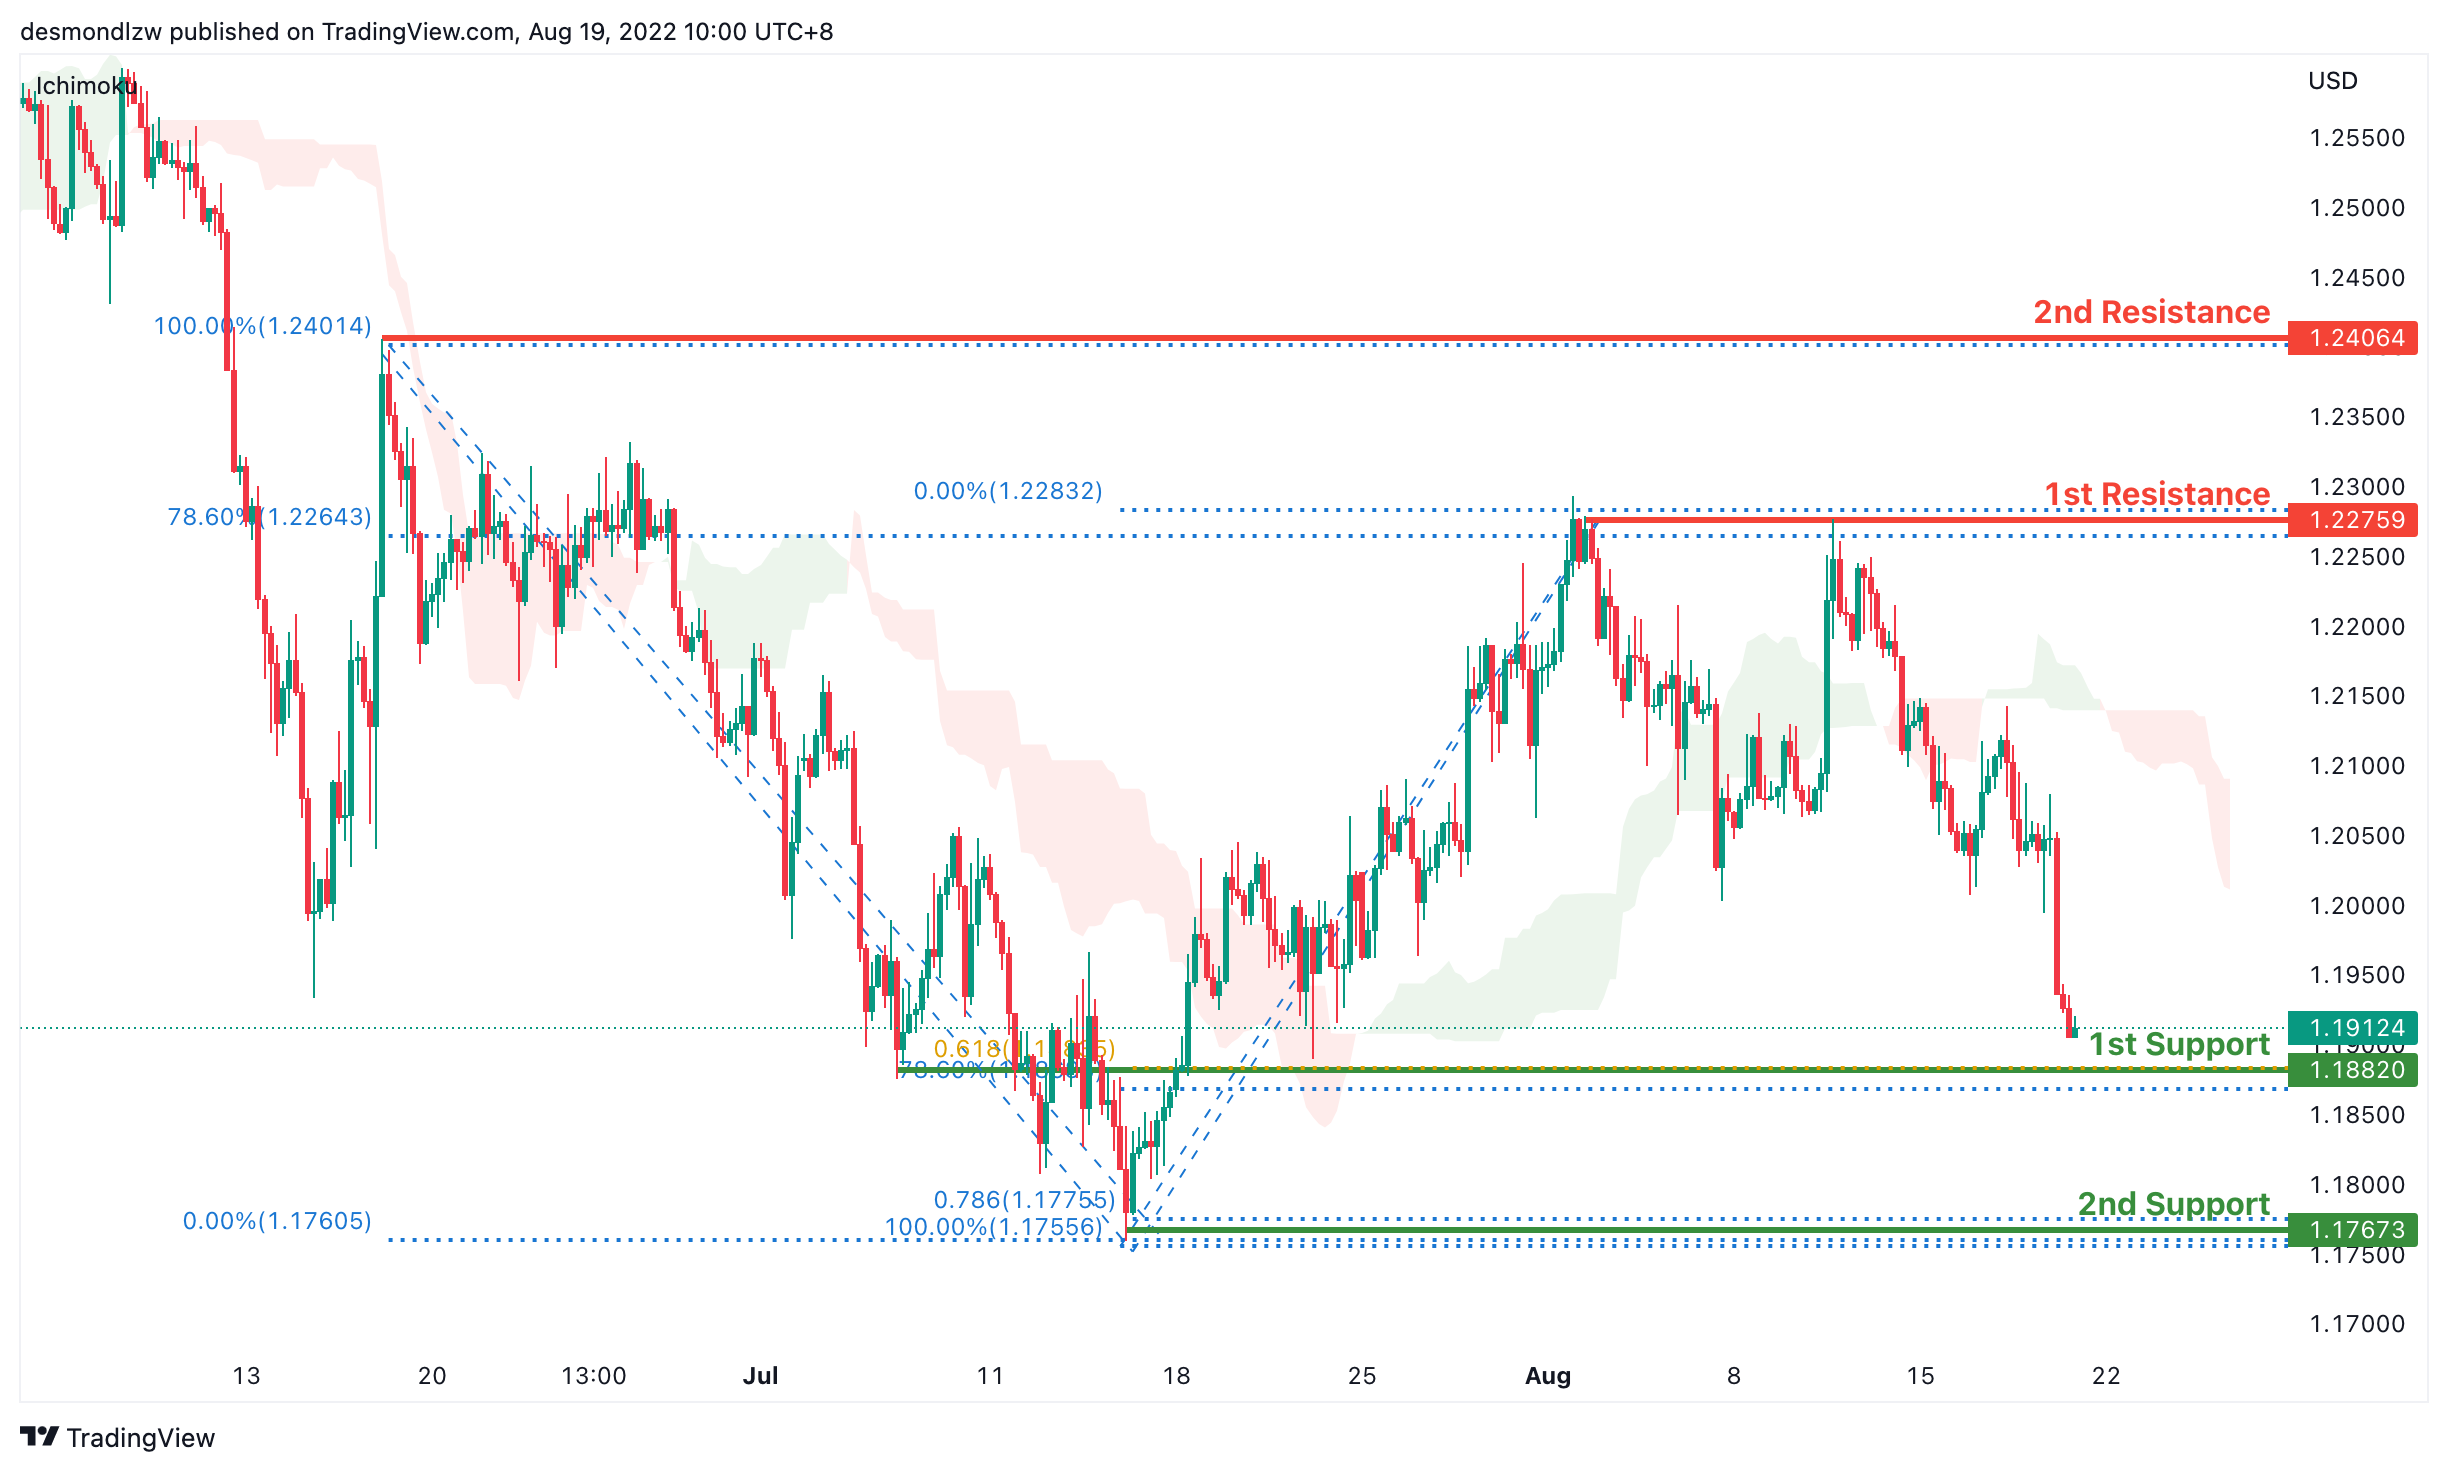
On the H4, prices seem to be in a bearish momentum and respecting the ichimoku cloud. It has tested the first support at 1.1722 where the swing low sits and has now slightly reversed. Alternatively, if price fails to break the first support at 1.1722, it can pull back to test the first resistance at 1.1920 where the 38.2% retracement and 61.8% projection sits. Subsequently testing the second resistance at 1.2015 where the swing low sits
Areas of consideration:
- H4 1st resistance at 1.1920
- H4 1st support at 1.1722
USD/CHF:
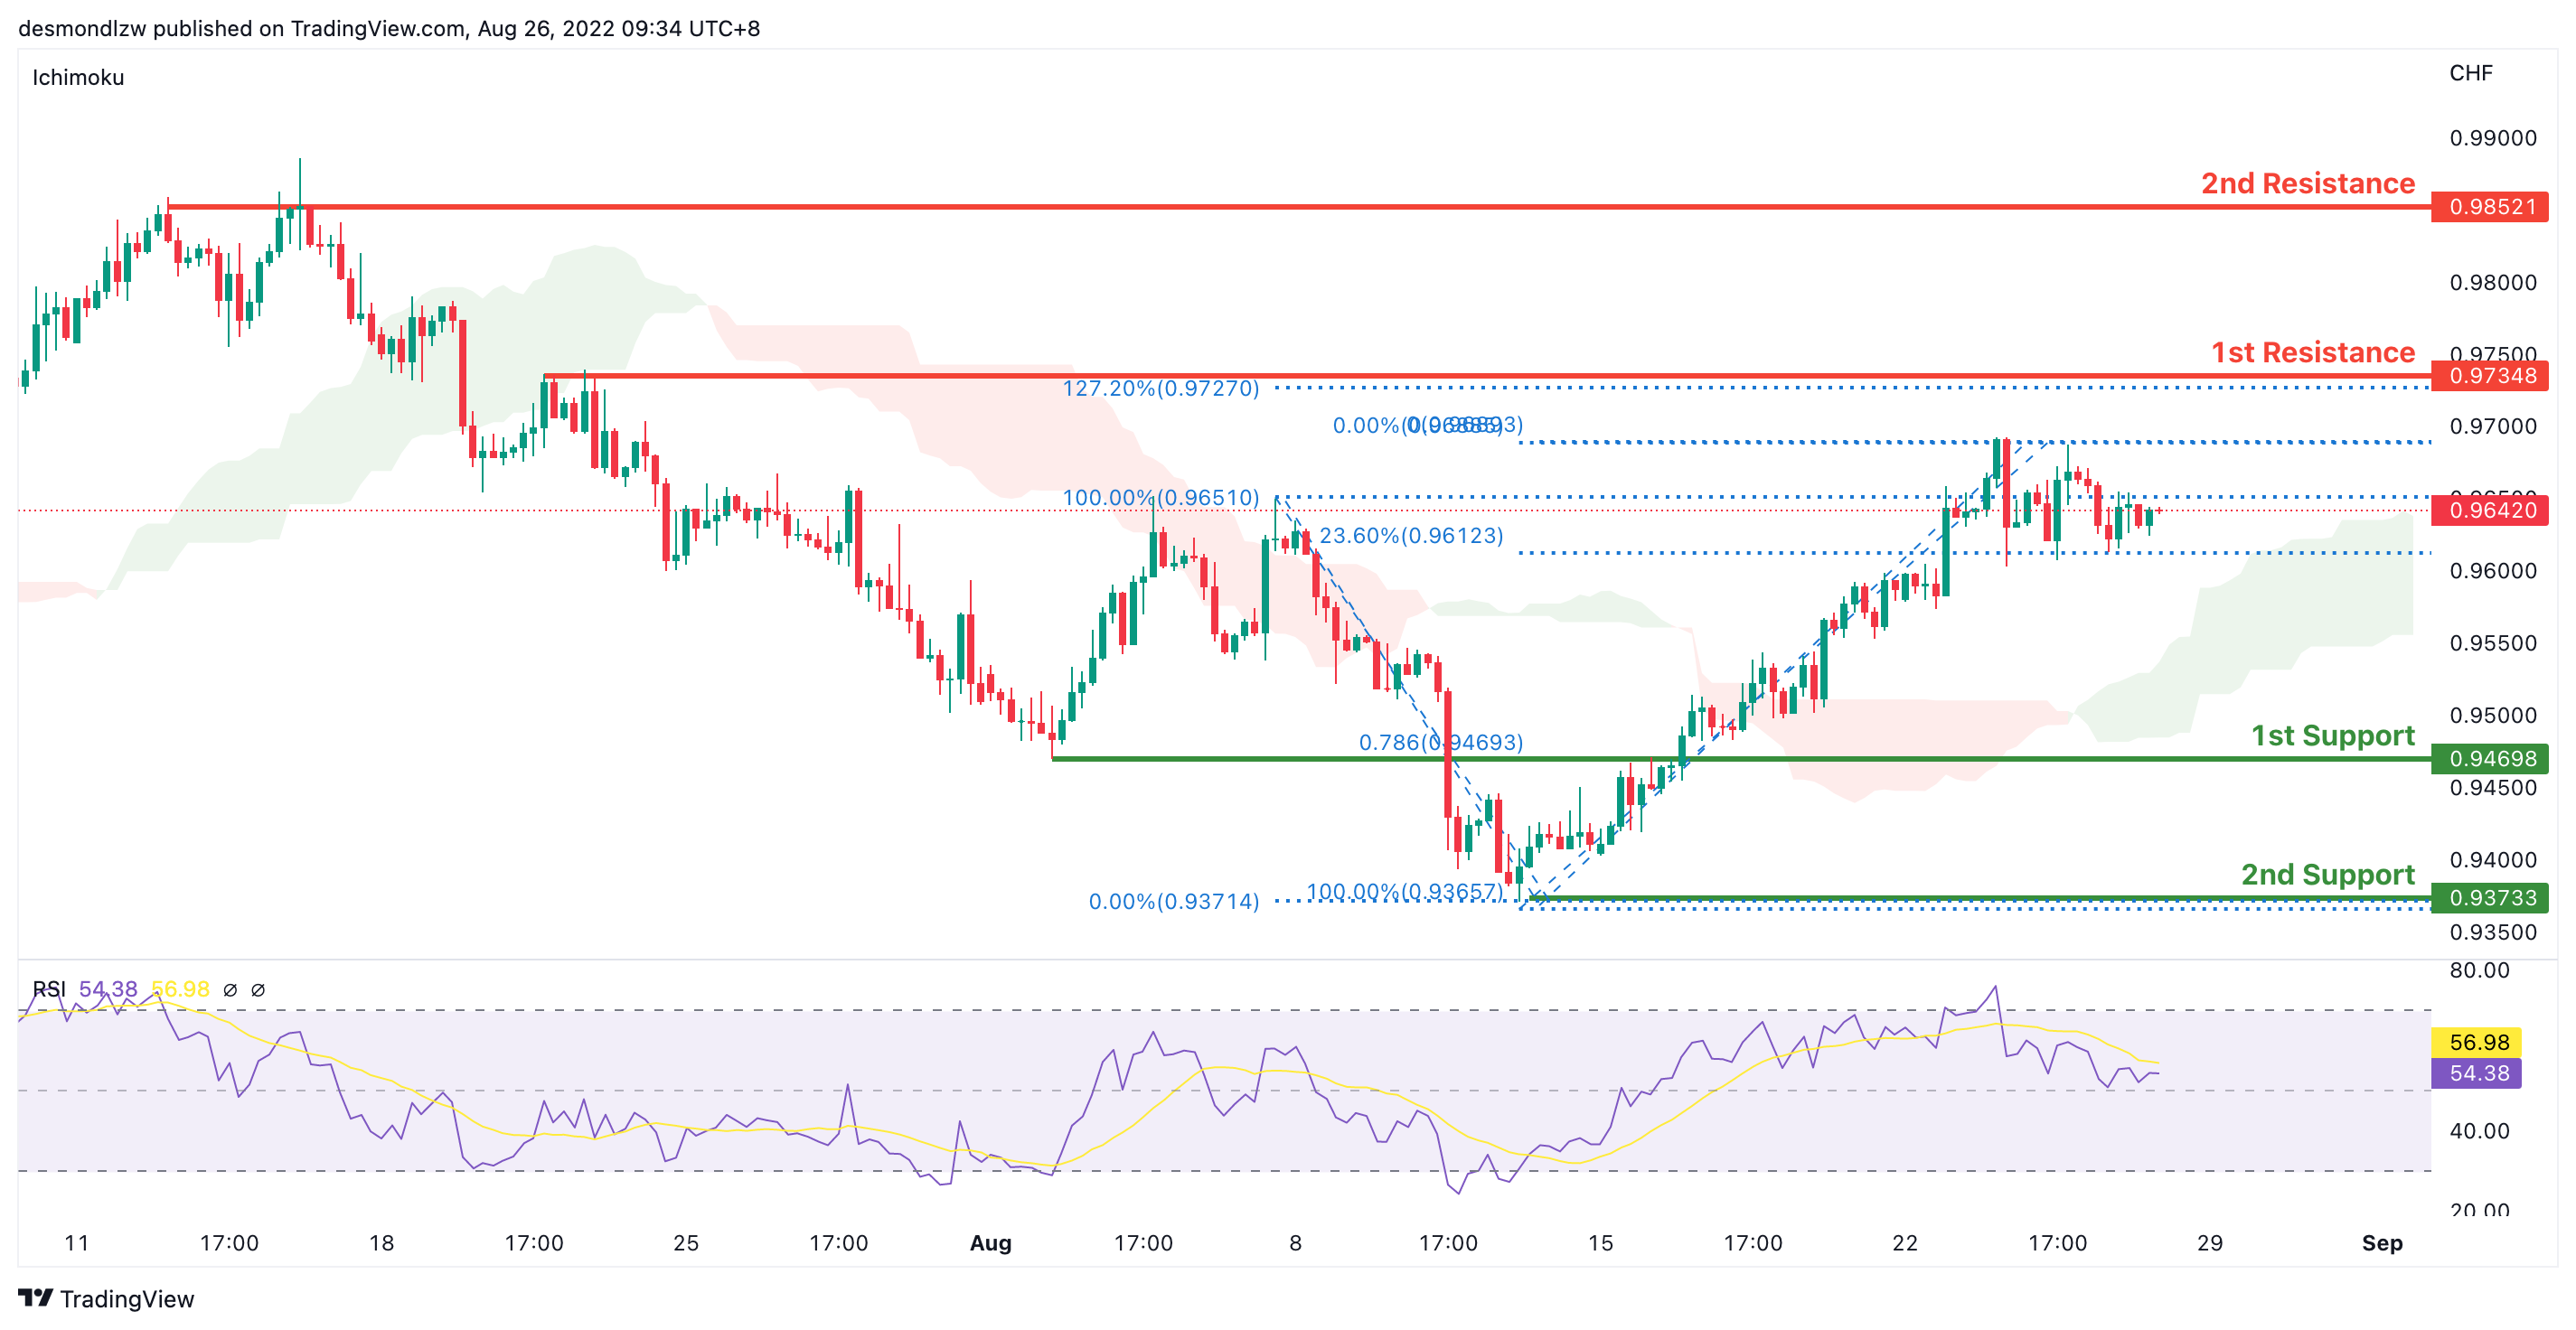
On the H4, with prices moving above the ichimoku cloud and breaking the descending trend, we are bullish bias. We’re looking at price to test the first resistance at 0.9734 where the 127.2% extension sits. If price continues with bullish momentum, it will bring price to second resistance at 0.9852. Alternatively, prices could test the intermediate support at 0.95500 where the swing low sits and then the first support at 0.9469 where the 78.6% fibonacci retracement sits
Areas of consideration
- H4 1st support at 0.9469
- H4 1st resistance at 0.9734
XAU/USD (GOLD):
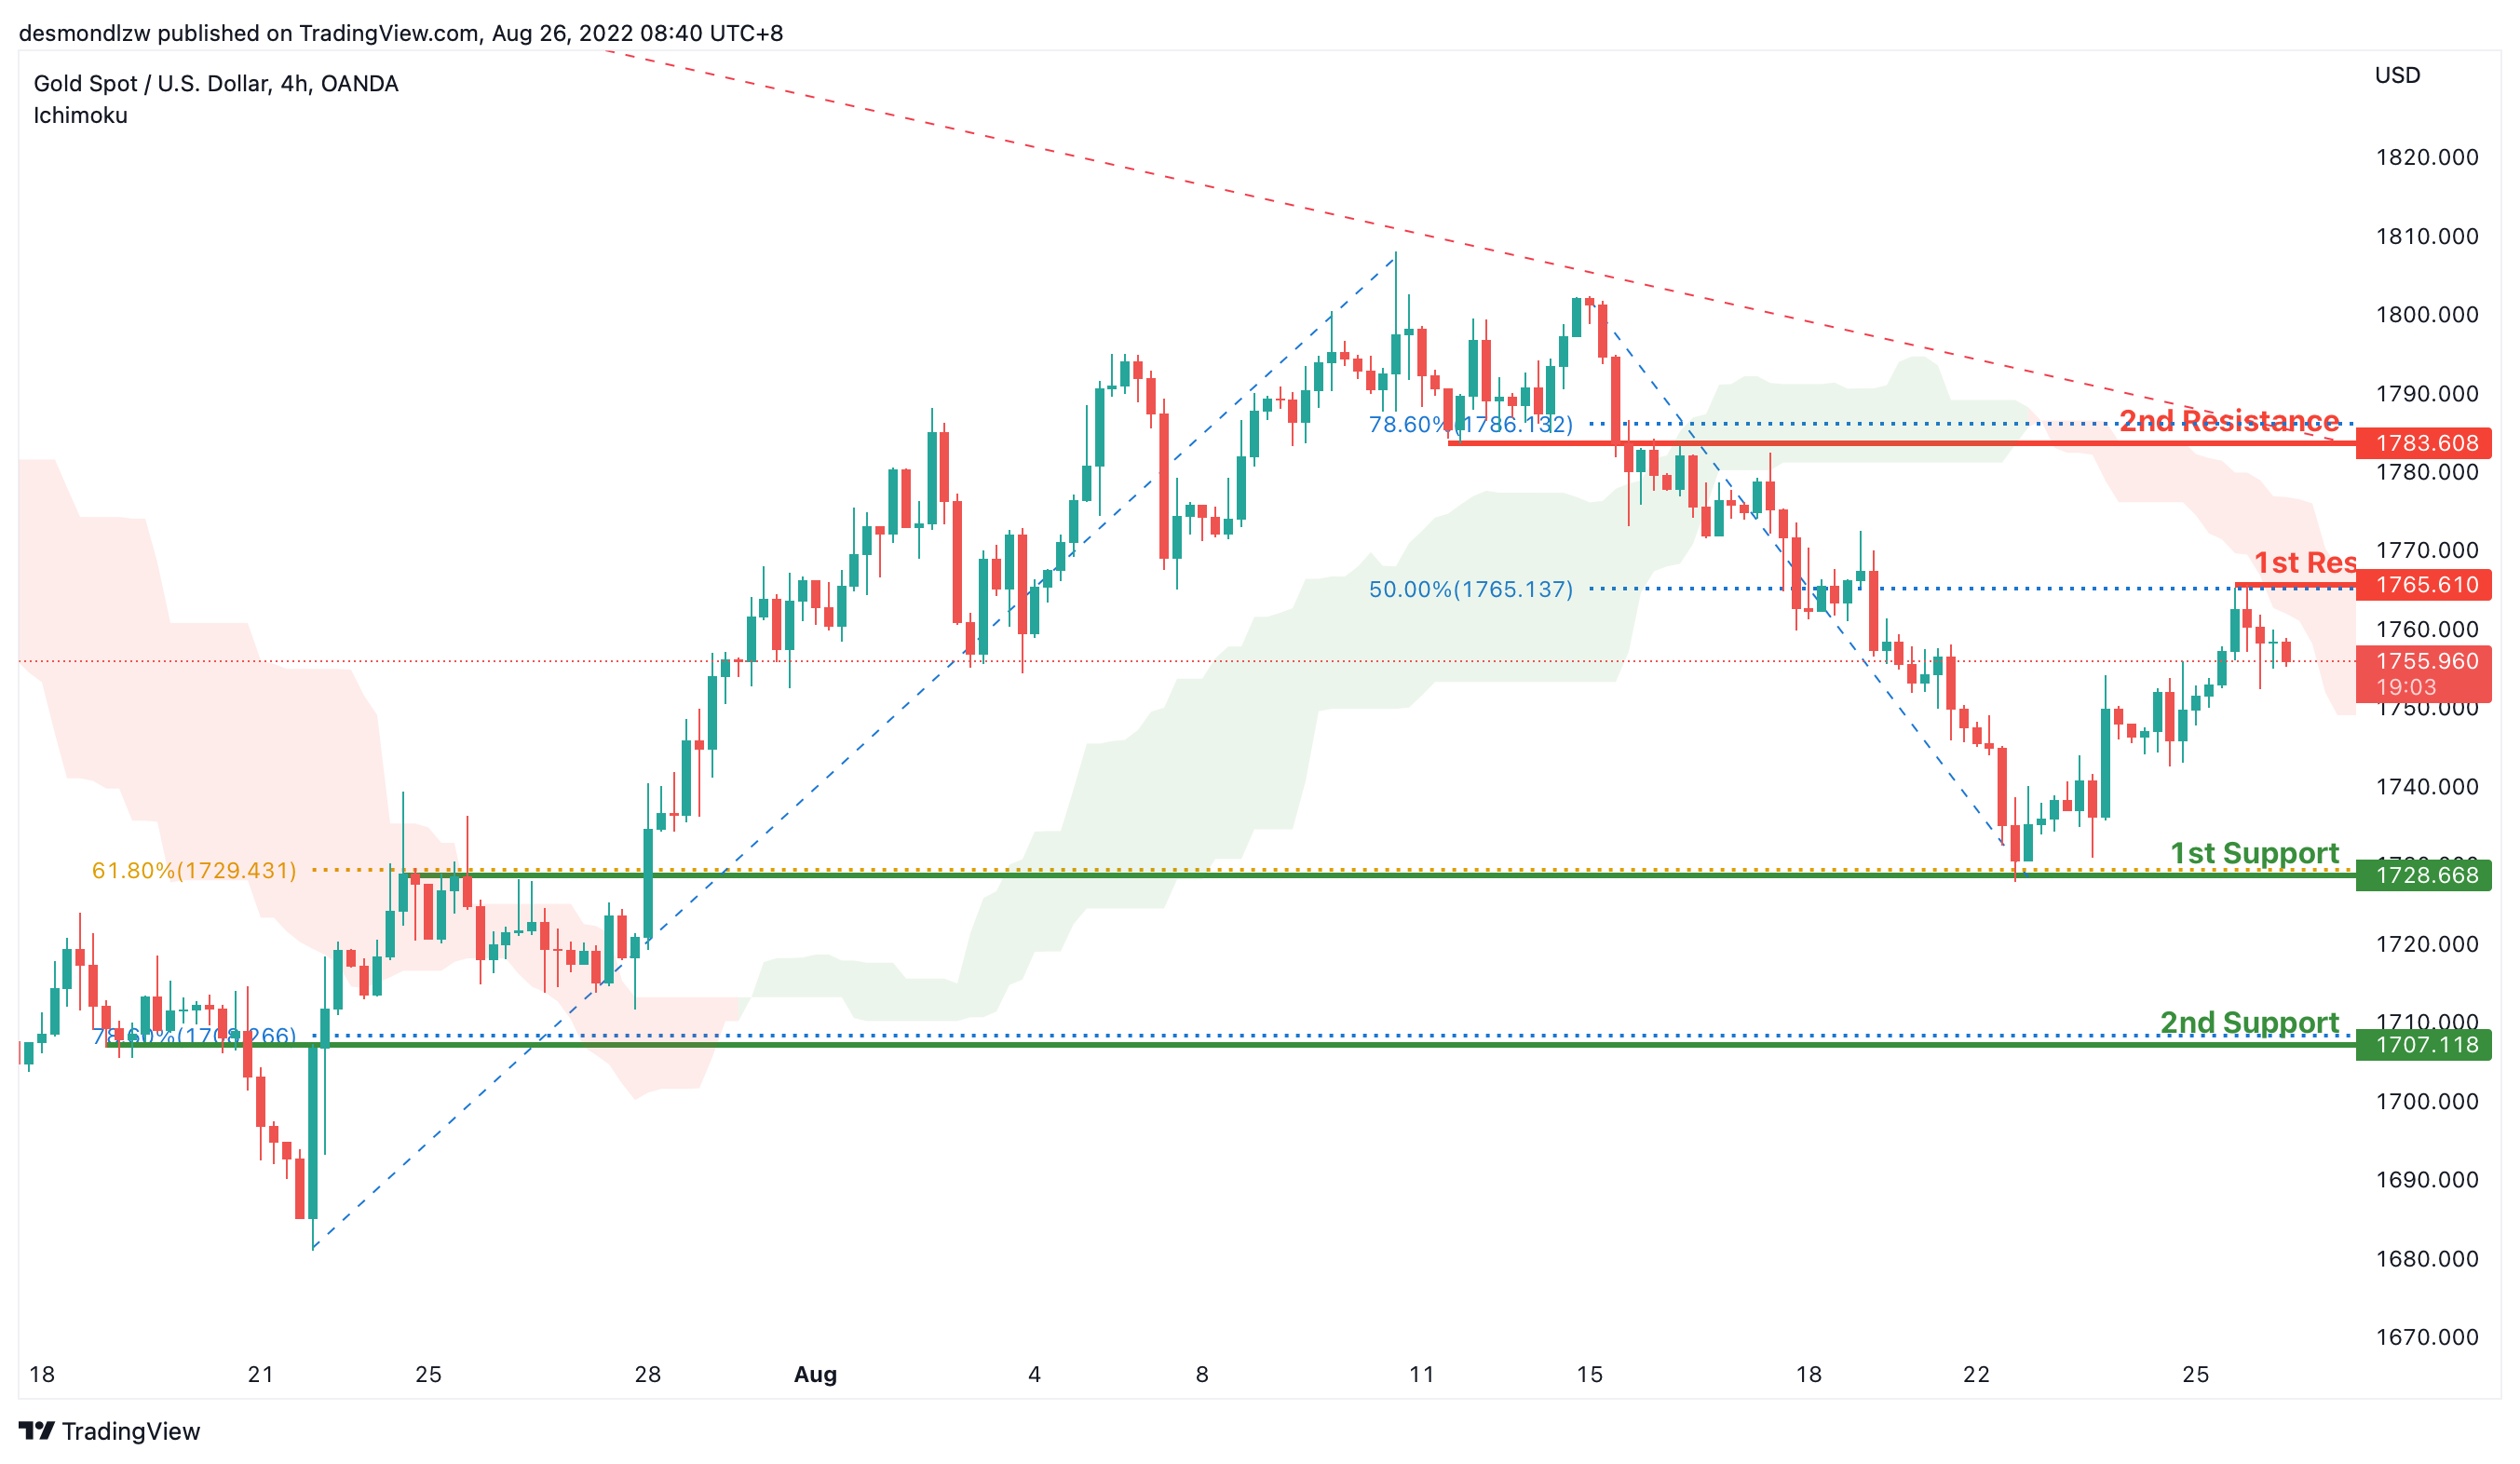
On the H4, with prices moving within the descending trendline, below ichimoku cloud, we have a bearish bias. After pulling back and testing the 1st resistance at 1765.610 where the 50% fibonacci retracement is, now the price may drop to the 1st support at 1728.668, where the overlap support and 61.8% fibonacci retracement are. If the price break the 1st support, it may drop to the 2nd support at 1707.118 where the 78.6% fibonacci retracement is.
Alternatively, price may rise to the 1st resistance at 1765.960 again and then rise to the 2nd resistance at 1783.608, where the 78.6% fibonacci retracement is.
Areas of consideration:
- H4 time frame, 1st resistance at 1765.960
- H4 time frame, 1st support at 1728.668
AUD/USD:
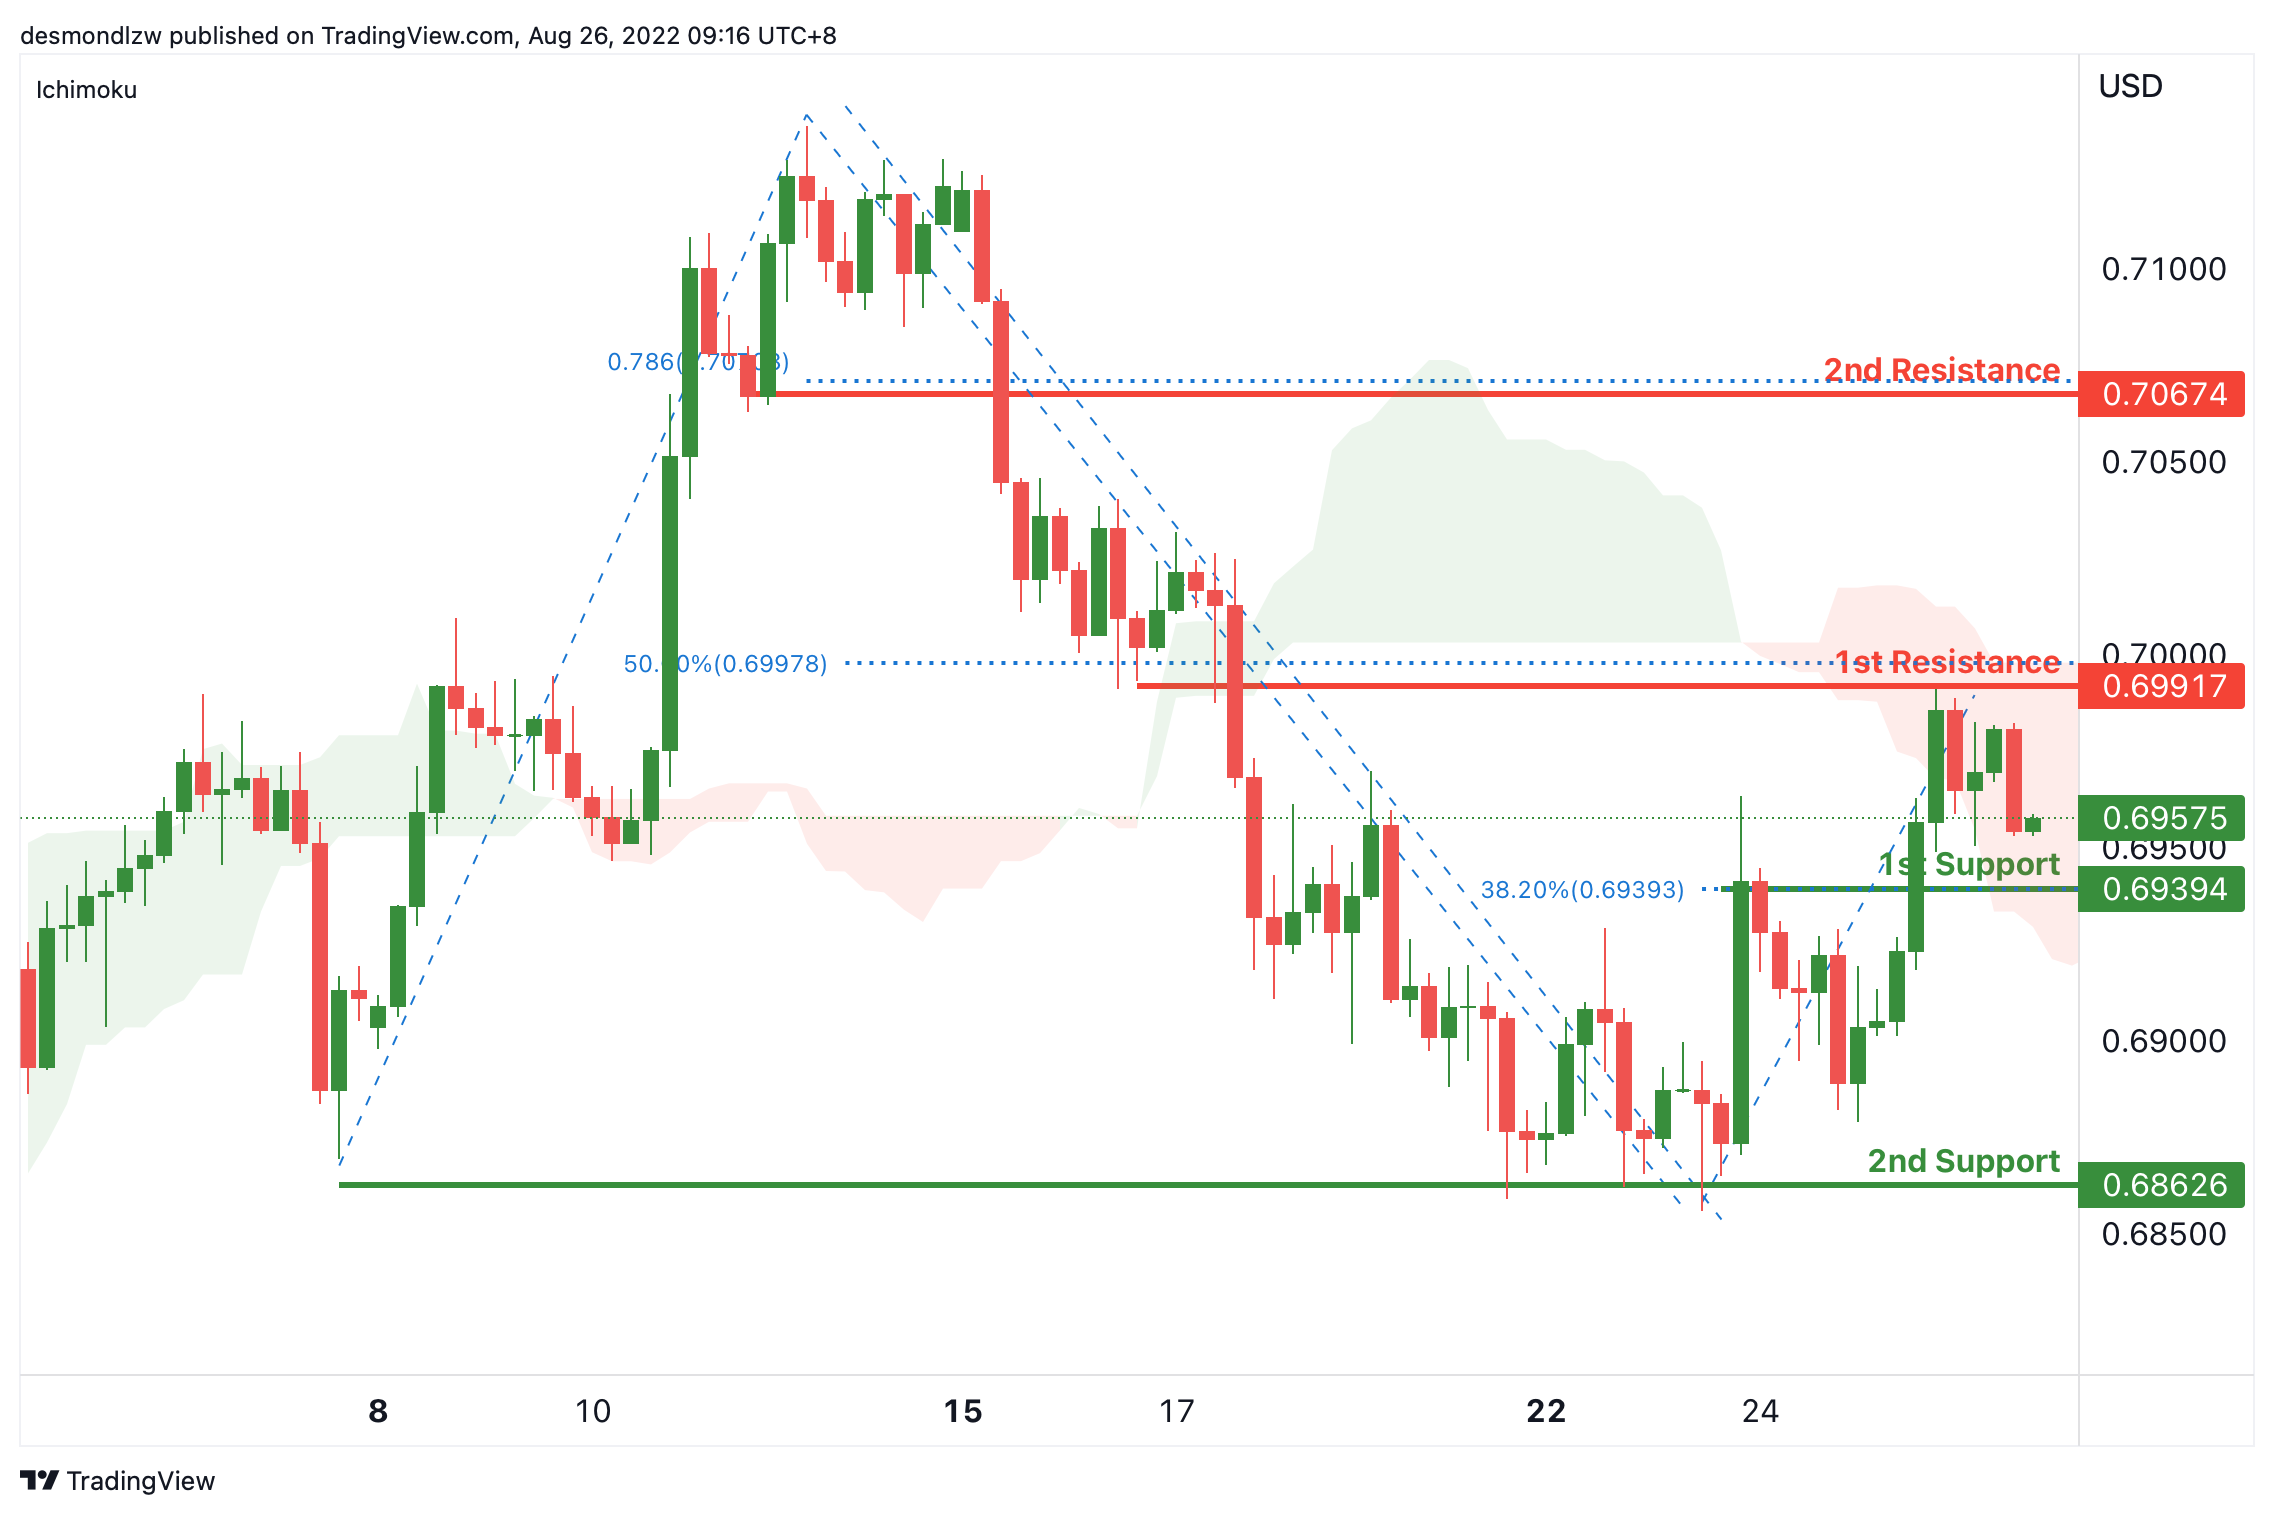
On the H4, with the price moving below the resistance of ichimoku cloud, we have a bearish bias that the price may drop from 1st support at 0.69394, where the 38.2% fibonacci retracement is to the 2nd support at 0.68626, which is in line with the swing lows. Alternatively, the price may rise to the 1st resistance at 0.69917, where the overlap resistance and 50% fibonacci retracement, if the price breaks this level, the 2nd resistance could be at 0.70674, which is in line with 78.6% fibonacci projection.
Areas of consideration
- H4 1st support at 0.69394
- H4 2nd support at 0.68626
NZD/USD:
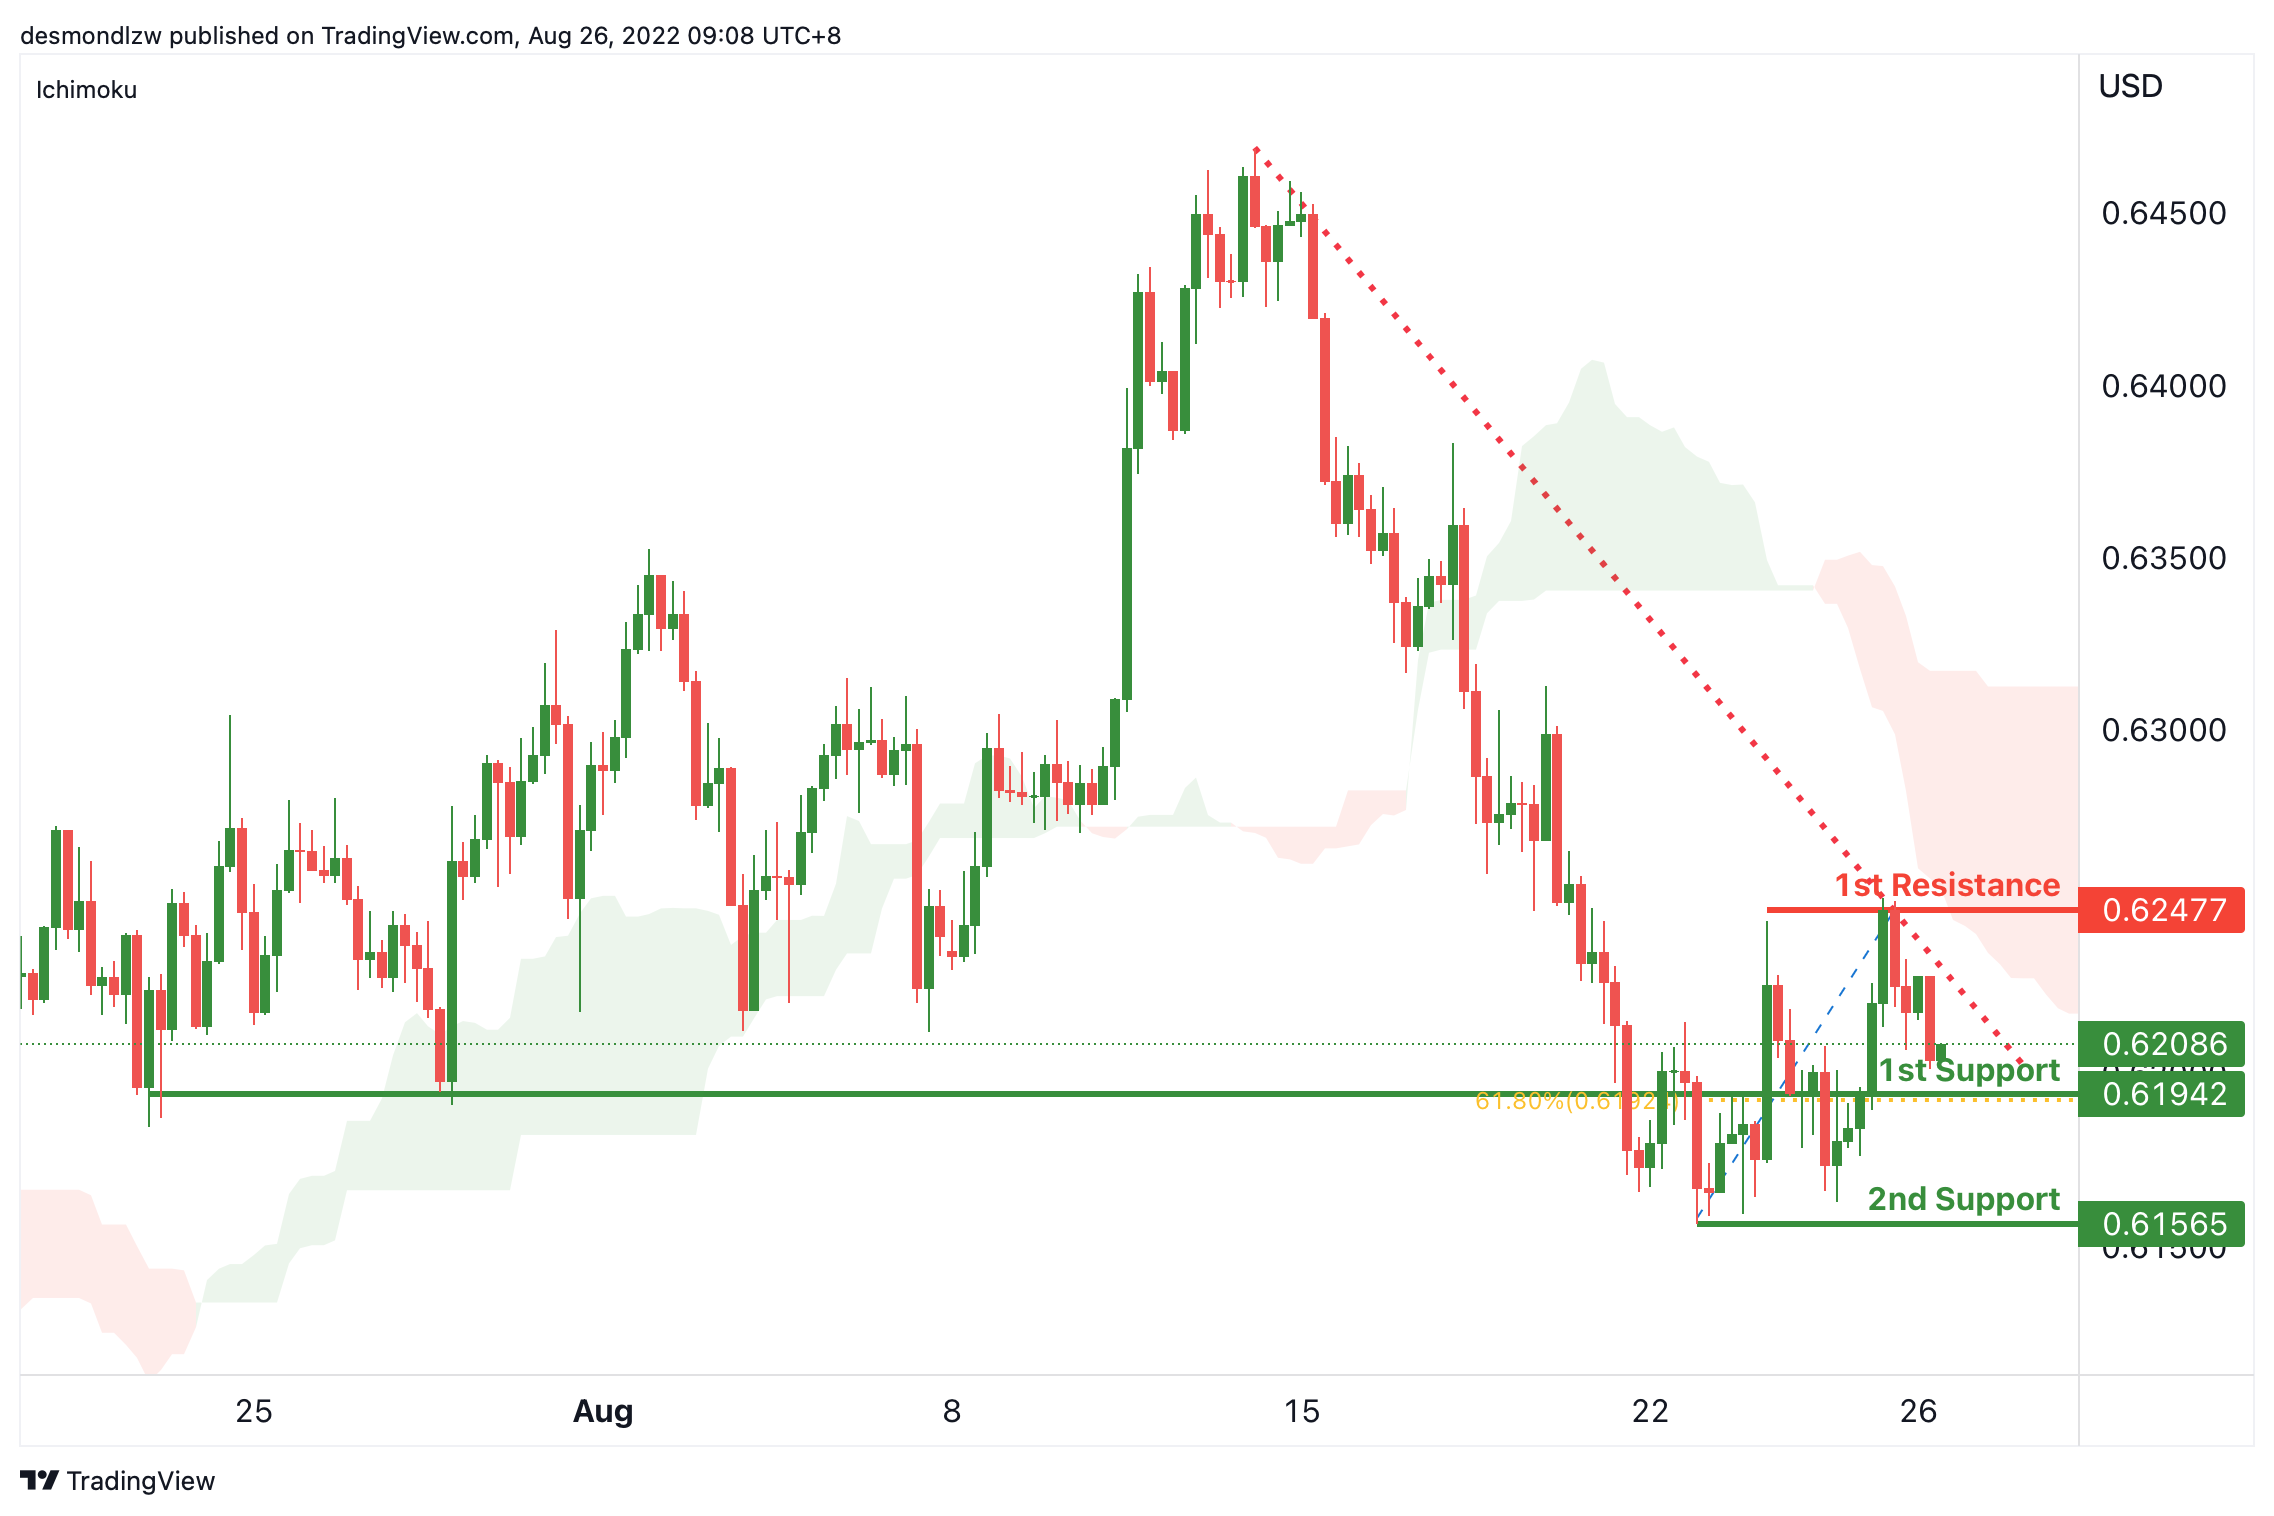
On the H4, with price moving within the descending trendline and below the ichimoku indicator, we have a bearish bias that price will drop from 1st support at 0.61942, where the overlap support and 61.8% fibonacci retracement are to the 2nd support at 0.61565, where the swing low is. Alternatively, price could rise to 1st resistance at 0.62477, which is in line with the swing highs.
Areas of consideration:
- H4 time frame, 1st support at 0.61942
- H4 time frame, 2nd support at 0.61565
USD/CAD:
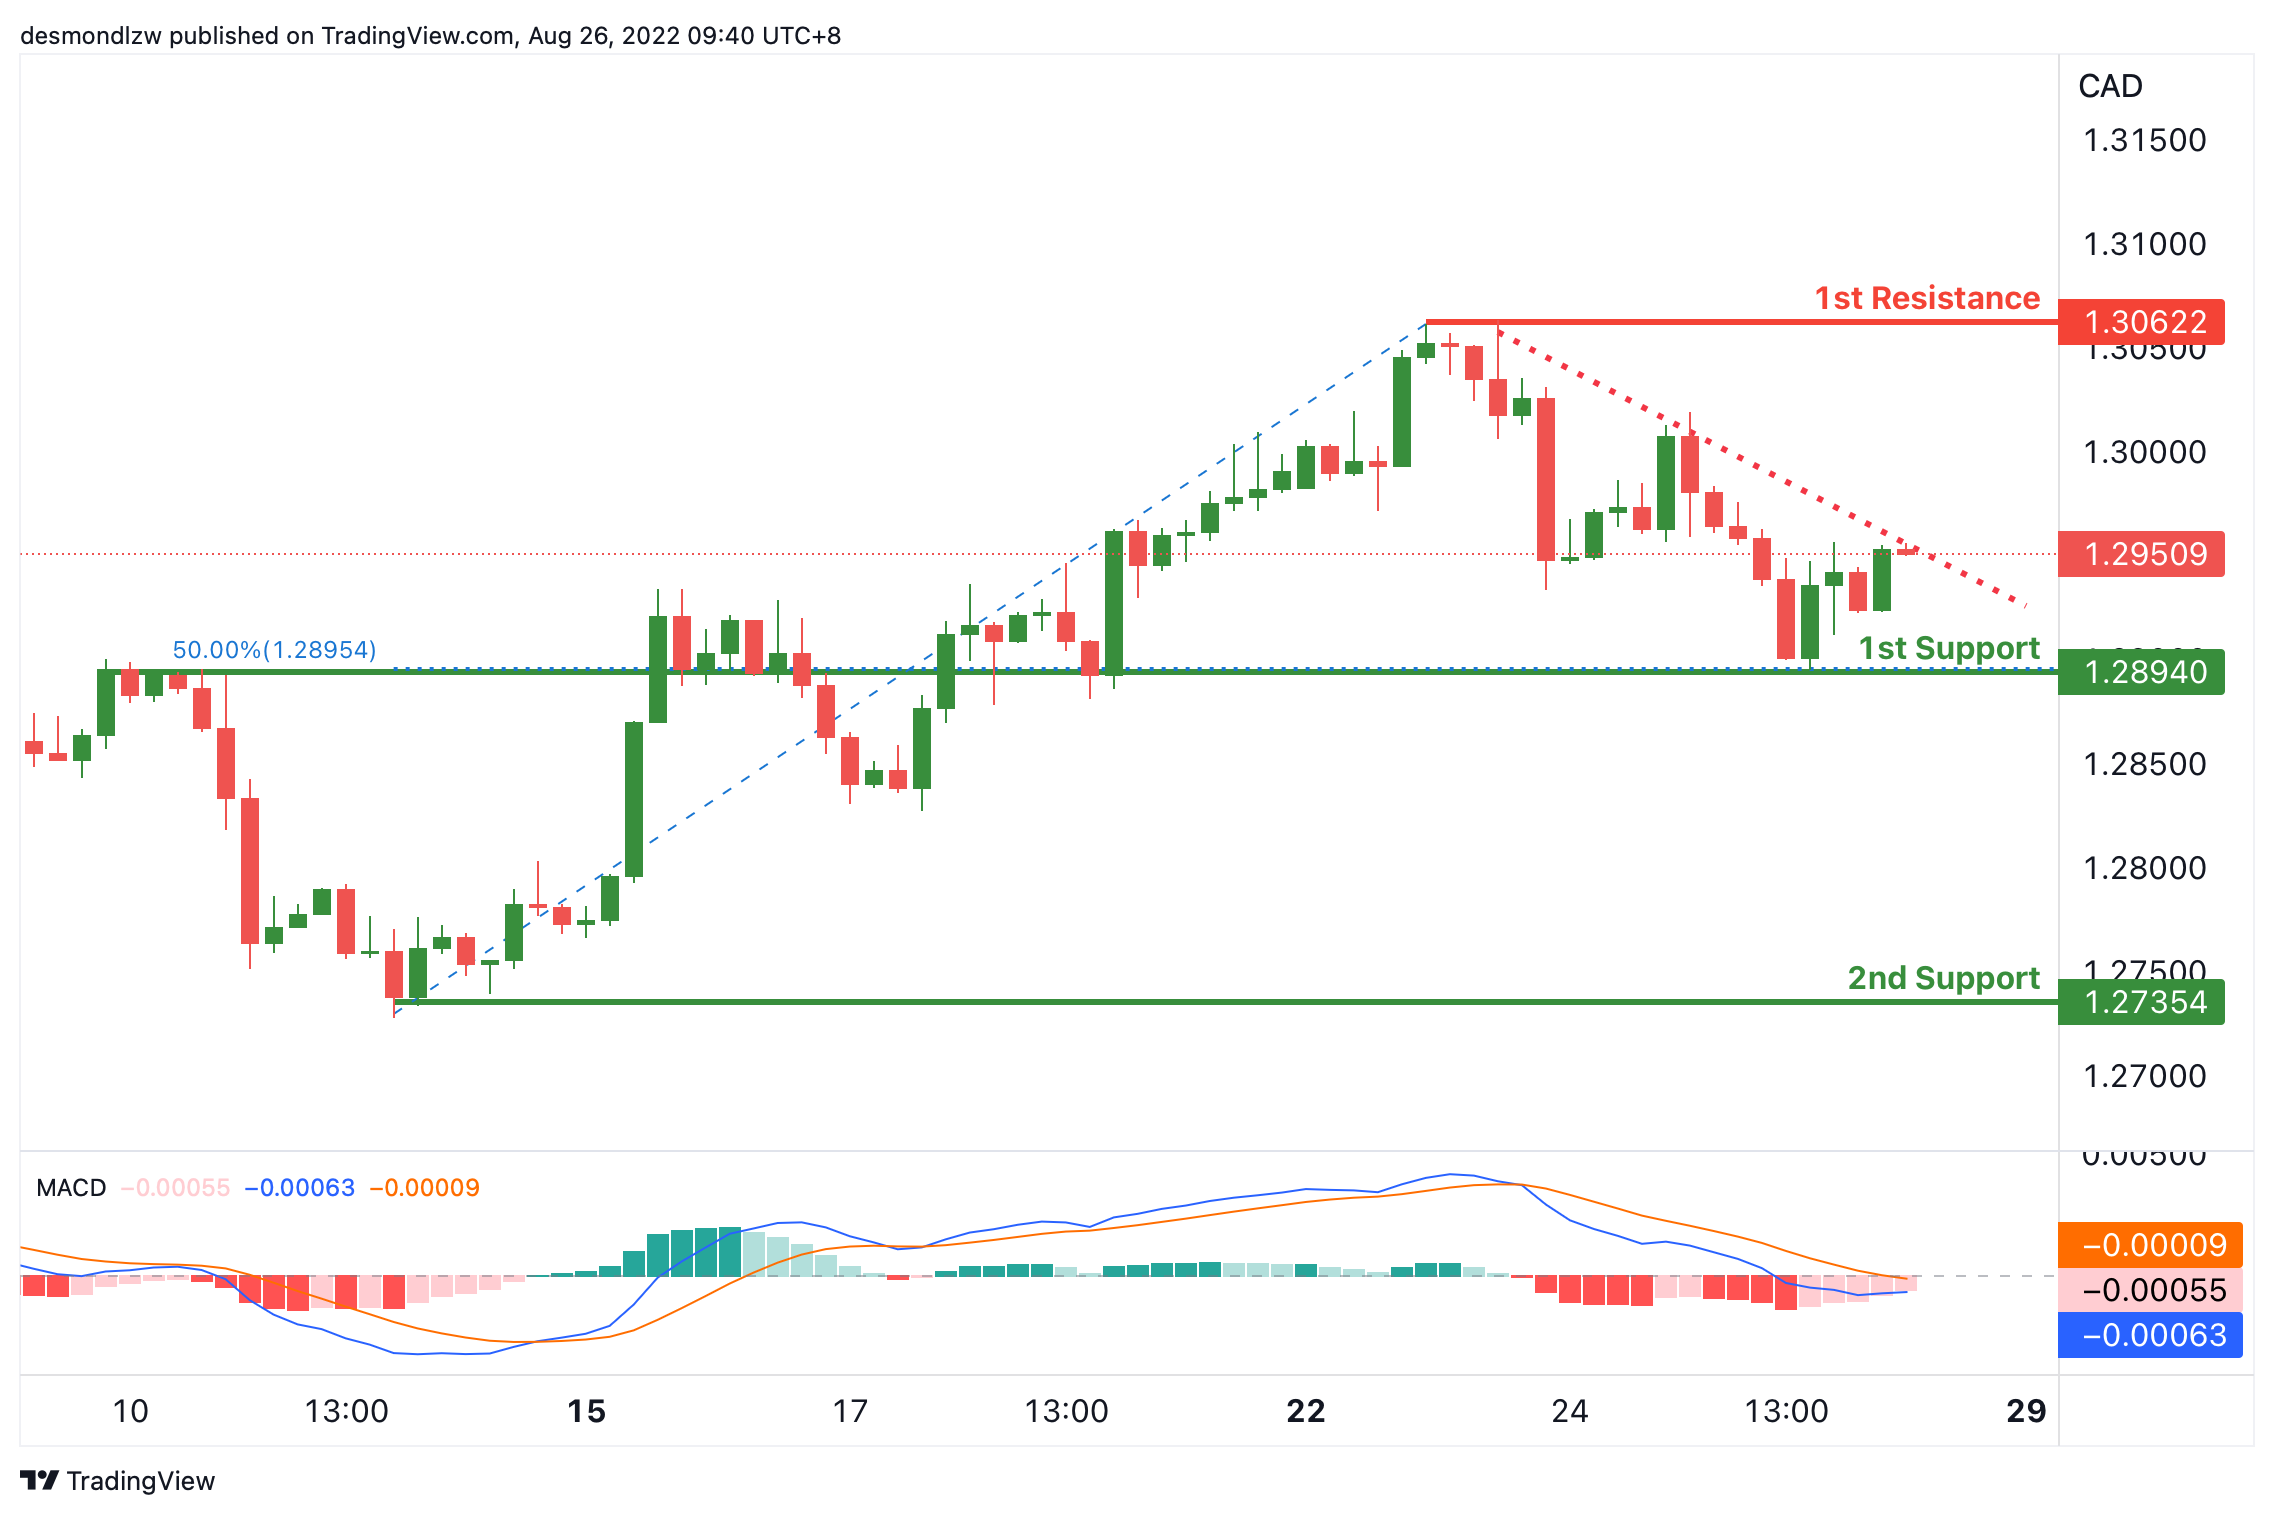
On the H4, with the price moving below the descending trendline and MACD indicators are below zero, we have a bearish bias that the price may drop form the 1st support at 1.28940, where the 50% fibonacci retracement and overlap support are to the 2nd support at 1.27354, where the swing low is. Alternatively, price could break the descending trendline and rise to the 1st resistance at 1.30622, where the swing high is.
Areas of consideration:
- H4 time frame, 1st support at 1.28940
- H4 time frame, 2nd support at 1.27354
OIL:
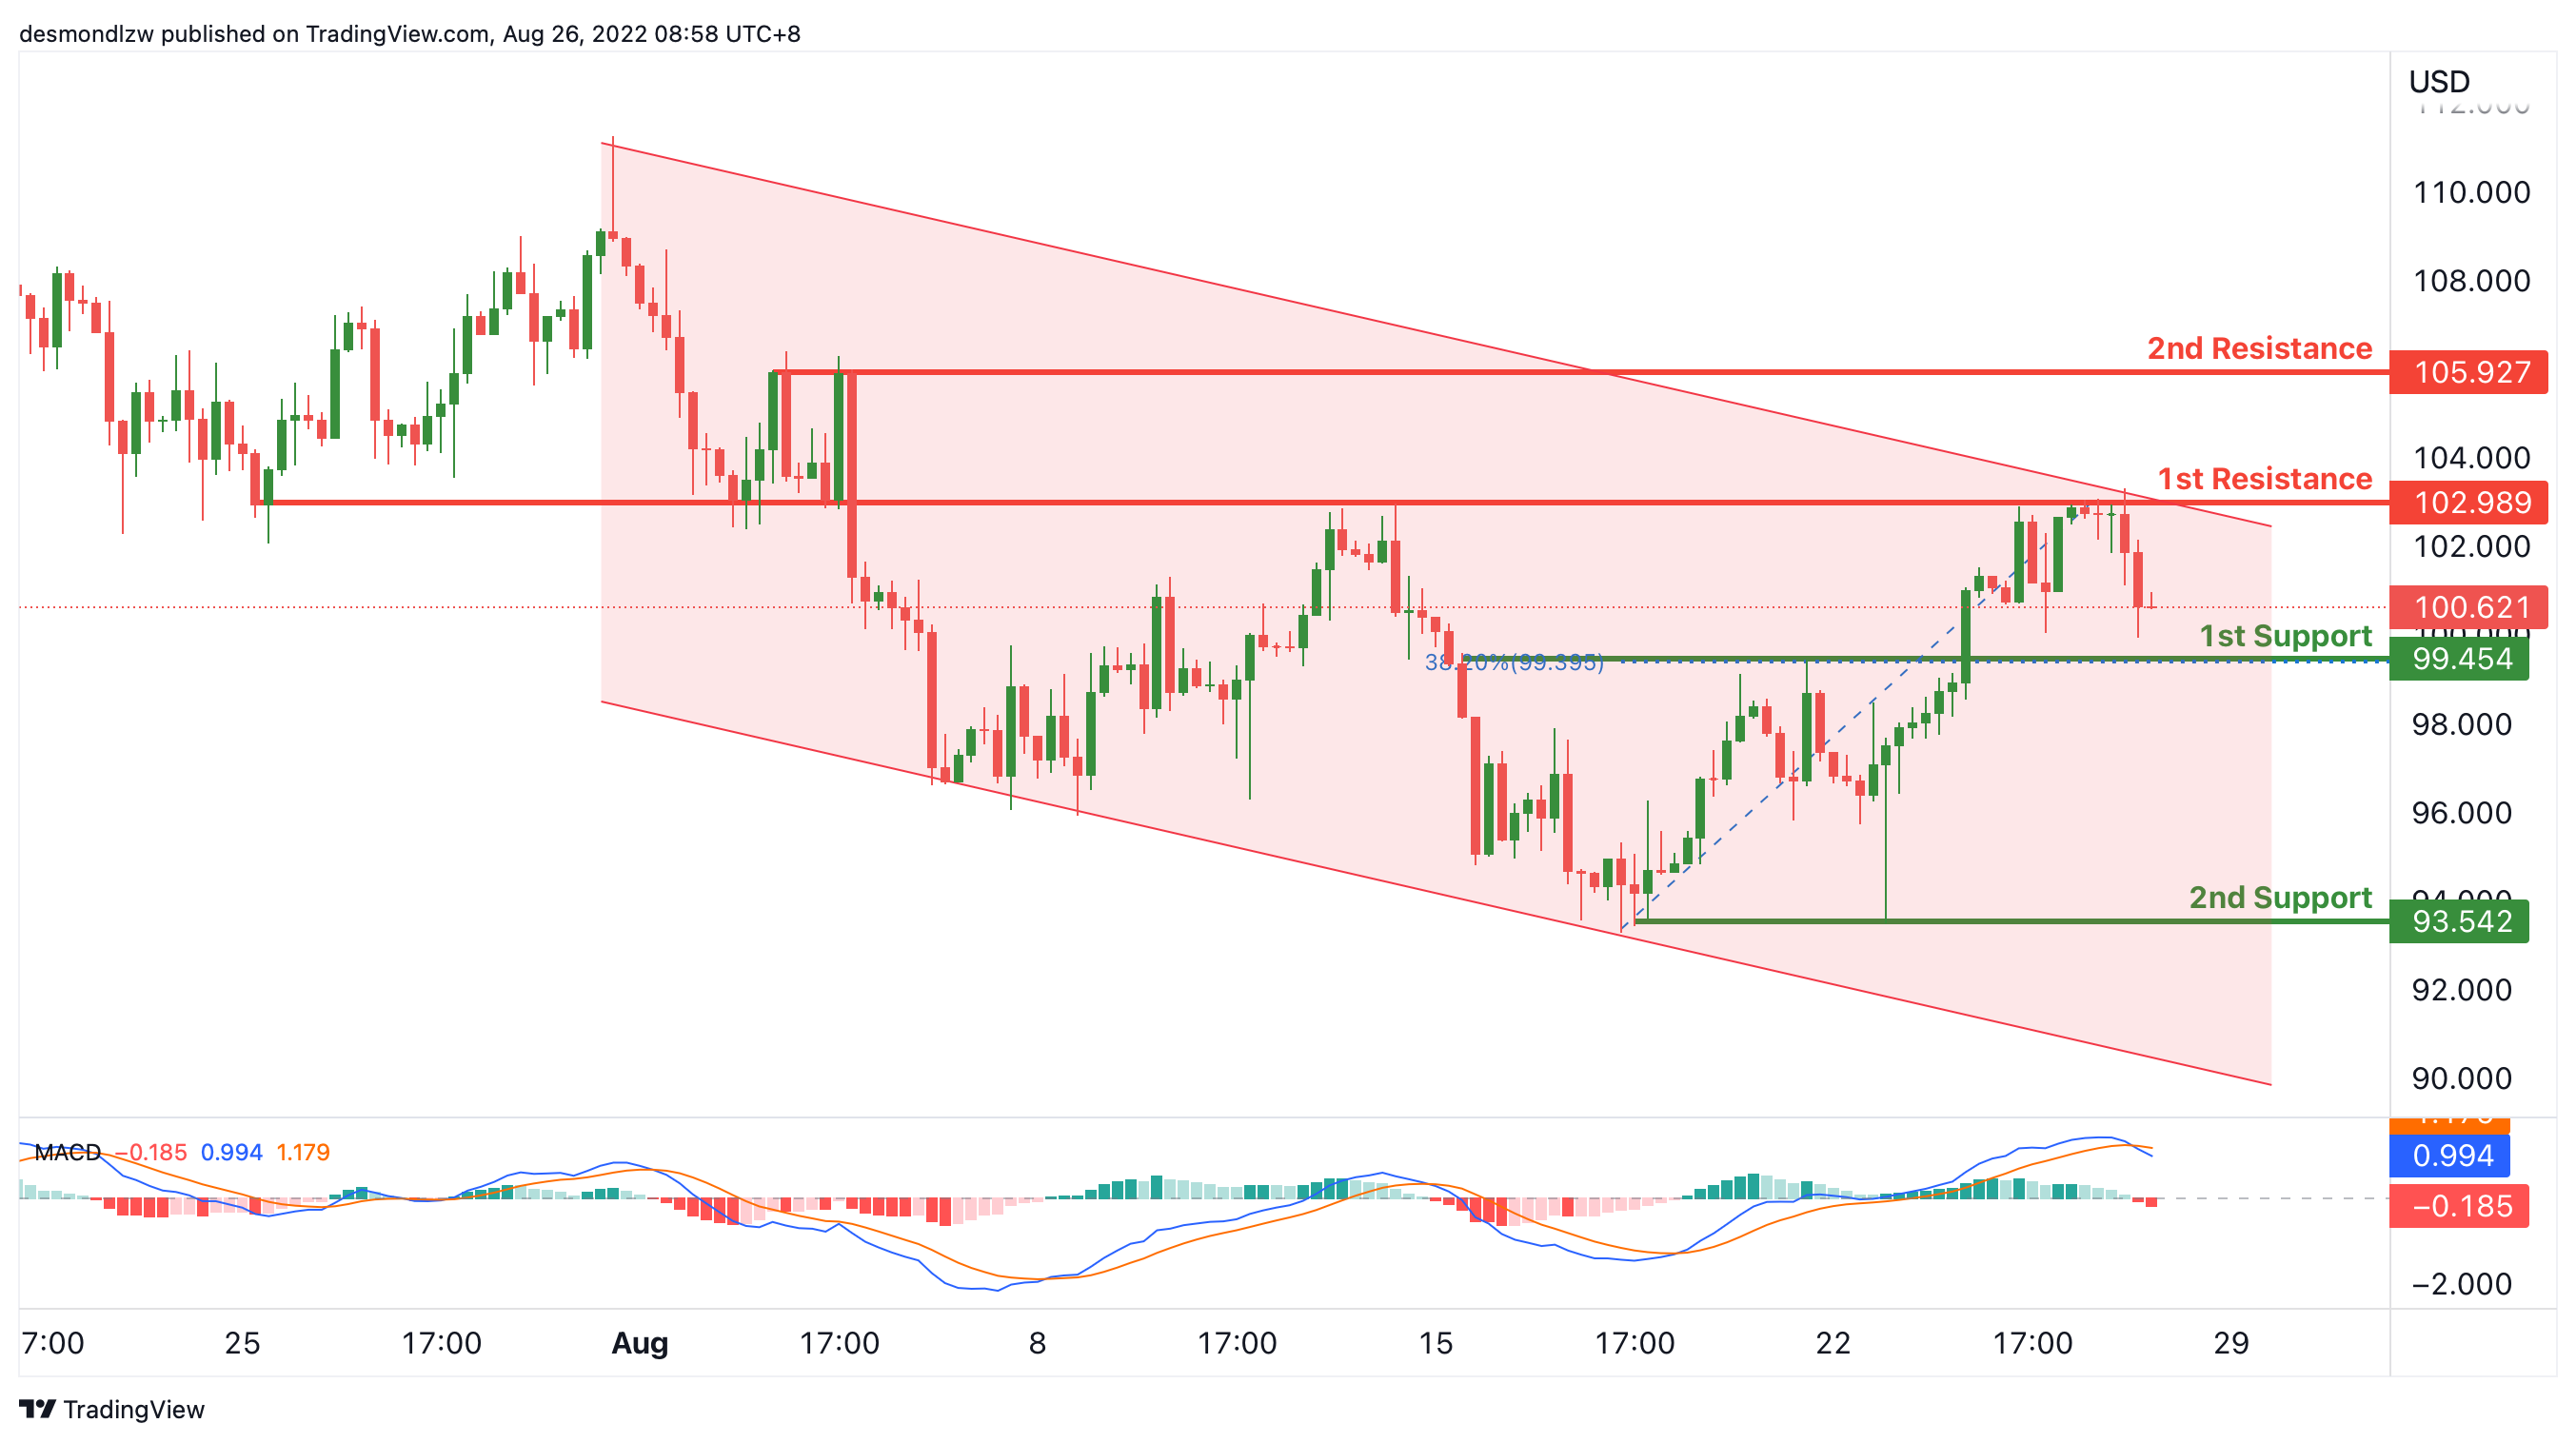
On the H4, with price moving within the descending channel and DIF line is crossing below the signal line in MACD, we have a bearish bias that the price may drop from the 1st support at 99.454, where the 38.2% fibonacci retracement is to the 2nd support at 93.542, which is in line with the swing low support. Alternatively, the price may rise to the 1st resistance at 102.989, where the overlap resistance is. If the price break the 1st resistance, the price could reach the 2nd resistance at 105.927, where the swing high is.
Areas of consideration:
- H4 time frame, 1st support at 99.454
- H4 time frame, 2nd support at 93.542
Dow Jones Industrial Average:
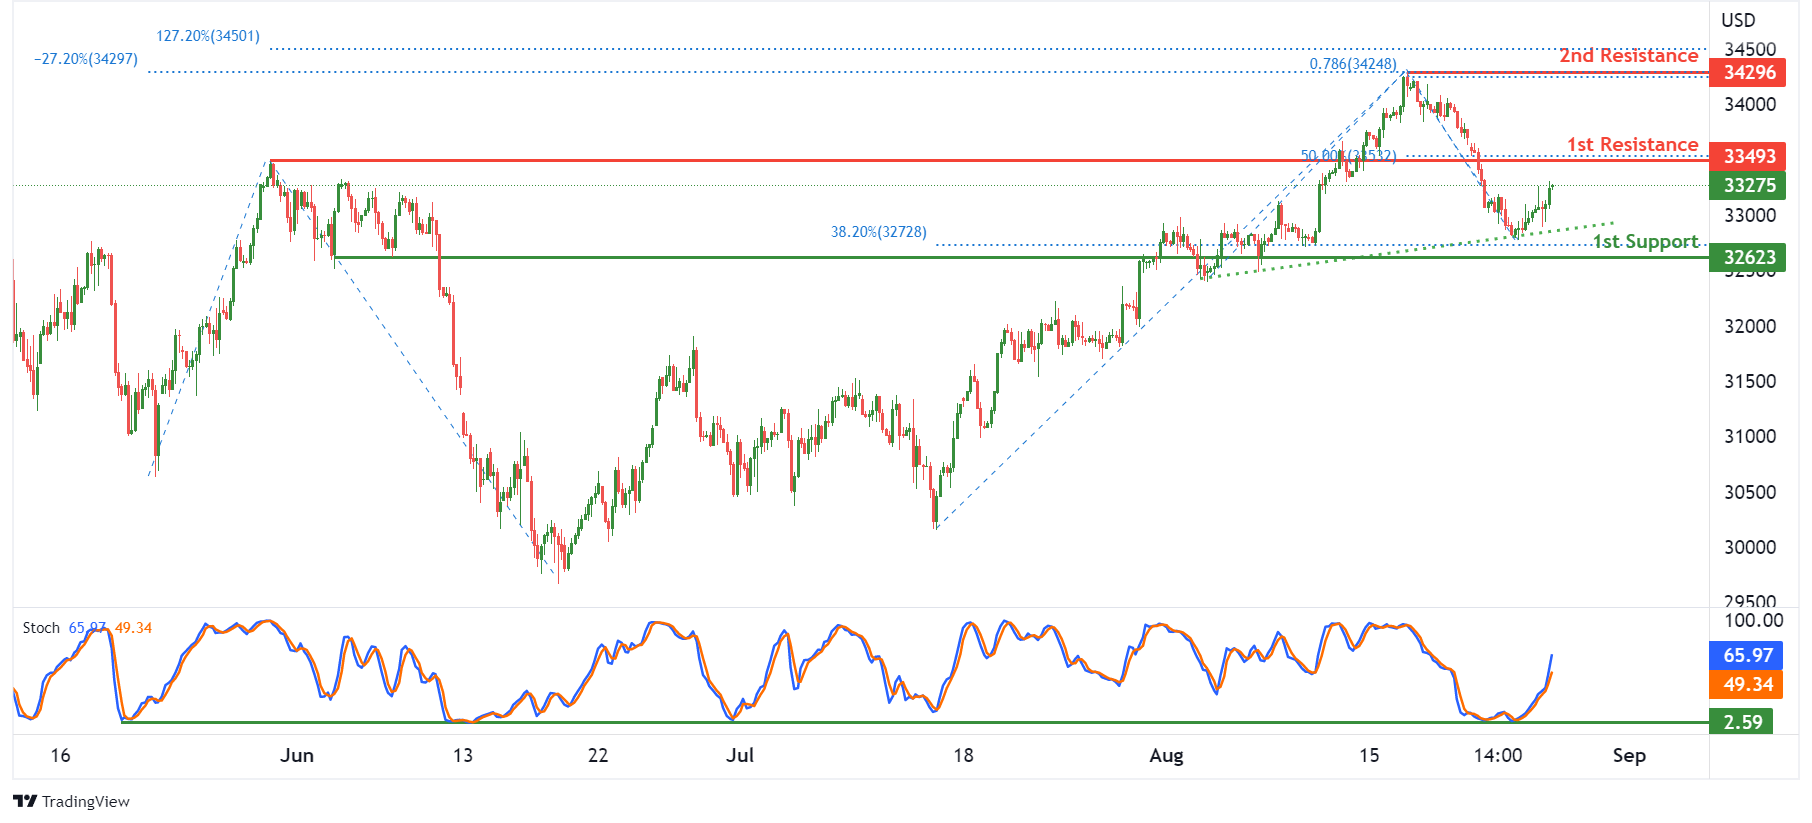
On the H4, with price moving along the ascending trendline and bouncing off the stochastic support,we have a bullish bias that price will rise to 1st resistance at 33493 where the pullback resistance and 50% fibonacci retracement are. Should price break 1st resistance, we would expect bullish momentum to carry price to 2nd resistance at 34296 where the swing high resistance, 127.2% fibonacci extension, -27.2% fibonacci expansion and 78.6% fibonacci projection are. Alternatively, price could drop to 1st support at 32623 where the pullback support and 38.2% fibonacci retracement are.
Areas of consideration:
- H4 time frame, 1st resistance of 33493
- H4 time frame, 1st support at 32623
DAX:
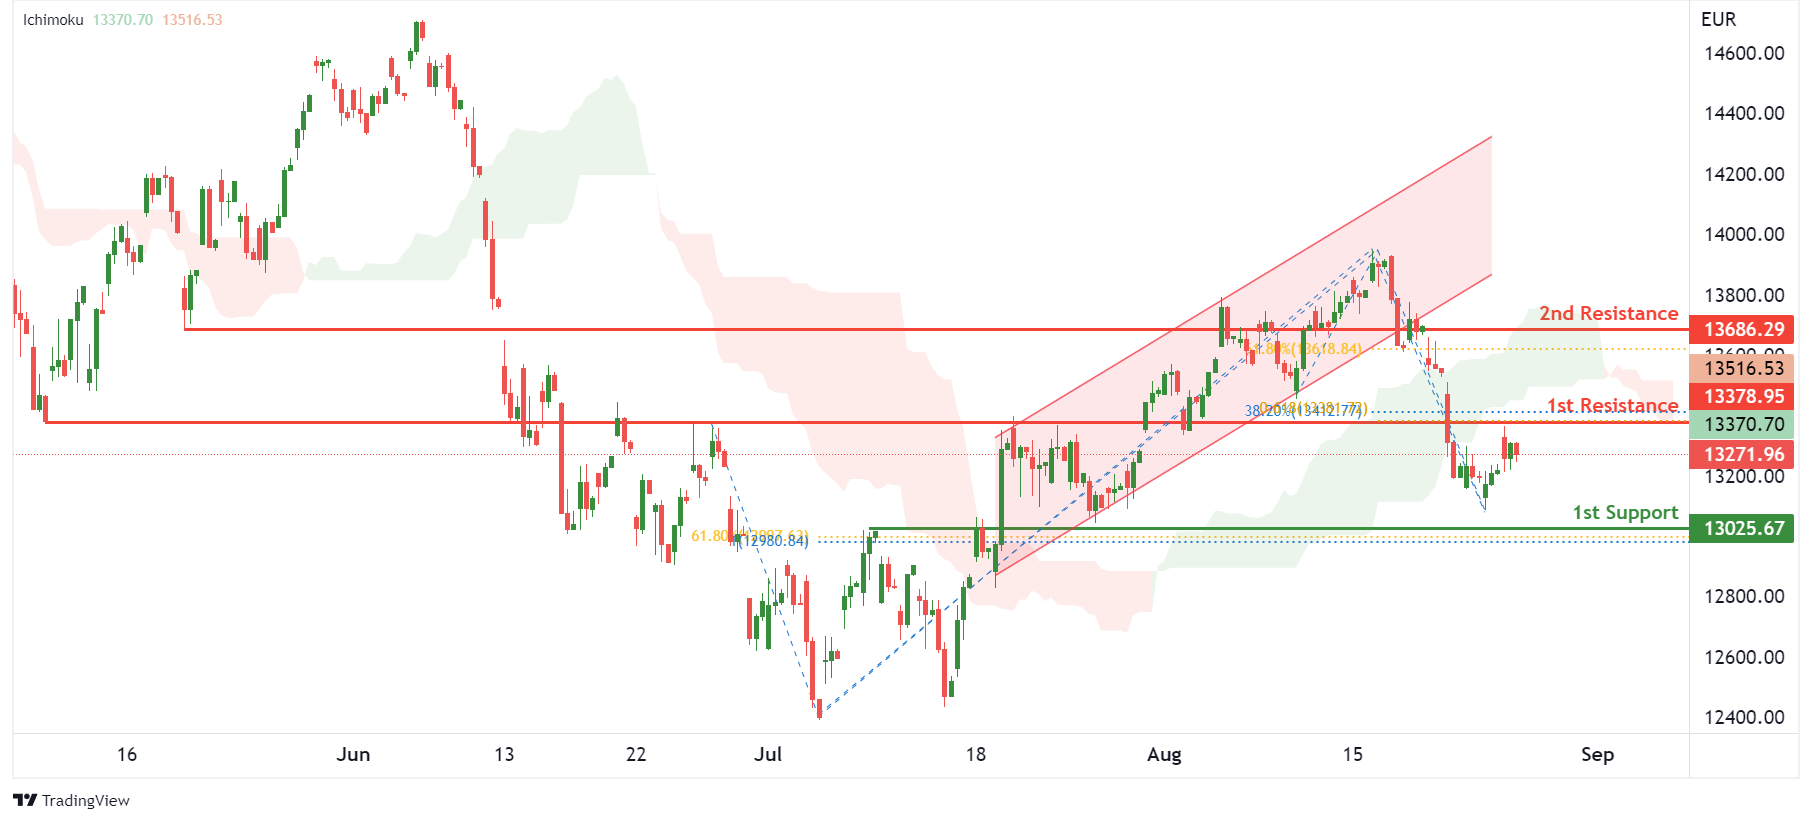
On the H4, with price breaking out of an ascending channel and moving below the ichimoku indicator, we have a bearish bias that price will drop from 1st resistance at 13378.95 where the overlap resistance, 38.2% fibonacci retracement and 61.8% fibonacci projection are to the 1st support at 13025.67 where the pullback support, 61.8% fibonacci retracement and 100% fibonacci projection are. Alternatively, price could break 1st resistance and rise to 2nd resistance at 13686.29 where the pullback resistance and 61.8% fibonacci retracement are.
Areas of consideration:
- H4 time frame, 1st resistance of 13378.95
- H4 time frame, 1st support at 13025.67
ETHUSD:
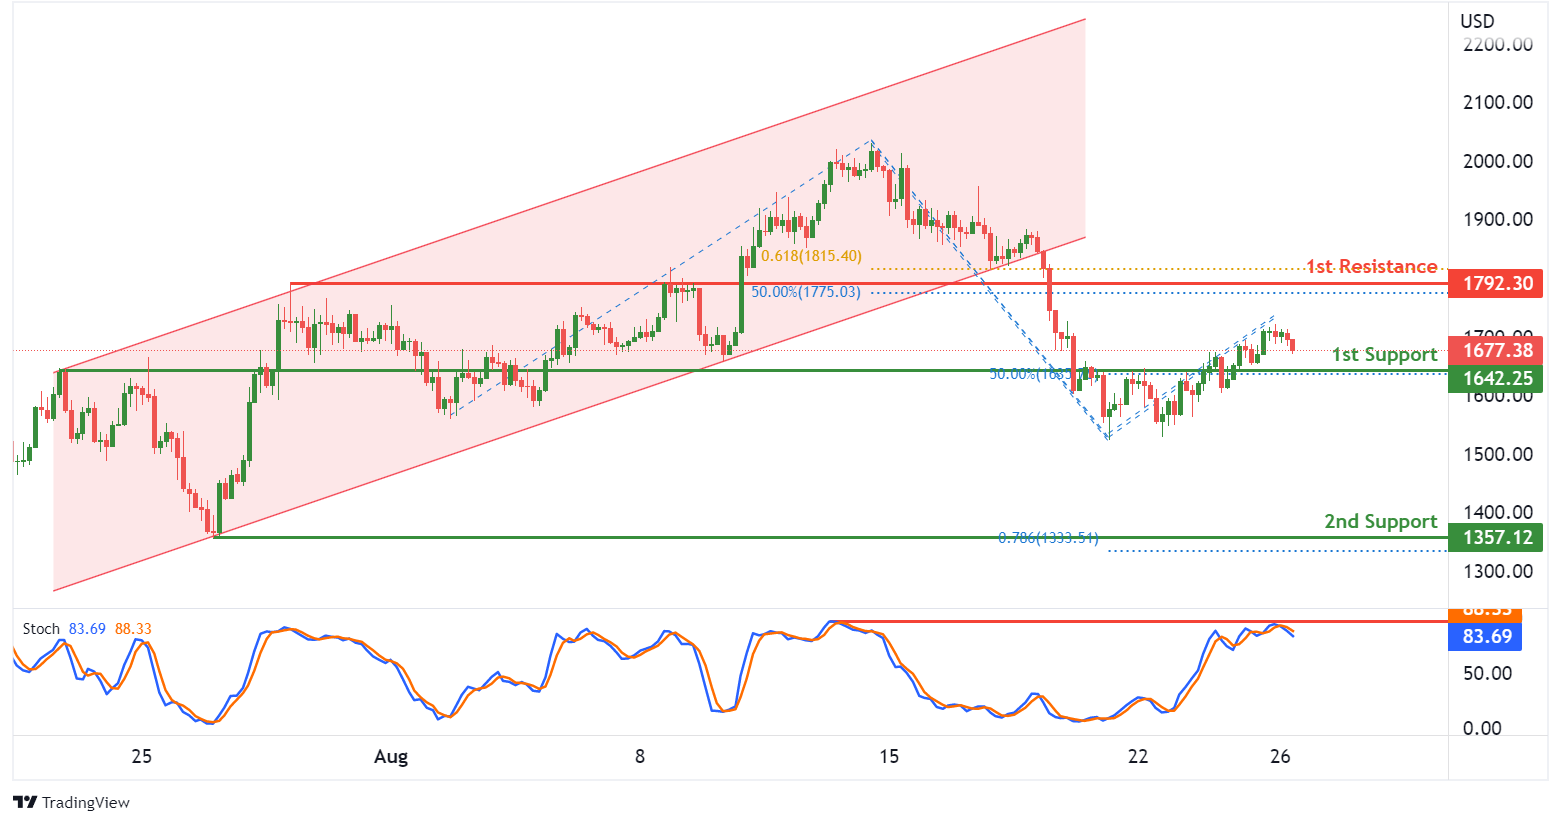
On the H4, with price breaking out of an ascending channel and reversing off the stochastic resistance, we have a bearish bias that price will drop to the 1st support at 1642.25 where the pullback support and 50% fibonacci retracement are. Once there is downside confirmation that price has broken 1st support, we would expect bearish momentum to carry price to 2nd support at 1357.12 where the swing low support and 78.6% fibonacci projection are. Alternatively, price could rise to 1st resistance at 1792.30 where the overlap resistance, 50% fibonacci retracement and 61.8% fibonacci projection are.
Areas of consideration:
- H4 time frame, 1st resistance of 1792.30
- H4 time frame, 1st support at 1642.25
BTCUSD:
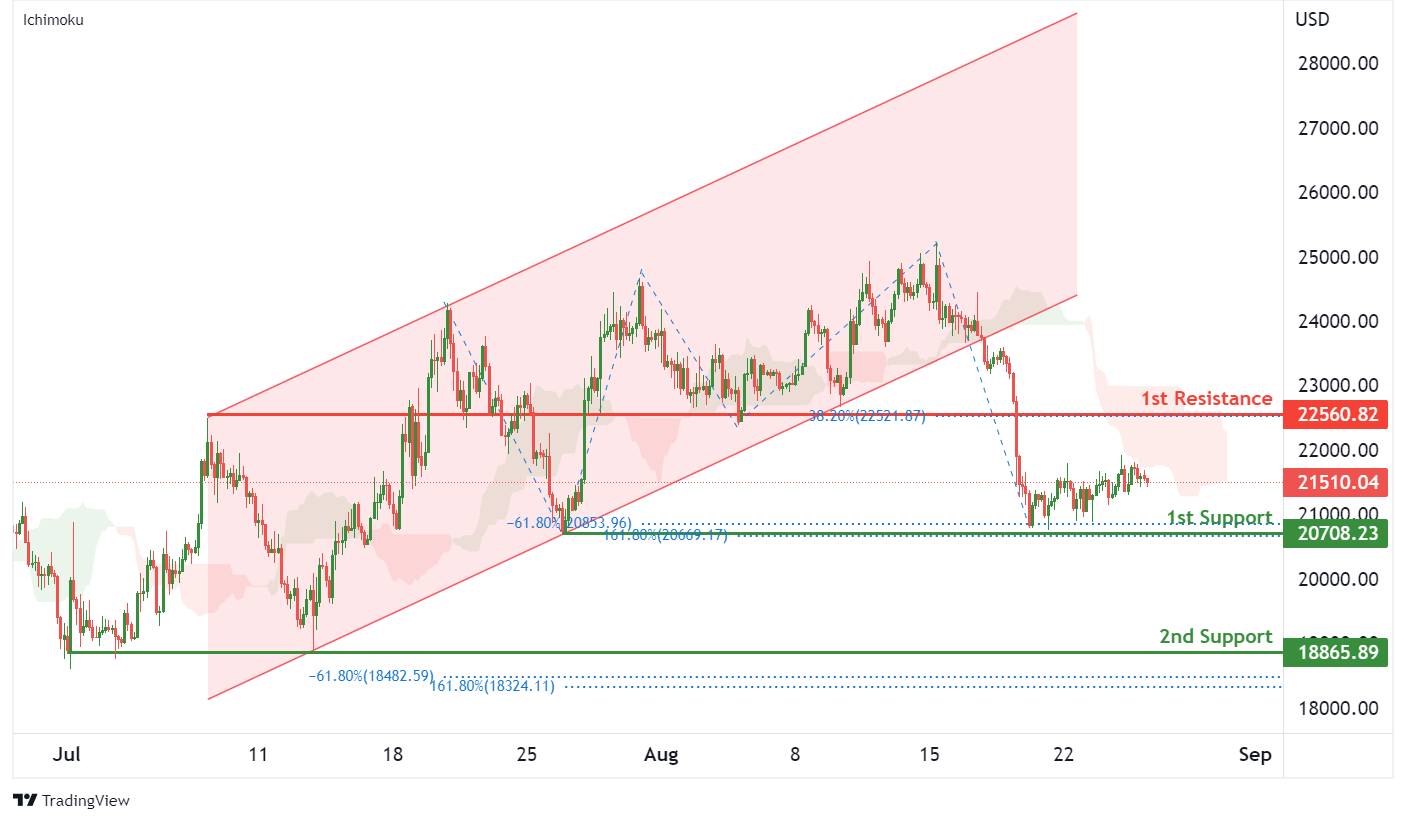
On the H4, with price breaking out of a bullish channel and moving below the ichimoku indicator, we have a bearish bias that price will drop to 1st support at 20708.23 where the -61.8% fibonacci expansion, 161.8% fibonacci extension and swing low support are. Once we have downside confirmation of price breaking 1st support structure,we would expect bearish momentum to carry price to 2nd support at 18865.89 where the swing low support, -61.8% fibonacci expansion and 161.8% fibonacci extension are. Alternatively, price could rise to 1st resistance at 22560.82 where the pullback resistance and 38.2% fibonacci retracement are.
Areas of consideration:
- H4 time frame, 1st resistance of 22560.82
- H4 time frame, 1st support at 20708.23
S&P 500:
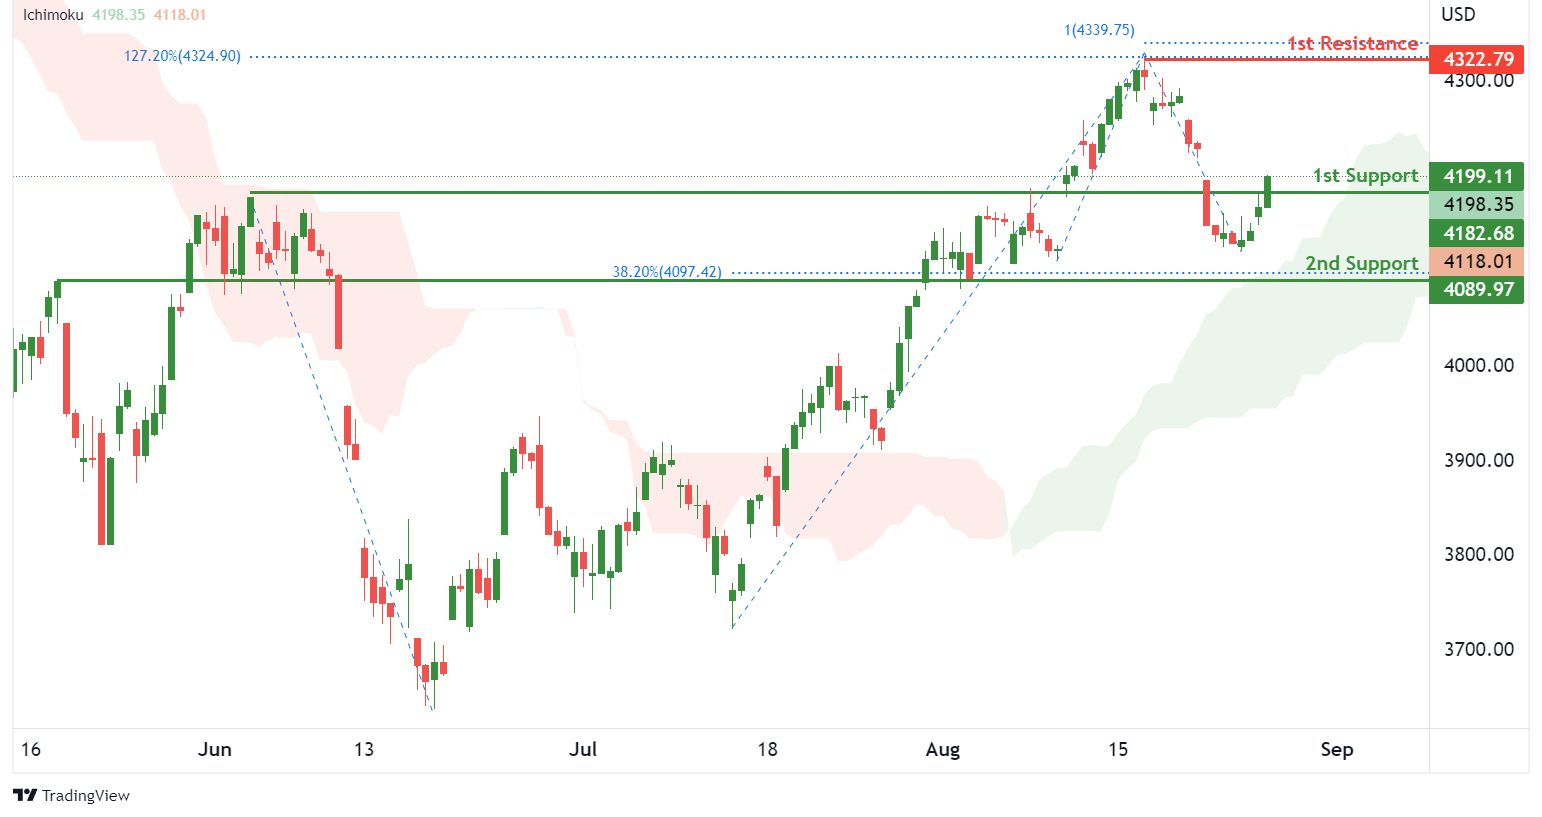
On the H4, with prices moving above the ichimoku indicator, we have a bullish bias that the price will rise from 1st support at 4182.68 where the pullback support is to the 1st resistance at 4322.79 where the swing high resistance, 100% fibonacci projection and 127.2% fibonacci extension are. Alternatively, price could break 1st support structure and drop to 2nd support at 4089.97 where the pullback support and 38.2% fibonacci retracement are.
Areas of consideration:
- H4 time frame, 1st resistance of 4322.79
- H4 time frame, 1st support at 4182.68
USD/JPY Could Rally To New Multi-Year High: Here’s Why
Key Highlights
- USD/JPY started another increase above the 136.00 resistance zone.
- It broke a major bearish trend line at 134.40 on the 4-hours chart.
- EUR/USD and GBP/USD are struggling to start a recovery wave.
- The US GDP contracted 0.6% in Q2 2022 (Preliminary).
USD/JPY Technical Analysis
The US Dollar started a steady increase from the 132.00 zone against the Japanese Yen. USD/JPY broke many hurdles near 133.50 and 134.00 to move into a positive zone.
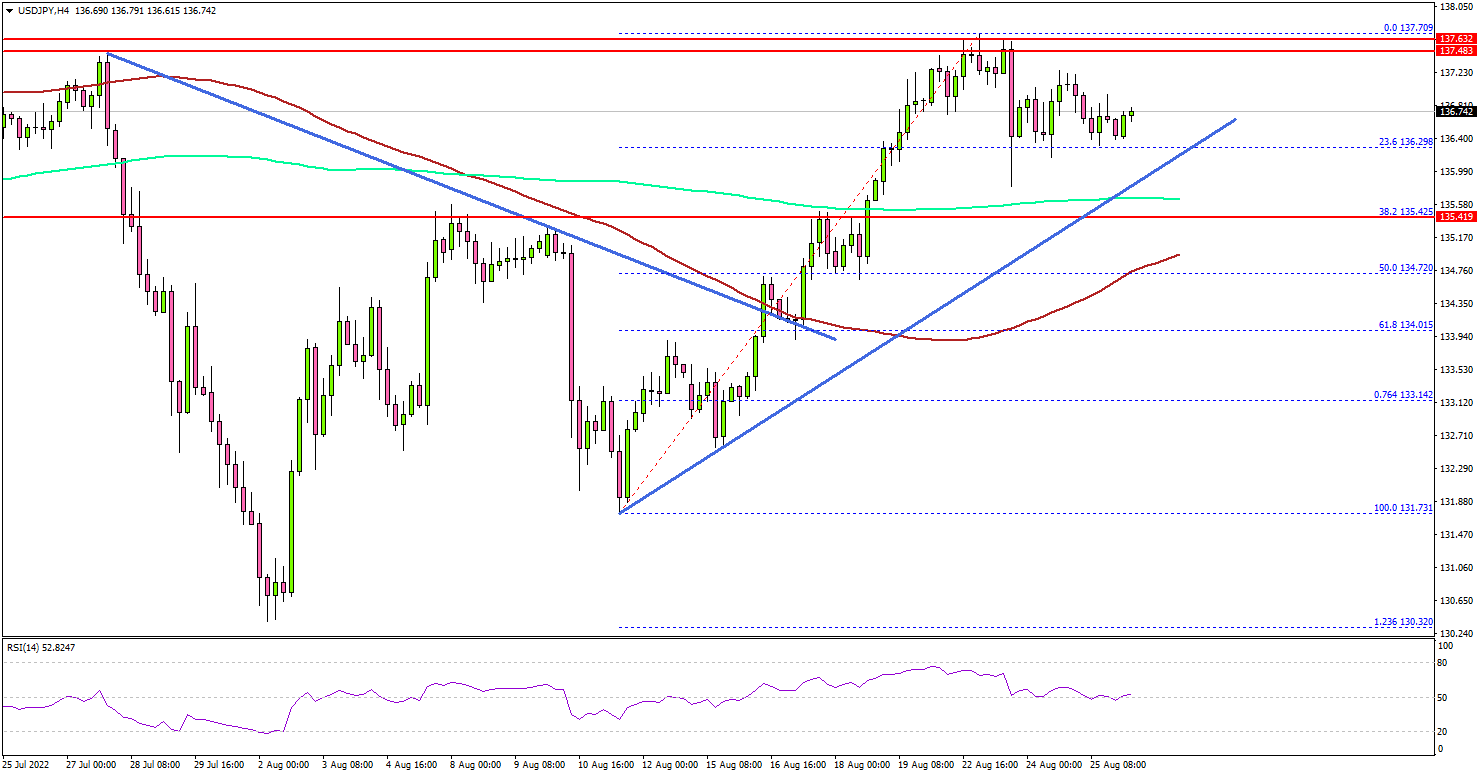
Looking at the 4-hours chart, the pair settled above the 135.00 zone, the 100 simple moving average (red, 4-hours), and the 200 simple moving average (green, 4-hours). The pair even broke a major bearish trend line at 134.40.
It opened the doors for a decent increase above the 136.00 and 136.50 levels. The pair traded close to the 138.00 resistance and formed a high near 137.70.
Recently, there was a downside correction below the 137.20 level. The pair even dipped below 136.00, but downsides were limited. The pair stayed well above the 135.50 support and the 200 simple moving average (green, 4-hours).
If there is a downside break below the 135.50 support, the pair could decline towards the 134.80 support and the 100 simple moving average (red, 4-hours).
Conversely, the pair might rise again above 137.40. On the upside, the pair is facing resistance near the 138.00 level. The next major resistance is near the 139.40 level. A clear move above the 139.40 resistance might send the pair higher towards the 140.00 level and to a new multi-year high.
Fundamentally, the US Gross Domestic Product report for Q2 2022 (prelim) was released yesterday by the US Bureau of Economic Analysis. The market was looking for a drop of 0.8% in the GDP.
The actual result was better than the forecast, as the US GDP contracted 0.6% in Q2 2022, up from the last reading of -0.9%.
Looking at EUR/USD, the pair is consolidating near the parity level and might extend losses. Similarly, GBP/USD remains at a risk of more downsides.
Economic Releases
- US Personal Income for July 2022 (MoM) - Forecast +0.6%, versus +0.6% previous.
- Jackson Hole Symposium.
- Federal Reserve Chair Jerome Powell testifies before Congress.
Elliott Wave View: NZDUSD Rally Likely Fail in 3, 7, 11 Swing
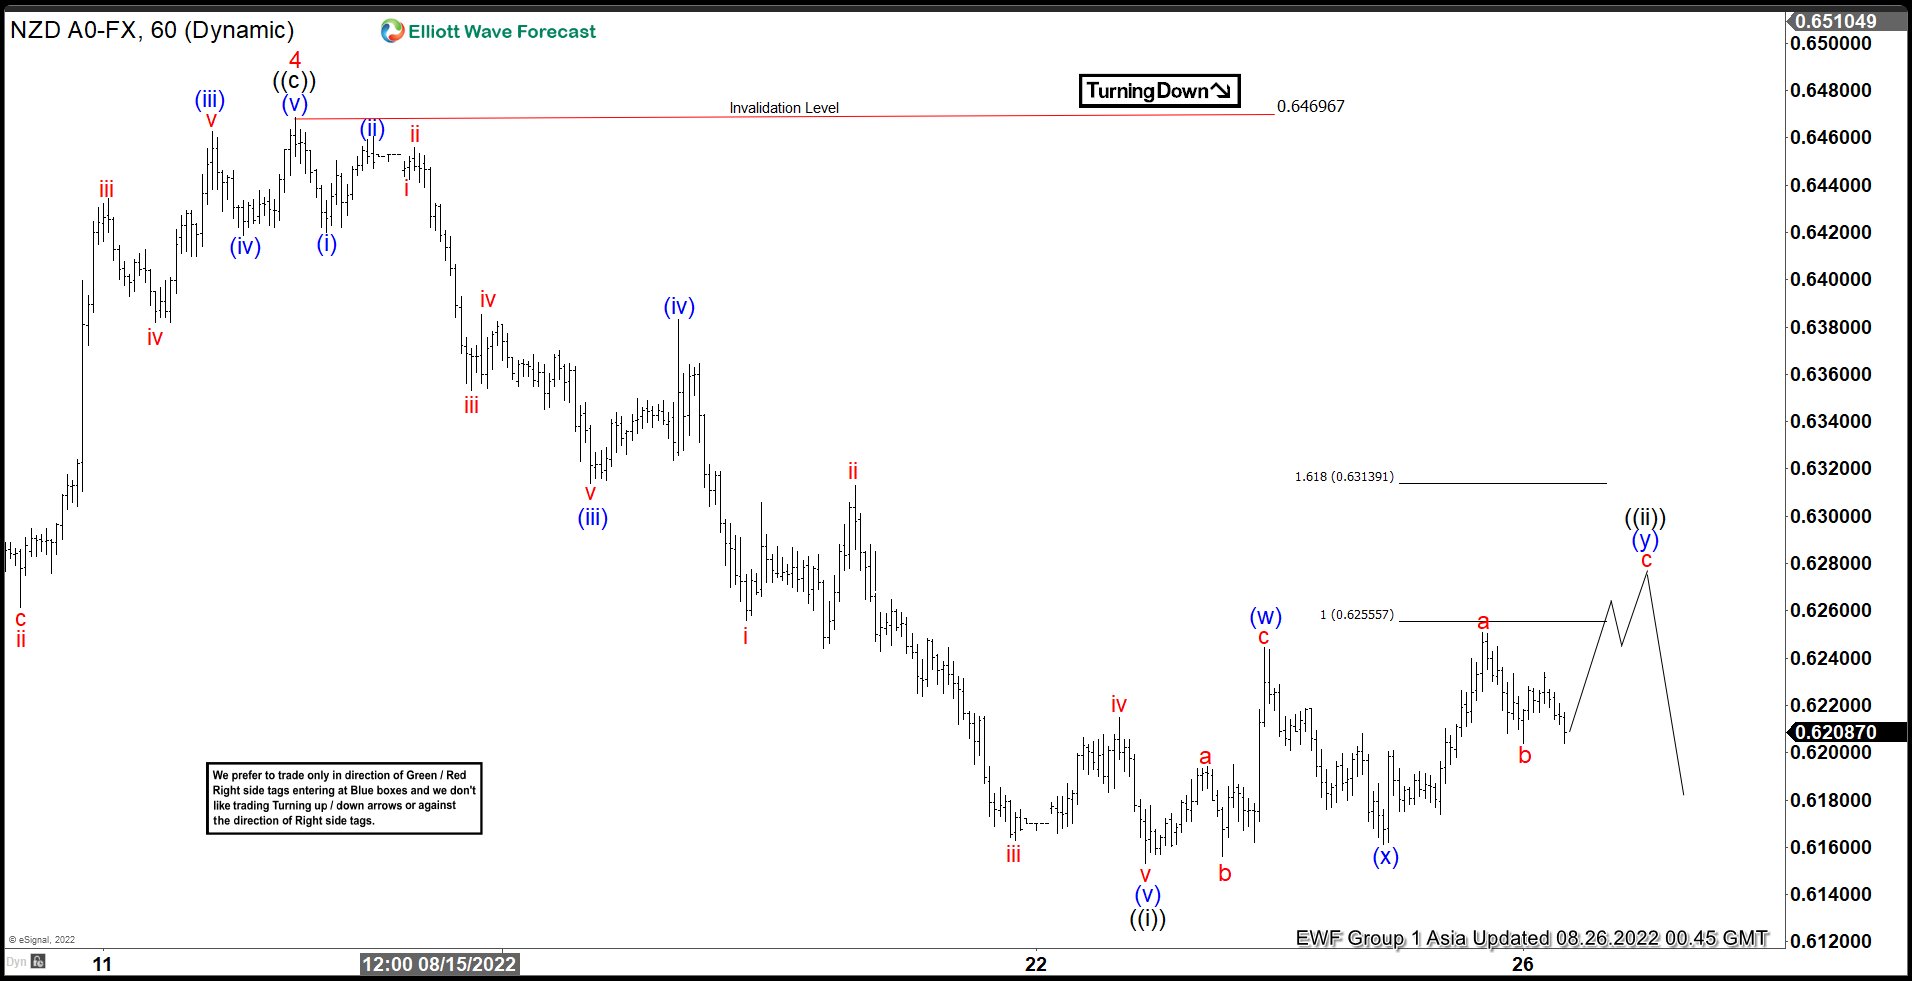
Short Term Elliott Wave View in NZDUSD suggests rally to 0.6469 ended wave 4. Wave 5 lower is in progress to complete a cycle from February 25, 2021 high before a larger 3 waves rally at least. Internal subdivision of wave 5 is unfolding as an impulse Elliott Wave structure. Down from wave 4, wave (i) ended at 0.6420 and rally in wave (ii) ended at 0.6460. The pair then extended lower in wave (iii) towards 0.6314, rally in wave (iv) ended at 0.6383. Final leg lower wave (v) ended at 0.6153 which ended wave ((i)) of 5.
Wave ((ii)) correction is in progress to correct cycle from August 12, 2022 high in 3, 7, or 11 swing before the next leg lower. Up from wave ((i)), wave (w) ended at 0.6244 in 3 swings and pullback in wave (x) ended at 0.6161. Expect NDUSD to extend higher in wave (y) which should end wave ((ii)). Then expect pullback in wave ((ii)) to hold below 0.6469 for further downside to break 0.6153 low within wave ((iii)). As far as pivot at 0.6469 high stays intact, expect rally to fail in 3, 7, or 11 swing for further downside.
NZDUSD 60 Minutes Elliott Wave Chart
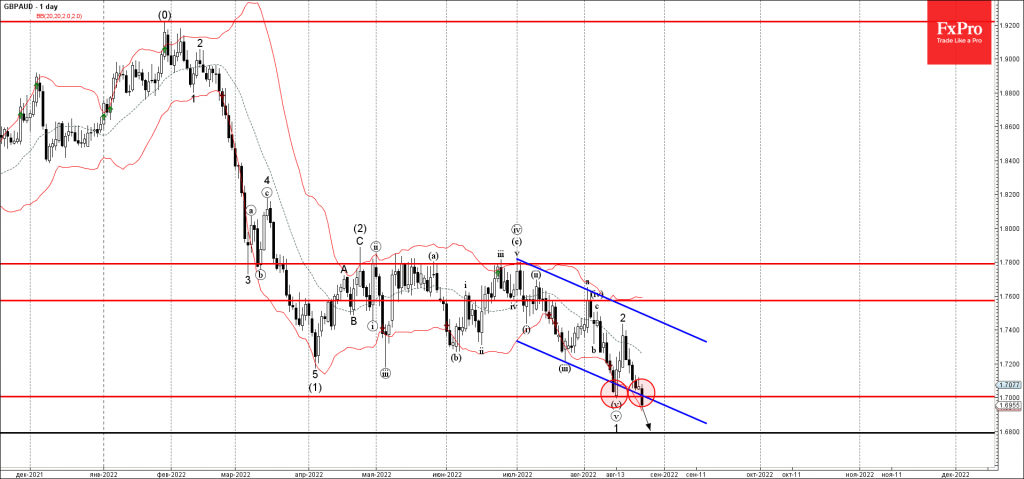
GBPAUD Wave Analysis
- GBPAUD broke support level 1.7000
- Likely to fall to support level 1.6800
GBPAUD currency pair recently broke the support level 1.7000 (which stopped the previous minor impulse wave 1 from the start of August).
The breakout of the support level 1.7000 coincided with the breakout of the daily down channel from the start of July – which accelerated the active impulse wave 3.
Given the clear daily downtrend, GBPAUD currency can be expected to fall further toward the next support level 1.6800.
Eco Data 8/26/22
[php_everywhere instance="1"]