Sample Category Title
EUR/JPY Daily Outlook
Daily Pivots: (S1) 135.76; (P) 136.38; (R1) 136.73; More....
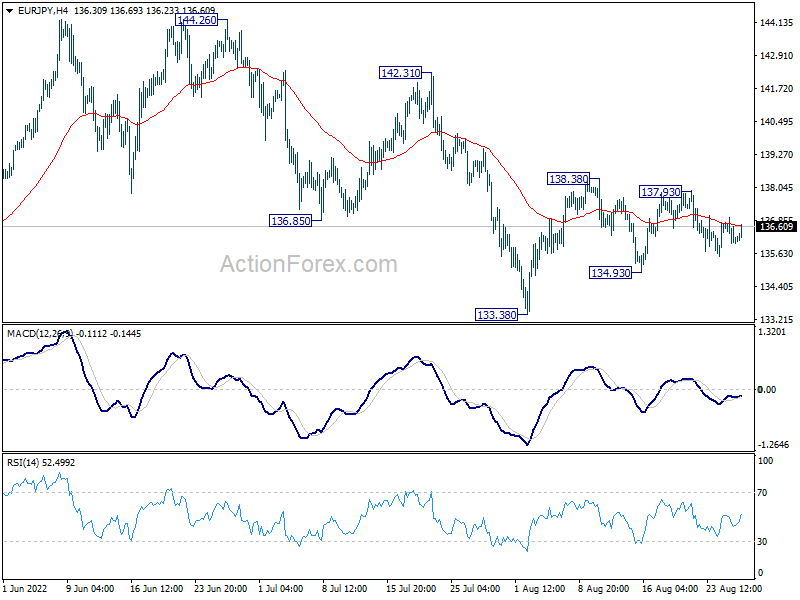
Intraday bias in EUR/JPY stays neutral as range trading continues. On the upside, break of 138.38 resistance will resume the rebound from 133.38 towards 142.31 resistance. On the downside, break of 134.93 will turn bias back to the downside for 133.38 support. Overall, corrective pattern from 144.26 could extend further with more choppy trading.
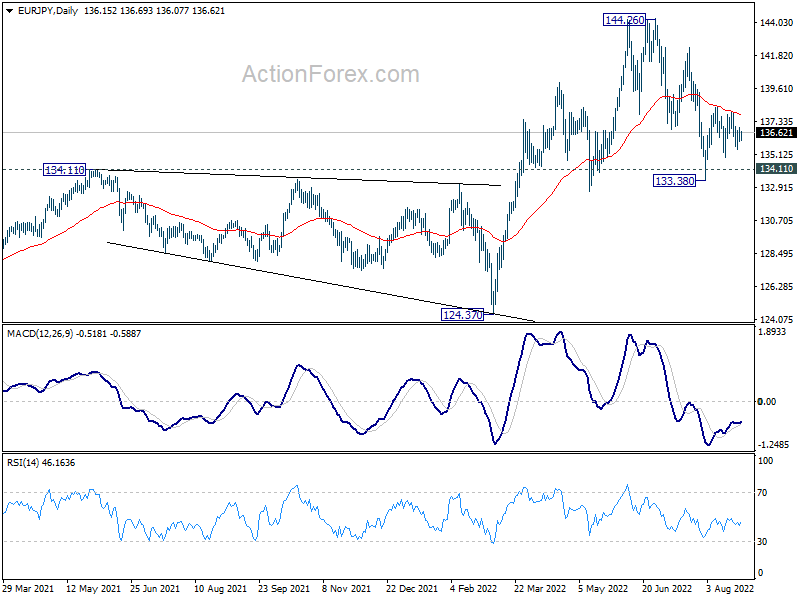
In the bigger picture, up trend from 114.42 (2020 low) is seen as the third leg of the pattern from 109.30 (2016 low). Further rally is in favor as long as 134.11 resistance turned support holds, even in case of deep pull back. Next target is 149.76 (2015 high). However, sustained break of 134.11 will be a sign of medium term bearish reversal and turn focus to 124.37 support for confirmation.
EUR/GBP Daily Outlook
Daily Pivots: (S1) 0.8414; (P) 0.8437; (R1) 0.8451; More...
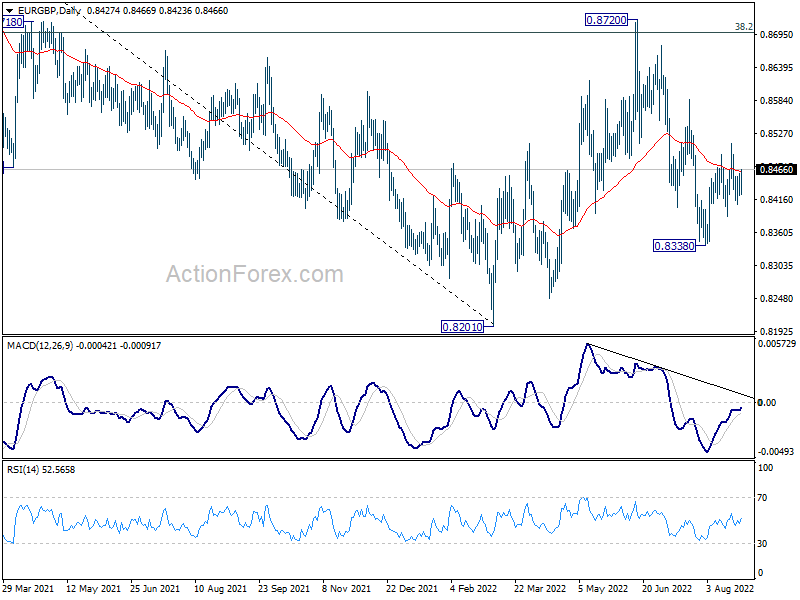
Intraday bias in EUR/GBP stays neutral as range trading continues. On the downside, break of 0.8386 minor support will resume the choppy fall from 0.8720 through 0.8338. On the upside, above 0.8510 will resume the rebound to 0.8585 resistance next.
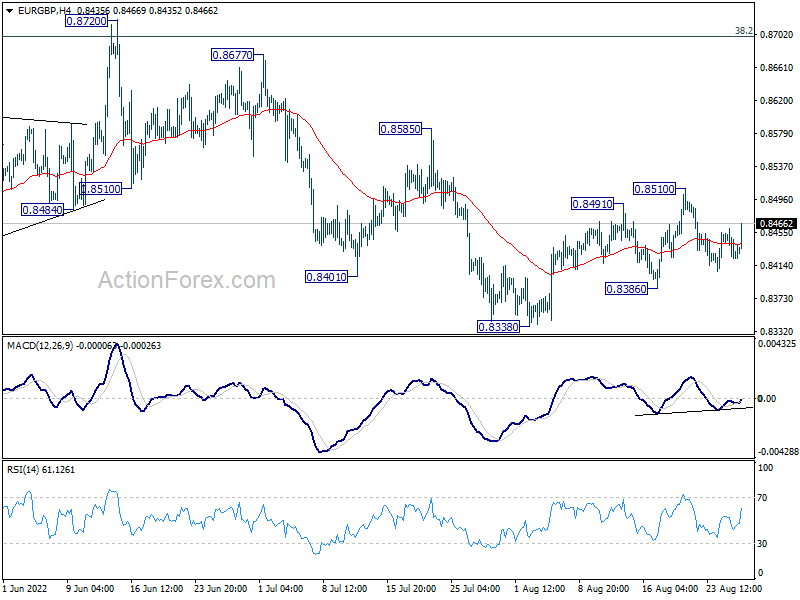
In the bigger picture, medium term bearishness is maintained with prior rejection by 38.2% retracement of 0.9499 to 0.8201 at 0.8697. Break of 0.8201 will resume larger down trend from 0.9499 (2020 high). Nevertheless, sustained break of 0.8697 will affirm the case that rise from 0.8201 is a medium term up trend itself.
EUR/AUD Daily Outlook
Daily Pivots: (S1) 1.4237; (P) 1.4337; (R1) 1.4390; More...
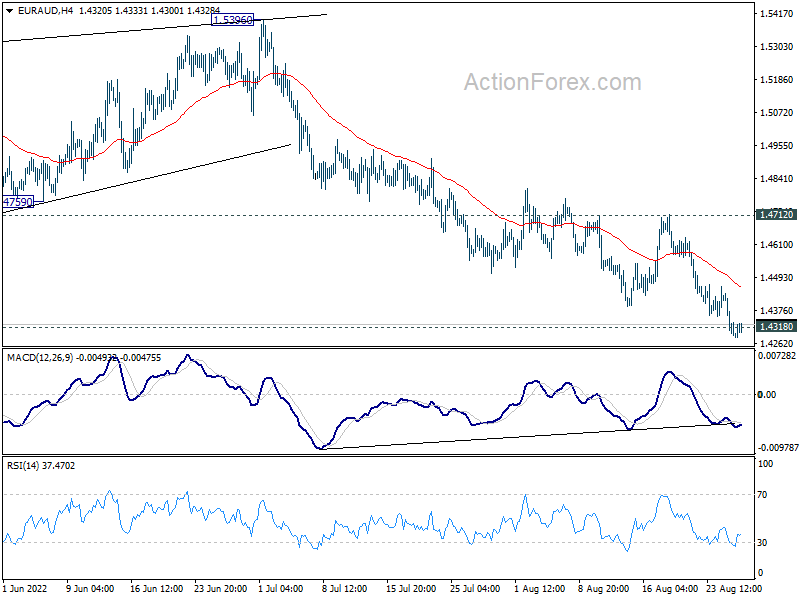
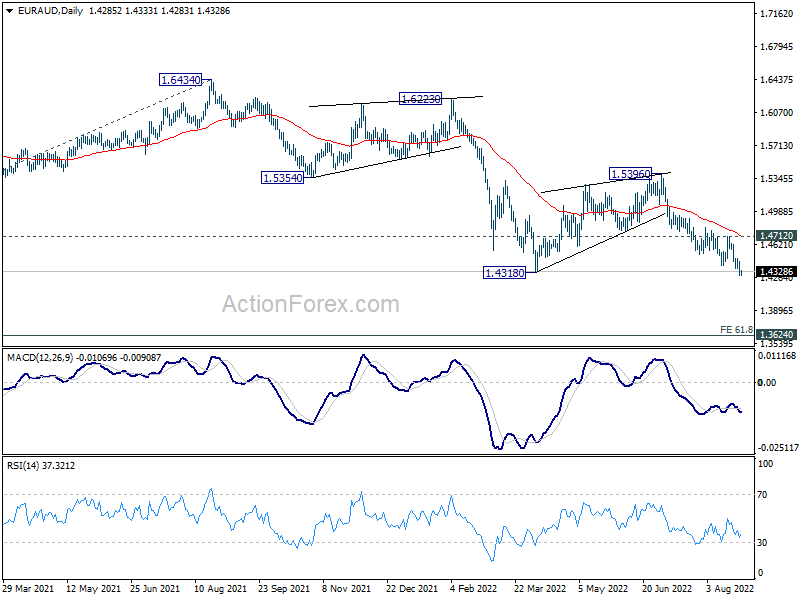
Intraday bias in EUR/AUD stays on the downside for the moment. Sustained trading below 1.4318 support will confirm resumption of larger down trend. Next target is medium term projection level at 1.3623. On the upside, break of 1.4712 resistance will delay the bearish case and turn bias to the upside for stronger rebound first.
In the bigger picture, down trend from 1.9799 is still in progress. Break of 1.4318 low will target 61.8% projection of 1.9799 to 1.5250 from 1.6434 at 1.3623, which is close to 1.3624 long term support (2017 low). This will remain the favored case now as long as 1.5396 resistance holds.
EUR/CHF Daily Outlook
Daily Pivots: (S1) 0.9588; (P) 0.9622; (R1) 0.9643; More....
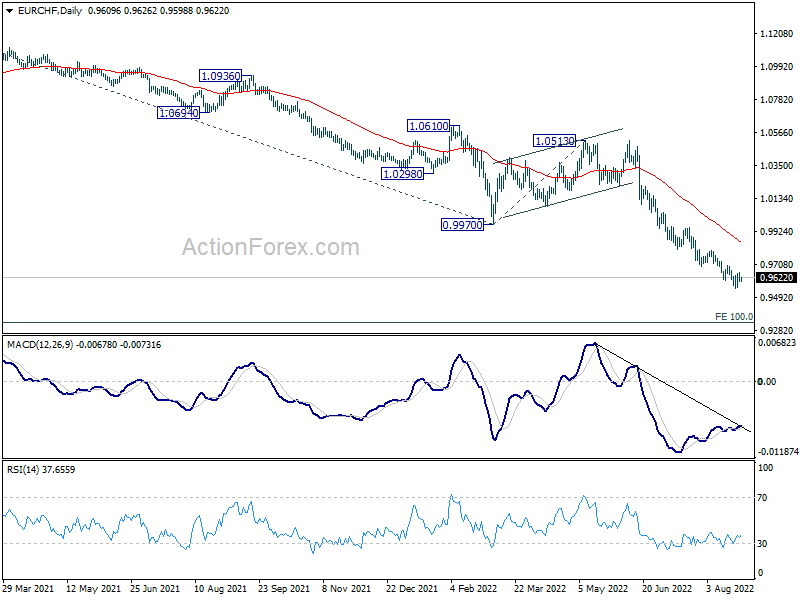
No change in EUR/CHF's outlook that further decline is still expected with 0.9698 resistance intact. Current down trend should now target 100% projection of 1.1149 to 0.9970 from 1.0513 at 0.9334. On the upside, break of 0.9698 resistance will indicate short term bottoming, and turn bias back to the upside for stronger rebound.
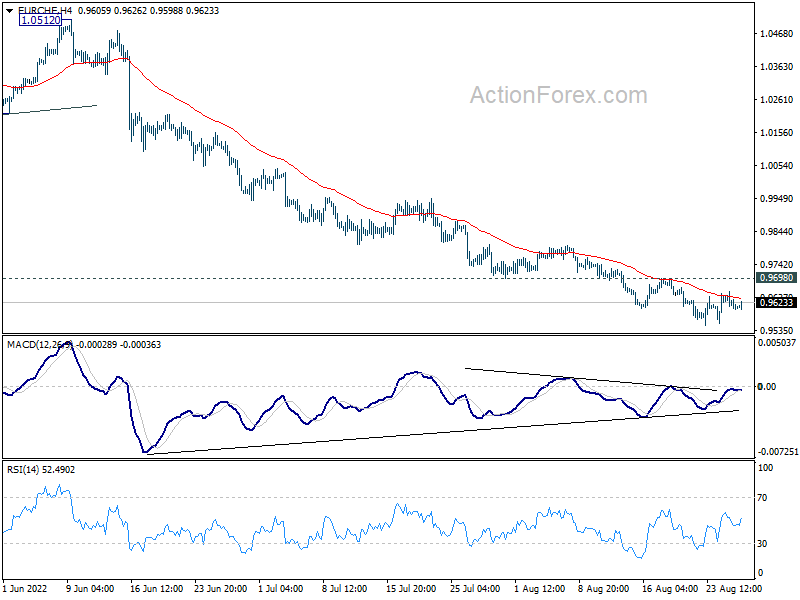
In the bigger picture, long term down trend from 1.2004 (2018 high) is still in progress. Next target is 138.2% projection of 1.2004 to 1.0505 to 1.1149 at 0.9033. On the upside, break of 0.9970 support turned resistance is needed to be the first sign of medium term bottoming. Otherwise, outlook will stay bearish in case of strong rebound.
GBPJPY Trades Lower Within Descending Triangle
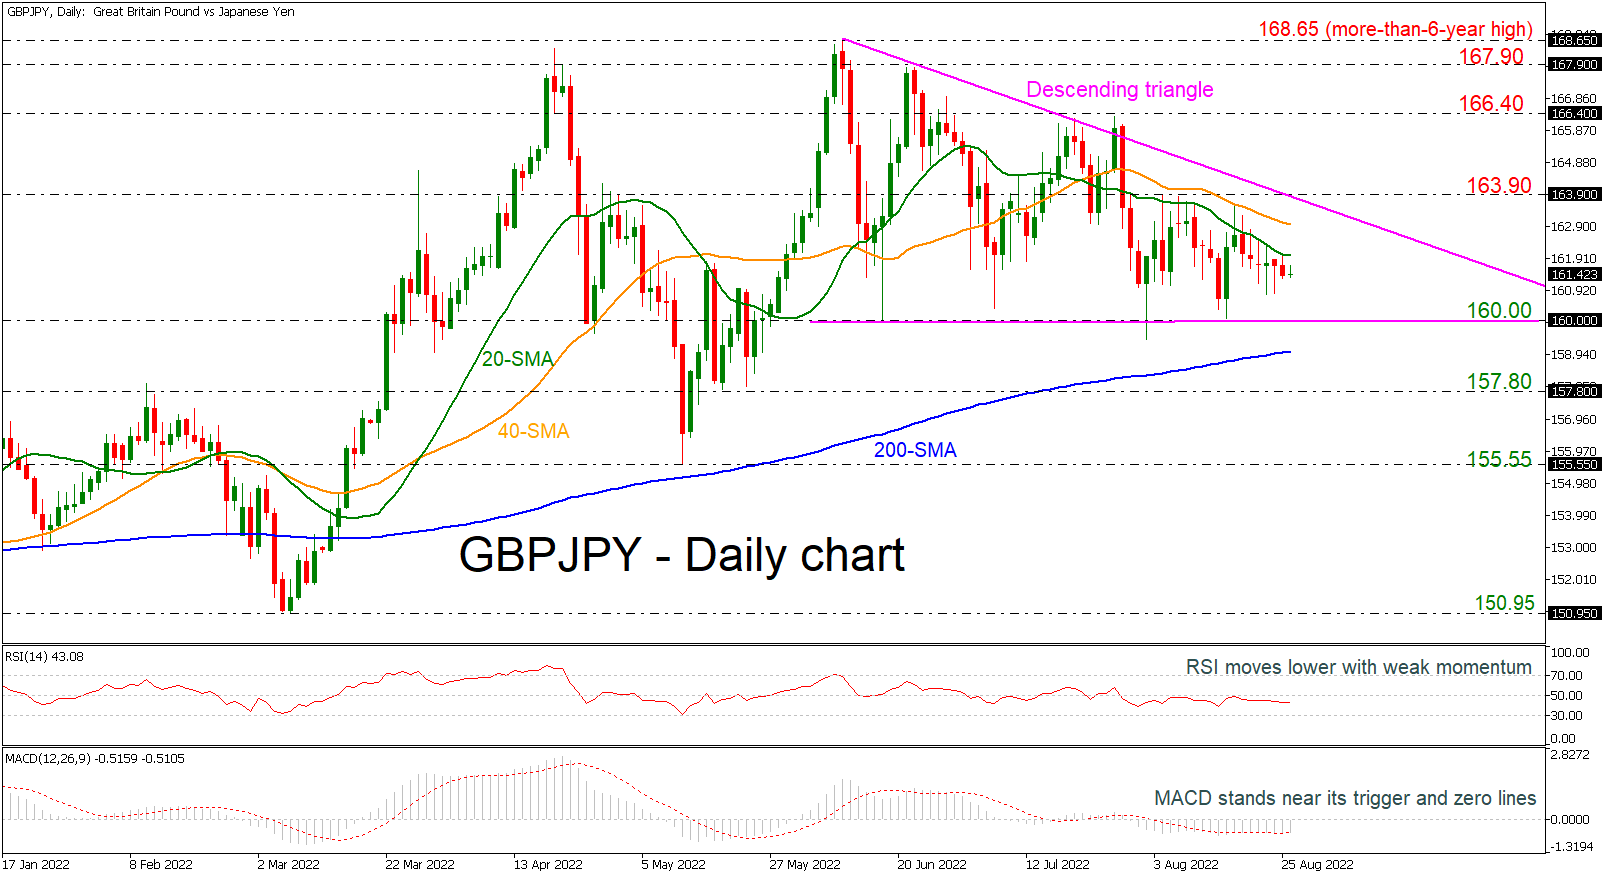
GBPJPY is heading south, and it has been holding within a descending triangle pattern since June 9. Currently, the price is moving beneath the short-term simple moving averages (SMAs) and is approaching the 160.00 psychological mark, which is the lower boundary of the triangle. The RSI indicator is standing below the neutral threshold of 50, moving with weak momentum while the MACD is hovering slightly up its trigger line in the negative region.
Violating the flat line of the pattern at 160.00, could see losses extending towards the 200-day SMA currently at 159.05. Even lower, the bears could stall around 157.80 and the 155.55 support.
If the market corrects higher, the bullish action may pause initially near the 20- and 40-day SMAs at 162.05 and 162.95 respectively before attention shifts to the downtrend line and the 163.90 resistance. A rally on top of the latter would probably stage fresh buying pressure, with the price meeting next to 166.40 barrier.
In the medium-term picture, GBPJPY would endorse the negative scenario if there is a penetration of the descending triangle to the downside.
USDCAD Stuck Below 1.3026 for Another Week
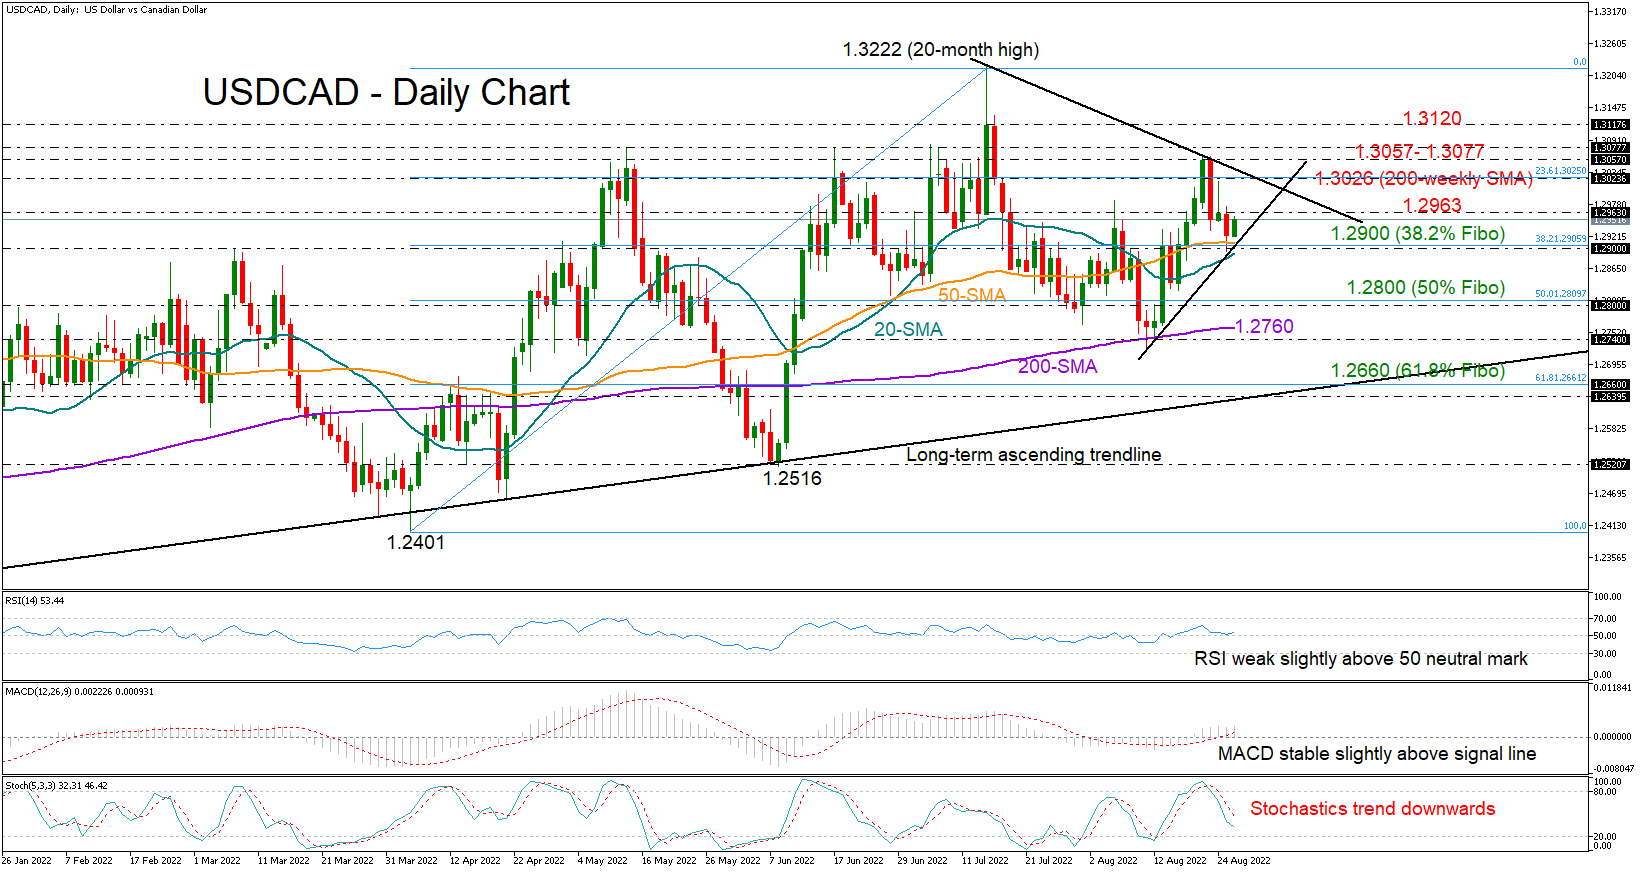
USDCAD could not find enough buyers to sustain Monday’s bullish extension above the flattening 200-weekly simple moving average (SMA) at 1.3026, with the price gearing down to meet support near its 20- and 50-day SMAs at 1.2894 on Thursday. Recall that the pair has been constantly fighting the 200-weekly SMA since May without success despite some strong flash upside spikes.
The pair is currently trying to recoup some ground ahead of Powell’s Jackson Hole speech, but the momentum indicators are sending only poor signals. Particularly, the RSI remains dim slightly above its 50 neutral mark, the MACD maintains a sideways trajectory above its red signal line, while the stochastics are sloping downwards.
If the bears squeeze the price below the 20-day SMA and the 1.2900 level, where the 38.2% Fibonacci retracement of the 1.2401 – 1.3222 upleg is positioned, traders will look next at the 50% Fibonacci of 1.2800. The 200-day SMA at 1.2764 might be the last opportunity for a rebound before the long-term support trendline drawn from the 20221 low of 1.2006 comes on the radar at 1.2660. Note that the 61.8% Fibonacci is also in the neighborhood. Hence, any violation at this point could generate more aggressive downfalls.
Alternatively, if the pair manages to close above the nearby resistance of 1.2963, the bulls may exchange swords again with the 200-weekly SMA and the 1.3026 barricade. The way higher may not be easy either as a sustainable move above the wall of 1.3057 – 1.3077 is required to drive the pair up to the critical bar of 1.3120. Should those boundaries prove fragile this time, the pair may have a direct flight to July’s top of 1.3222.
Summarizing, there is still a lack of buying confidence in USDCAD below 1.3026 for the third consecutive month. Unless the pair rallies sustainably above that threshold, downside pressures may persist.
Daily Technical Analysis
EUR/USD
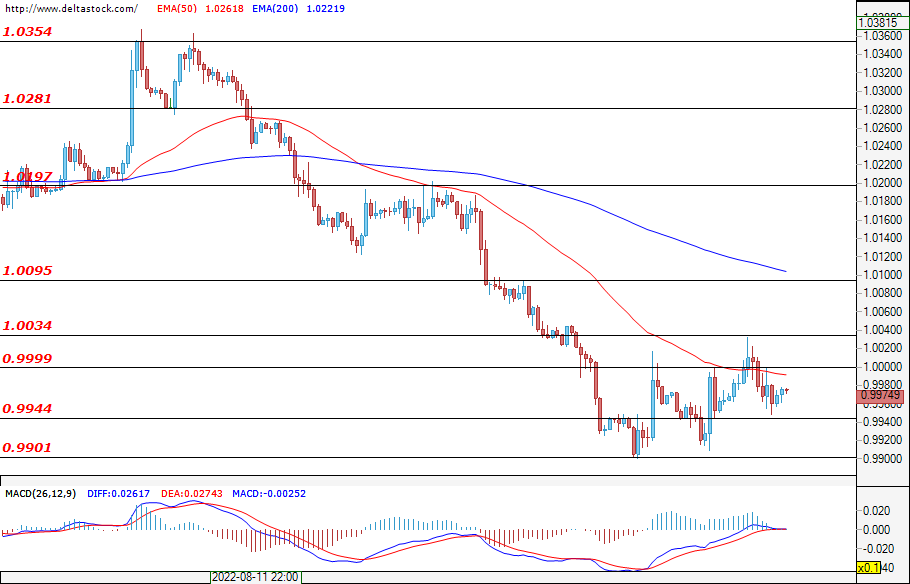
On Thursday, the single European currency started the early hours of the day with an uptrend. After the opening of the session in Europe, the key level of 1.0000 was breached and the movements continued towards the formed resistance at 1.0034. There, the bears took control and wiped out the day's hard-earned pips. Support was found again at 0.9944 and the day ended at around 0.9974. Today's moves in the currency pair are expected to be dictated by the dollar’s strength, as at 12:30 GMT we'll see the data on the U.S. personal consumer goods prices, as well as Jerome Powell's speech on stage at the Jackson Hall Symposium at 14:00 GMT. Whether the euro will be able to break free from its range-bound trading remains to be seen after the release of all mentioned data.
USD/JPY
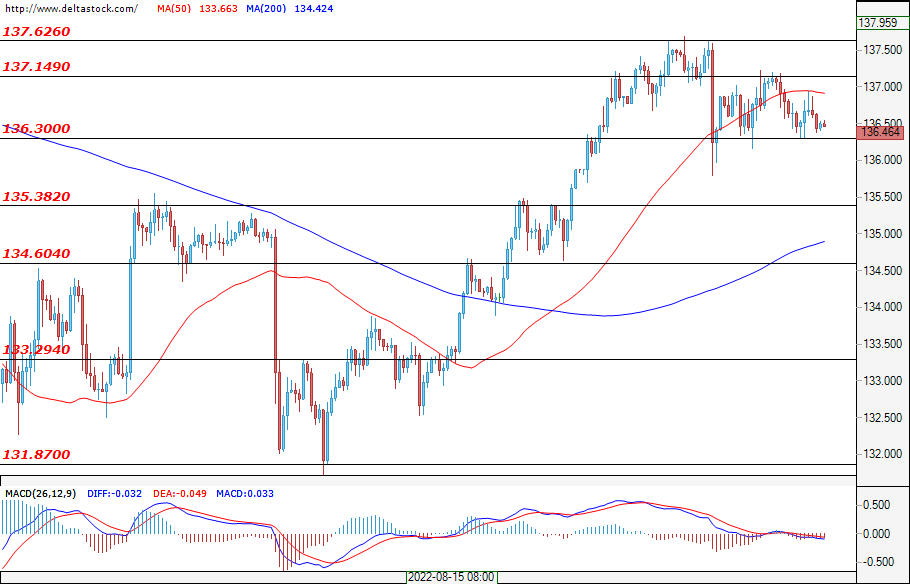
The Ninja is locked in a range once again, this time between 136.30 and 137.15. Yesterday’s session started with a slow decline, reaching the mentioned bottom of the range, then managed to find slight support, and by the end of the day, prices stayed almost the same as they were at the beginning of the previous day, namely the level of 136.50. The consolidation here is clearly continuing and today’s movements will be dictated by the strength of the dollar. The series of already mentioned data is expected to define the direction of the USD/JPY as well. The expectations are for the dollar to continue to grow stronger, but this can only happen after a confirmed breach of the upper border of this week's range.
GBP/USD
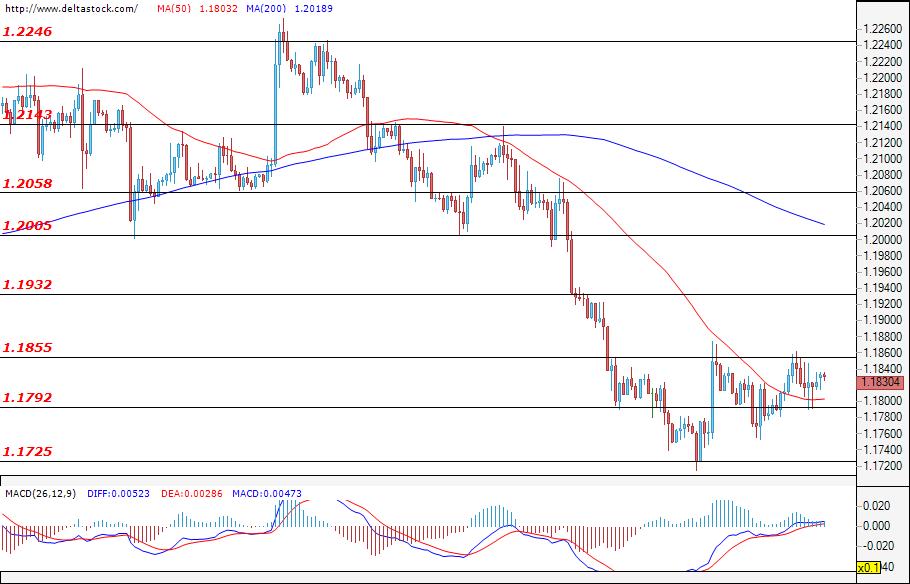
The movements in the Cable on Wednesday were almost identical to those of the euro dollar. The day started with a slight uptick, and after the London open, we saw a breakout at a key level, which once more headed the pair towards the resistance at 1.1855. There, the bears took control and wiped out all accumulated growth for the day. Support was found at 1.1792 following four hours of unsuccessful attempts for a breach below that level. While there is no expected UK data for today, the dollar will likely weigh on the GBP/USD after today's data is released. Whether the dollar will continue to put more pressure on the pound remains to be seen.
EUGERMANY40
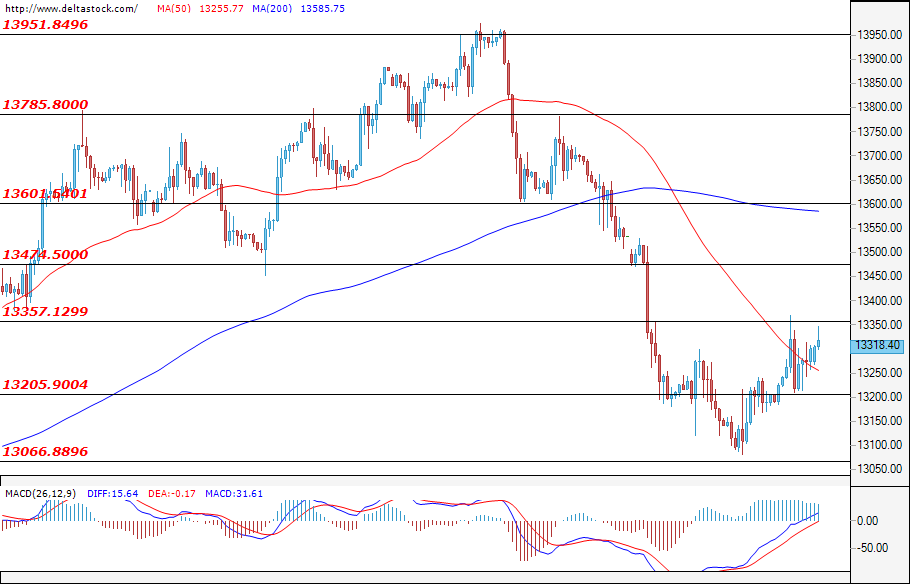
Prices in the German index yesterday continued to rally. In the early hours of today, we saw a breach of a key level that, after the opening of the European session, led the index to the formed resistance at around 13360. Later, however, we received the business climate data for Germany, which despite being positive, made traders unhappy and so an aggressive correction towards 13205 followed. However, the correction was limited to this level. As the day progressed further, we saw more growth anda second failed attempt to reach the top for the day. Whether we will see a confirmed breakout today depends on whether the correlation with the U.S. indices continues. Traders are holding their breath for Jerome Powell's remarks, which are expected to weigh on all indices, if the correlation continues.
US30
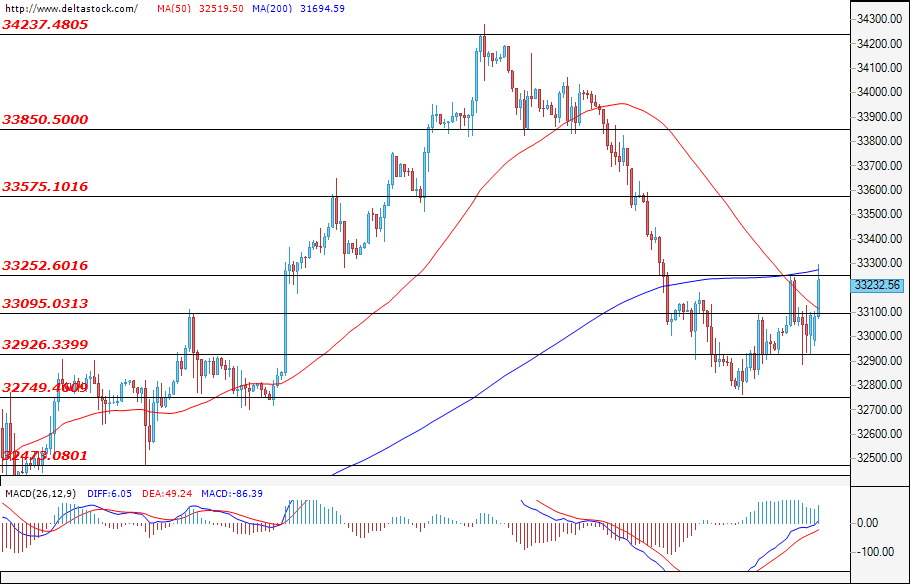
Wednesday was a highly volatile day for the blue-chip index. As the day started, we saw strong upward moves, but after the opening of the European session, the rally stopped at the resistance of 33250. There, the bears found good entry prices, corrected the accumulated growth throughout the day, and pushed the price down towards the support of 32925. The support held its ground once more and the market made a second attempt to breach the mentioned daily support. While successful at first, it was not confirmed until the end of the trading day and so prices ended the day at around 33233. As with the other markets, Jerome Powell's remarks are expected to have a significant impact here as well. Whether the upward moves that started this week will continue remains to be seen later today.
RBNZ Orr: There’ll be least another couple of rate hikes
RBNZ Governor Adrian Orr told Bloomberg TV earlier today, "We know we have to slow the economy. We knew we had to be 3% plus (on interest rates) to begin that slowing journey and now we're in a much more comfortable position."
"We think there'll be least another couple of rate hikes, but then we hope to be in a position where we can be data driven," he added.
As about the risks of recession, Orr said, "Our core view is no, that we won't see technical recession. There's quite a reasonable bounce back in economic activity."
"Our outlook is for almost flat real consumption so for us to see retail sales come off like that, it's not a surprise," Orr said. "It's a good signal that that monetary policy is biting and we're doing our work."
"Consumers will be taking a significant part of the brunt of the slowdown because, we're an open trading economy. Our monetary policy mostly bites on domestic spending." But, while "slower growth is a necessary position. It doesn't have to be negative growth."
GBP/USD: Will the Cycle Wave Z Continue?
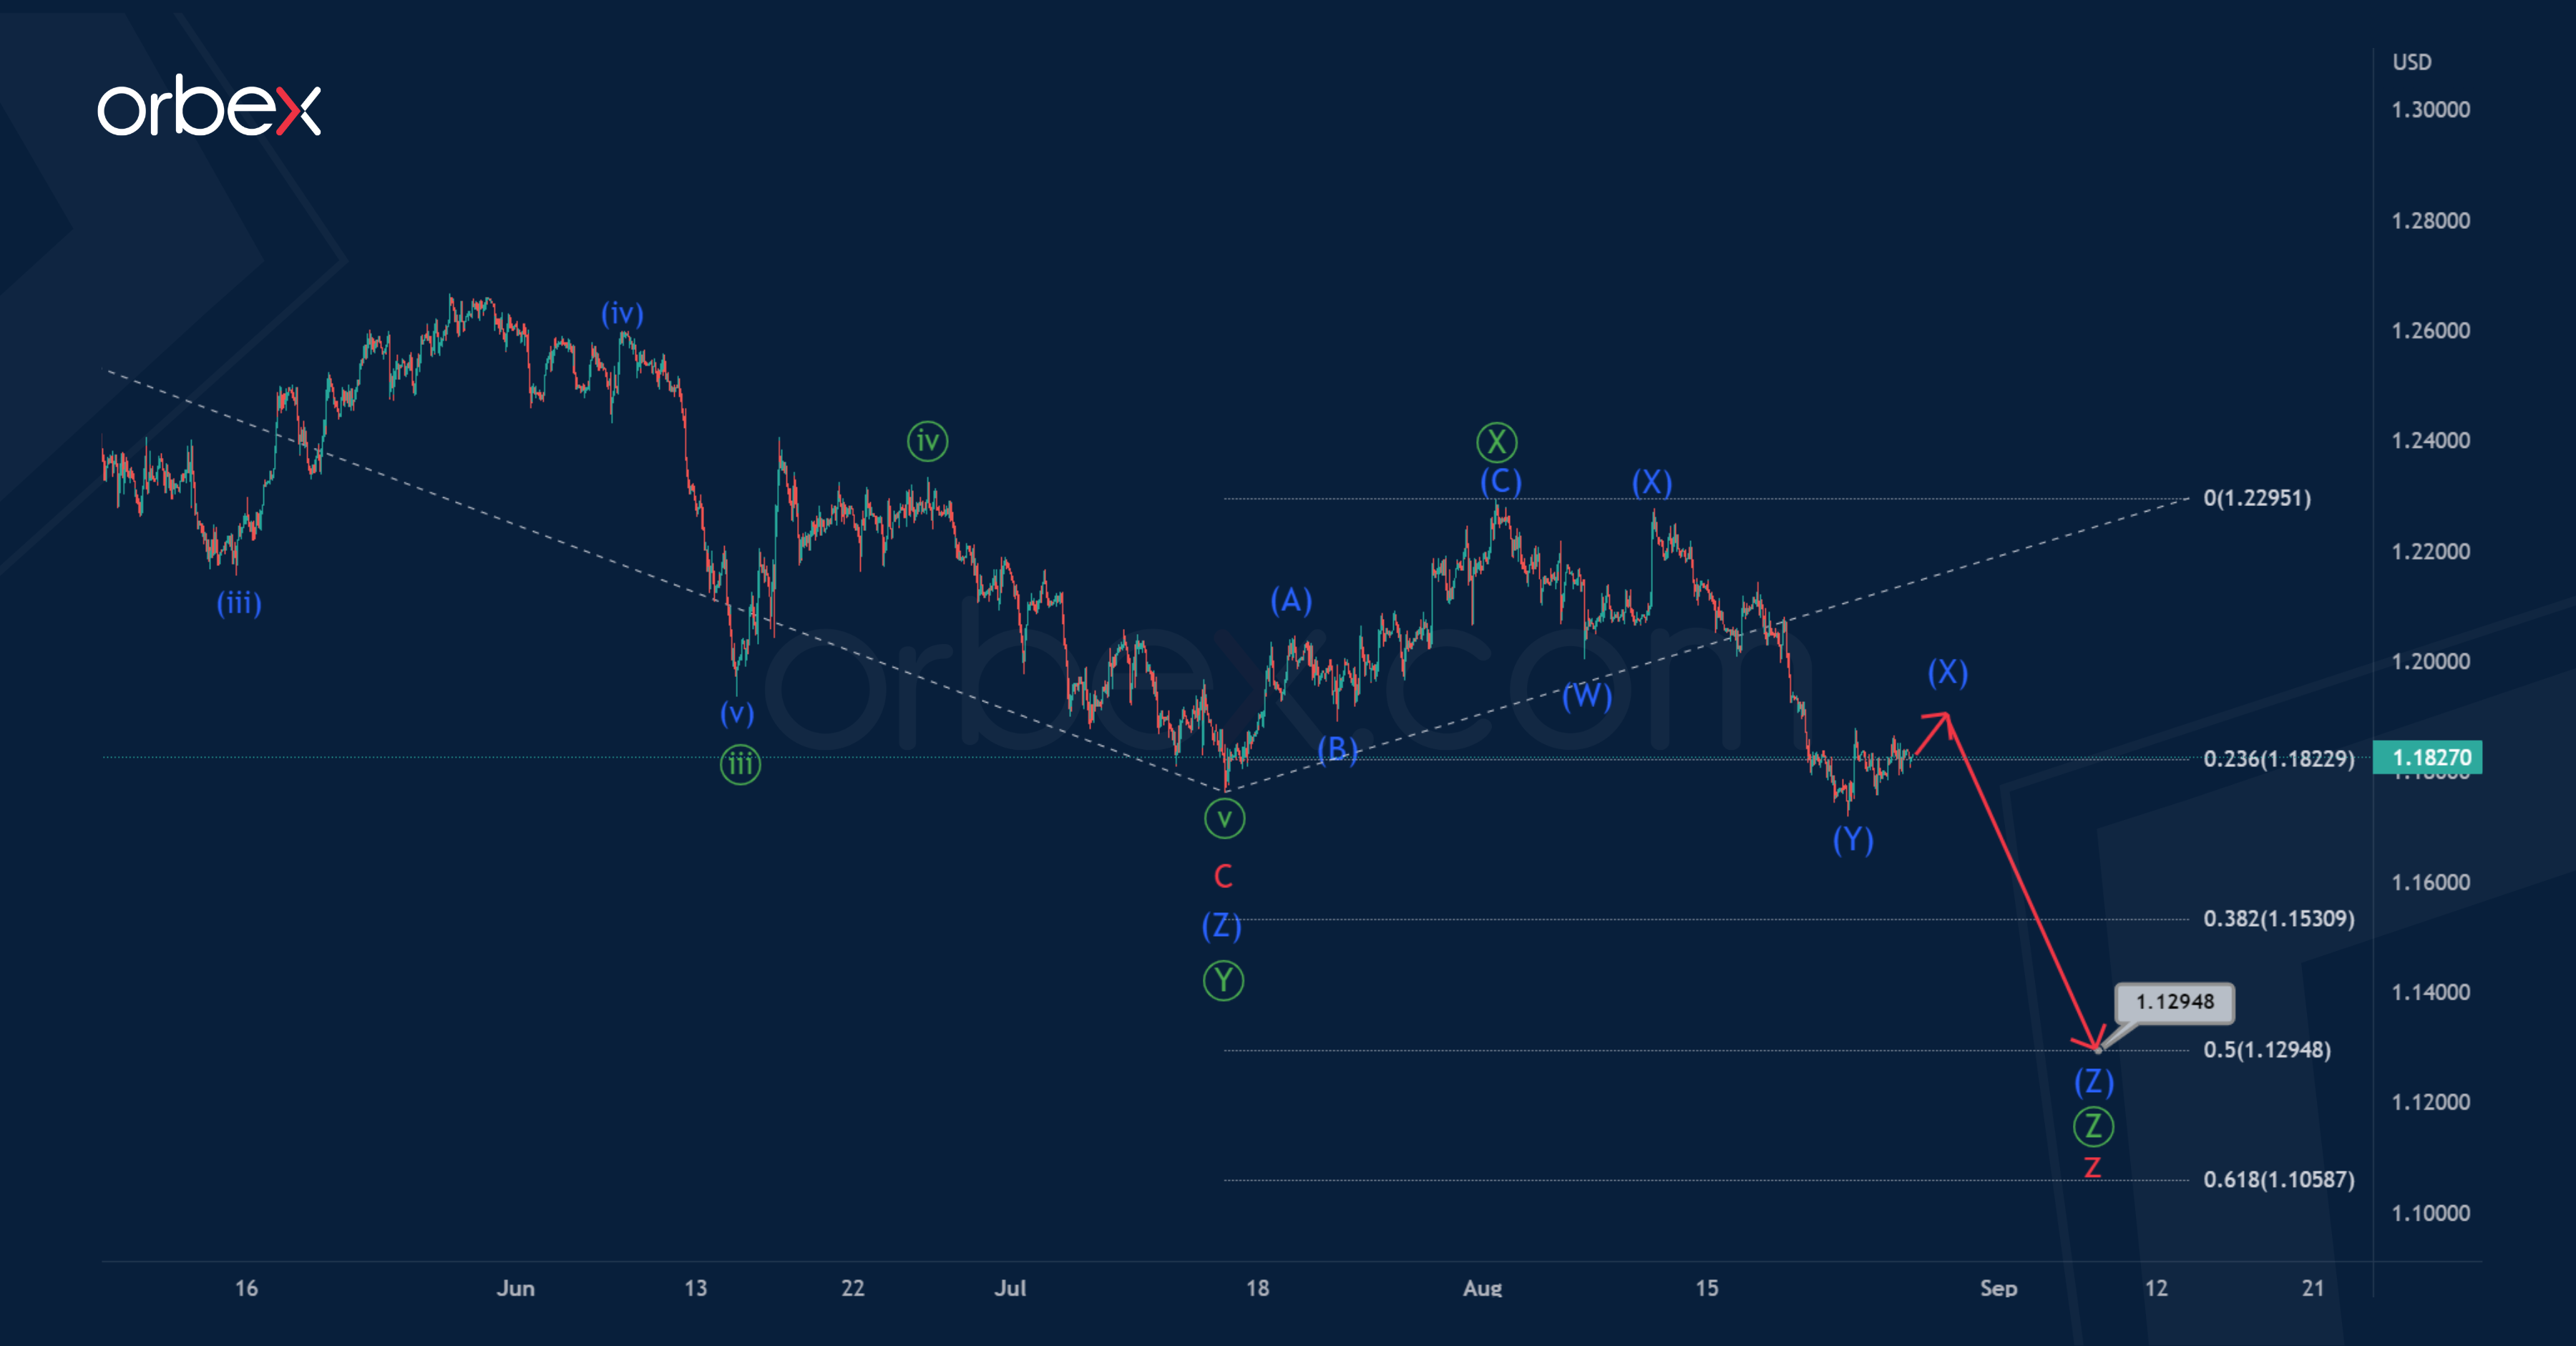
The structure of the GBPUSD currency suggests the formation of a global corrective trend – a triple zigzag w-x-y-x-z. On the 1H timeframe, we see the final actionary wave z of the cycle degree.
The wave z most likely takes the form of a primary triple zigzag Ⓦ-Ⓧ-Ⓨ-Ⓧ-Ⓩ. Perhaps, at the beginning of August, the bullish price movement within the primary intervening wave Ⓧ ended, it took the form of an intermediate zigzag (A)-(B)-(C).
It is likely that in the near future the bearish trend will continue to develop in the primary wave Ⓩ, which may complete its intermediate triple zigzag pattern (W)-(X)-(Y)-(X)-(Z) near 1.129.
At that level, wave Ⓩ will be at the 50% Fibonacci extension of previous actionary wave Ⓨ.
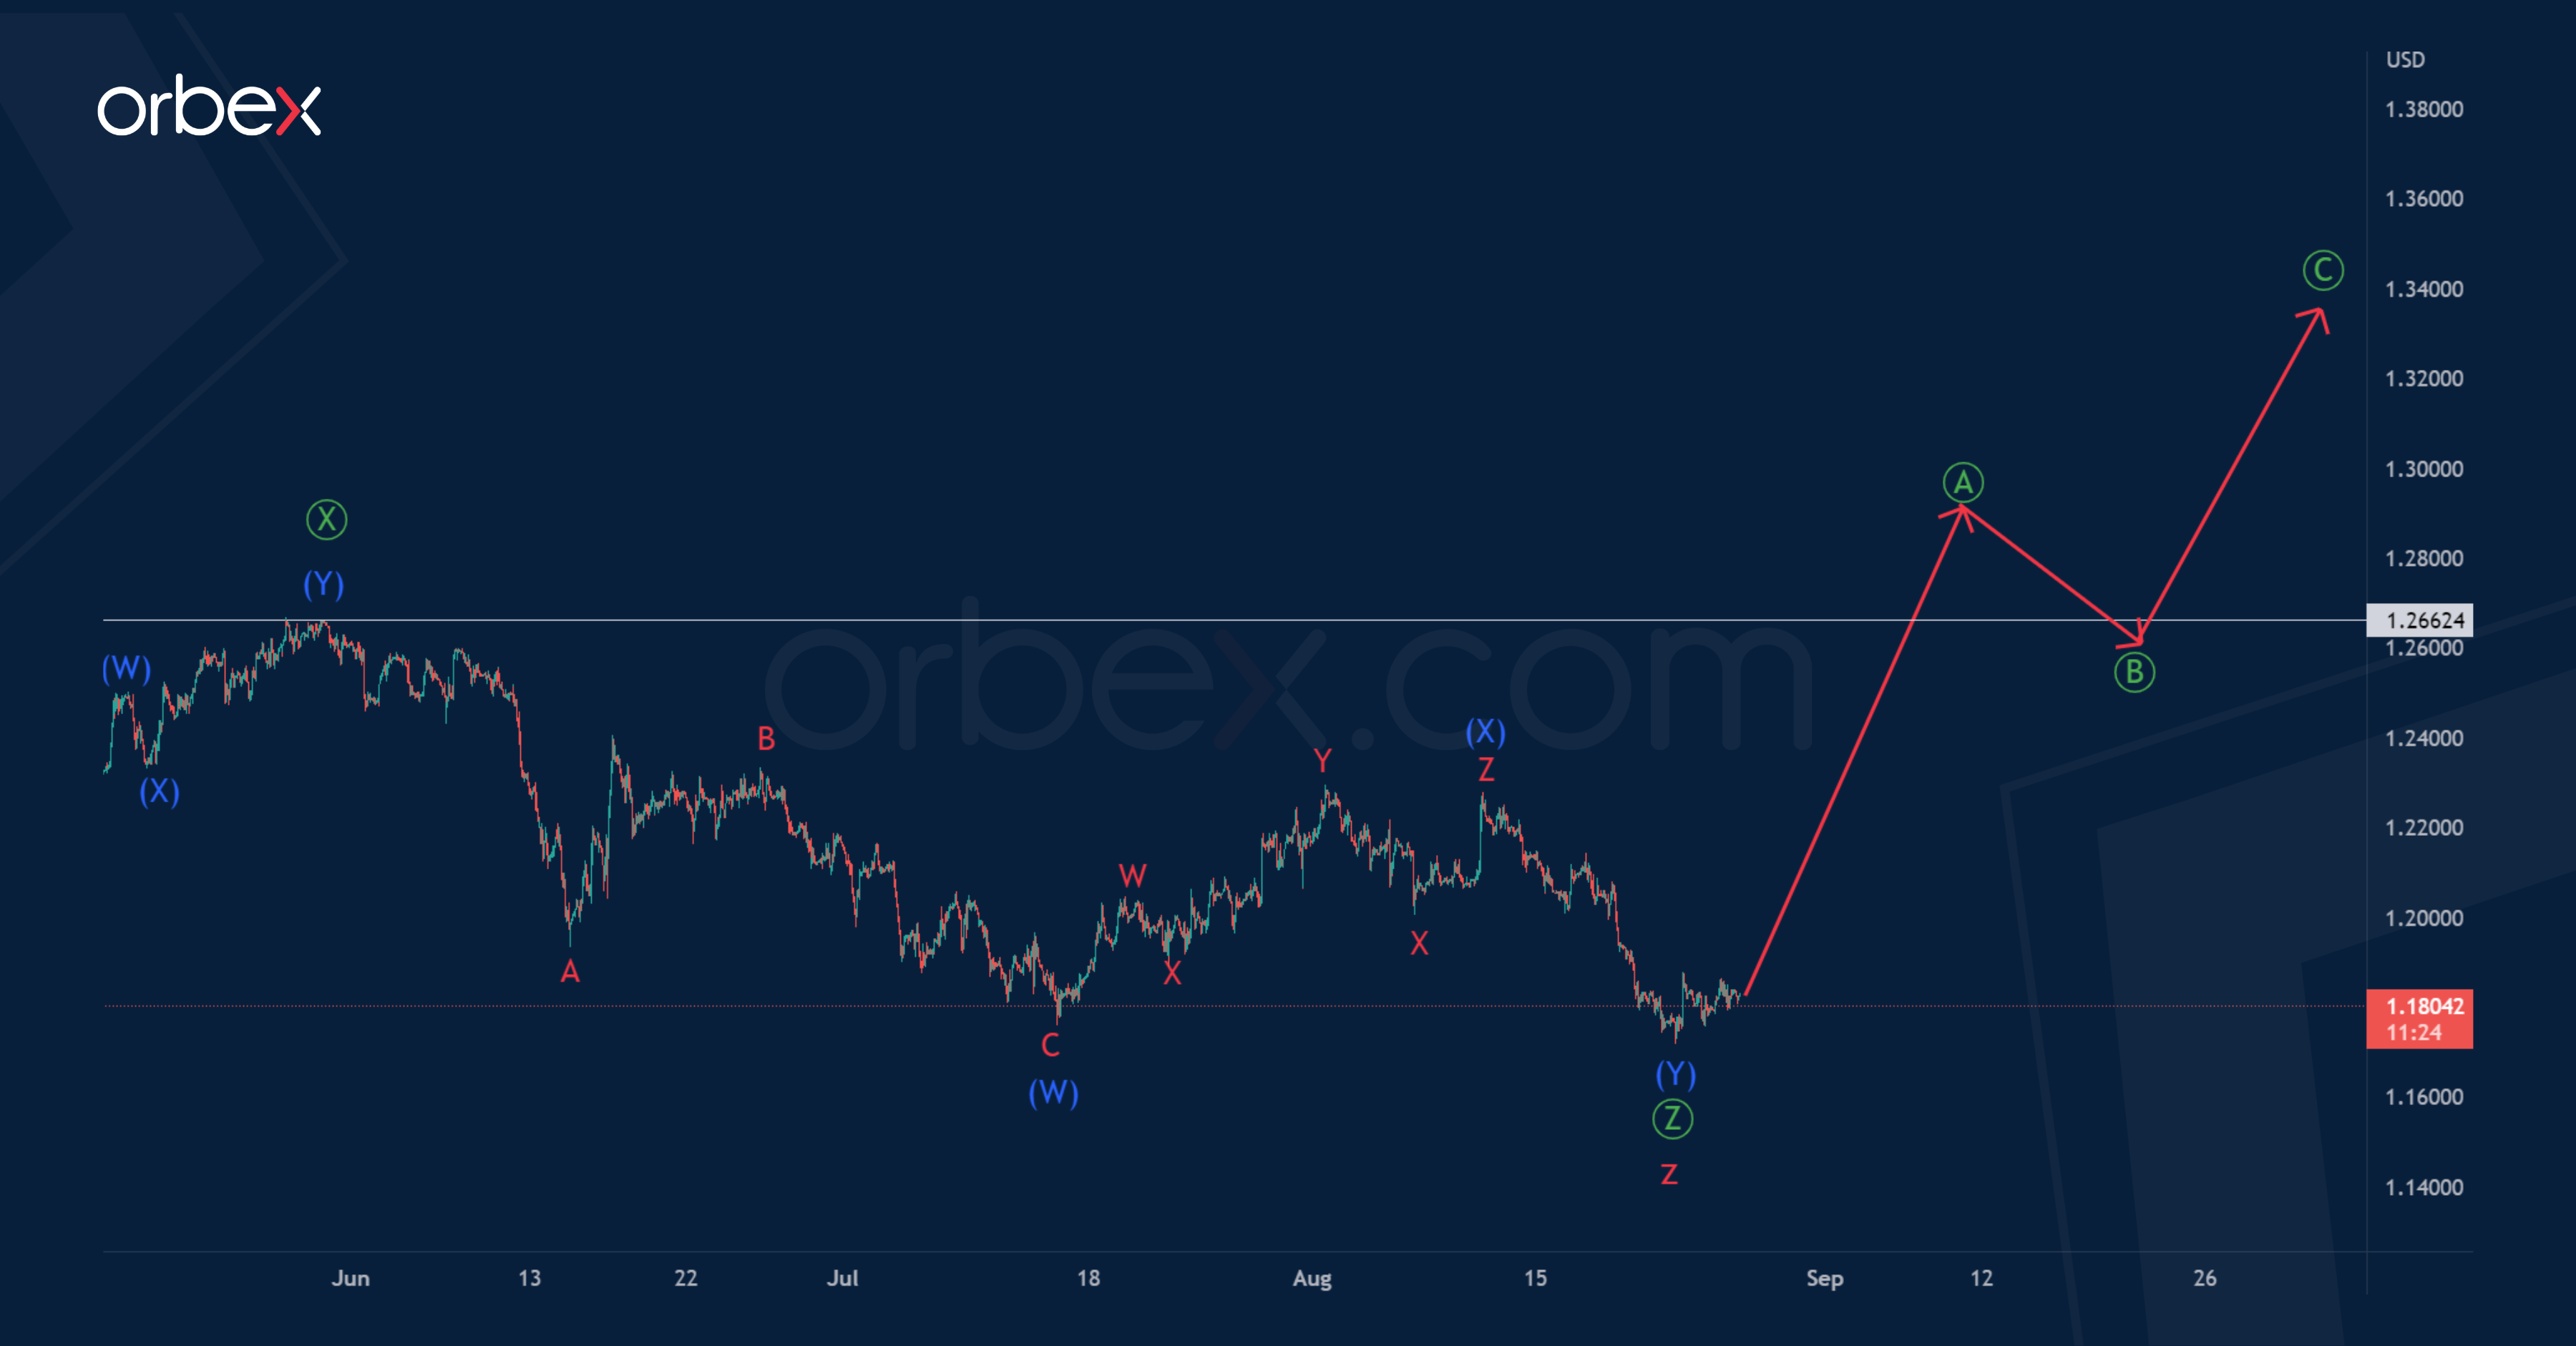
According to an alternative scenario, the cycle wave z could be fully completed. As in the main version, it has the form of a primary triple zigzag.
Thus, to confirm this scenario, bulls should be strong enough to start moving the price within the new trend.
Perhaps in the next coming trading weeks, market participants could expect the construction of the first impulse wave, a potential zigzag, of the primary degree.
The price may rise to the previous high of 1.266, and then even higher.
S&P 500 Attempts to Bounce
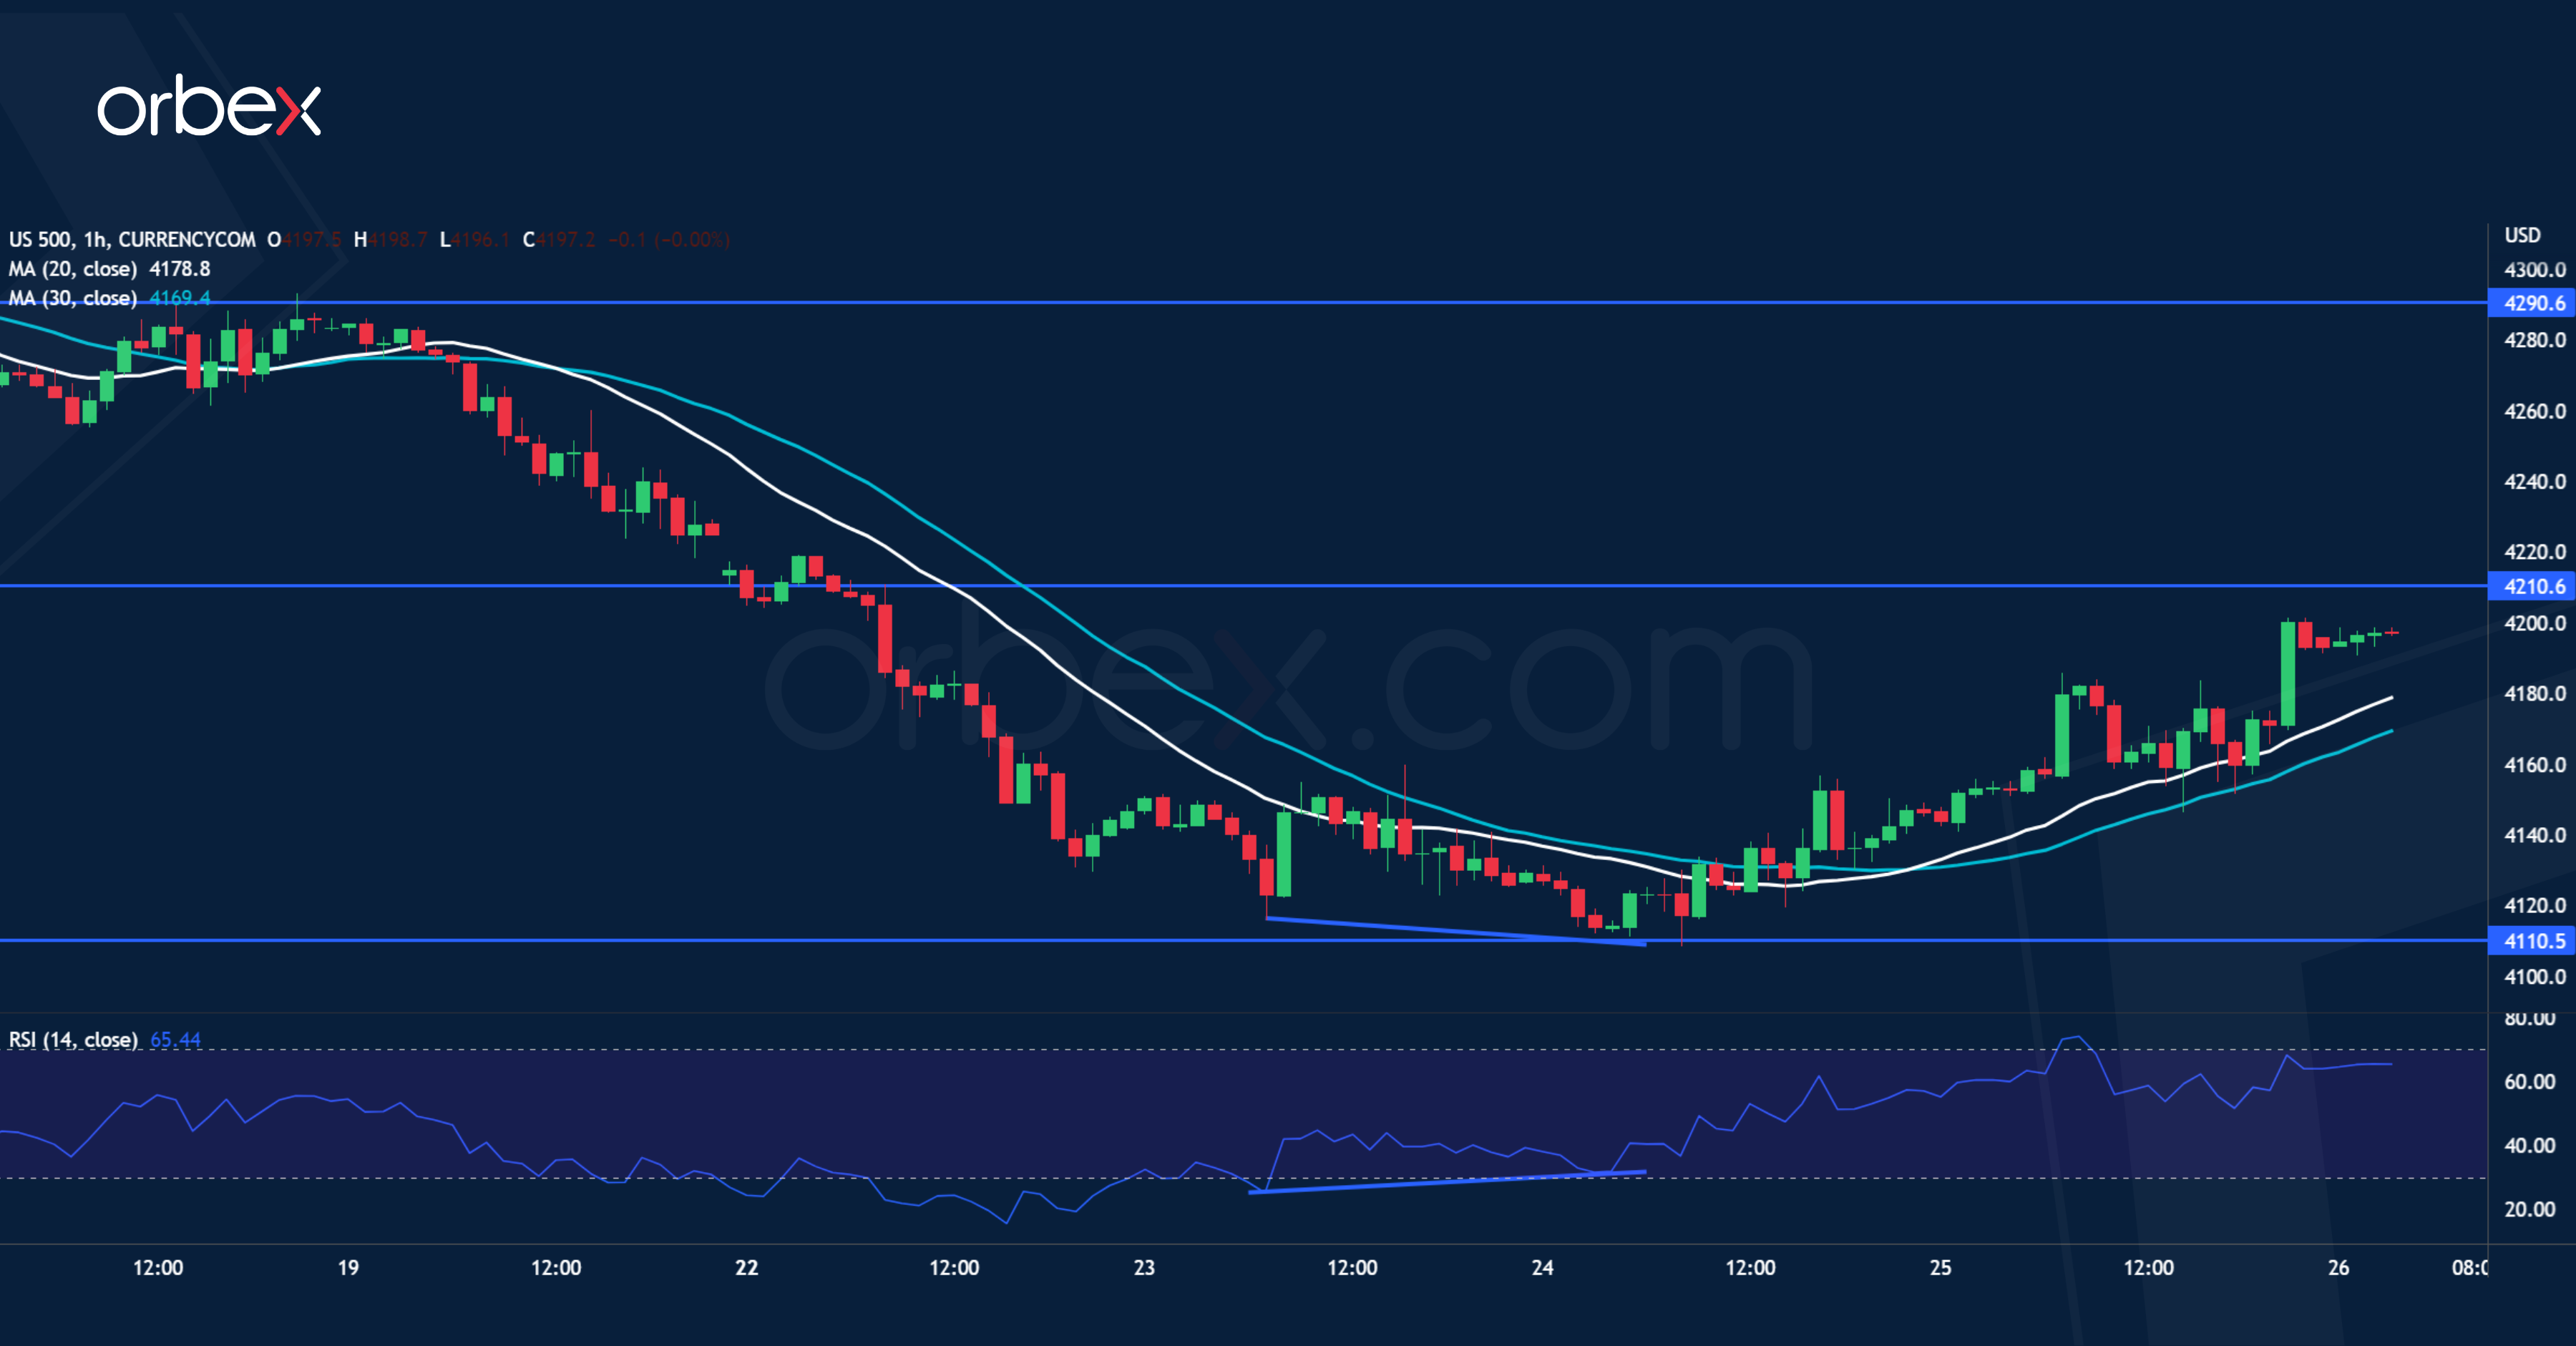
The S&P 500 bounces as the shorts take profit ahead of Powell’s speech. The recent sell-off has stopped short at 4110, which is a daily support at the base of a bullish breakout. The level also coincides with the 30-day moving average, making it a congestion area. A bullish RSI divergence attracted bargain hunters with an initial pop above 4160. The bulls will need to lift the support-turned-resistance at 4210 before the recovery could gain momentum. A bearish breakout could trigger a fall to the psychological level of 4000.