Sample Category Title
Week Ahead – NFP Report, Eurozone Inflation Under the Microscope as Markets Wobble
The US nonfarm payrolls report will take centre stage next week as speculation about the size of the Fed’s next rate hike goes into overdrive. Investors will also be keeping a close eye on the latest inflation readings in the euro area ahead of the September rate decision amid growing gloom about the bloc’s economic outlook. PMI indicators out of China and as well as quarterly data from Australia and Canada will be important too in helping to gauge the health of the big economies.
Will the August NFP change anything for the dollar?
The August payrolls report will headline another data-packed week in the United States as it will be one of the last pieces of the puzzle for the Federal Reserve before it meets in September. But before the all-important jobs numbers, there’s a raft of other releases to get through.
Kicking things off on Tuesday are the S&P CoreLogic Case-Shiller Home Price index and the Conference Board consumer confidence index. On Wednesday, the Chicago PMI and the ADP employment report will be in focus, while on Thursday, the ISM manufacturing PMI will be closely watched following the further deterioration observed in the sector in S&P Global’s equivalent index.
As for Friday, after last month’s unexpectedly hot print of 528k jobs, a somewhat softer report is anticipated in August, with analysts projecting a figure of 290k.
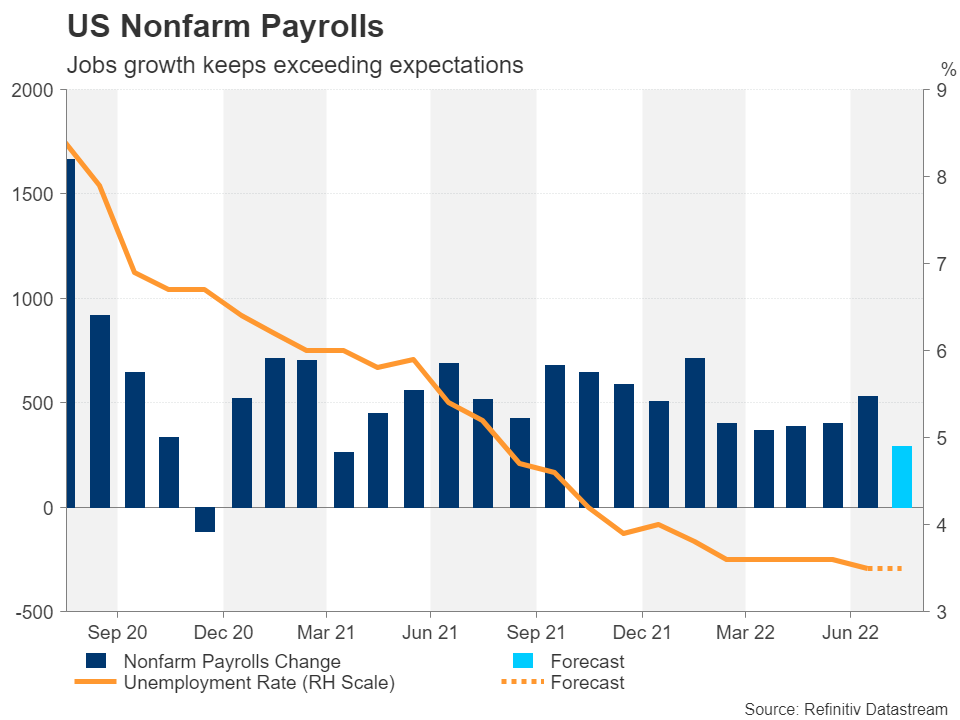
The unemployment rate is forecast to stay unchanged at the post-pandemic low of 3.5%. Average hourly earnings growth is expected to hold slightly above 5%.
The continued tightening of the labour market versus the early signs that inflation has peaked have put investors in a bind about the expected path of interest rates as the Fed won’t yet budge from its very hawkish stance even as fears of a recession are intensifying.
The rate hike odds for September are increasingly leaning in favour of a 75-basis-point one, but they could again tip towards 50-basis-point if the labour market starts to show signs of cracking. The weak employment readings in the PMI surveys suggest a disappointment in the headline print is more likely than not, although a positive surprise cannot be ruled out as it did last time.
Either way, the dynamics have not changed for the US dollar – its reserve currency status would probably keep any losses from poor data to a minimum, while strong numbers would bolster it further.
Eurozone inflation to hit 9.0%
Whilst Americans may be seeing some relief from exorbitant price jumps, inflation has likely not yet peaked in Europe where the energy crisis just keeps getting worse. Natural gas prices are soaring again, sending European futures to record highs in the past week.
The drought across the continent, which has dried up rivers, has increased the reliance on natural gas by making it more difficult to transport other types of fuel via the quickest shipping routes. And now, Europeans face the prospect of a fresh disruption to gas supplies after Gazprom announced that it plans to hold a three-day unscheduled maintenance of the Nord Stream pipeline, starting on August 31.
Inflation in the euro area hit a record high of 8.9% year-on-year in July. The flash estimates for August are due on Wednesday, with the harmonized index of consumer prices for August forecast to edge up to 9.0%.
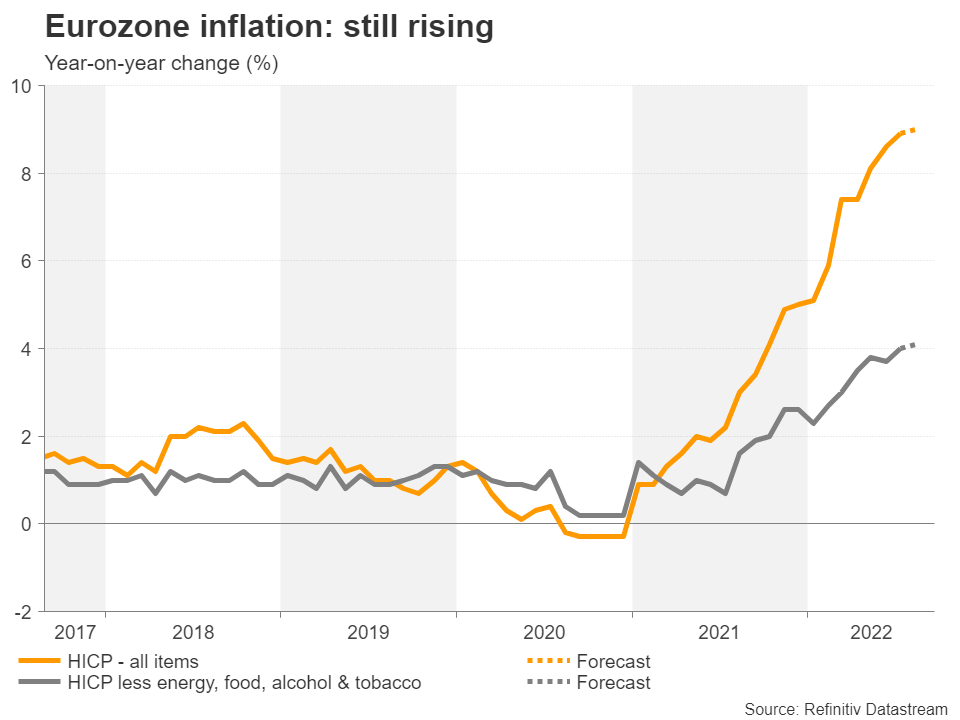
Policymakers will undoubtedly also be paying close attention to the underlying measures of inflation ahead of the European Central Bank’s next policy meeting on September 8.
Even if the recent pullback in oil does bring down headline inflation via cheaper petrol prices, the ECB will be reluctant to let its guard down so soon after commencing with its first rate hike cycle in more than a decade if core inflation readings are too high.
The euro could receive a small boost from hotter-than-expected inflation figures, but only if the dollar doesn’t go on another rampage.
Other indicators that will put the euro on recession watch are the Eurozone’s economic sentiment indicator on Tuesday, the final manufacturing PMIs on Thursday, and producer prices and German trade data on Friday.
Commodity currencies at the mercy of external forces
The commodity-linked Australian, Canadian and New Zealand dollars have been on a roller-coaster ride over the last month or so, being held hostage to wavering risk appetite and shifting Fed rate hike expectations.
All three currencies have managed to stay above their July lows, but the path forward remains obscure as China’s economic troubles have injected a fresh dose of uncertainty to the outlook and the Fed is nowhere close to a dovish pivot, which market participants are still betting will happen in 2023.
Thus, domestic data is not the primary driver for the commodity dollars at the moment even though they do have substantial bearings on the pace of monetary tightening in the respective countries.
Nevertheless, the Canadian dollar has been outperforming its aussie and kiwi counterparts this year as Canada’s economy is less exposed to China risks and has overall been more robust over the last year.
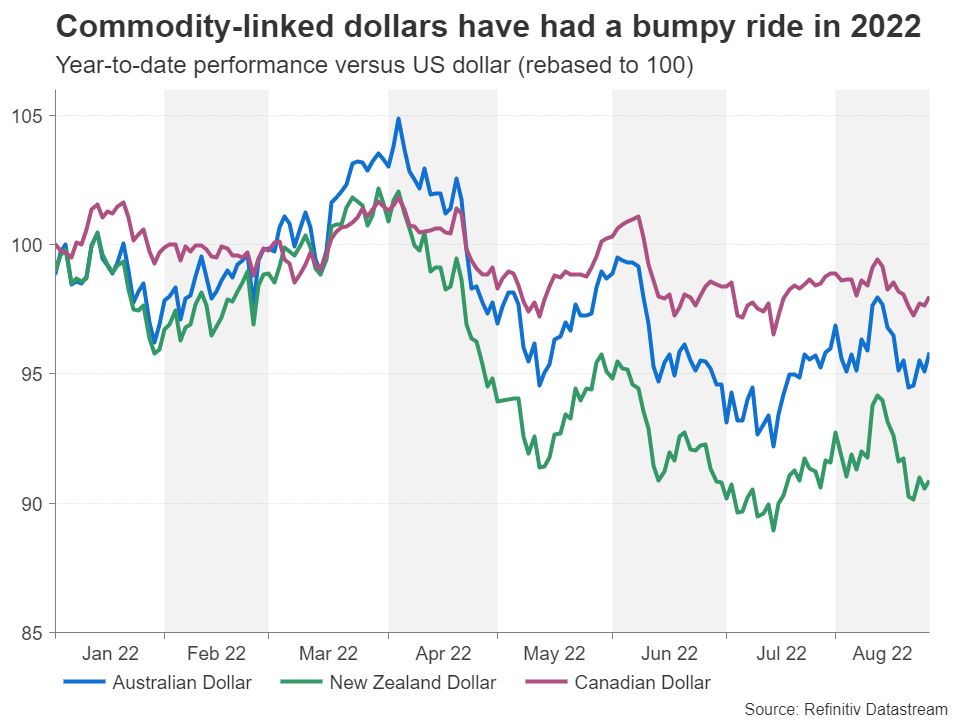
GDP numbers out on Wednesday will probably confirm that this trend was maintained in the second quarter.
In Australia, Q2 construction and capital expenditure estimates are due on Wednesday and Thursday, respectively, but the highlight for aussie traders will likely be the August PMIs out of China. The government’s own manufacturing PMI is released on Wednesday and the Caixin one will follow on Thursday.
Concerns that China’s economy is stuttering have been weighing on risk-sensitive currencies, as well as on broader risk assets. However, even if the PMIs disappoint, the hit to sentiment might be limited this time following the announcement this week of additional stimulus measures by Beijing, which went some way in relieving the anxiety.
Meanwhile in New Zealand, investors will want to see whether business confidence, which had slumped to the lowest since the onset of the pandemic in June, bounced back further in August when the ANZ business outlook survey is published on Wednesday.
Weekly Focus – Energy Crunch Worsens
As markets continue to price in higher natural gas and electricity prices for the coming year, the euro area looks increasingly more vulnerable and EUR/USD traded below parity to the lowest level in almost 20 years. The energy crisis also spilled over to other markets. Investors are turning more worried about second round effects on inflation and markets' inflation expectations ticked higher. Oil markets were also affected, as the incentive to switch energy source has increased and oil traded back above USD100 per barrel. 10-year US treasuries edged back above 3% for the first time in a month driven by expectations that the hiking cycle from the Federal Reserve is far from over. Also Bunds traded higher as markets are now pricing in 200bps hikes from the ECB as opposed to 130bps two weeks ago.
Higher yields were hard on equity markets, where stagflation fears are dominating, even if China's State Council did step in with a 1 trillion yuan spending package as China is struggling with repeated COVID lockdowns, waning global demand and a vulnerable property market.
PMIs in the euro area were slightly less gloomy than expected, but indicates a slowdown as inflation is digging deep into consumer pockets. In the US, PMIs indicate the service sector is slowing faster than expected. On a positive note, businesses' selling prices are increasing at a softer pace. That said, forward prices in energy markets indicate large heating bills ahead in Europe and we see no signs that wages will cushion the blow to purchasing power much. Euro area negotiated wage growth dropped back to 2.1% in Q2 from 2.8% in Q1, as one-off payments dropped out of the figures. The underlying trend is a moderate increase in wage growth.
With the threat of energy rationing and production cuts later this year still looming, the near-term outlook for the euro area economy remains challenging. Our recession model indicators for the US and Eurozone show that a recession is certainly nearing, especially in the euro area, but the labour markets and investment cycles are still holding up relatively well on both sides of the Atlantic giving some cushion for the time being.
Next week, the most important data out of the euro area will be the inflation figures. We look for a marginal slowdown in core inflation to 3.9%, but a further increase in headline inflation to 9.2% on the back of higher energy prices. In contrast to the US, we have not seen the inflation peak in the euro area yet and we look for further increases to double digit rates in Q4, leaving the pressure on for more ECB hikes.
In the US, markets will be looking out for signs of a looser labour market, as we get both job openings and a jobs report. Consensus is for another 290,000 employed but markets will be looking at the full picture of indicators to decide whether the pricing of Fed is fair. In China, we look for weaker manufacturing PMIs on the back of weaker export orders and a continued weak property market.
The US Dollar is Still the King, But!
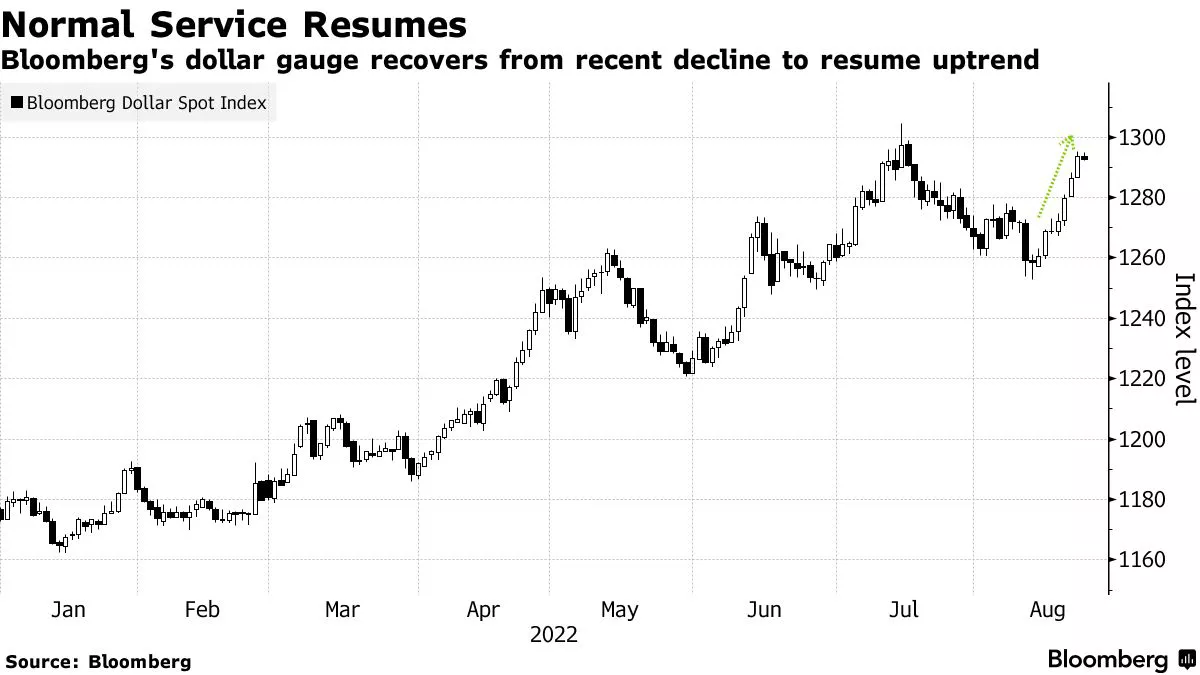
Despite a slight decline from its highest levels since 2002, around 109 range, it is just a correction, and the green king, the US dollar, will resume its rally.
On both sides of the dollar's strength equation, motives exist for it to continue its gains. One is betting on the continued weakness of its major peers, from the faltering European currencies to the weak Japanese Yen, as they suffer from their own problems. On the other hand, the Federal Reserve's insistence on keeping hiking rates and fear of recession will drive the demand for the dollar. The dollar is a winner in both cases.
Why is the US dollar so strong?
The dollar rose against the world's major currencies, heading for its biggest rally in nearly 40 years and the third largest since President Richard Nixon broke the dollar's peg to gold more than half a century ago. Many reasons are contributing to the dollar's strength since the beginning of the year:
1. The dollar benefits in all cases, whether during periods of outperformance of the US economy or recession. If risks increase, people seek the strongest safe-haven, the dollar. And if the economic outlook for the US flourishes, we see the dollar benefiting from this positive situation.
2. The Fed's commitment to raising interest rates until inflation returns to its 2% target, even if it will sacrifice some strength in the labor market and slowdown in the US economy.
3. The fear of recession leads to higher demand for the dollar.
4. A widening gap between the hawkish Federal Reserve and other central banks would lead to a stronger dollar.
Why are the major currencies weak?
The rise of the dollar was manifested in the dramatic declines witnessed by the rest of the major currencies:
1. The Euro:
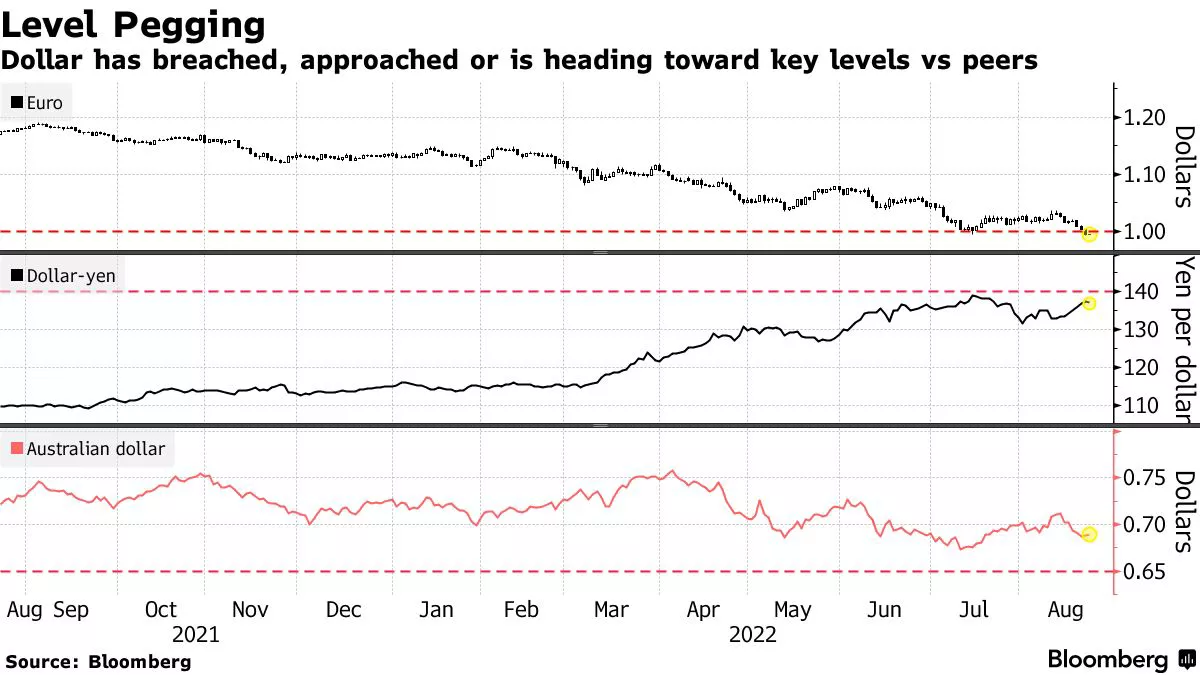
The strength of the US dollar has pushed the euro to parity, the lowest level for the euro since 2002. The euro is unlikely to recover from its lows against the dollar until Europe emerges from the natural gas crisis sweeping the region.
2. Japanese Yen:
Hopes for a JPY recovery have faded, despite Japan's recent pickup in inflation. The dollar index is moving steadily towards 137 amid renewed interest in buying the dollar. The Bank of Japan's insistence on holding the ultra-easing policies will increase the yen's weakness against the dollar.
3. Gold:
The dollar was the main obstacle to gold this summer. If the dollar index is not at 20-year highs, gold will be about $150 higher than current trading levels, according to Wells Fargo.
4. Even the Chinese currency reached its lowest level against the dollar in two years.
Forecasts:
- According to Bloomberg data and JPMorgan forecasts, the euro will fall the most against the dollar by the end of the year, as the single currency will drop to $0.95 by December.
- RBC Capital Markets believes that the British pound will fall more than 5% over the same period to the $1.11 level.
- The Commonwealth Bank of Australia expects the Australian dollar to fall to 65 US cents.
The dollar's strength is hurting global trade and may hurt it too!
The main driver of global capital flows is trade. Almost all major commodities are traded in US dollars. A higher dollar will eventually result in lower global trade, with the price of everything higher in terms of foreign currencies.
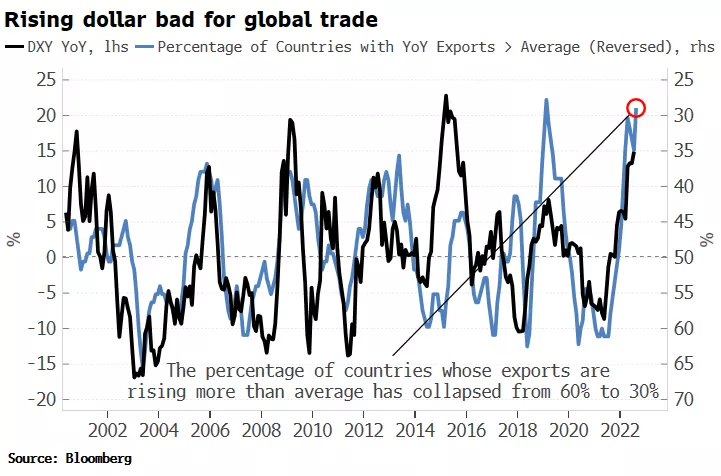
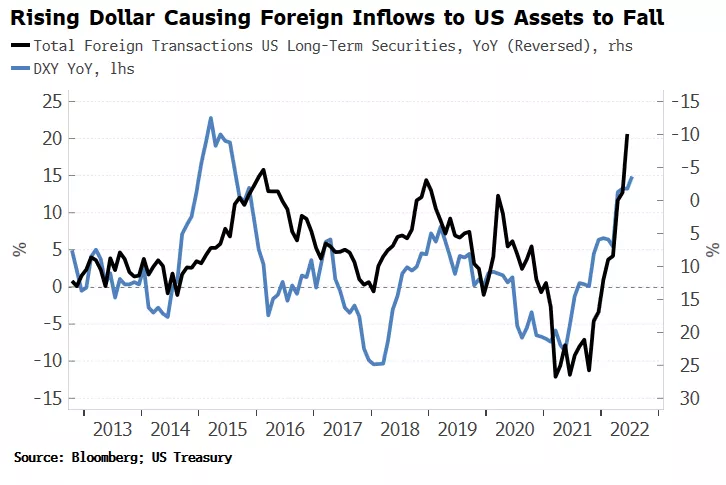
Global trade is faltering, which means capital inflows are declining. The dollar's recent rally could cause global trade to fall - and thus lower demand for dollar-denominated assets - which could lead to weaker dollar demand.
The rapid appreciation of the dollar is even more harmful to emerging markets, whose central banks collectively move the equivalent of more than $2 billion in foreign reserves every day.
The technical view supports the USD
On the technical side, all indications suggest that the dollar will continue to rise. All larger timeframes (daily/weekly/monthly) are bullish and optimistic, supporting the dollar's rally.
If the dollar index broke through the pivotal Fibonacci barrier at 109.14 and continued the break, it would be another strong bullish signal.
Buying opportunity
Despite the corrective movement of the dollar, all signs point to a return to the upside. So moments of weakness can be seen as buying opportunities before a possible retest at 109.00 and a potential new visit to 2022 high at 109.29.
US Fed May Not Yield to Market Pressure
EUR/USD weakens over bleak outlook
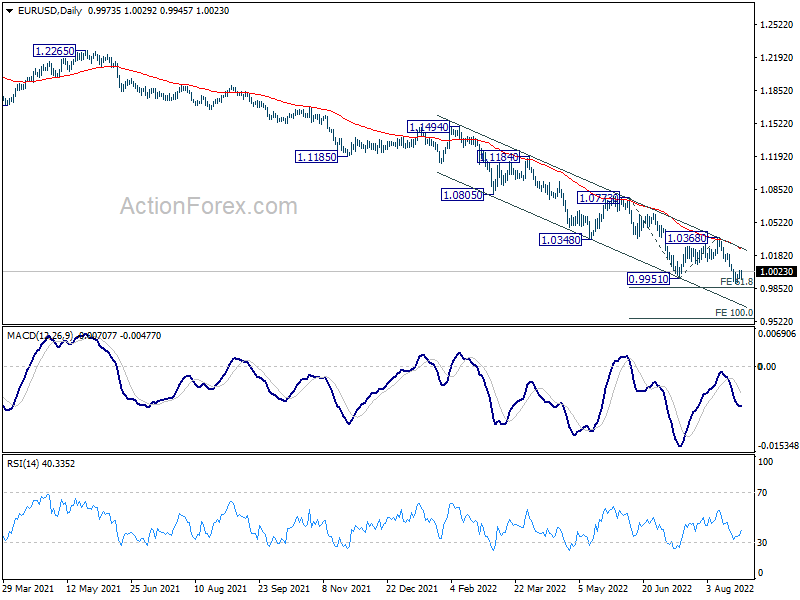
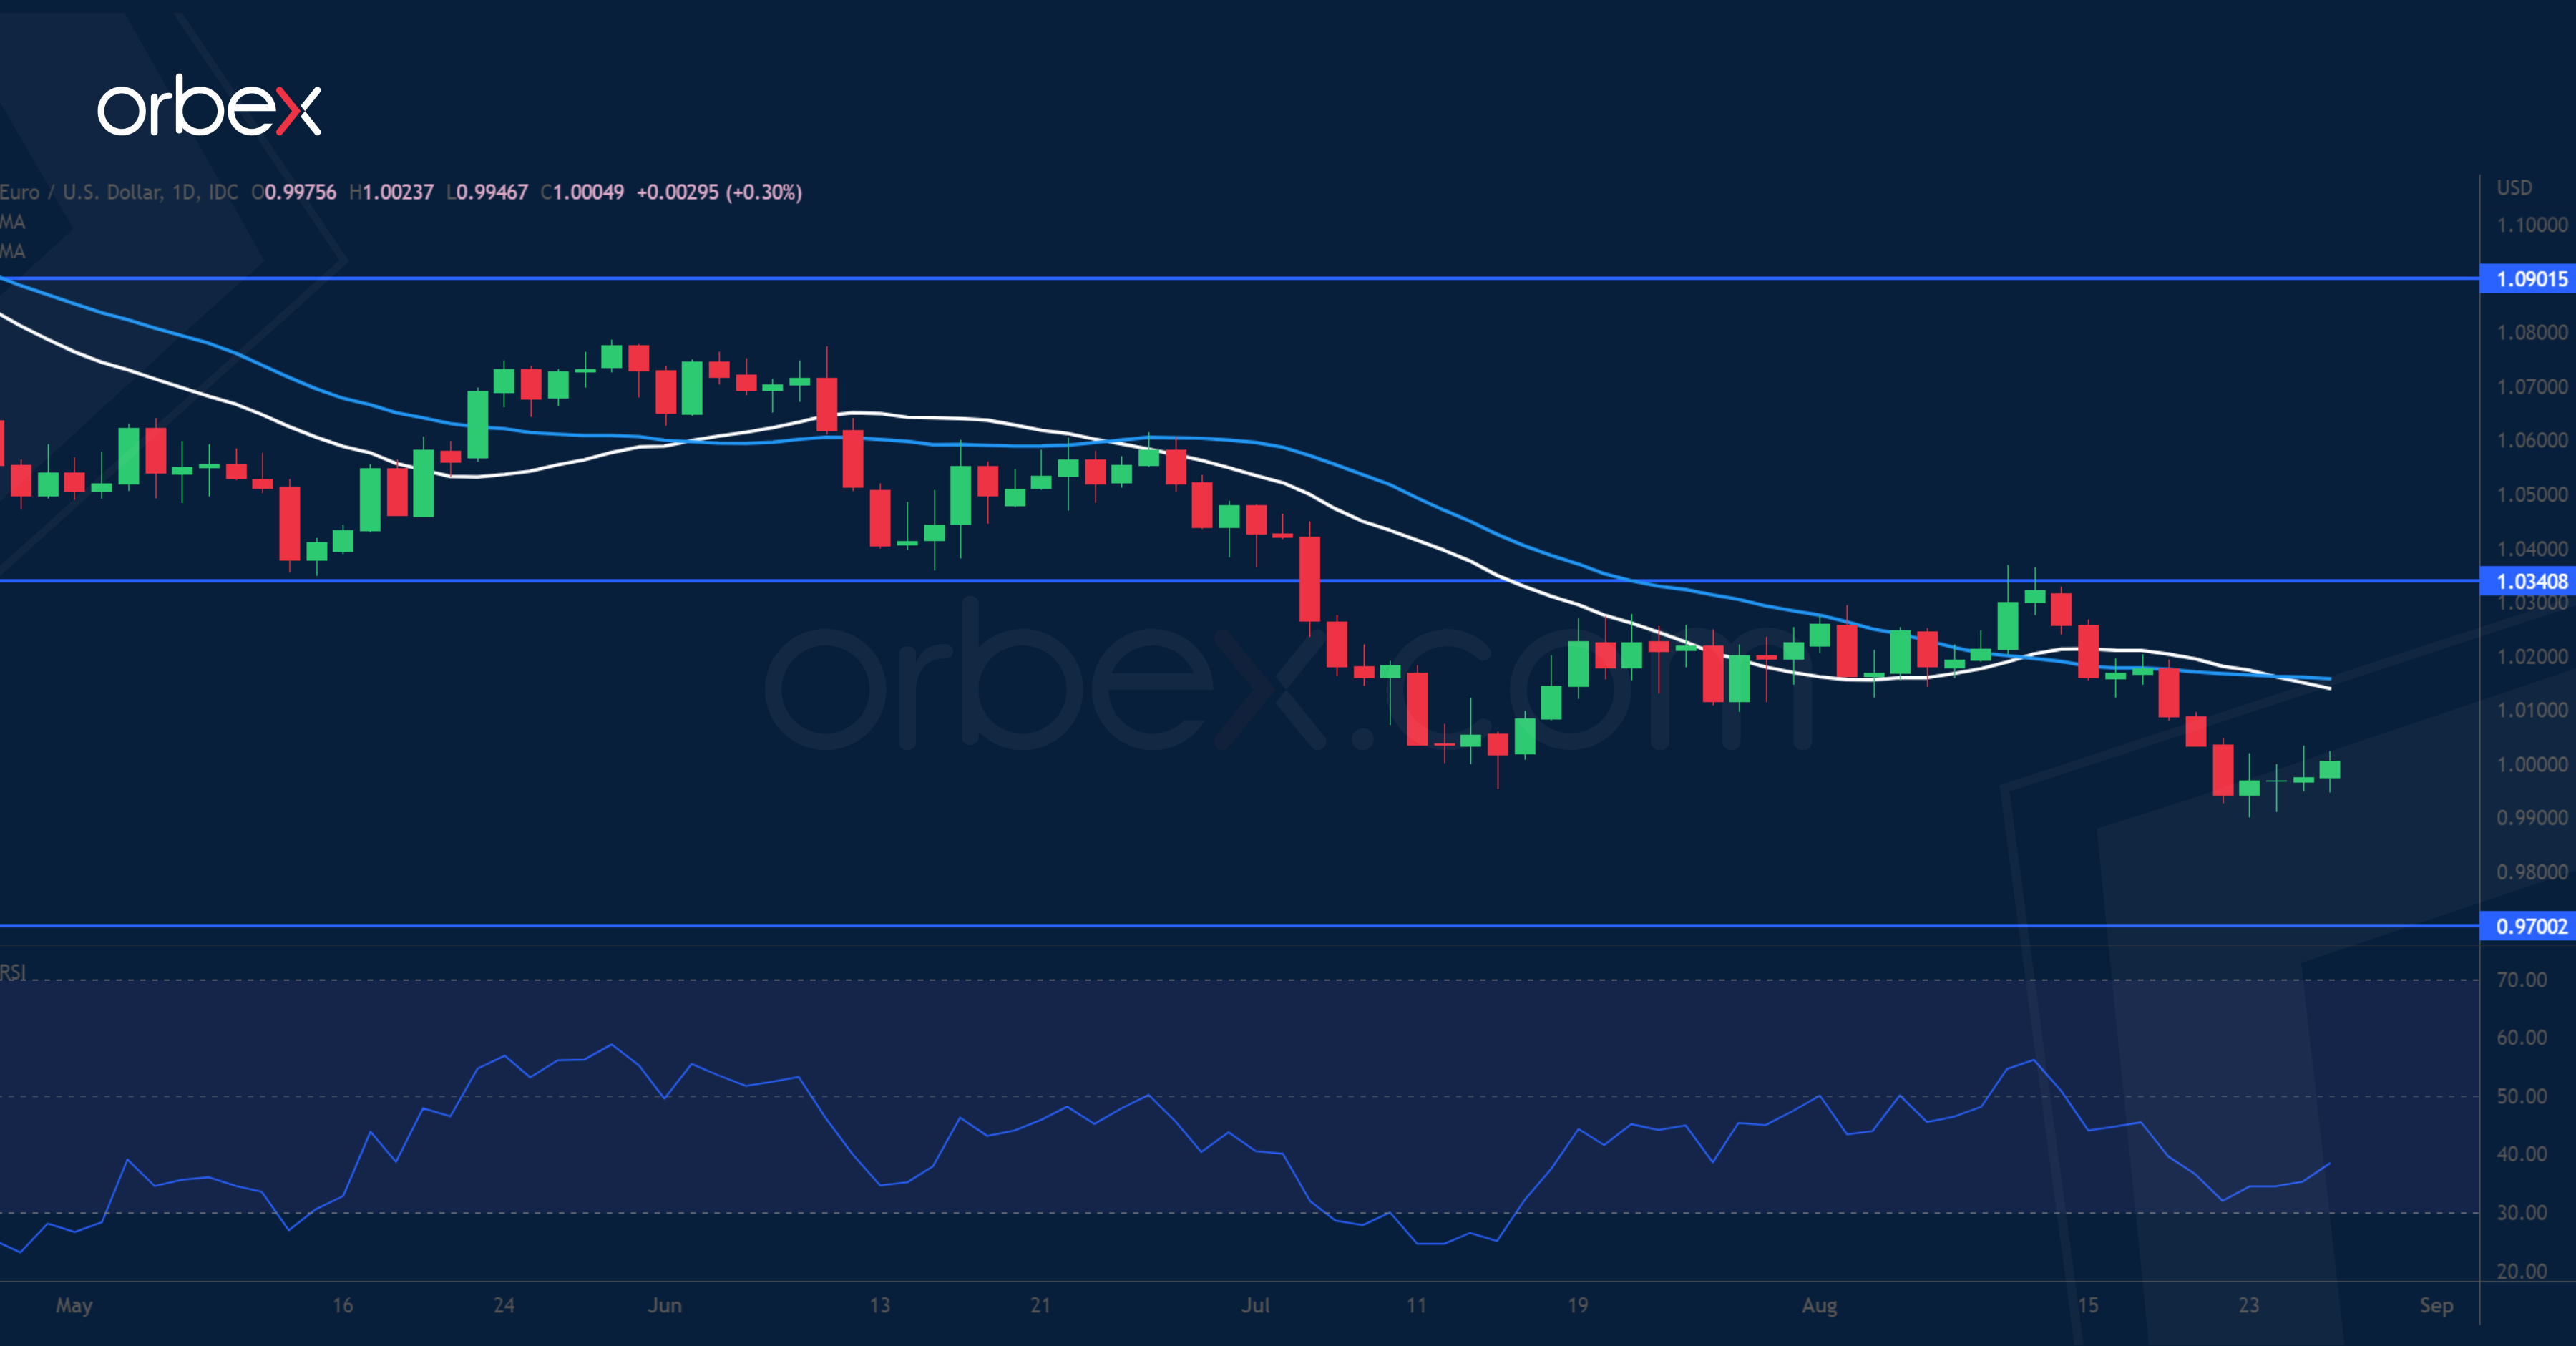
The US dollar remains strong over the prospect of sustained rate hikes. The euro’s failure to defend the parity level has revealed a lack of confidence in Europe’s outlook. An overwhelmingly pessimistic mood may continue to depress the single currency, and the latest consolidation could be a mere pause as dollar bulls search for catalysts to push back. On the other side of the pond, hopes that an economic slowdown might alter the Fed's tightening agenda have waned. Futures markets indicate that traders have raised their bets on a 75bp hike in September, which may send the pair to a 20-year low at 0.9700 with 1.0340 as resistance.
AUD/USD struggles over Chinese uncertainty
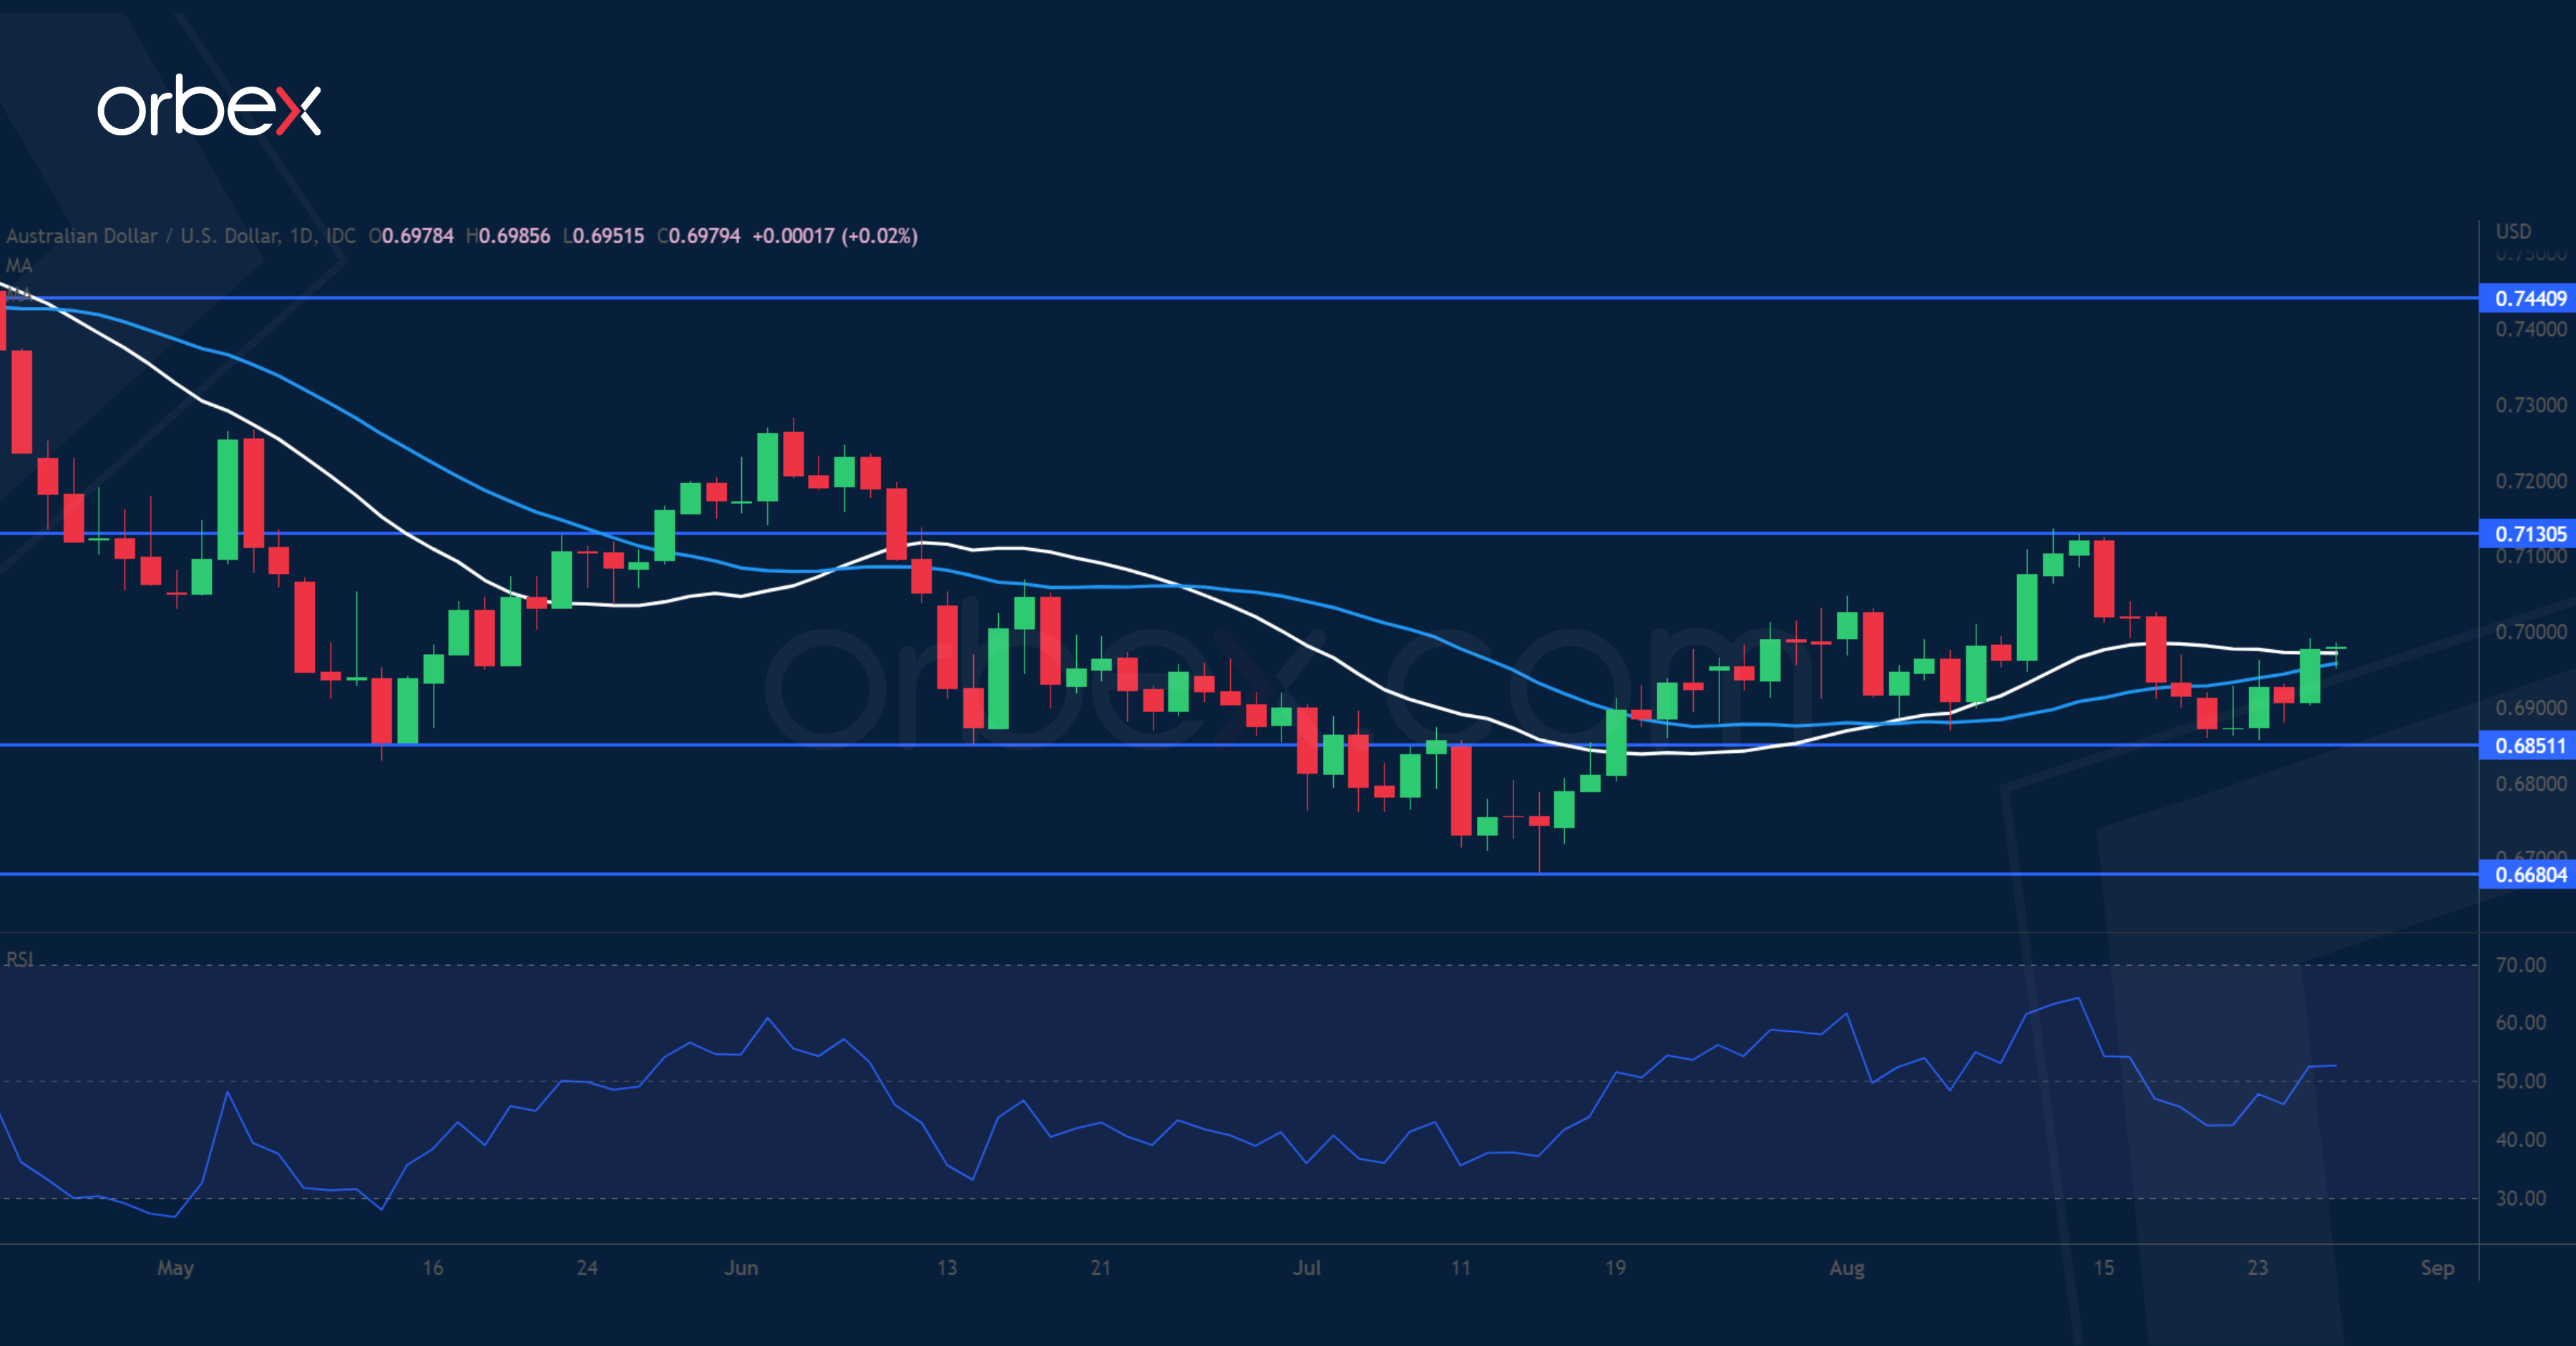
The Australian dollar retreats as markets go risk-off. Risk appetite took a backseat following hawkish comments from US Fed officials. Meanwhile, as a proxy to the Chinese economy, the commodity-linked currency is facing extra headwinds. Beijing is seeking to stabilise its ailing property market and its central bank has cut rates to shore up the economy in the wake of disappointing data. Australia’s retail data may stir up volatility in the short-term, but general market sentiment might continue to drive the exchange rate instead of domestic fundamentals. The pair hit resistance at 0.7130 and 0.6850 is a key support.
UK oil recovers over controlled supply
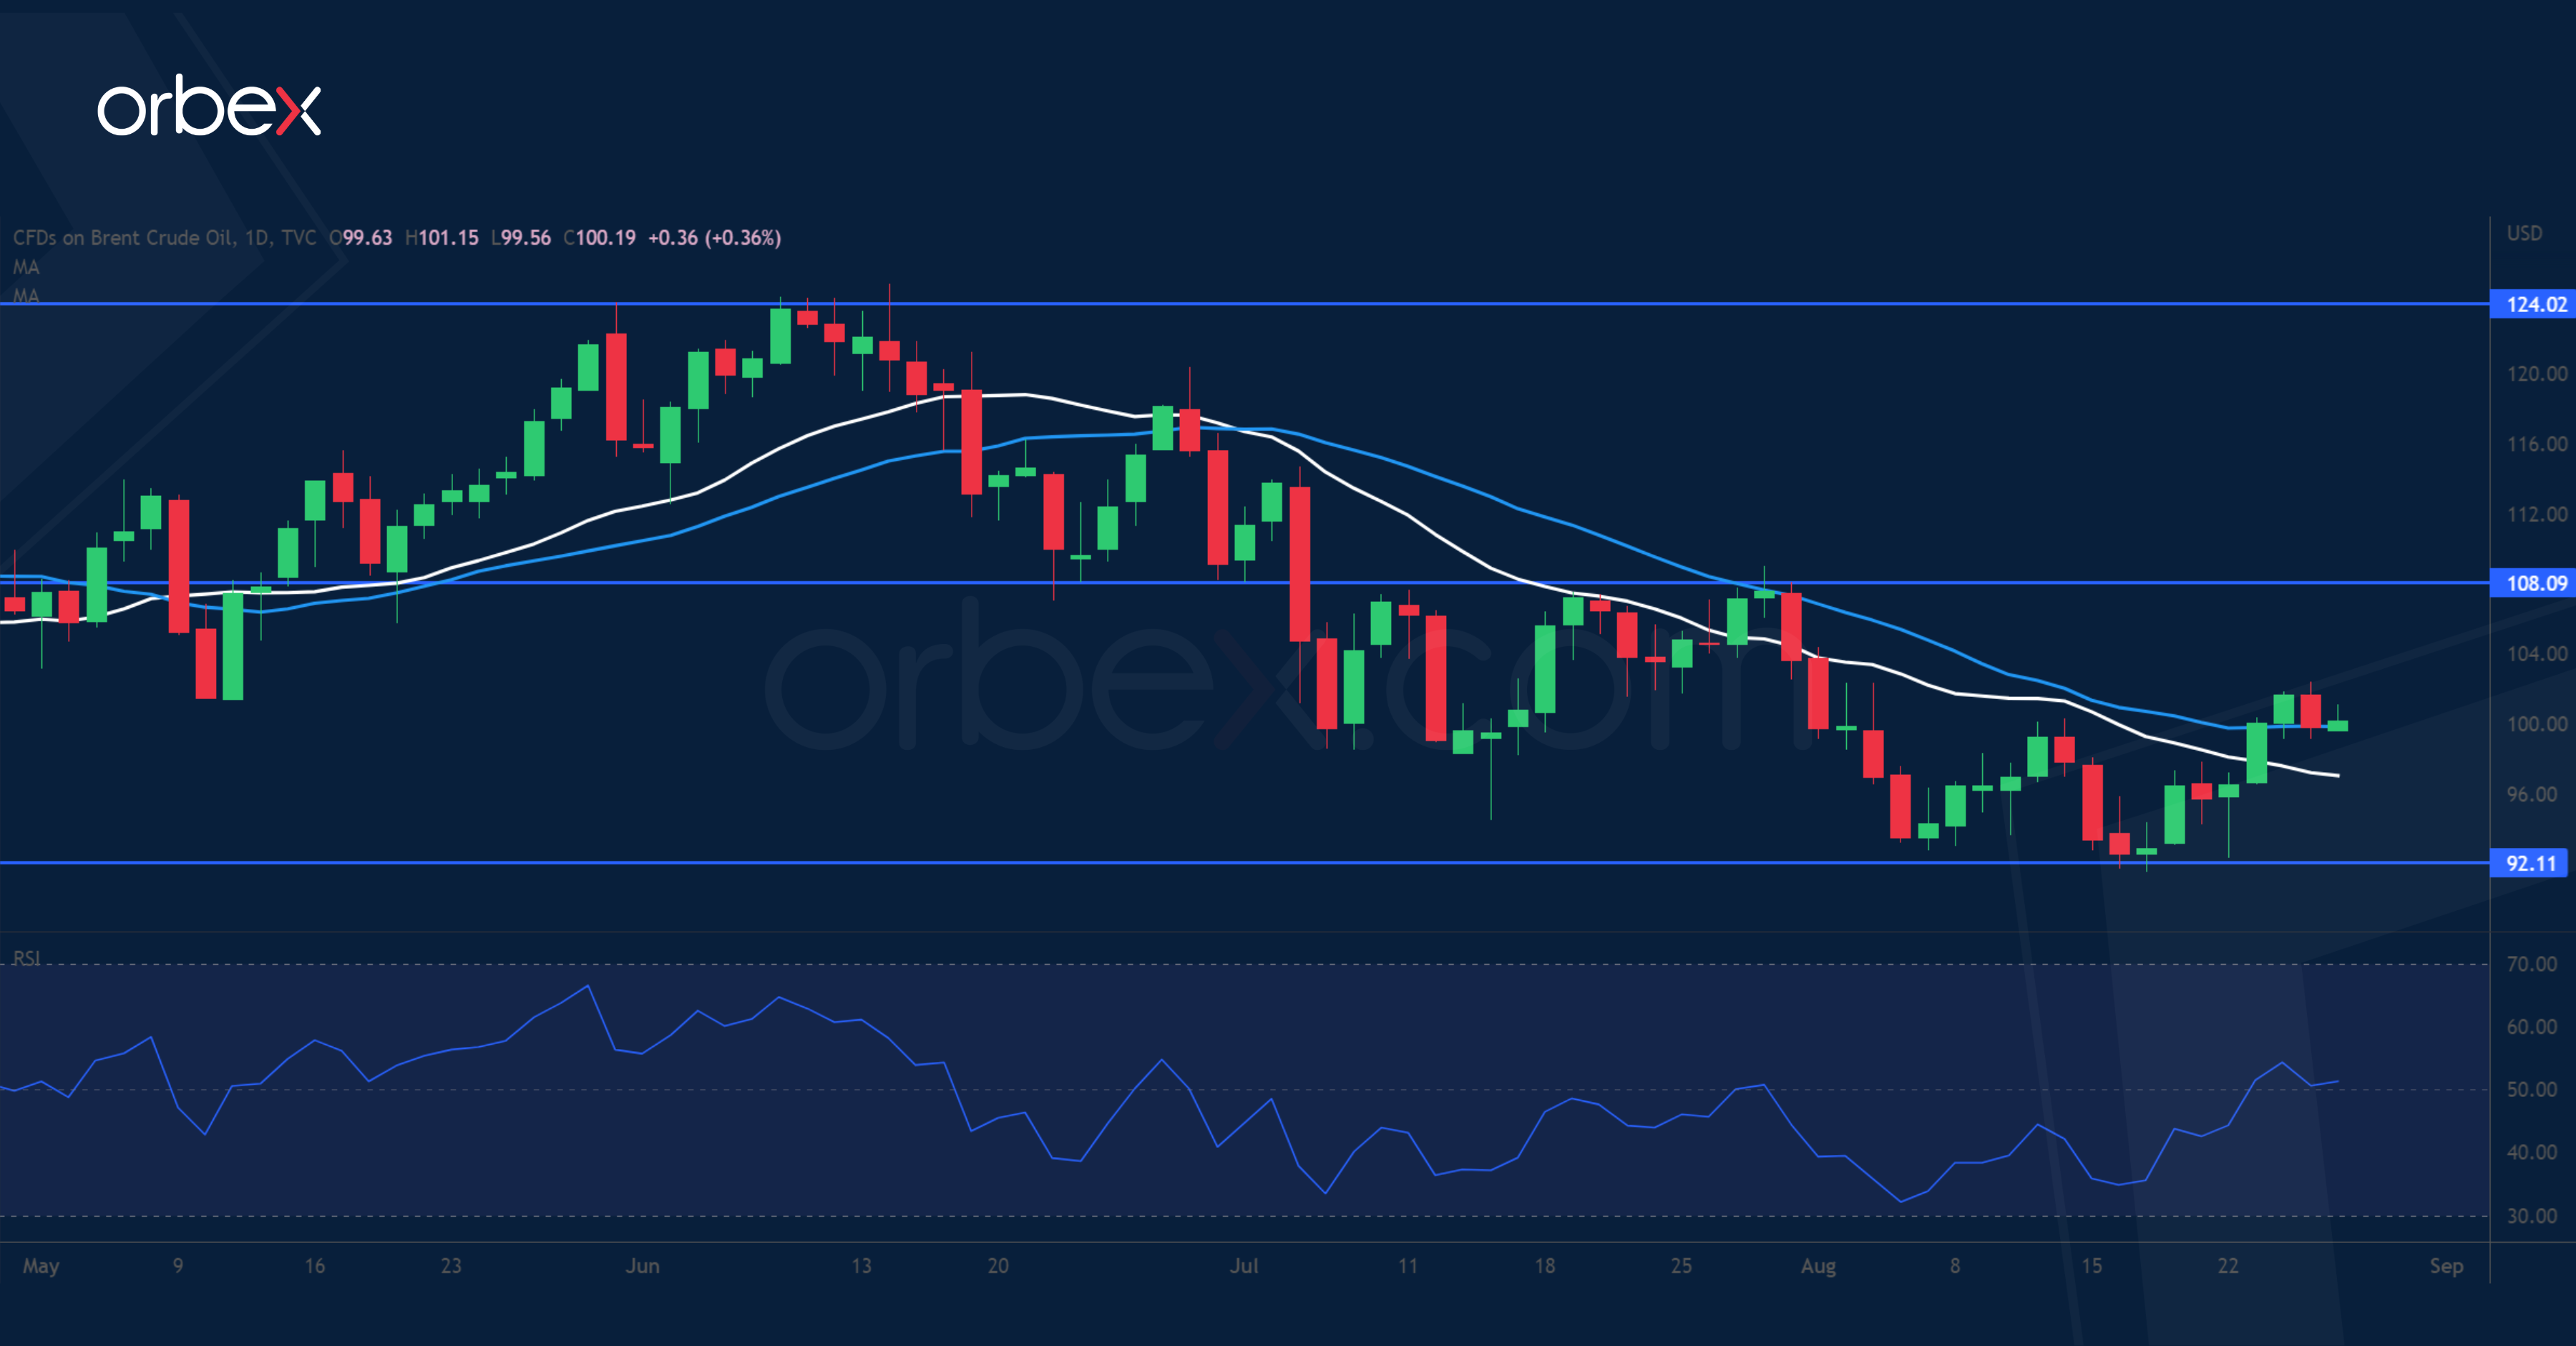
Brent crude recoups losses as OPEC+ may cut output to defend prices. As Iran seeks a compromise in its nuclear deal, an agreement seems remote but not unattainable. A return of Iranian oil to the market could undercut major suppliers and Saudi Arabia suggested that OPEC+ would consider cutting production in response. A larger-than-expected drawdown in US inventories offers extra tailwinds to the recovery. As for now, the prospect of tightly-controlled supply may outweigh concerns that an economic slowdown in China could hinder demand. The price has found support at 92.00 and is looking to reclaim 108.00.
NAS 100 softens as Fed remains firm
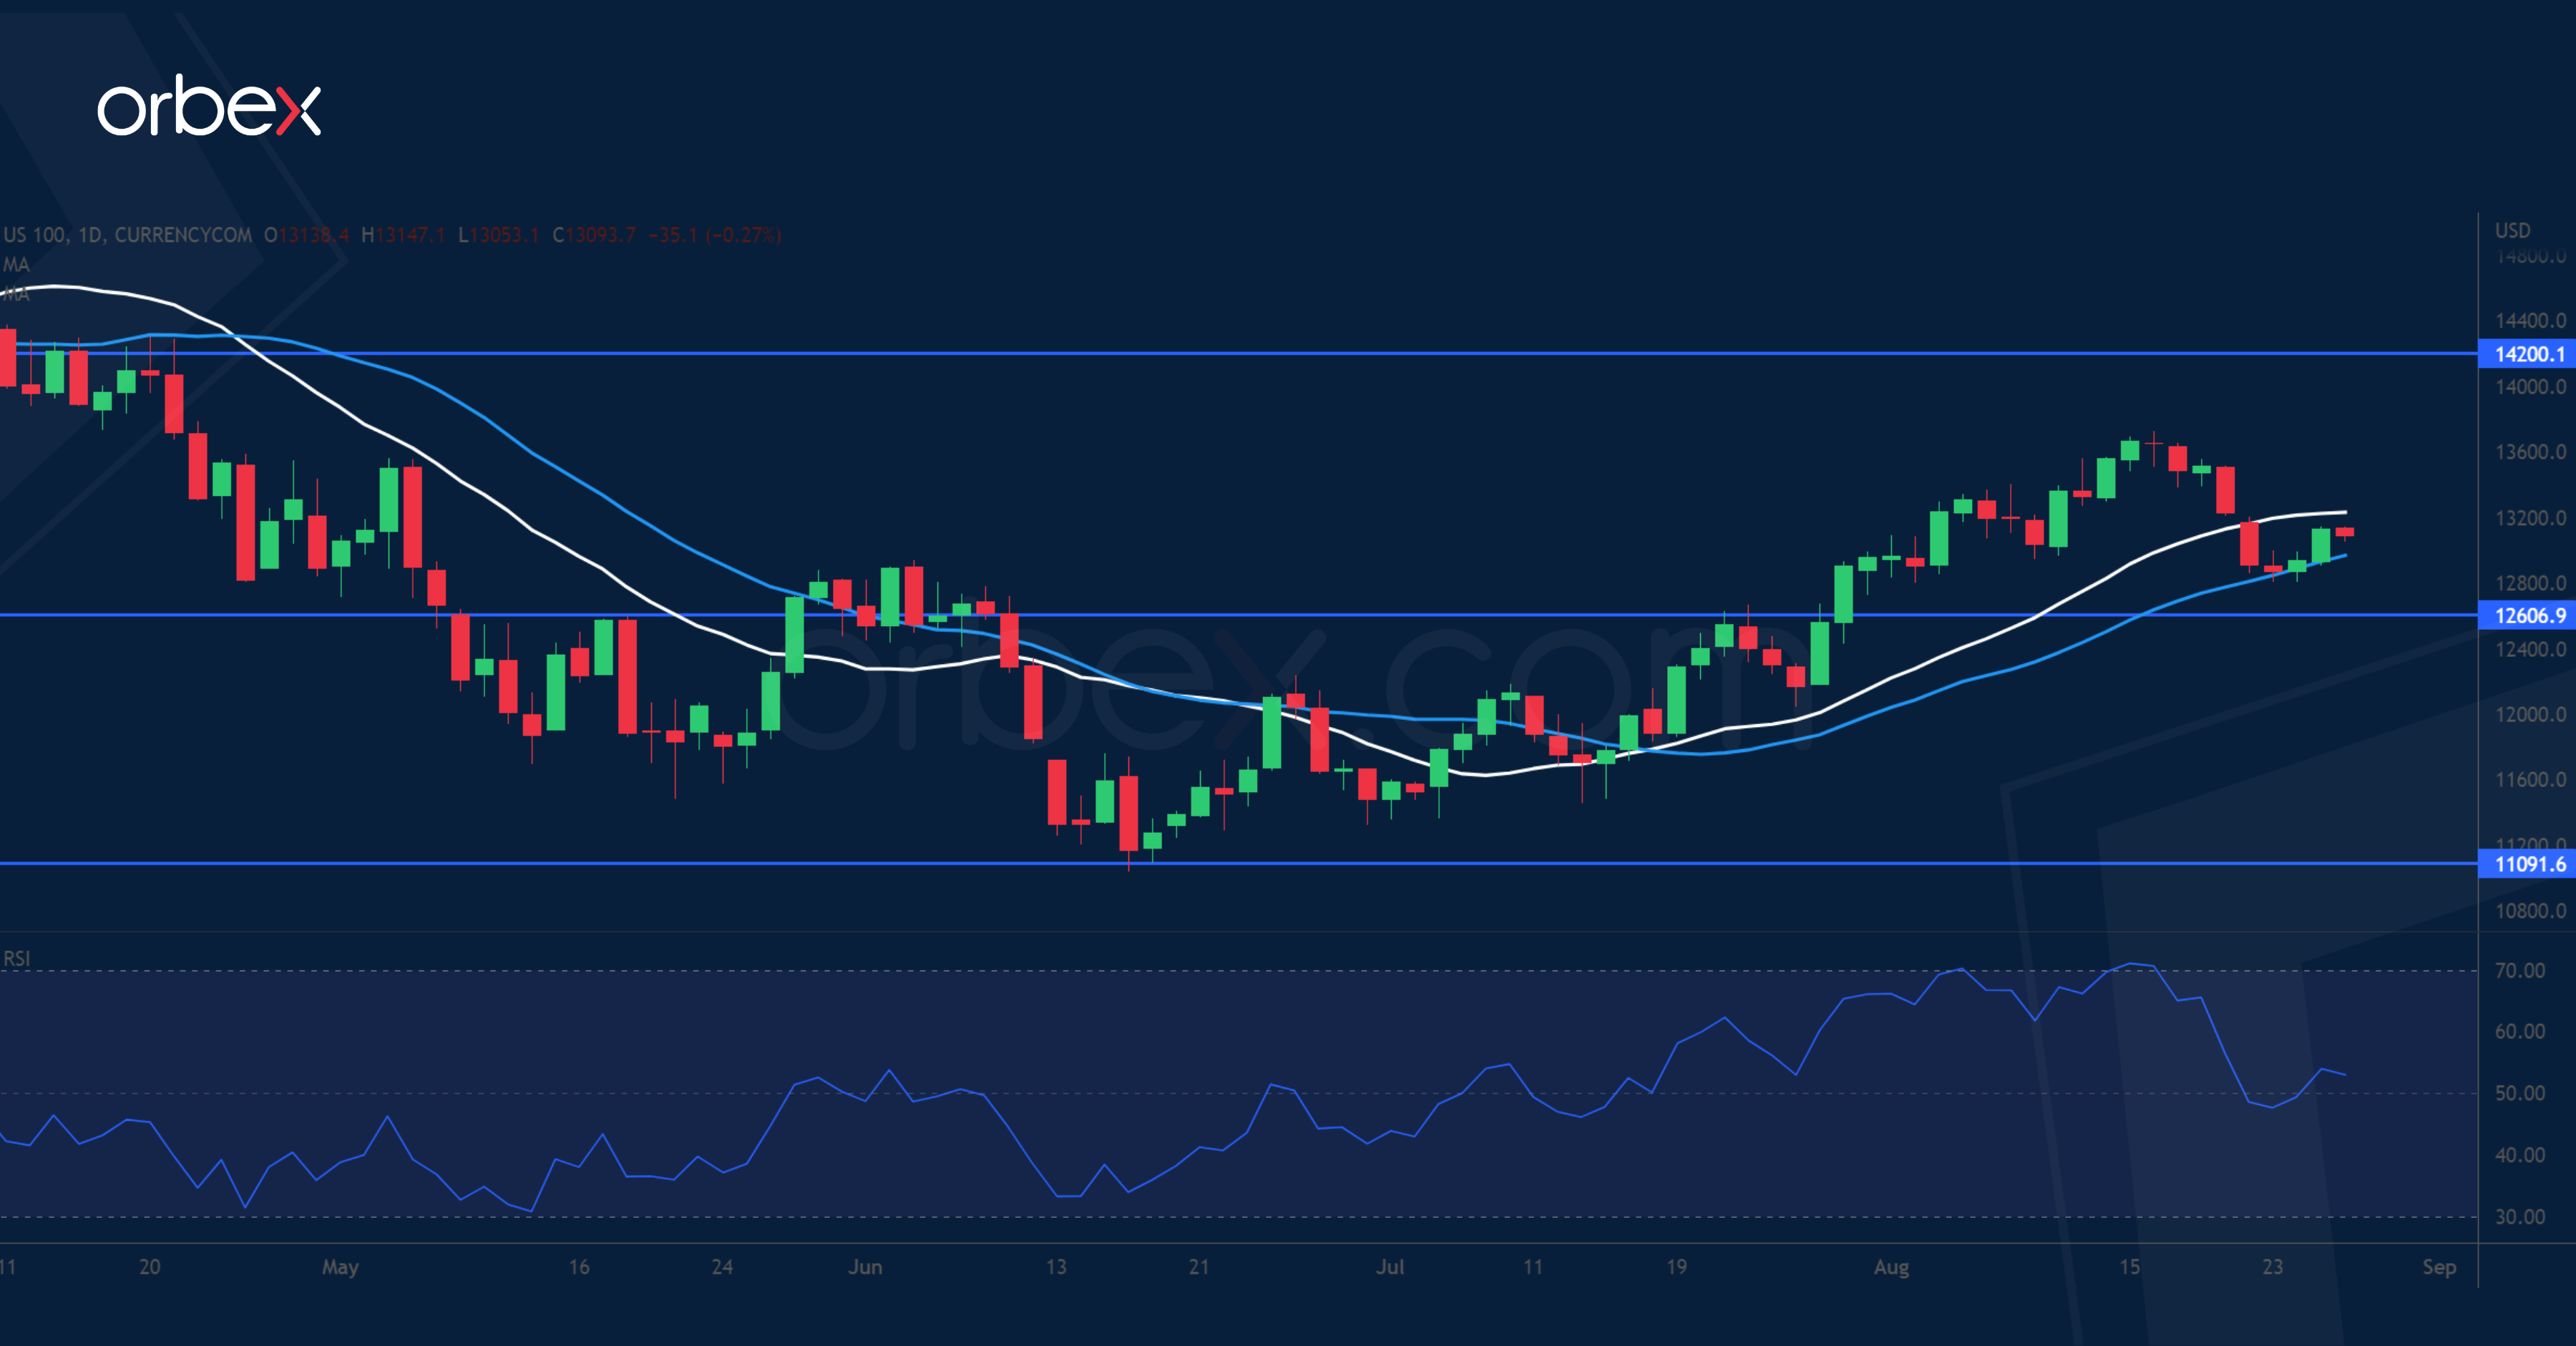
The Nasdaq 100 consolidates as the Fed remains hawkish. Weaker economic data are a double-edged sword. Equity markets see them as good news as they could lead the Fed to lift their feet off the pedal. Still, no one wants to see a recession materialise. Markets have become too comfortable with signs of plateauing in price pressures over the past month. The latest FOMC minutes may have wrong-footed investors with hints of a slower pace in rate hikes. Fed officials might want to address that communication hiccups and rein in expectations of a downshift in policy. The index is hovering above 12600 and 14200 is the first hurdle.
Sunset Market Commentary
Markets:
As was the case earlier this week, markets couldn’t do anything else but guessing which clues Fed Chair Powell will give on the Fed’s intentions in the new era where ‘forward guidance’ is decisively removed from centrale bankers’ toolkit. It’s some kind of ‘squaring of the circle’ problem. Is there still room to clarify the Fed’s reaction function to developments in inflation and/or growth? Or will a more in depth analysis of the neutral policy rate provide a yardstick on the degree of monetary tightness. We’ll know later today. Whatever, markets concluded from recent Fed speak that the message in one way or another should contain some ‘hawkishness’. A further headway of the ‘frontloading’ idea translated this month into a further curve flattening. After a correction yesterday, yields are again drifting north. US yields are gaining up to 2 bps points at the belly of the curve (5 & 10-y). Yields initially printed higher, but eased after weaker than expected US July spending and income data and a softer price deflator (-0.1% M/M; 6.3% Y/Y). European yields rise 3/4 basis points across the curve. From a technical point of view, the curve flattening trend brought the 2-year US yield (3.37 %) again within reach of the 3.45% mid-June top. Will Powell’s message be strong enough to attack/surpass this level and start a new episode in leaving behind the era of ample/excessive support of aggregate demand? Even after this months’ repositioning, the US 10-y yield (3.06%) only returned half way in the 2.51%/3.50% range. Maybe, quantitative tightening shifting to full speed next week, might support a further rise of LT yields. However, we don’t expect Powell to elaborate much on this topic.
On other markets, (especially US) equities recently showed remarkable resilience even as the Fed slowing aggregate demand is an essential part of its anti-inflation strategy. European equities this morning opened with modest gains, but already slipped back into negative territory (Eurostoxx -0.25%). This might partially mirror investor caution going into Powell’s testimony. Persistent headlines on high energy prices eroding European and UK consumers’ purchasing power probably are also in play. US futures indicate a slightly negative open. More concrete indications on the Fed deliberately slowing demand is in theory no good news for risk assets and a further challenge for the low-volatility environment.
In FX, the dollar slightly disappoints. The DXY index slipped lower to currently trade in the 108.30 area. Still, the 109.3 cycle top still isn’t that far away in case Powell’s expected hawkishness would revive a more profound risk-off mood. EUR/USD (1.0010) also manages to stay away from the 0.99 low. After leading the broader bond-market sell-off of late, UK markets are some kind of a ‘dovish’ outlier. Short-term UK yields are easing up to 3,5 bps. This weighs on sterling. EUR/GBP rebounds to the 0.8460 area. The UK cost of living crisis again takes center stage after Ofgem announced an increase in the cap on energy bills that might double the cost of energy for households with average consumption (cf infra).
News Headlines:
UK energy regulator Ofgem raises the price cap which governs the maximum gas & electricty bill for UK households by 80% in October, from £1971 at present to £3549 (a year). That’s more than the £2800 expected only three months ago. Back in May, they already lifted this ceiling from £1277 in October last year. The significant increase come because of higher wholesale price stemming from the Russian war in Ukraine (supply reduction) while government support announced in May (£15bn) no longer covers the gap. All else equal, UK households will probably face a new plafond increase in Spring next year with industry forecasts suggesting that it could go as high as £6600 a year.
US: Real Income Edges Higher, Spending Moderates
Personal income rose 0.2% month-on-month (m/m) in July, below the consensus estimate (+0.6% m/m) and slower than June's upwardly revised pace of +0.7% m/m. The gain was led by employee compensation of employees (+0.8% m/m) but was partially offset by decreases in proprietors' income (-1.3% m/m), personal current transfer receipts (-0.4% m/m), and rental income (-1.3% m/m).
The headline PCE deflator came in negative for the first time since April 2020, declining by 0.1% m/m in July but was 6.3% higher in year-over-year (y/y) terms. Excluding food and energy, core PCE inflation was up 0.1% m/m and 4.6% y/y - below June's reading of 4.8% y/y. Core PCE inflation is what the Federal Reserve references to gauge U.S. inflation when setting monetary policy.
Adjusting for inflation and taxes, real disposable income was up 0.3% m/m, reversing June's decline.
Nominal personal spending lost momentum in July, rising 0.2% m/m after a downwardly revised +0.7% m/m gain in June (from +1.1% m/m reported earlier), and below the consensus estimate (+0.4% m/m). Spending in real terms was up a modest 0.2% m/m, after a flat reading in June (from 0.1% m/m).
- Real goods spending rose 0.2% m/m, with outlays on durable goods (+1.5% m/m) contributing and spending on nondurables (-0.5% m/m) subtracting from the reading.
- Services spending grew by only 0.2% m/m in real terms; housing and utilities and transportation services were the leading contributors.
With inflation eating into consumers spending power, the personal saving rate remained under downward pressure, dropping to 5.0% in July.
Key Implications
This was a good downside surprise, as some deceleration in spending is required to keep inflation under control. Alongside yesterday's upward revisions to Q2 consumption, July's gains sets up the third quarter for a solid gain in consumer spending. We are currently tracking around between 1.5 and 2% annualized gain.
Real disposable income growth came in strong in July, but remains flat when looking at the six-month average. In contrast, despite some deceleration, real monthly spending have been growing at +0.1% on average over the same period, which suggests that households continue dipping into their pandemic savings or borrowing more.
Despite a still sizeable nest egg of roughly $2.5 trillion, consumers can't continue to exceed their income for too long if they want to preserve some financial for the future. That's why expect that the long-term spending and income trends to continue to converge in the future. Still, there are several wildcards. For example, the recent student debt relief announcement is likely to boost future spending by those who benefit.
USD/JPY Mid-Day Outlook
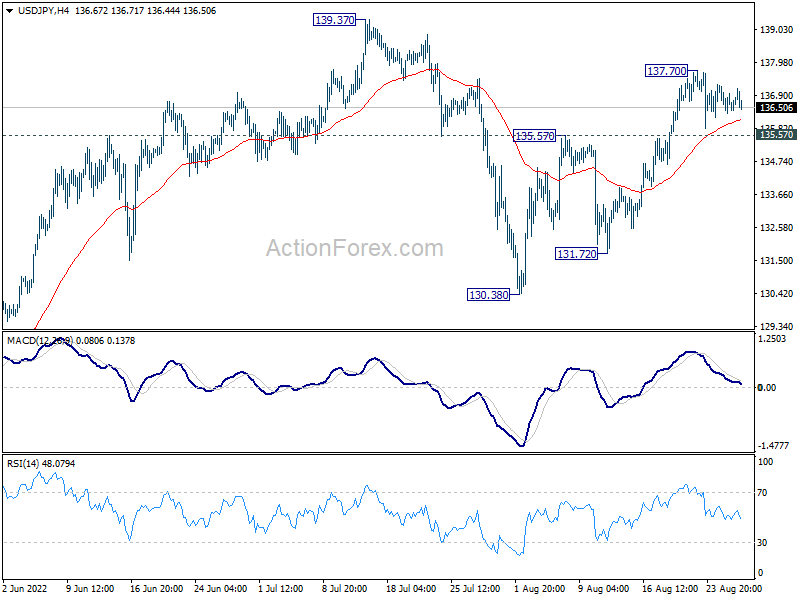
Daily Pivots: (S1) 136.15; (P) 136.68; (R1) 137.03; More...
Range trading continues in USD/JPY and intraday bias stays neutral. Overall, price actions from 139.37 are seen as a corrective pattern, with rise from 130.38 as the second leg. Above 137.70 will extend the rebound but upside should be limited by 139.37. On the downside, firm break of 135.57 will suggest that the third leg of the pattern has started, and turn intraday bias back to the downside for 131.72 support first.
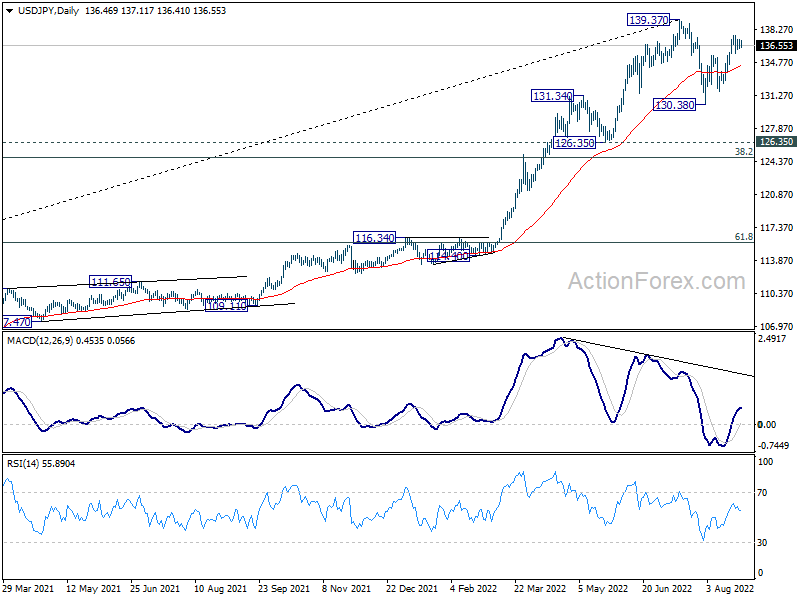
In the bigger picture, price actions from 139.37 medium term top are seen as a corrective pattern to up trend from 101.18 (2020 low). While deeper decline cannot be ruled out, outlook will stays bullish as long as 55 week EMA (now at 123.21) holds. Long term up trend is expected to resume through 139.37 at a later stage, after the correction finishes.
USD/CHF Mid-Day Outlook
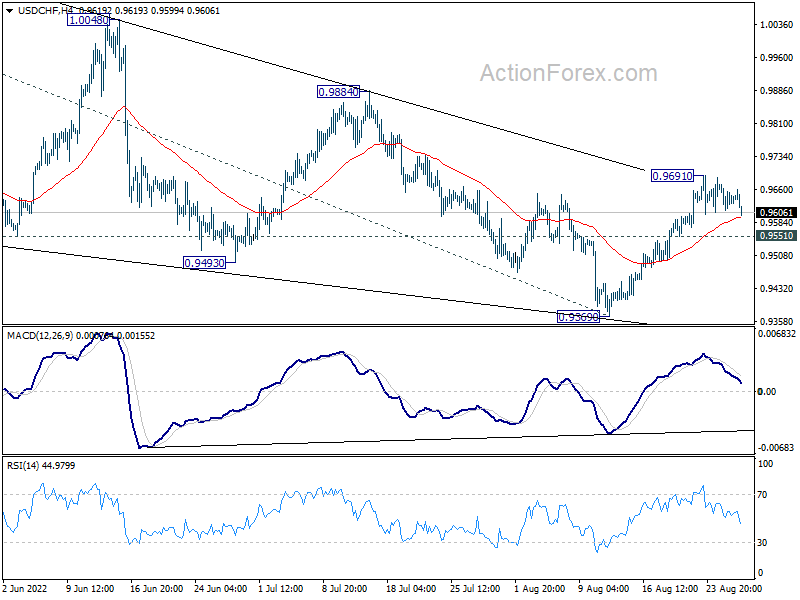
Daily Pivots: (S1) 0.9605; (P) 0.9641; (R1) 0.9670; More...
Intraday bias in USD/CHF remains neutral as consolidation from 0.9691 is still in progress. Outlook is unchanged that triangle correction from 1.0063 could have completed at 0.9369 already. Above 0.9691 will resume the rise from 0.9369 and target 0.9884 resistance next. Break there will argue that larger up trend is ready for resumption through 1.0063. On the downside, below 0.9551 minor support will dampen this view and turn bias back to the downside for 0.9369 support instead.
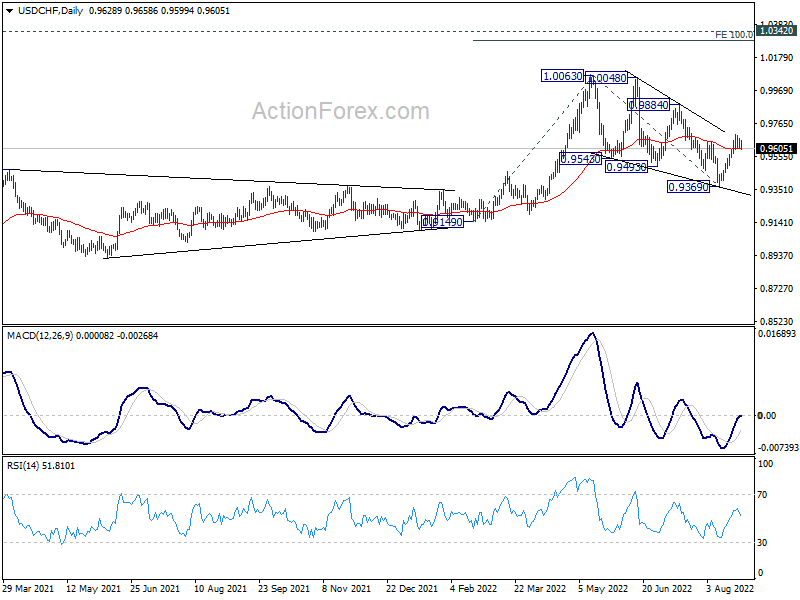
In the bigger picture, current development suggests that up trend from 0.8756 (2021 low) is still in progress. Sustained break of 1.0063 will target 100% projection of 0.9149 to 1.0063 from 0.9369 at 1.0283, and then 1.0342 (2016 high). For now, this will remain the favored case as long as 0.9369 support holds, even in case of deep pull back.
GBP/USD Mid-Day Outlook
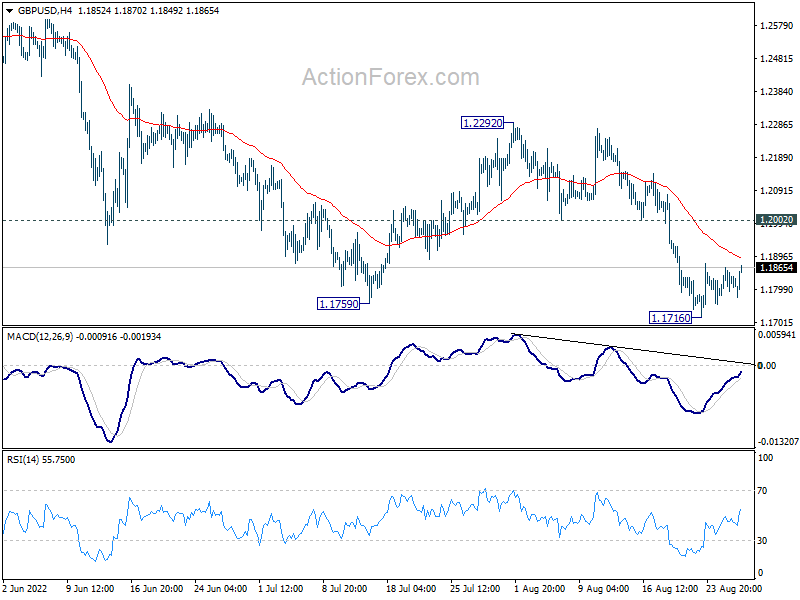
Daily Pivots: (S1) 1.1791; (P) 1.1828; (R1) 1.1871; More...
GBP/USD is still staying in consolidation from 1.1716 and intraday bias stays neutral. Upside of recovery should be limited by 1.2002 support turned resistance to bring another fall. Break of 1.1716 will resume larger down trend to 1.1409 long term support. However, firm break of 1.2002 will dampen this bearish view and bring stronger rise back to 1.2292 resistance.
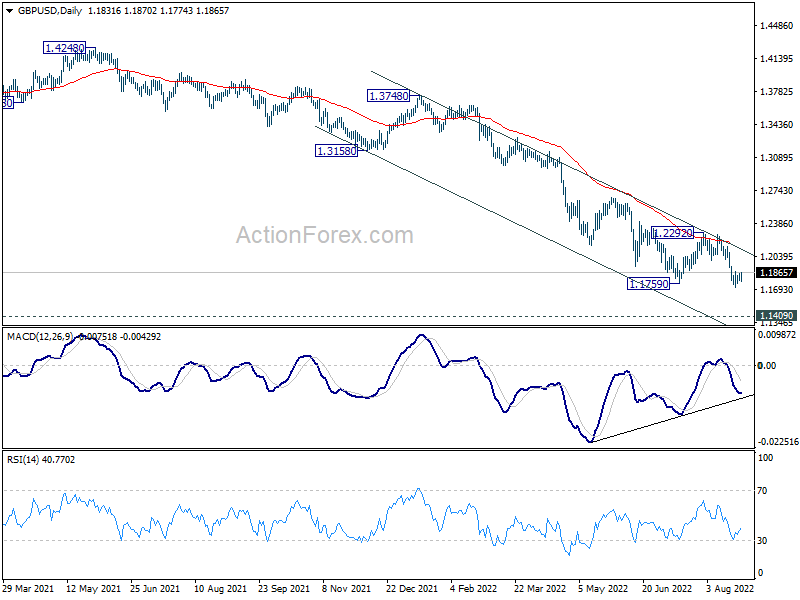
In the bigger picture, fall from 1.4248 (2018 high) could be a leg inside the pattern from 1.1409 (2020 low), or resuming the longer term down trend. Deeper decline is expected as long as 1.2292 resistance holds. Next target is 1.1409 low. However, firm break of 1.2292 will bring stronger rise back to 55 week EMA (now at 1.2859).
EUR/USD Mid-Day Outlook
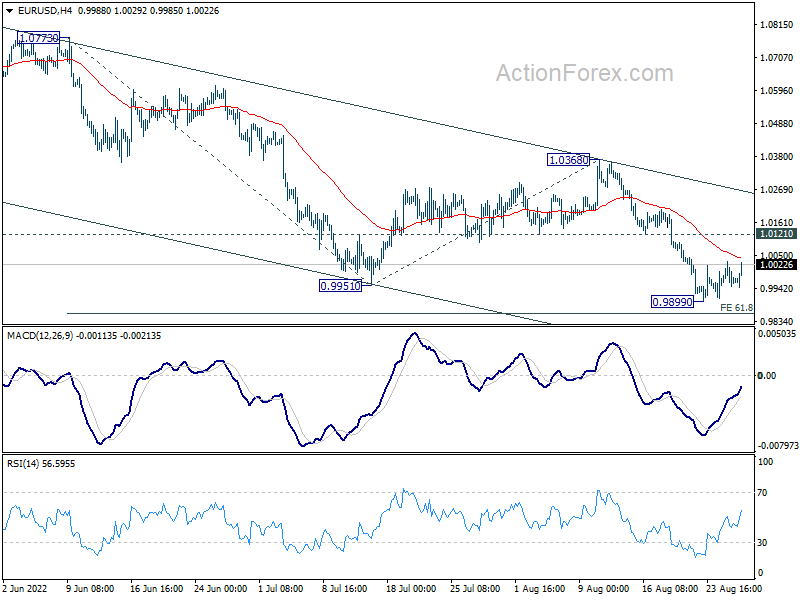
Daily Pivots: (S1) 0.9939; (P) 0.9986; (R1) 1.0024; More...
EUR/USD recovers mildly today but outlook is unchanged. Intraday bias remains neutral first. Consolidation from 0.9899 could extend, but upside of recovery should be limited by 1.0121 minor resistance to bring another fall. Break of 0.9899 will resume larger down trend to 61.8% projection of 1.0773 to 0.9951 from 1.0368 at 0.9860. Firm break there should prompt downside acceleration to 100% projection at 0.9546. However, firm break of 1.0121 will dampen this view and turn focus to 1.0368 resistance instead.
In the bigger picture, down trend from 1.6039 (2008 high) is still in progress. Next target is 100% projection of 1.3993 to 1.0339 from 1.2348 at 0.8694. In any case, outlook will stay bearish as long as 1.0368 resistance holds, in case of strong rebound.