

Sample Category Title
AUD/USD Weekly Outlook
AUD/USD recovered after edging lower to 0.6855 last week. But outlook is unchanged. Initial bias remains neutral this week first. Corrective rebound from 0.6680 could have completed with three waves up to 0.7135. Below 0.6855 will target a retest on 0.6680 low. However, break of 0.7135 will invalidate this view and resume the rebound from 0.6680 instead.
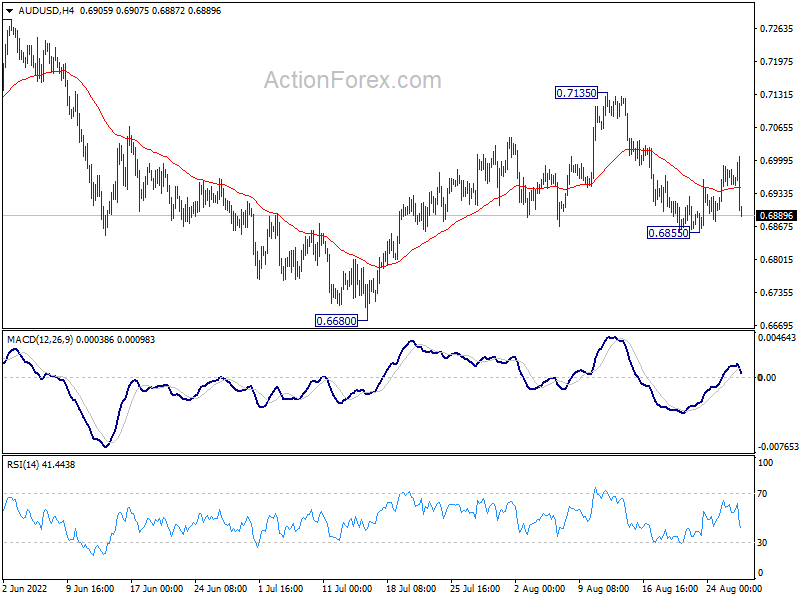
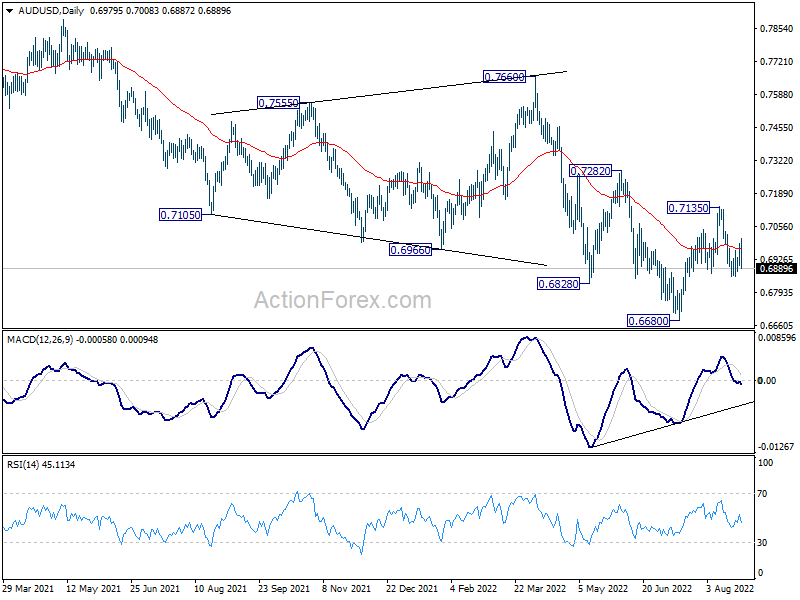
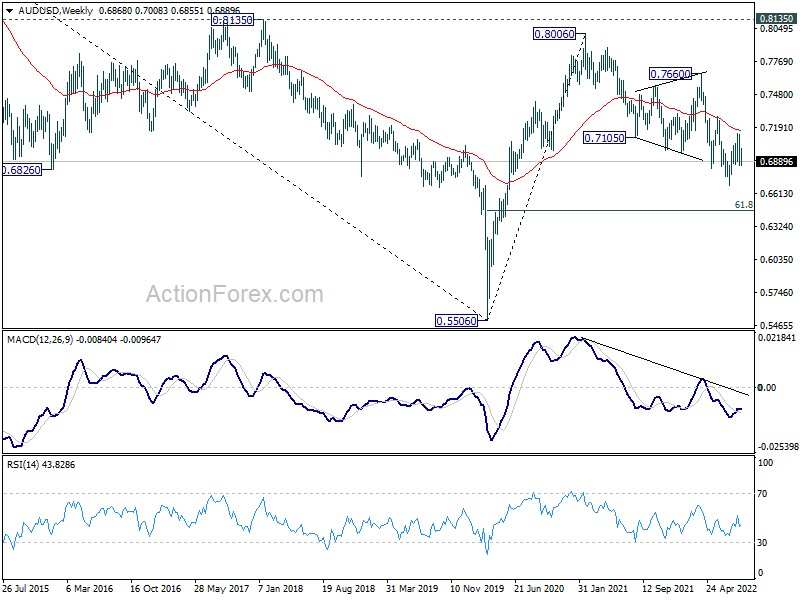
In the bigger picture, price actions from 0.8006 (2021 high) is seen more as a corrective pattern to rise from 0.5506 (2020 low). Or it could also be a bearish impulsive move. In either case, outlook will remain bearish as long as 0.7282 resistance holds. Next target is 61.8% retracement of 0.5506 to 0.8006 at 0.6461.
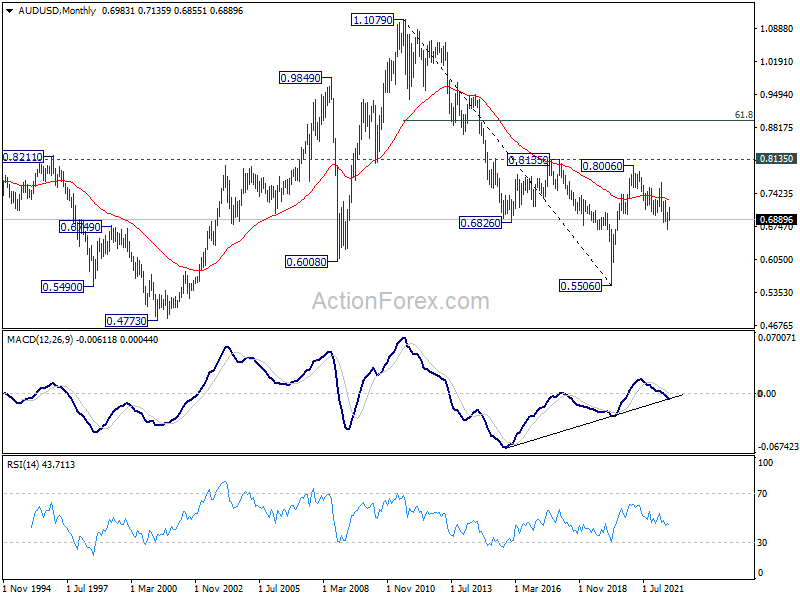
In the long term picture, rejection by 0.8135 resistance suggests that the long term down trend from 1.1079 (2011 high) is not ready to reverse. Yet, the structure of the fall from 0.8006 still argues that it's a corrective move. Hence, break of 0.5506 low is not envisaged for now. The long term outlook stays neutral first, and will be reassessed later after the fall from 0.8006 completes.
USD/CAD Weekly Outlook
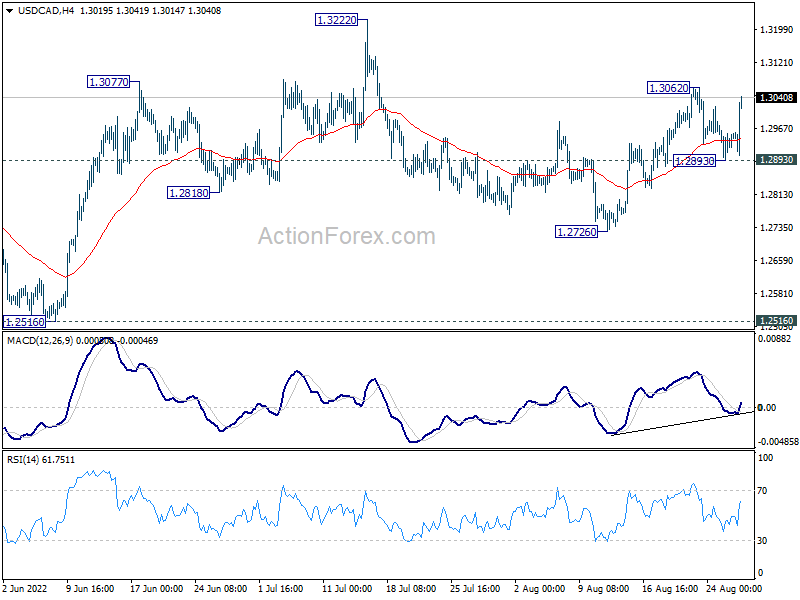
Some volatility was seen in USD/CAD last week but outlook is unchanged. Corrective decline from 1.3222 could have completed with three waves down to 1.2726. Initial bias remains neutral this week first and further rise is in favor. On the upside, break of 1.3062 will resume the rally from 1.2726 to retest 1.3222 high next. However, break of 1.2893 minor support will dampen this view and turn bias back to the downside for 1.2726 and possibly below.
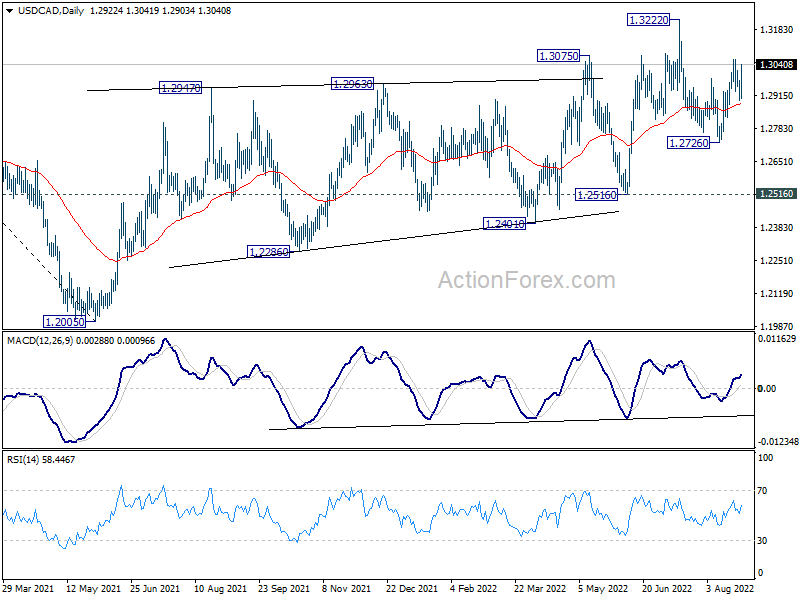
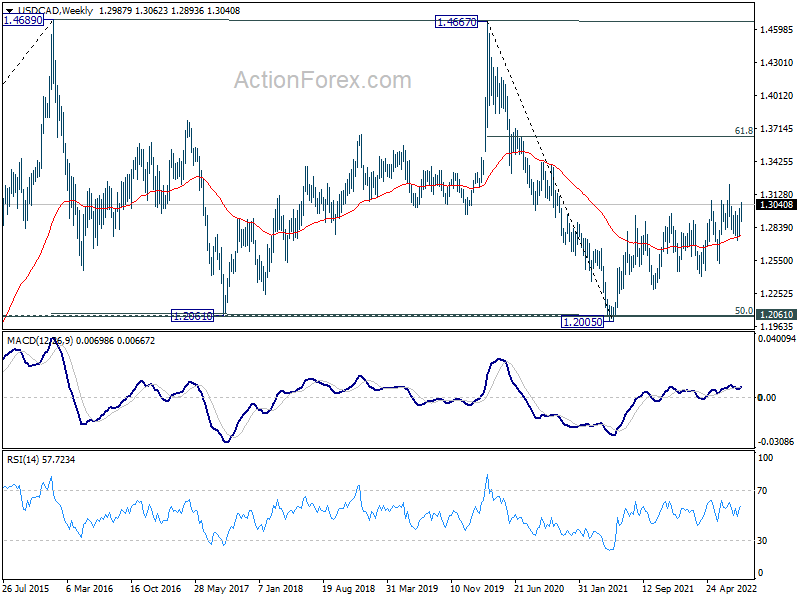
In the bigger picture, down trend from 1.4667 (2020 high) should have completed at 1.2005, after defending 1.2061 long term cluster support. Rise from there should target 61.8% retracement of 1.4667 to 1.2005 (2021 low) at 1.3650. This will remain the favored case now as long as 1.2516 support holds.
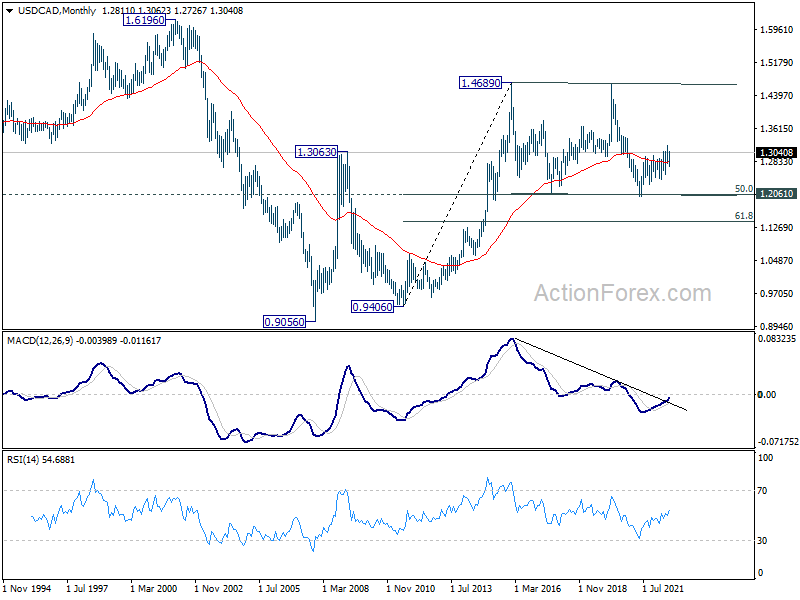
In the longer term picture, price actions from 1.4689 (2016 high) are seen as a consolidation pattern only. That is, up trend from 0.9506 (2007 low) is still expected to resume at a later stage. This will remain the favored case as long as 1.2061 support holds, which is close to 50% retracement of 0.9406 to 1.4689 at 1.2048.
GBP/JPY Weekly Outlook
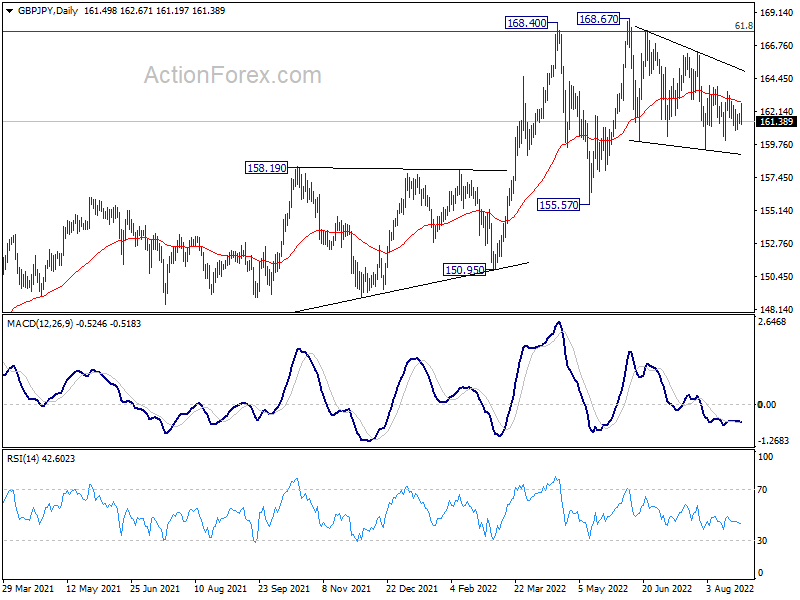
GBP/JPY stays in sideway trading last week and outlook is unchanged. Initial bias remains neutral this week first. Corrective pattern from 168.67 would extend for a while. On the upside, break of 163.91 will bring stronger rise to 166.31 resistance. On the downside, below 160.07 will turn bias to the downside for 159.42 and below.
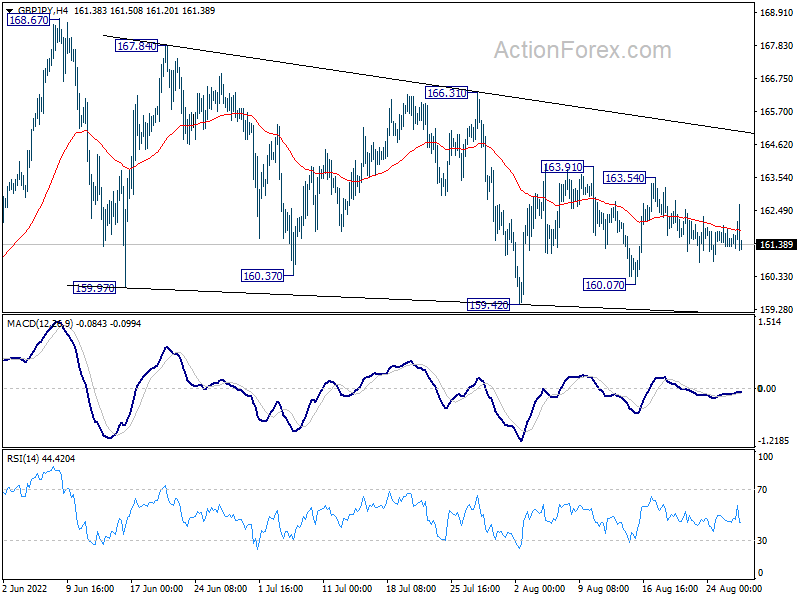
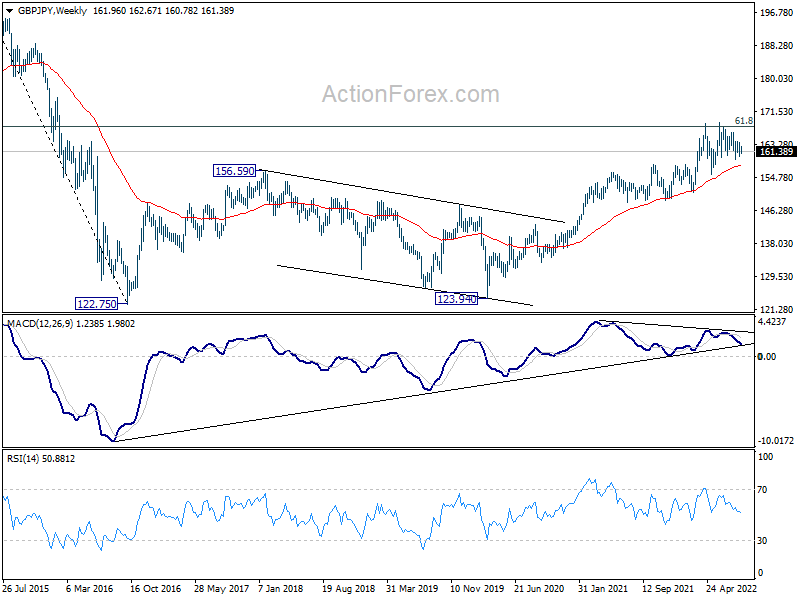
In the bigger picture, up trend from 123.94 (2020 low) is still in progress. Sustained break of 61.8% retracement of 195.86 (2015 high) to 122.75 (2016 low) at 167.93 will be a long term bullish signal, and could pave the way back to 195.86 high. This will remain the favored case as long as 155.57 support holds, even in case of deep pull back.
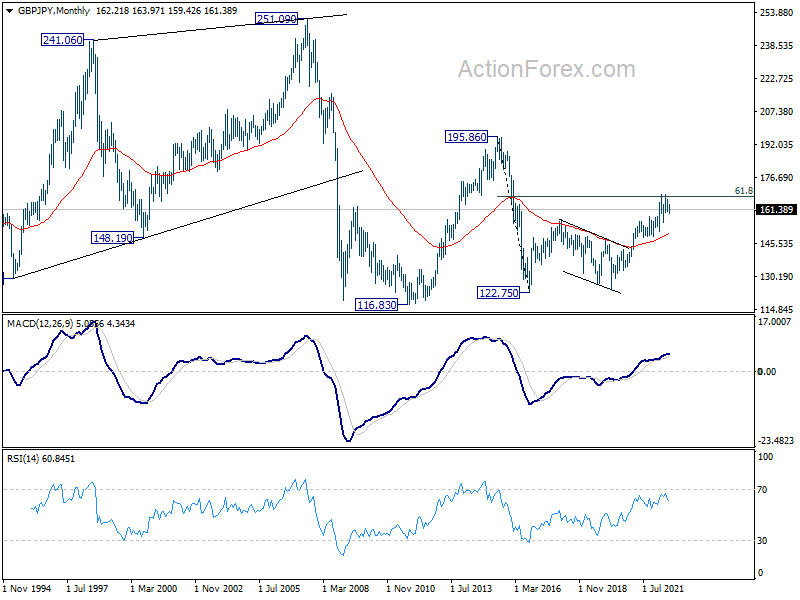
In the longer term picture, rise from 122.75 could be the third leg the the pattern from 116.83 (2011 low). Further rise will remain in favor as long as 55 month EMA (now at 149.84) holds. Sustained break of 61.8% retracement of 195.86 to 122.75 at 167.93. will pave the way to 195.86 (2015 high).
EUR/JPY Weekly Outlook
EUR/JPY stayed in range trading last week and outlook is unchanged. Initial bias remains neutral this week first. On the upside, break of 138.38 resistance will resume the rebound from 133.38 towards 142.31 resistance. On the downside, break of 134.93 will turn bias back to the downside for 133.38 support. Overall, corrective pattern from 144.26 could extend further with more choppy trading.
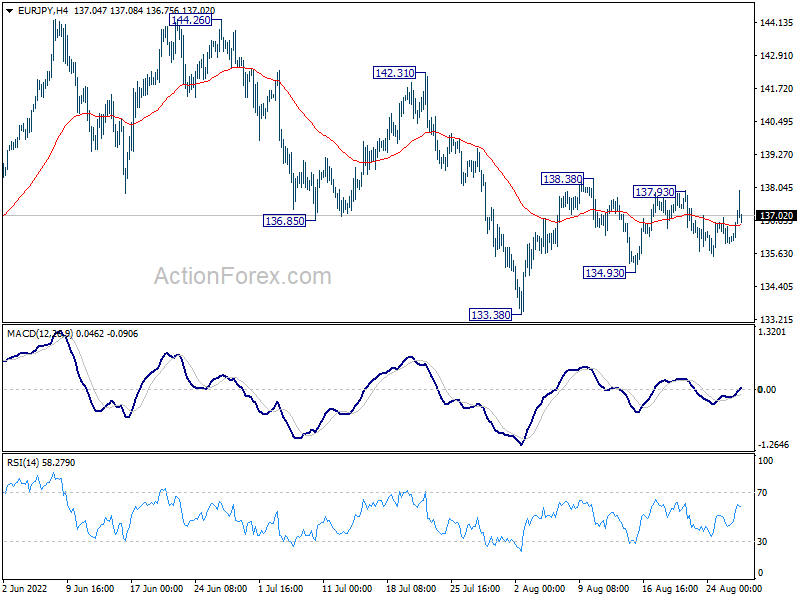
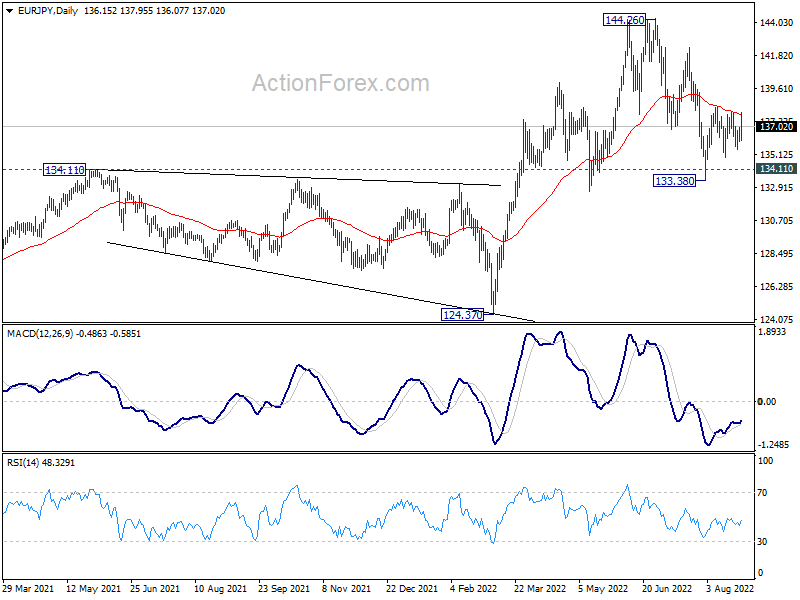
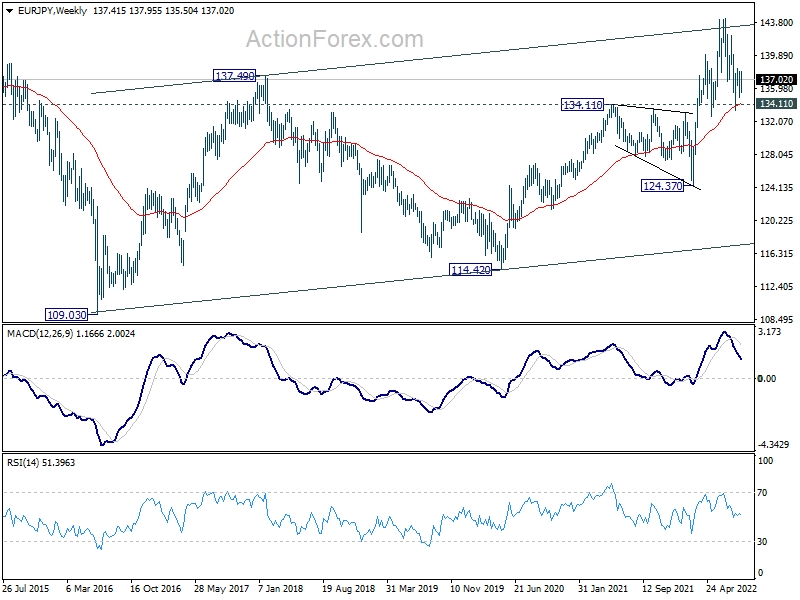
In the bigger picture, up trend from 114.42 (2020 low) is seen as the third leg of the pattern from 109.30 (2016 low). Further rally is in favor as long as 134.11 resistance turned support holds, even in case of deep pull back. Next target is 149.76 (2015 high). However, sustained break of 134.11 will be a sign of medium term bearish reversal and turn focus to 124.37 support for confirmation.
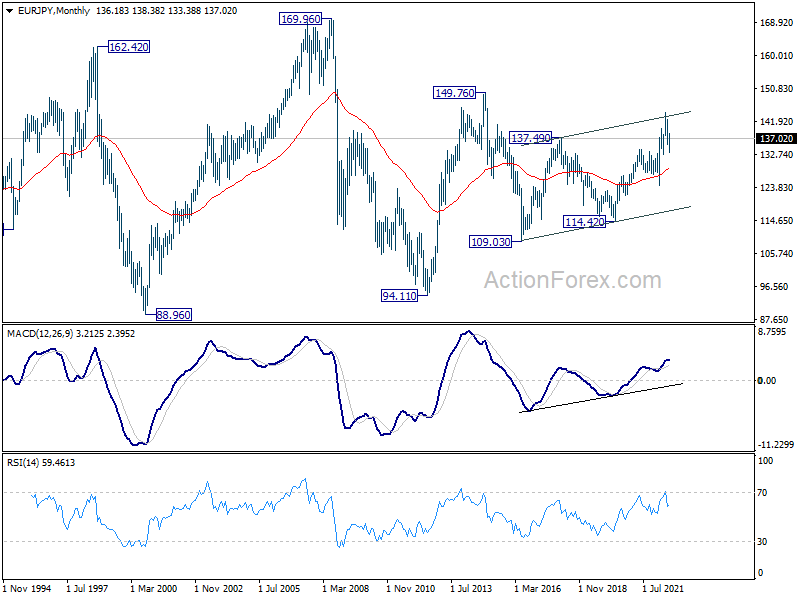
In the long term picture, up trend from 94.11 (2012 low) is seen as in the third leg. Further rally would be seen to 149.76 resistance (2014 high) and above. This will remain the favored case as long as 55 month EMA (now at 128.86) holds.
EUR/GBP Weekly Outlook
EUR/GBP stayed in range below 0.8510 last week and outlook is unchanged. Initial bias stays neutral this week first. On the downside, break of 0.8386 minor support will resume the choppy fall from 0.8720 through 0.8338. On the upside, above 0.8510 will resume the rebound to 0.8585 resistance next.
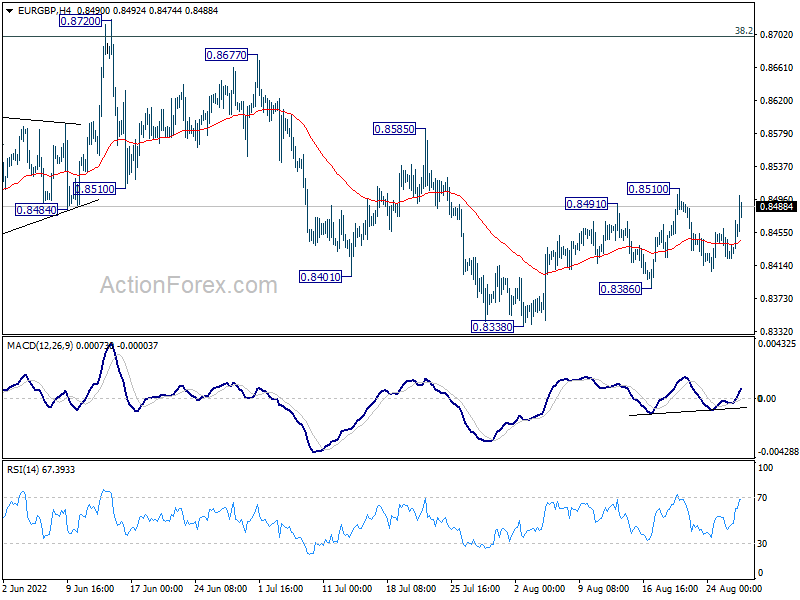
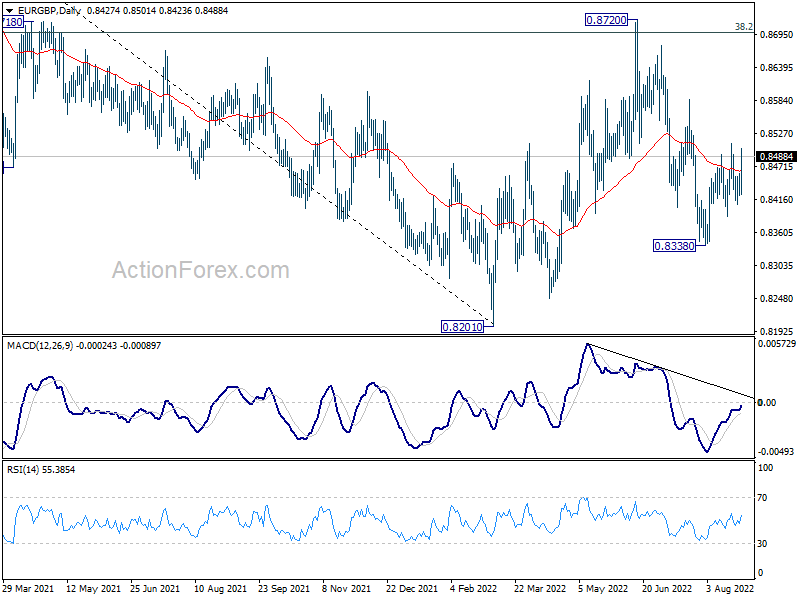
In the bigger picture, medium term bearishness is maintained with prior rejection by 38.2% retracement of 0.9499 to 0.8201 at 0.8697. Break of 0.8201 will resume larger down trend from 0.9499 (2020 high). Nevertheless, sustained break of 0.8697 will affirm the case that rise from 0.8201 is a medium term up trend itself.
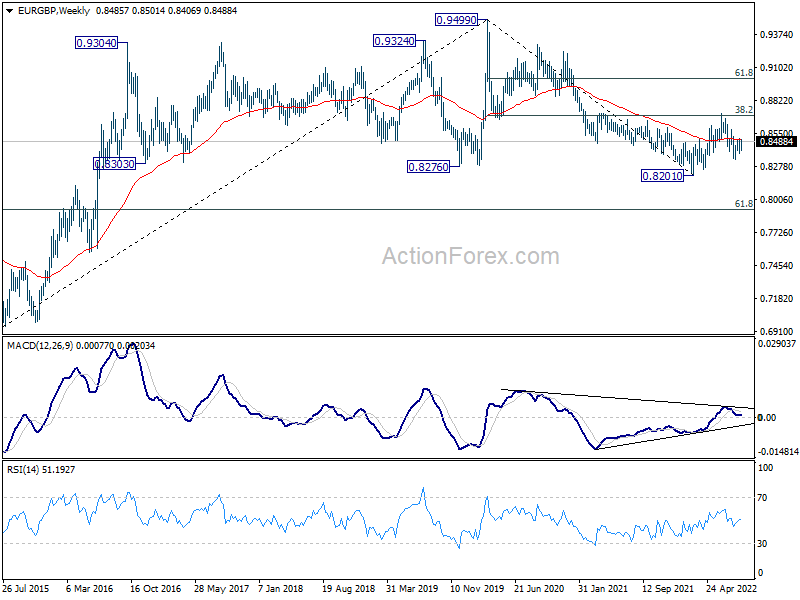
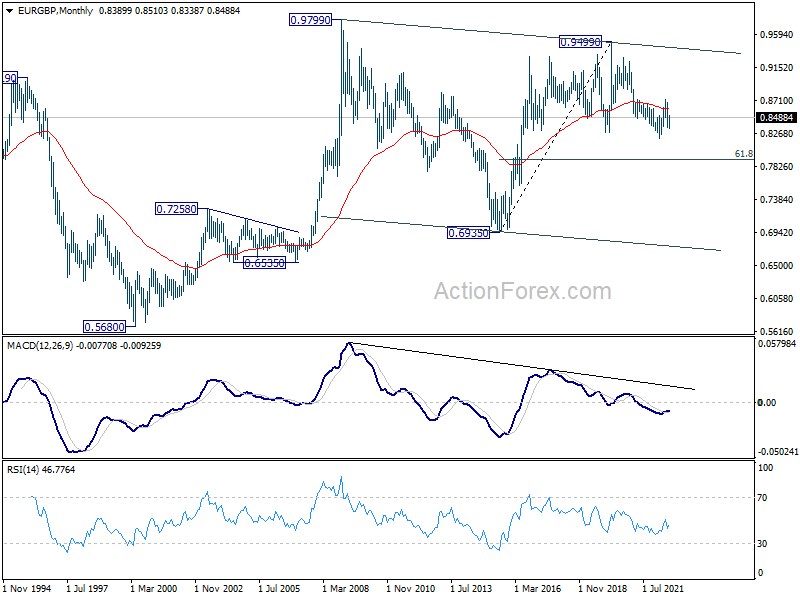
In the long term picture, the lack of medium term downside momentum suggests that fall from 0.9499 (2020 high) is merely a correction to rise from 0.6935 (2015 high). In case of another fall, downside should be contained by 61.8% retracement of 0.6935 to 0.9499 at 0.7917 to bring rebound. Sustained trading above 55 month EMA (now at 0.8597) will indicate that the correction has completed and bring retest of 0.9499.
EUR/AUD Weekly Outlook
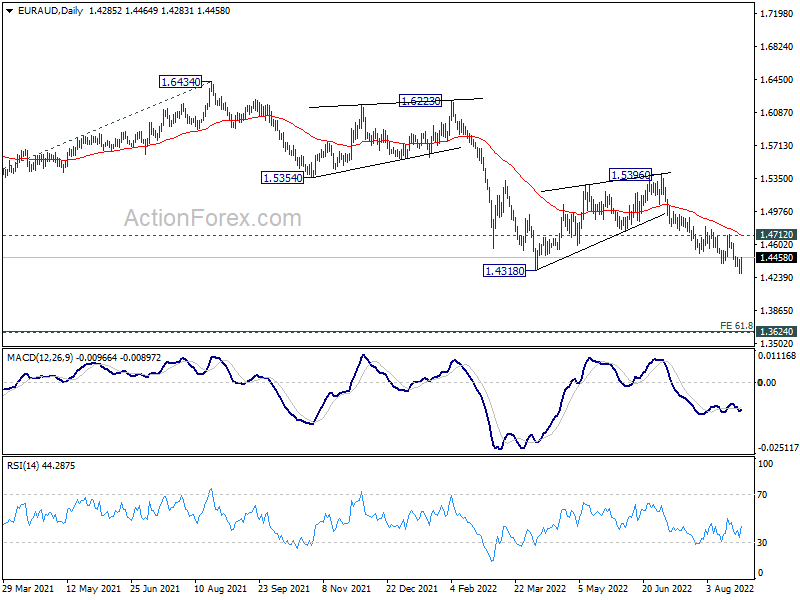
EUR/AUD dropped to 1.4281 last week, but failed to sustain below 1.4318 low and recovered. Initial bias is neutral this week first, and further decline is still expected. On the downside, firm break of 1.4318 low will resume larger down trend to medium term projection level at 1.3623. On the upside, break of 1.4712 resistance will delay the bearish case and turn bias to the upside for stronger rebound first.
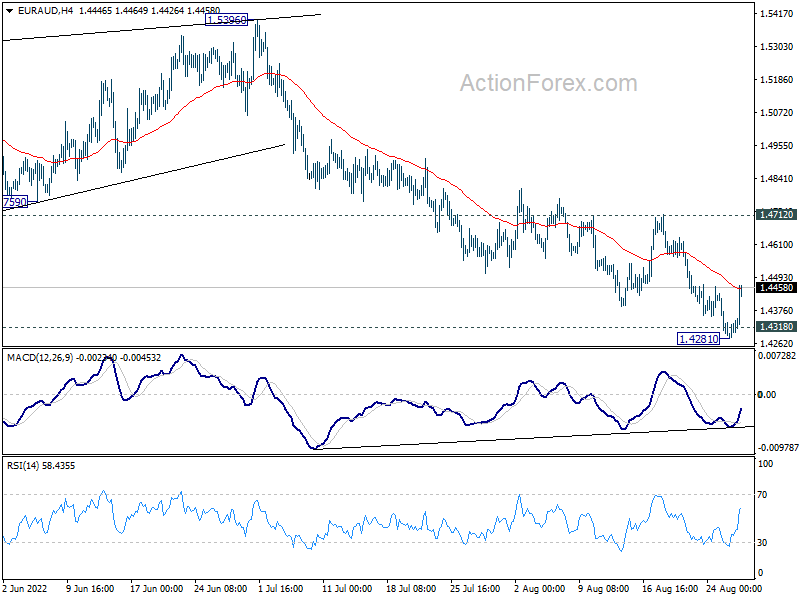
In the bigger picture, down trend from 1.9799 is still in progress. Break of 1.4318 low will target 61.8% projection of 1.9799 to 1.5250 from 1.6434 at 1.3623, which is close to 1.3624 long term support (2017 low). This will remain the favored case now as long as 1.5396 resistance holds.
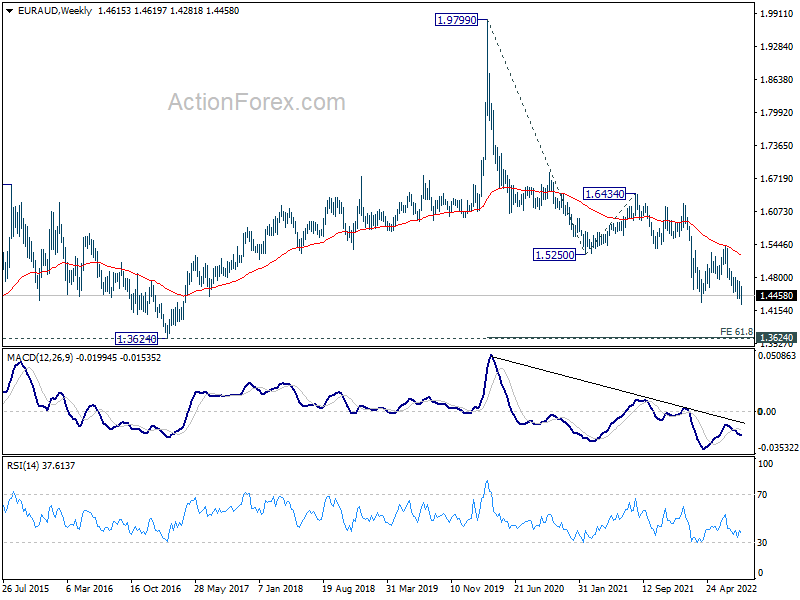
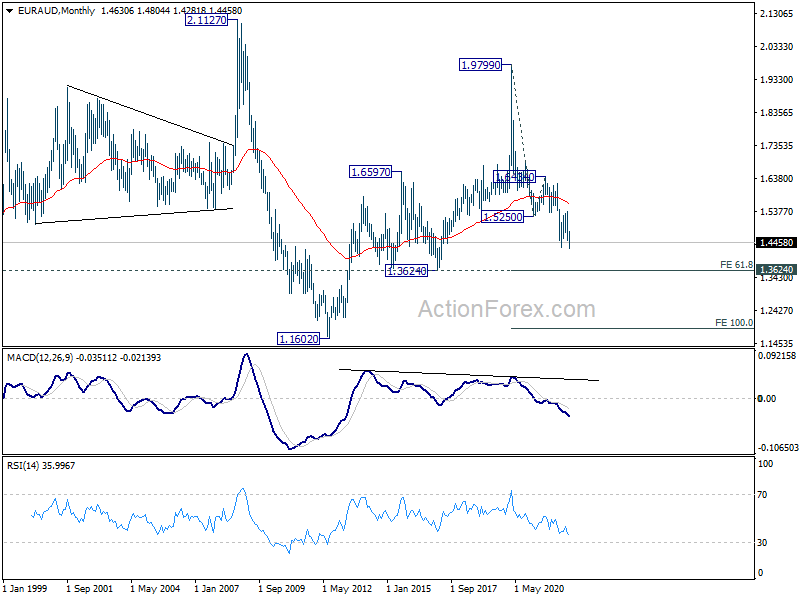
In the longer term picture, fall from 1.9799 (2020 high) is seen as the third leg of the pattern from 2.1127 (2008 high). Deeper fall should be seen to 1.3624 support. Decisive break there would pave the way back to 1.1602 (2012 low). This will remain the favored case as long as 55 month EMA (now at 1.5656) holds.
EUR/CHF Weekly Outlook
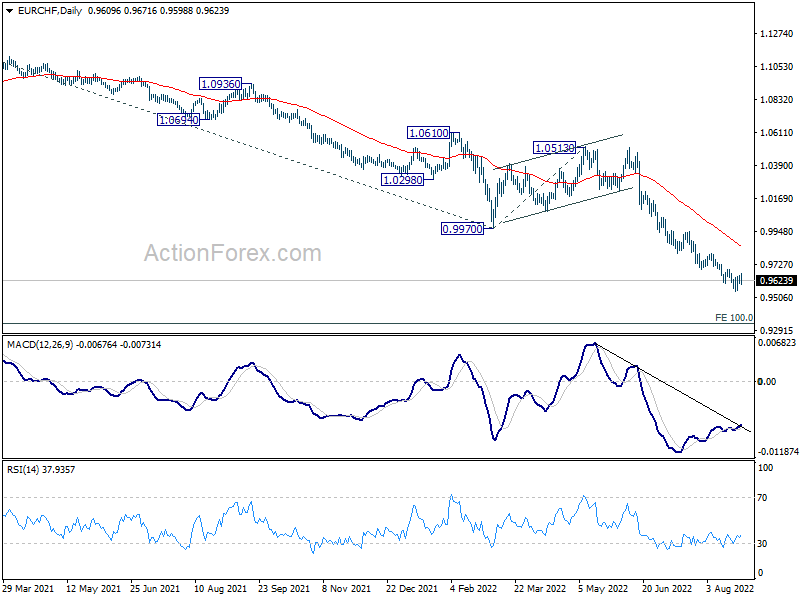
EUR/CHF edged lower to 0.9550 but recovered since then. Initial bias stays neutral this week first but further decline is expected as long as 0.9689 resistance holds. Break of 0.9550 will resume larger down trend to 100% projection of 1.1149 to 0.9970 from 1.0513 at 0.9334. On the upside, however, break of 0.9698 will confirm short term bottoming. Bias will be turned back to the upside for rebound, towards 55 day EMA (now at 0.9850).
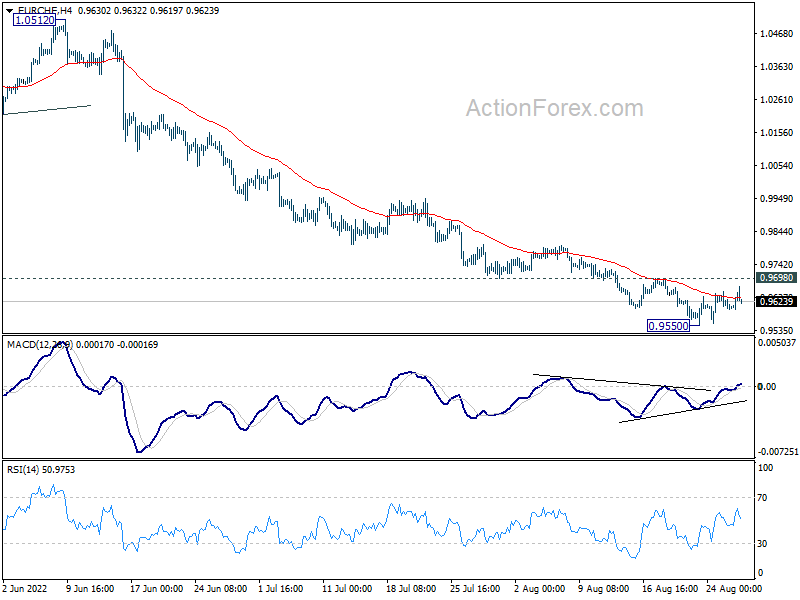
In the bigger picture, long term down trend from 1.2004 (2018 high) is still in progress. Next target is 138.2% projection of 1.2004 to 1.0505 to 1.1149 at 0.9033. On the upside, break of 0.9970 support turned resistance is needed to be the first sign of medium term bottoming. Otherwise, outlook will stay bearish in case of strong rebound.
In the long term picture, capped below 55 month EMA, EUR/CHF is seen as extending the multi-decade down trend. There is no prospect of a bullish reversal until firm break of 1.0505 support (2020 low).
Fed Powell Brought Risk Aversion Back, Dollar Ready for More Upside
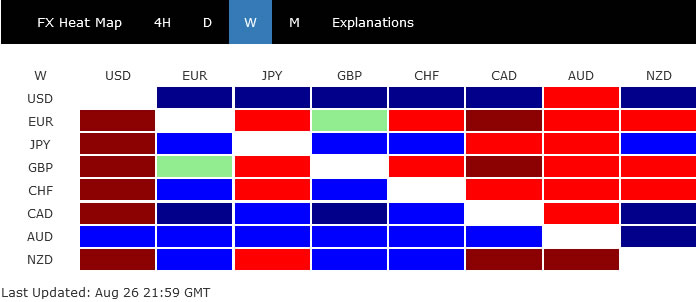
In terms of prompting market volatility, Fed Chair Jerome Powell didn't disappoint. Stocks suffered steep selloff after his Jackson Speech. While Australian Dollar was still at top of the chart, most of its earlier gains evaded on Friday, and looks set to weaken further in the near term. Dollar was the second strongest. But it has yet risen through the highs set earlier in the week. The greenback is staying bullish, but more fuel is needed for the rally.
Meanwhile, European majors were the clear losers for the week. Energy crunch, persistently high inflation, and recessions risks are clouding the outlook of Europe. Swiss Franc is having a slight upper hand over Euro and Sterling but recent declines in EUR/CHF and GBP/CHF look a bit exhausted. Yen ended mixed with countering forces of resilient treasury yields and risk off sentiment.
Investors reacted rather negatively to Fed Powell
Investors have clearly reacted very negatively to Fed Chair Jerome Powell's Jackson Hole speech. In short, Powell showed strong commitment to fight inflation, with willingness to tolerate pain in the economy, while hold interest rates high for a period of time until the job is done.
"Reducing inflation is likely to require a sustained period of below-trend growth. While higher interest rates, slower growth, and softer labor market conditions will bring down inflation, they will also bring some pain to households and businesses. These are the unfortunate costs of reducing inflation," he said, adding, "but a failure to restore price stability would mean far greater pain."
Additionally, Powell emphasized, "the historical record cautions strongly against prematurely loosening policy. We must keep at it until the job is done. History shows that the employment costs of bringing down inflation are likely to increase with delay."
There was not clear indication on whether he preferred a 50bps or 75bps hike at the September FOMC meeting. The decision would depend on the "totality" of data by that time.
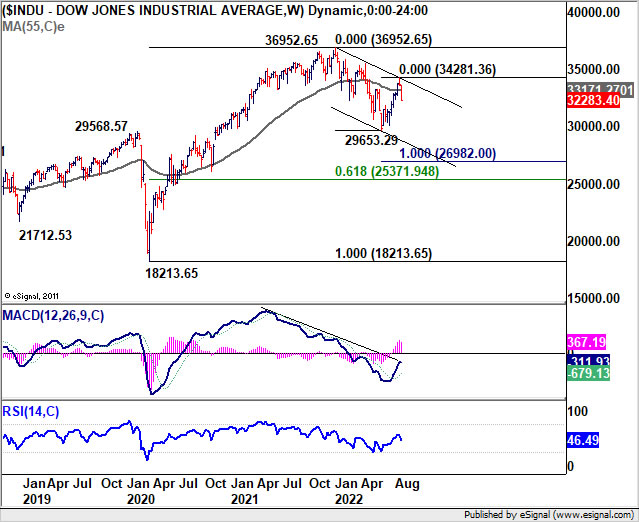
All three major US stock indexes tumbled sharply on Friday, with DOW down -3.03%, S&P 500 down -3.37%. NASDAQ down -3.94%. All closed below their 55 day EMAs.
Development in DOW now argues that rebound from 29653.29 has completed at 34281.36 already. Deeper fall is expected in the near term as long as 33364.70 resistance holds, towards 61.8% retracement of 29653.29 to 34281.36 at 31421.21.
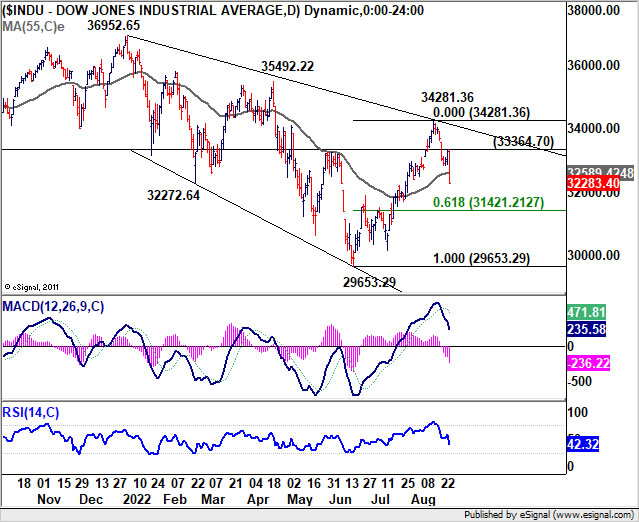
Reaction from 31421.21 would unveil the larger picture. That is, sustained break there will raise the chance of extending the correction from 36952.63 through 26953.29, towards 100% projection of 35952.65 to 29653.29 from 34281.36 at 26982.00.
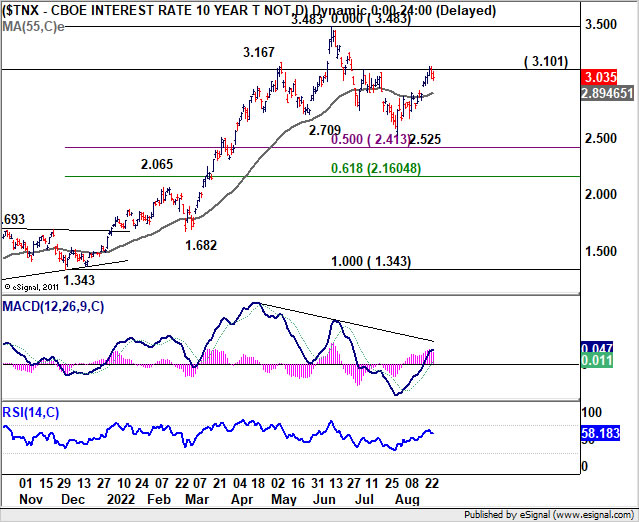
10-year yield capped by 3.1 by calm bond traders
Bond traders were relatively calm, on the other hand. 10-year yield breached 3.101 resistance last week but failed to sustain above there. Overall outlook is unchanged that corrective pattern from 3.483, which is now in the second leg, is going to extend for a while. In case of further rally, upside should be limited by 3.483 to bring the third leg.
On the downside, sustained trading below 55 day EMA (now at 2.894) will suggest that the third leg has started towards 2.525. But in this case, downside should be contained by 50% retracement of 1.343 to 3.483 at 2.413 to complete the correction.
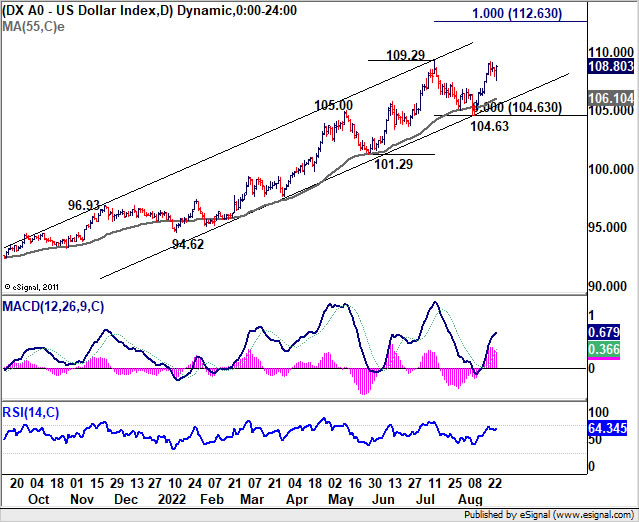
Dollar index supported by risk aversion, further up trend to follow
Dollar had some jittery on Friday but was eventually lifted by risk aversion. As long as Friday's low at 107.58 holds, further rally is in favor in Dollar index. Sustained break of 109.29 will resume larger up trend to 100% projection of 101.29 to 109.29 from 104.63 at 112.63. Such move, if happens, should mainly be driven by extended down trend in EUR/USD away from parity.
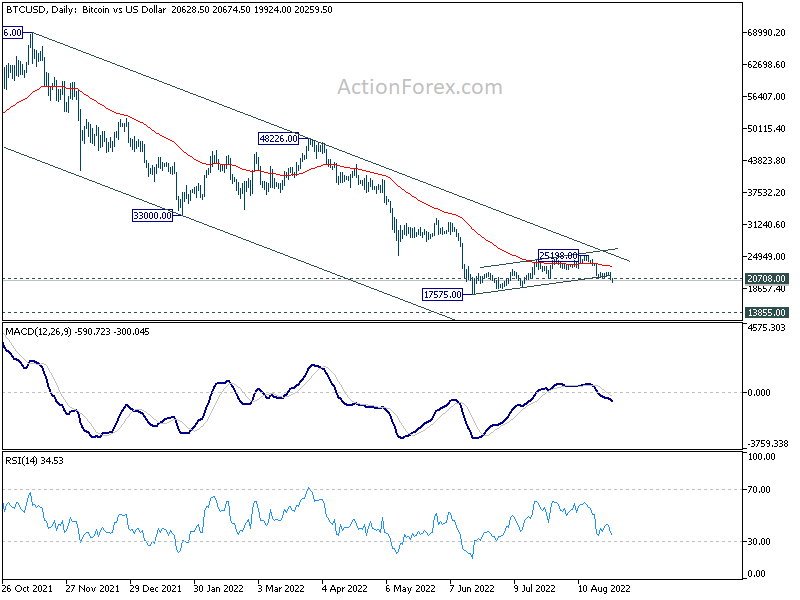
Bitcoin ready to resume down trend
Talking about risk aversion, Bitcoin's break of 20708. support should confirm that corrective recovery from 17575 has completed at 25198. BTC is also kept well inside medium term falling channel, and back staying below 55 day EMA. Retest of 17575 support should be seen soon . Firm break there will target 13855 (2019 high) next.
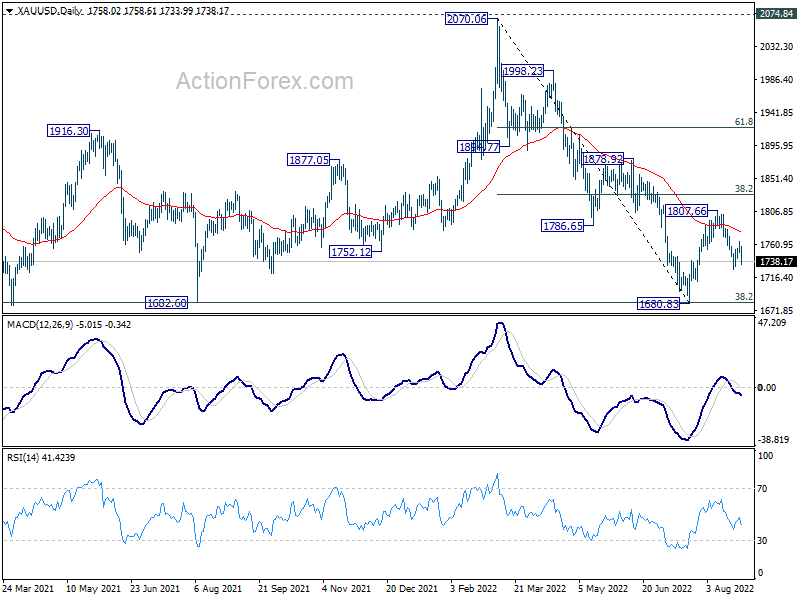
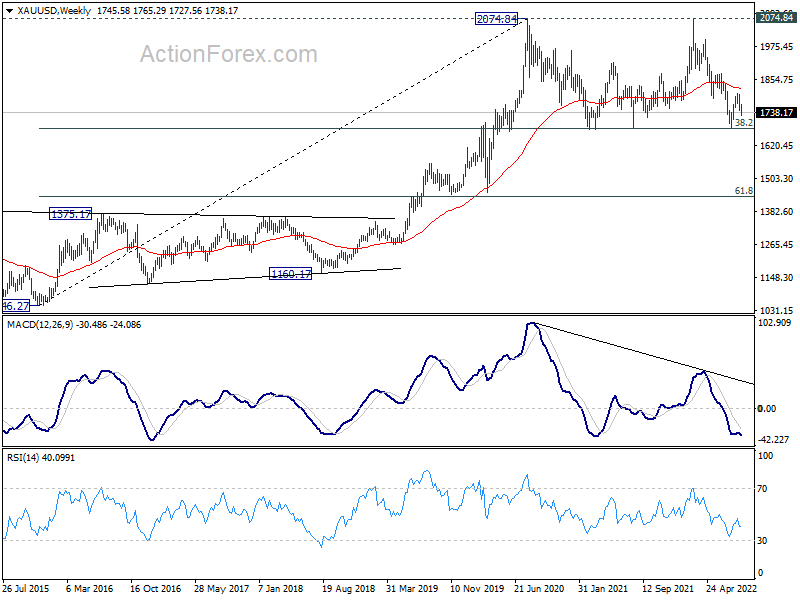
Gold might revisit 1680.83 key support as rebound finished
Gold's deeper than expected decline last week dampened the original bullish view that it has bottomed at 1680.83 already. The rejections by 55 day EMA, and below 55 week EMA are also bearish signals.
While a temporary low was formed at 1727.56, deeper decline will remain in favor as long as 1772.19 resistance holds. Break of 1727.56 will target important support level at 1680.83.
Firm break of 1680.83 cluster support will complete a medium term double top pattern (2074.84, 2070.06). That could prompt deeper selloff to 61.8% retracement of 1046.27 to 2074.84 at 1439.18. If that happens, it would likely be accompanied by some upside acceleration in Dollar. On the other hand, if Gold can hold above 1680, Dollar's upside moment should be relatively capped.
AUD/JPY rally cut short by risk reversal
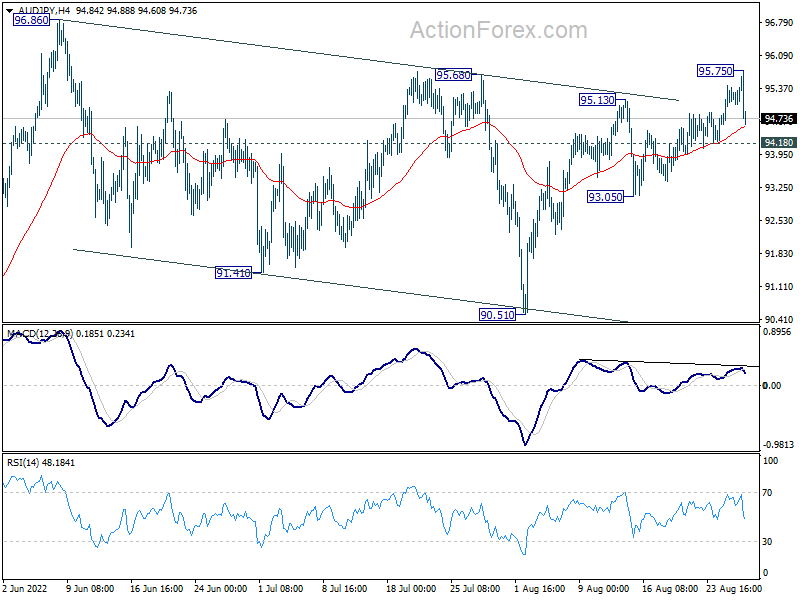
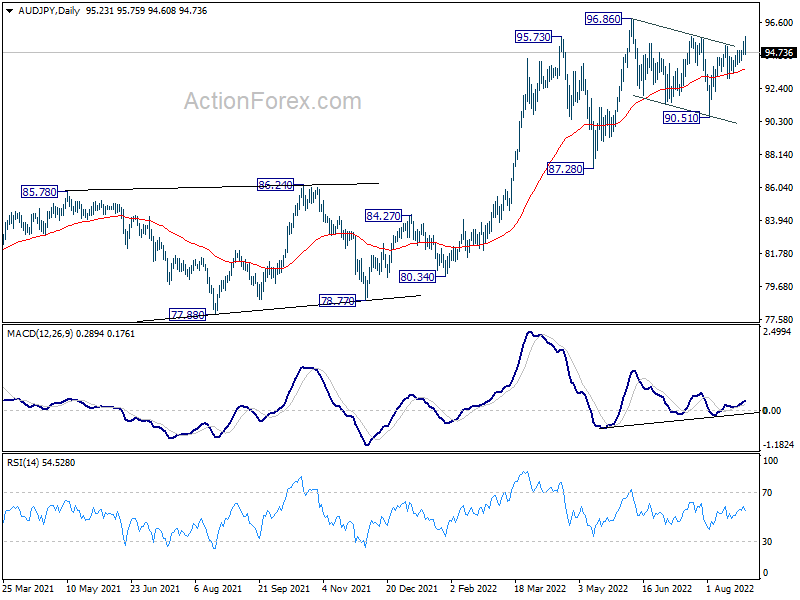
After climbing to 95.75, AUD/JPY was hammered by risk reversal towards the end of the week. Near term upside momentum started diminishing as seen in 4 hour MACD. The once promising rally now looks rather shaky.
Immediate focus is back on 94.18 support. Break there will argue that rebound form 90.51 has completed. Corrective pattern from 96.86 is going to extend with another falling leg through 93.05, towards 90.51 support. If happens, that would be a confirmation signal for broad based risk-off sentiment.
USD/CAD Weekly Outlook
Some volatility was seen in USD/CAD last week but outlook is unchanged. Corrective decline from 1.3222 could have completed with three waves down to 1.2726. Initial bias remains neutral this week first and further rise is in favor. On the upside, break of 1.3062 will resume the rally from 1.2726 to retest 1.3222 high next. However, break of 1.2893 minor support will dampen this view and turn bias back to the downside for 1.2726 and possibly below.
In the bigger picture, down trend from 1.4667 (2020 high) should have completed at 1.2005, after defending 1.2061 long term cluster support. Rise from there should target 61.8% retracement of 1.4667 to 1.2005 (2021 low) at 1.3650. This will remain the favored case now as long as 1.2516 support holds.
In the longer term picture, price actions from 1.4689 (2016 high) are seen as a consolidation pattern only. That is, up trend from 0.9506 (2007 low) is still expected to resume at a later stage. This will remain the favored case as long as 1.2061 support holds, which is close to 50% retracement of 0.9406 to 1.4689 at 1.2048.
Summary 8/29 – 9/2
Monday, Aug 29, 2022
[php_everywhere instance="1"]
Tuesday, Aug 30, 2022
[php_everywhere instance="2"]
Wednesday, Aug 31, 2022
[php_everywhere instance="3"]
Thursday, Sep 1, 2022
[php_everywhere instance="4"]
Friday, Sep 2, 2022
[php_everywhere instance="5"]
The Weekly Bottom Line: Powell Stands Firm on Higher Rates
U.S. Highlights
- Fed Chair Jay Powell’s hawkish remarks at the annual Jackson Hole conference did not sit well with equity markets.
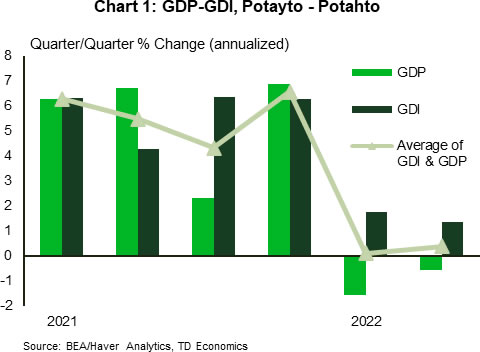
- The second estimate of Q2 GDP data showed that the economy contracted slightly less, and that GDP grew modestly. looking at an average of the two measures shows that the U.S. economy grew only slightly in the first half of the year.
Canadian Highlights
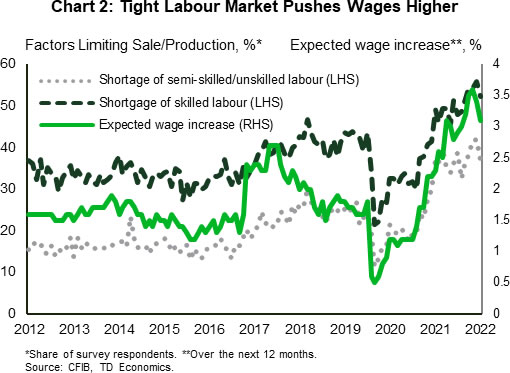
- Data from the SEPH report and the CFIB Business Barometer showed labour market remained tight in summer. Job openings remain at record level, and small business owners continue to report that labour shortages are weighing on sales.
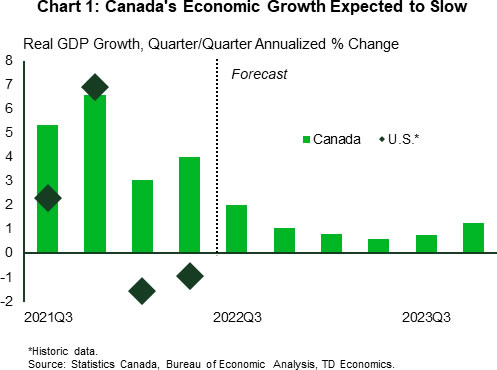
- Next week’s Q2 GDP report is expected to show that growth has picked up to 4.4% (annualized) from 3.1% in the prior quarter, but momentum is expected to slow noticeably in the second half of 2022.
Special - U.S. Students Get Up to $20,000 in Student Debt Erased
- President Biden announced details on a much-anticipated student debt forgiveness plan that will forgive up to $20,000 in federal student debt per borrower.
- A reduction in student debt will be stimulative for people receiving the relief, and could add more fire to current inflationary pressures, making the Fed’s job that much more difficult.
U.S. - Powell Stands Firm on Higher Rates
It was a full week for economic data, but the most anticipated event for markets was the Fed Chair’s speech at the annual Jackson Hole conference on Friday. Equity markets didn’t like what they heard. Powell’s hawkish remarks that the Fed remains committed to fight inflation and is likely to keep rates high for an extended period did not sit well with investors, and stocks fell on the remarks. The yield on the 2-Year Treasury was up slightly after the speech, continuing a recent trend as markets expect a bit more monetary tightening over the next two years.
Longer-term bond yields remain lower than the 2-Year as markets expect an economic slowing and future rate cuts by the Fed. It is understandable that investors are worried about a recession, when the second estimate for GDP growth in Q2, was revised up only slightly and still contracted by 0.6% annualized. This release was more highly anticipated than usual because it included another measure of national output – Gross Domestic Income (GDI). GDI measures output based on income in the economy – summing wages, profits, interest payments and investments. Whereas GDP is defined as the value of final goods and services on the production side. In theory they should be similar, but there usually is some deviation due to being measured from different data sources.
Some economists argue that GDI is the better measure – but it is released later by the BEA, and so usually gets less attention. Early estimates of GDI better captured the downturn in the 2007-09 recession. The compromise is that an average between the two measures likely captures momentum in the economy best. In the first half of 2022, GDP estimates suggested the economy contracted, while GDI showed the economy grew at 1.6% on average through Q1-Q2 (Chart 1). The average of the two measures shows the economy stalled in the first half of the year, so to some extent it feels like a potayto-potahto situation – either way you slice it, the U.S. economy is on a dramatically slower growth trajectory in 2022 in the face of high inflation, rising interest rates and less fiscal stimulus.
As for momentum in the second half of the year, consumer spending data for July showed that nominal spending continued to lose momentum. But, due to weaker inflation pressures, the real spending slowdown is somewhat less than we expected a few weeks ago. Real consumer spending is tracking around 1.5-2% annualized in the third quarter, which is roughly the same pace averaged over the first half of the year. This suggests the consumer is proving quite resilient to all the onslaughts against their purchasing power.
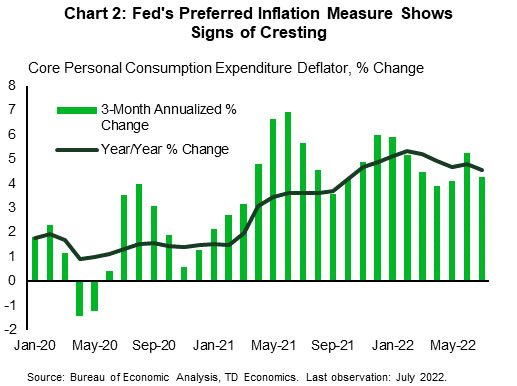
Inflation, as measured by the core PCE deflator, also cooled a bit in July. Looking at it on a year-on-year basis, core inflation has cooled to 4.6%, and ran at a 4.3% annualized pace over the past three months (Chart 2). We aren’t saying that inflation pressures have been vanquished, but it is encouraging they are moving in the right direction. Given the false dawn we had last year, where inflation pressures originally cooled, only to quickly heat up again, Chair Powell is right to point out that the Fed needs to see more convincing evidence before easing up on rate hikes.
Canada - Economic Resilience on Borrowed Time
As Canadians were taking their time off to enjoy the tail end of summer, so seeming did the economic data. The economic calendar was sparse this week ahead of next week's Q2 GDP report. The GDP report will be the final key piece of data for the Bank of Canada ahead of its interest rate decision on September 7th. The release is likely to be a ho-hum affair, given that the report is backward-looking and also expected to come in relatively in line with the BoC's expectations. In July's MPR the Bank penciled a 4% (annualized) growth for Q2, and so far, the preliminary monthly GDP releases point to a solid 4.5% expansion.
This year Canada's economy has been an outperformer relative to the U.S., with its economy contracting in the first half of the year. But Canada's economic resilience is on borrowed time as rising interest rates, reduced consumers' purchasing power and negative economic sentiment begin to weigh on growth. Next week's release is expected to show that underneath the robust Q2 headline print, cracks are already forming in the rate-sensitive sectors of the economy, such as residential investment and spending on durable goods. This sets the stage for significant deceleration in the second half of the year (Chart 1).
While the housing market has been cooling rapidly over the last several months, consumer spending has so far remained relatively resilient. However, there are signs that spending is slowing. Last week's retail sales report showed that consumers have been increasingly looking for deals online and have cut back on driving in both in May and June amid surging prices at the pump. The slowing housing market is also weighing on purchases of housing-related items. This week's data showed that spending on discretionary items, like dining out, which has seen a strong post-reopening rally, may now be slowing as well. Sales at restaurants and bars grew by just 0.8% in nominal terms in June – the smallest increase since January – and were essentially flat after adjusting for inflation.
Though gas prices have been trending lower, which is easing the pressure on headline inflation, core inflation remains too hot for the BoC's comfort. This is unlikely to ease much in the coming months as the tight labour market is adding pressure on wages. This week's SEPH/payrolls data showed job openings remained at a record level in June. At over 1 million, this translates into one opening for every unemployed Canadian. The CFIB small business optimism survey also echoed this, with businesses still reporting significant labour shortages (although less than in prior months) (Chart 2). Given this strong starting point, we'd reiterate Governor Macklem's recent comments where he emphasized that the BoC's "job is not done yet" as "it will take some time before inflation is back to normal."
U.S. Students Get Up to $20,000 in Student Debt Erased
President Biden announced a much-anticipated executive action to reduce the burden of federal student debt. At the time of writing, the White House hasn't provided cost estimates, or all the details, but according to the Committee for a Responsible Federal Budget, the plan will cost roughly $500 billion dollars over the next 10 years.
Under the plan, $10,000 in federal student loan debt will be forgiven for borrowers making under $125,000 (or $250,000 for couples). Approximately 40 million borrowers would be eligible for this amount. In addition, up to $20,000 will be forgiven for the 27 million recipients of Pell Grants – a specific program for students in financial need. It's estimated that more than a third of the total $1.6 trillion in student debt will be forgiven.
The plan also modifies existing income-driven repayments by reducing future monthly payments for lower-and middle-income borrowers. Payments will be reduced from 10% to 5% percent of discretionary income, and forgives loan balances of $12,000 or less after 10 years.
Furthermore, borrowers who are employed by non-profits, the military, or government may be eligible to have all their student loans forgiven through the Public Service Loan Forgiveness program. The pandemic moratorium on federal student loan payments will also be extended through December 31st, saving roughly $20 billion in debt payments.
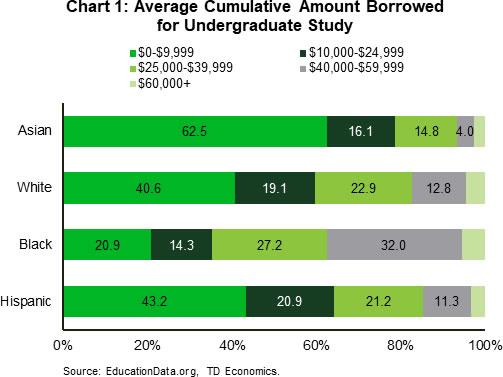
The announcement puts an end to a debate that has been around since at least the Occupy Wall Street protests a decade ago. The proponents of forgiveness argue it would stop the racial wealth gap from growing and help borrowers turn regular earnings into longer-lasting wealth. Indeed, African American college graduates hold disproportionally large student debt balances in comparison to peers (Chart 1). Those against forgiveness point out that student debt is disproportionately held by more affluent families, and that it will stimulate economic activity at the time when inflation is already running hot.
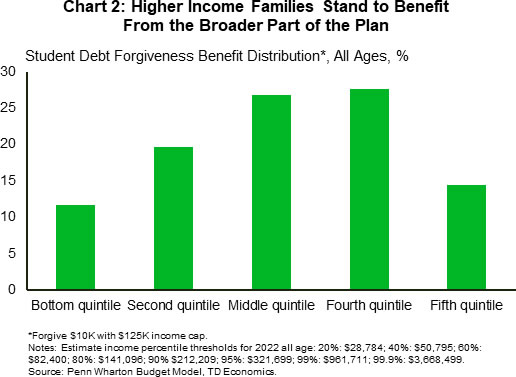
The debate is hot but ultimately the additional forgiveness of $20,000 for Pell grant recipients and modifications to income-driven repayment programs makes the plan more targeted towards lower-income Americans, helping the administration achieve progressive goals. According to White House's estimates, 87% of the relief will go to lower-income families earning less than $75,000. However, some portion of higher income families stand to benefit, given that the income threshold set at $125,000 is well above the median American income (Chart 2).
In terms of the economic impact, a reduction in student debt will be mildly stimulative, though the average borrower can expect to have their annual payment reduced by $1,000. While there’s still uncertainty over both the timing and implementation of the program, preliminary estimates suggest that the impact to economic growth will be relatively small compared to its cost – with only a tenth of the dollar amount forgiven expected to flow back into the economy. Still, more economic stimulus at time when inflation is already running at multidecade highs will make the Fed’s job that much harder to regain price stability over the coming years.