

Sample Category Title
USD/CHF Daily Outlook
Daily Pivots: (S1) 0.9602; (P) 0.9636; (R1) 0.9694; More...
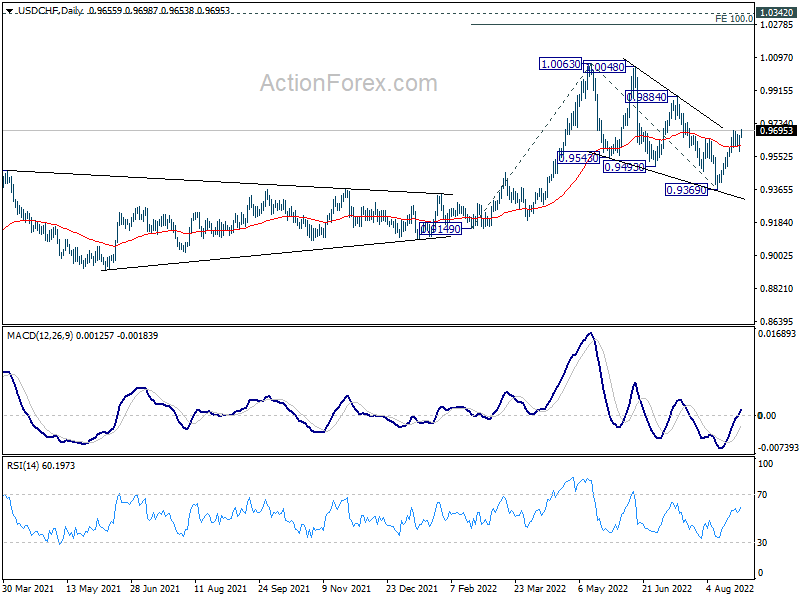
USD/CHF's rise from 0.9369 resumed after brief retreat and intraday bias is back on the upside. Outlook is unchanged that triangle correction from 1.0063 could have completed at 0.9369 already. Further rise should be seen to 0.9884 resistance next. Break there will argue that larger up trend is ready for resumption through 1.0063. On the downside, below 0.9576 minor support will dampen this view and turn bias back to the downside for 0.9369 support instead.
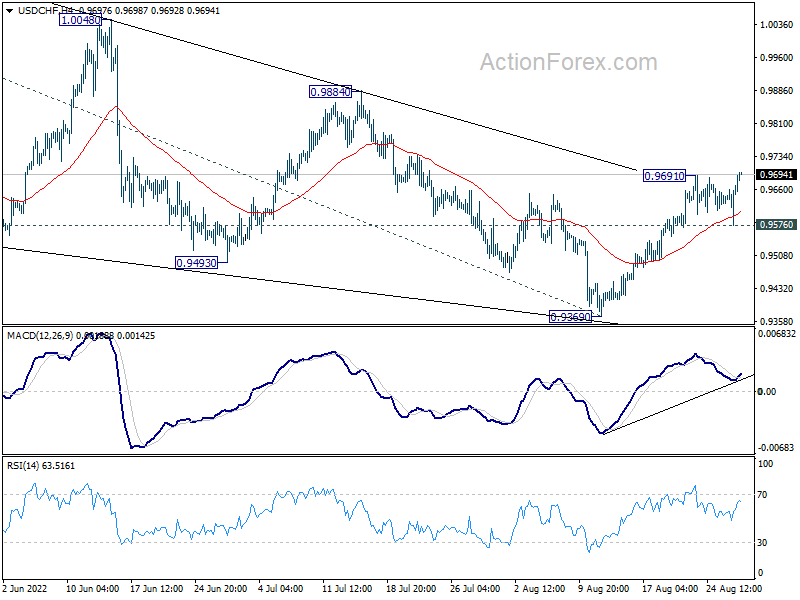
In the bigger picture, current development suggests that up trend from 0.8756 (2021 low) is still in progress. Sustained break of 1.0063 will target 100% projection of 0.9149 to 1.0063 from 0.9369 at 1.0283, and then 1.0342 (2016 high). For now, this will remain the favored case as long as 0.9369 support holds, even in case of deep pull back.
Forex and Cryptocurrency Forecast
EUR/USD: The Global Economy Is in Danger Again
So, EUR/USD broke through the key support level formed in 2016. It fixed a low at 0.9899 on Tuesday, August 23, the low the pair traded 20 years ago, in November-December 2002. The euro lost about 485 points to the dollar lover the past year alone.
Although not officially recognized, in fact the US economy has already plunged into recession, GDP continues to fall, although this movement has slowed down a bit: -0.9% in Q1 2022 and -0.6% in Q2. Quantitative tightening (QT) by the Fed and macroeconomic factors increase the chances of strengthening this process. Thus, JP Morgan CEO Jamie Dimon has warned that the country's economy could expect "something worse than a recession", and the probability of this event occurring is 20-30%.
The situation in the Eurozone is even worse, and macroeconomic conditions still do not bode well. According to forecasts, due to the energy crisis caused by anti-Russian sanctions, Europe, and especially Germany, will face a very difficult winter.
"The world economy is in danger again," said World Bank President David Malpass. "It is facing high inflation and slow growth at the same time. Even if a global recession is averted, the pain of stagflation could linger for several years." This situation fuels the demand for safe-haven assets, and the US currency is traditionally one of them. The dollar index (DXY) is holding positions near multi-year highs around 108 points and, according to experts, may rise to 110 points.
The key event of the past week was the annual economic symposium in Jackson Hole on August 25-27, which brought together almost the entire US financial elite. The key event at the symposium was to be the speech of Fed Chairman Jerome Powell, from whom market participants hoped to receive signals regarding the regulator's future plans. But he did not say anything new and significant, Powell's statements were a little more "hawkish" than before, but generally coincided with market expectations. Perhaps the head of the US Central Bank did not want to shock the markets in any of the directions. He did not name a specific figure by which the FOMC (Federal Open Market Committee) can raise the interest rate on September 21. Moreover, this decision may still be influenced by the forthcoming September reports on the labor market and consumer price dynamics.
The likelihood of a 50 basis point (bp) or 75 bp rate hike in September is about the same. Recall that the rate is at the level of 2.5% at the moment and the next increase will send it to the maximum level since 2008. And there is no doubt that it will happen, even though the CPI showed signs of slowing in July, falling to 8.5%, and inflation, as measured by the Core Price Index for Personal Consumption Expenditures (PCE), fell from 0.6% to 0.1% in a month.
At the same time, the ECB may also raise borrowing costs by 50 bp at its meeting on September 8. The minutes of the last, July, meeting of the regulator showed that a very large number of members of the Board of Governors agreed on the advisability of raising the key rate from 0.5% to 1.0%. Moreover, according to Reuters, some ECB leaders, due to the deterioration of the inflation forecast, want to discuss the issue of raising the rate immediately by 0.75%. However, the decrease in the difference between the rates of the Fed and the ECB, although it may slightly support the euro, will not change the situation fundamentally, since the difference between the rates will still remain in favor of the dollar. As a result, the US currency will continue to strengthen, and, according to Wells Fargo analysts, it may peak in Q4 2022. Economists from Nordea expect that EUR/USD may fall to 0.9700 by the end of the year, a number of experts call 0.9600 as well.
Jerome Powell's speech took place on the evening of Friday, August 26, in the middle of the US trading session, when the Asian and European currency markets had already closed. Therefore, the final reaction to the words of the head of the Fed will become clear only on Monday, August 29. As for the last week, although its performance caused some volatility, the pair placed the last chord within the weekly range, slightly below its center at 0.9966.
60% of experts support the fact that it will continue to move south in the near future, while the remaining 40% indicate the opposite direction to it. The readings of the indicators on D1 give much more definite signals. 100% side with the bears both among trend indicators and among oscillators. However, a quarter gives signals of it being oversold among the latter. The nearest bearish targets for EUR/USD are the July 14 low at 0.9950 and August 23 low at 0.9899. Note that the 0.9900-0.9930 area is also a strong 2002 support/resistance zone. For the bulls, the first priority is to rise above the 1.0000 parity level, after which it will be necessary to overcome the resistance of 1.0030, then 1.0090-1.0100, followed by the levels and zones of 1.0120, 1.0150-1.0180, 1.0200 and 1.0250-1.0270.
Statistics on the US consumer market will be released on Tuesday, August 30. We will have a whole series of data from the US labor market on the same day, as well as on Wednesday, August 31, Thursday, September 01 and Friday, September 02, including such important indicators as the unemployment rate and the number of new jobs created outside the agricultural sector (NFP). As for the European economy, data on unemployment in Germany and the consumer market of the Eurozone (CPI) will be received on Wednesday, August 31, and the value of the Business Activity Index in the manufacturing sector (PMI) and retail sales in Germany will become known on September 01.
GBP/USD: Very "Terrible Long-Term Outlook"
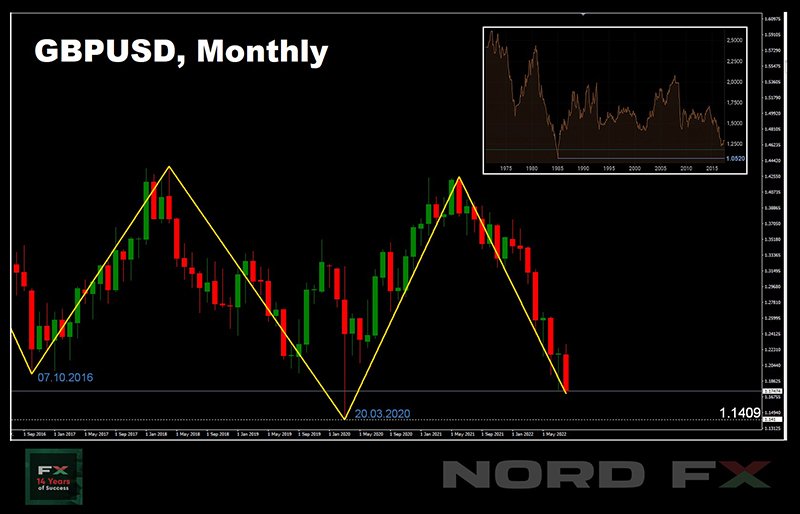
We titled the review for GBP/USD "Gloomy Forecasts for the Pound Continue to Come True" a week ago. But it turns out that the situation does not just look gloomy but inspires real horror for some experts. "The long-term chart of the pair," economists at Citi Bank believe, "is looking really terrible right now. It can be viewed as a large double top forming as a continuation pattern, which promises a price drawdown to parity and possibly below it. […] There is no significant support now (beyond the March 2020 peak low just above 1.14) until the major lows set in 1985 at 1.0520. […] This month's close below 1.1760, if any, would be a bearish external month."
GBP/USD closed last week at 1.1736. The pound continues to be pressured by the resignation of Prime Minister Boris Johnson, accompanied by a sex scandal, and rising inflation. British energy regulator Ofgem has announced that average annual household electricity bills will rise by 80% from October and that the new Prime minister will need to take urgent action to deal with such skyrocketing prices.
The median forecast for the coming week looks fairly neutral. 45% of analysts side with the bulls, and 55% support the bearish scenario. The indicator readings on D1 look exactly the same as those of the EUR/USD pair: all 100% are colored red, while 25% of the oscillators signal that the pair is oversold. Immediate support is the August 23 low at 1.1716, followed by 1.1650, 1.1535 and the March 2020 lows in the zone 1.1400-1.1450. As for the bulls, they will meet resistance in the zones and at the levels of 1.1755, 1.1800, 1.1865-1.1900, 1.2000, 1.2050-1.2075, 1.2160-1.2200, 1.2275-1.2325 and 1.2400-1.2430.
With regard to the economic statistics of the United Kingdom, traders should take into account that there is a bank holiday in the country on Monday, August 29. Among the important events, we can note Thursday, September 01, when the August value of the UK Manufacturing PMI will be known.
USD/JPY: BOJ Policy Will Remain the Same
The USD/JPY pair has been moving in the sideways corridor 135.80-137.70 throughout the week. And if we talk about the results of the five-day period, the bulls won with a slight advantage: having started the week at 136.81, the pair ended it at 137.45. So, the neutral forecast was fully justified. Recall that the majority of experts voted for the movement of the pair to the east last time.
The latest survey of economists conducted by Bloomberg showed that inflation, which reached 3%, is unlikely to force the head of the Bank of Japan (BOJ) Haruhiko Kuroda to tighten monetary policy. While 3% is the highest level since 1991 (excluding years of tax hikes), it is still well below the 8.5% inflation rate in the US. Moreover, according to forecasts, inflation may reach 2.5% in the last three months of 2022, and be at the level of 1% at the end of next year.
As for a possible change in the monetary policy of the BOJ after the expiration of the term of Haruhiko Kuroda in April 2023, one cannot really count on this. And even more so, one should not expect an increase in interest rates at the next meeting of the Japanese regulator on September 22.
Based on the above, the majority of analysts (60%) believe that USD/JPY will again aim to test the July 14 high and take the height of 139.40. 30% of experts expect the yen to strengthen and a downtrend, and 10% give a neutral forecast. The indicators on D1 mirror the readings of the previous pairs: 100% of them point north, while 25% of the oscillators are in the overbought zone. Supports for the pair are located at the levels and in the zones 137.00, 136.70, 136.15-136.30, 135.50, 134.70, 134.00-134.25, 132.85-133.00, 131.75-132.00, 131.00. Resistances are 137.70, 138.40, 138.50-139.00, and finally the July 14 high at 139.38. Bulls' next targets are 140.00 and 142.00.
No significant statistics on the Japanese economy are expected to be released this week.
CRYPTOCURRENCIES: Dark Gray is the Colour
As of last week, BTC/USD was trading in a tight $20,900-$21,800 range most of the time ahead of Jerome Powell's speech at Jackson Hole. It is in this zone that the cumulative average break-even of all bitcoin holders is located. But risky assets: stock indices (S&P500, Dow Jones, Nasdaq) and quotes of digital currencies flew down on the evening of August 26. At the time of writing, the main cryptocurrency has already begun to react to the hawkish mood of the head of the Fed and recorded a weekly low at $20,534. The total capitalization of the crypto market has fallen below the psychologically important level of $1 trillion and stands at $0.991 trillion ($1.028 trillion a week ago). The Crypto Fear & Greed Index has dropped 6 points in seven days from 33 to 27 and is in the Extreme Fear zone. It is possible that these figures will become even worse on Saturday and Sunday, August 27-28.
The overall picture at the end of summer looks like this. In July, whales (with assets of over 10,000 BTC) and shrimps (less than 1 BTC) have been the main investment force driving bitcoin up. It is known that institutional investors play a leading role in the whale population, highly dependent on what is happening on Wall Street. Institutional operations with digital assets are carried out through cryptocurrency funds. And, judging by the statistics, the inflow of investments into these funds stopped at the beginning of August, and the whales returned to selling their BTC coins in the second week of the month: the outflow amounted to about $21 million.
However, according to Bakkt crypto platform CEO Gavin Michael, despite what is happening, bitcoin will show significant growth in the coming years. Bakkt provides digital assets and futures trading services for institutional investors and, according to Michael, they are closely watching what is happening and their interest in the market is constantly growing.
One of the key signs of future price growth is the increase in network activity and the emergence of new addresses. Bitcoin activity is now at the same level as it was at the end of the 2018-2019 bearish market, according to analytics firm Glassnode. However, despite the signs of the end of the "crypto winter", network indicators still do not signal a reversal of the macroeconomic trend. The researchers note that the bitcoin network still does not record the presence of demand for cryptocurrency from investors, which is essential for a sustainable uptrend. "Recent price increases failed to attract a significant wave of new active users, which is especially noticeable among retail investors and speculators," Glassnode notes. The lack of hype is also indicated by the falling fees in the bitcoin network. As noted, its size has fallen below $1. Currently, the average cost of BTC transactions is around $0.825, which is the lowest level since June 13, 2020. Despite this, Glassnode believes that it is at current price levels that bitcoin can try to form a solid foundation for future growth.
CoinShares Chief Strategy Officer Meltem Demirors believes that "BTC does not see catalysts that could contribute to growth until the end of Q3." But despite this, "we saw a lot of buying on drawdowns in relation to BTC" in summer, which, in her opinion, indicates the presence of capital willing to accumulate this asset.
If Meltem Demirors is cautiously optimistic, analyst Justin Bennett is quite pessimistic and believes that BTC may face another sell-off. Bitcoin has gone below the diagonal support that has kept the bullish vibe for the past few months. According to Bennett, the coin's rate fell by more than 30% the last two times in such situations.
Although the analyst is bearish, he predicts a small short-term rise in BTC to $23,000, which should be retested as resistance. Then a decline to $19,000 is expected. Bitcoin's reaction at this level should, according to Bennett, determine its behavior until the end of the year: "The question will be whether we see a rebound and higher lows, or get lower lows for the rest of the year."
As for ethereum, Meltem Demirors believes that investors are ignoring the general situation in the market, amid the hype around the transition of ETH to the PoS mechanism. And that, despite the benefits of the merger for the ethereum network itself, it is not certain that this event will attract significant investment capital: "While there is significant enthusiasm in the crypto community for a merger that can rapidly reduce supply and increase demand, the reality is more prosaic: investors are concerned about rates and macro indicators. I believe that significant amounts of new capital are unlikely to enter ETH. There are certain risks that need to be played out in the market because the merger has been used as an excuse to buy on the rumor and sell on the news. How will these risks be played out? Most likely on the institutional side or through trading, but through options rather than outright purchases of the asset."
Another well-known strategist, Benjamin Cowen, spoke out about the ethereum. In his opinion, if the most negative scenario is implemented, the logarithmic regression band indicates a possible fall in the ETH/USD pair to the $400-$800 area. Cowen calls such a drop an excellent opportunity to replenish Ethereum reserves. At the same time, he does not exclude the possibility of the altcoin moving up: "ETH can demonstrate a rally if the transition to PoS goes without significant problems (you need to be aware that some software updates do not always go smoothly) and the Fed changes its monetary policy." (As a reminder, the ethereum network upgrade is scheduled for September 15-20. So, it won't take long to wait.)
USD/JPY Daily Outlook
Daily Pivots: (S1) 136.67; (P) 137.12; (R1) 137.96; More...
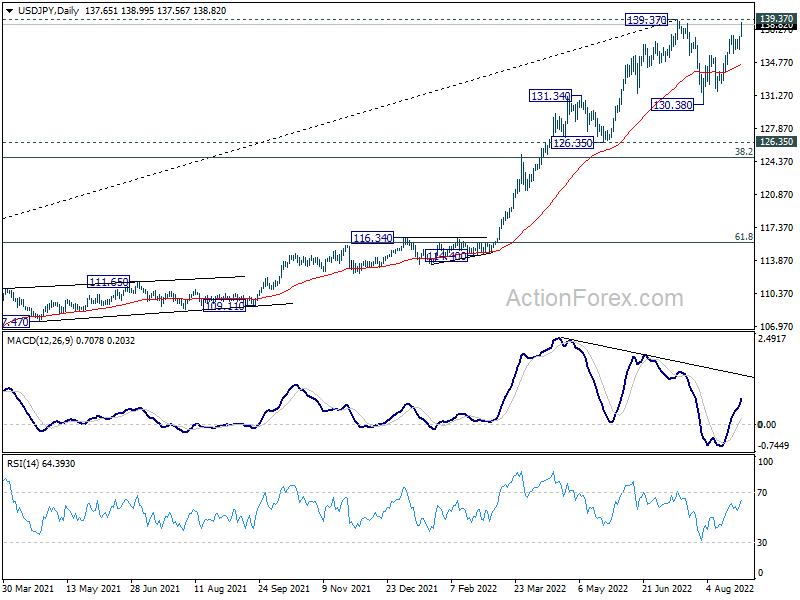
USD/JPY's rise resumes by breaking through 137.70 and intraday bias is back on the upside for 139.37 high. Strong resistance could be seen there to limit upside, to start the third leg of the corrective pattern from 139.37. Break of 136.17 minor support will turn bias back to the downside for 130.38 support. Nevertheless, decisive break of 139.37 will confirm up trend resumption for 147.68 long term resistance.
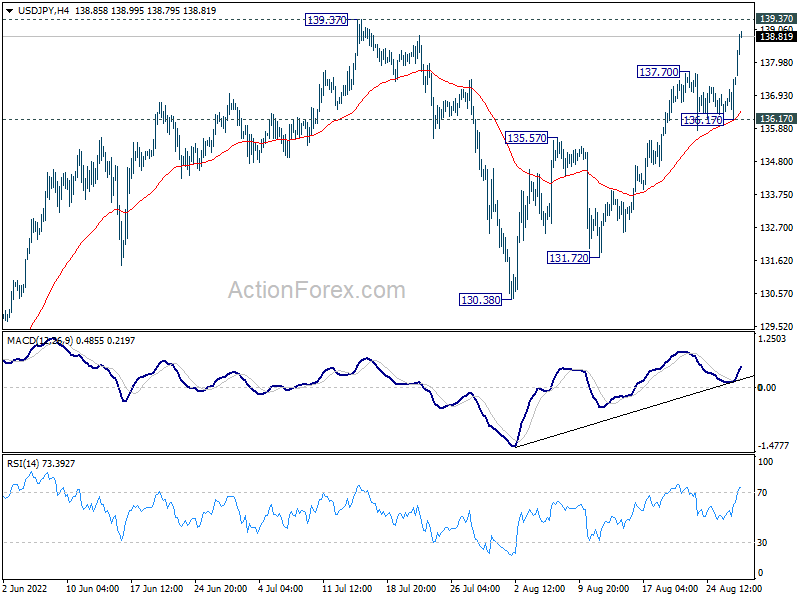
In the bigger picture, price actions from 139.37 medium term top are seen as a corrective pattern to up trend from 101.18 (2020 low). While deeper decline cannot be ruled out, outlook will stays bullish as long as 55 week EMA (now at 123.72) holds. Long term up trend is expected to resume through 139.37 at a later stage, after the correction finishes. Next target is 147.68 (1998 high).
Dollar Extends Post Powell Rally, Yen Down
Dollar rises broadly in Asian session, extending the post-Powell rally. Risk-off sentiment is a factor giving the greenback another boost. At the same time, 10-year yield is back above 3.1% in Asia, giving Dollar another lift, and hammers Yen at the same time. The trend will likely continue for a while with an empty calendar today. But more volatility lies ahead with lots of heavy weight data scheduled later in the week, including US non-farm payroll report.
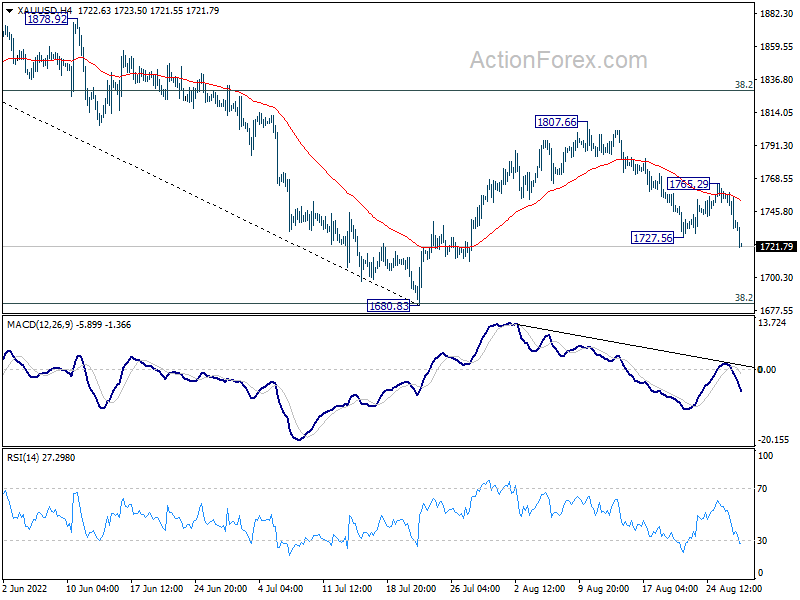
Technically, Gold resumes the decline from 1807.66 resumes by breaking through 1727.56 temporary low. Deeper fall should be seen as long as 1765.29 resistance holds, towards 1680.83 key support level. There is still prospect of a bounce from there to stage a near term bullish reversal. However, sustained break of 1680.83 will be a medium term bearish signal, and could also be a signal of more powerful, persistent rally in Dollar too.
In Asia, at the time of writing, Nikkei is down -2.66%. Hong Kong HSI is down -0.73%. China Shanghai SSE is down -0.24%. Singapore Strait Times is down -0.91%. Japan 10-year JGB yield is up 0.216 at 0.242.
ECB policymakers wants forceful actions in September
ECB board member Isabel Schnabel said, "Both the likelihood and the cost of current high inflation becoming entrenched in expectations are uncomfortably high. In this environment, central banks need to act forcefully."
Governing Council member Martins Kazaks said, "Frontloading rate hikes is a reasonable policy choice. We should be open to discussing both 50 and 75 basis points as possible moves. From the current perspective, it should at least be 50."
Another Governing Council member Francois Villeroy de Galhau said ECB needs to be at "neutral rate" before the end of the year, "after another significant step in September... Have no doubt that we at the ECB would if needed raise rates further beyond normalization: bringing inflation back to 2% is our responsibility; our will and our capacity to deliver on our mandate are unconditional."
Governing Council member Olli Rehn said, "The reality is that we have excessively high inflation globally, also in Europe -- that's why it's action time. The next step will be a significant move in September, depending on the incoming data and the inflation outlook."
SNB Jordan: Inflation is increasingly spreading to goods and services
SNB Chairman Thomas Jordan said over the weekend, "There are signs that inflation is increasingly spreading to goods and services that are not directly affected by the pandemic or the war in Ukraine."
"In fact, it appears that in the current environment, higher prices are being passed on more quickly -- and are also being more readily accepted -- than was the case until just recently," he added.
Inflation expectations "have also been moving upwards slightly" and wage growth is "gathering momentum," Jordan said, cautioning that the "longer-term outlook for monetary policy is also subject to high uncertainty."
"In particular, a decline in global economic integration could increase companies' price-setting power, meaning that they would be able to push through price increases more easily," he said.
BoJ Kuroda: We have no choice other than continued monetary easing
BoJ Governor Haruhiko Kuroda said over the weekend, "somewhat miraculously, now we have 2.4% inflation. But almost wholly caused by the international commodity price hike, energy and food."
"So we expect that by the end of this year, maybe inflation rate may approach 2 or 3%, but next year, inflation rate again decelerate toward 1.5%," he said.
"We have no choice other than continued monetary easing until wages and prices rise in a stable and sustainable manner."
Australia retail sales rose 1.3% mom in Jul
Australia retail sales turnover rose 1.3% mom to AUD 34.67B in July, well above expectation of 0.3% mom.
Ben Dorber, head of retail statistics at the ABS, said: "After slowing growth in recent months, the 1.3 per cent rise in July was the largest since the 1.6 per cent rise in March 2022.
"Turnover rose in five of the six retail industries in July 2022. This shows that, despite cost-of-living pressures, households are continuing to spend."
Focus back to economic data, including US NFP, ISM and Eurozone CPI and China PMIs
Focuses will turn back to economic data this week. In particular, eyes will be of US non-farm payroll, which would be crucial for Fed officials to determine the size of the next rate hike in September. Also to be featured from the US include consumer confidence and ISM manufacturing.
Elsewhere, Eurozone CPI flash, Swiss CPI and retail sales, Japan industrial production and retail sales, New Zealand ANZ business confidence, and China PMIs will be closely watched too.
Here are some highlights for the week:
- Monday: Australia retail sales.
- Tuesday: Australia building approvals; Japan unemployment rate; Swiss KOF economic barometer; Germany CPI flash; UK M4 money supply, mortgage approvals; Canada current account; US house price index, consumer confidence.
- Wednesday: New Zealand building permits, ANZ business confidence; Australia construction work done, private sector credit; Japan industrial production, retail sales, consumer confidence, housing starts; China PMIs; Germany import price, unemployments; France consumer spending, GDP; Swiss Credit Suisse economic expectations; Eurozone CPI flash; Canada GDP; US ADP employment, Chicago PMI.
- Thursday: Australia AiG manufacturing, private capital expenditure; Japan capital spending, PMI manufacturing final; China Caixin PMI manufacturing; Germany retail sales; Swiss CPI, retail sales, PMI manufacturing; Eurozone PMI manufacturing final, unemployment rate; UK PMI manufacturing final; Canada building permits, PMI manufacturing; US Challenger job cuts, jobless claims, non-farm productivity, ISM manufacturing, construction spending.
- Friday: New Zealand overseas trade index; Japan monetary base; Germany trade balance; Eurozone PPI; Canada labor productivity; US non-farm payrolls, factory orders.
USD/JPY Daily Outlook
Daily Pivots: (S1) 136.67; (P) 137.12; (R1) 137.96; More...
USD/JPY's rise resumes by breaking through 137.70 and intraday bias is back on the upside for 139.37 high. Strong resistance could be seen there to limit upside, to start the third leg of the corrective pattern from 139.37. Break of 136.17 minor support will turn bias back to the downside for 130.38 support. Nevertheless, decisive break of 139.37 will confirm up trend resumption for 147.68 long term resistance.
In the bigger picture, price actions from 139.37 medium term top are seen as a corrective pattern to up trend from 101.18 (2020 low). While deeper decline cannot be ruled out, outlook will stays bullish as long as 55 week EMA (now at 123.72) holds. Long term up trend is expected to resume through 139.37 at a later stage, after the correction finishes. Next target is 147.68 (1998 high).
Economic Indicators Update
| GMT | Ccy | Events | Actual | Forecast | Previous | Revised |
|---|---|---|---|---|---|---|
| 01:30 | AUD | Retail Sales M/M Jul | 1.30% | 0.30% | 0.20% |
Technical Outlook and Review
USD/JPY:
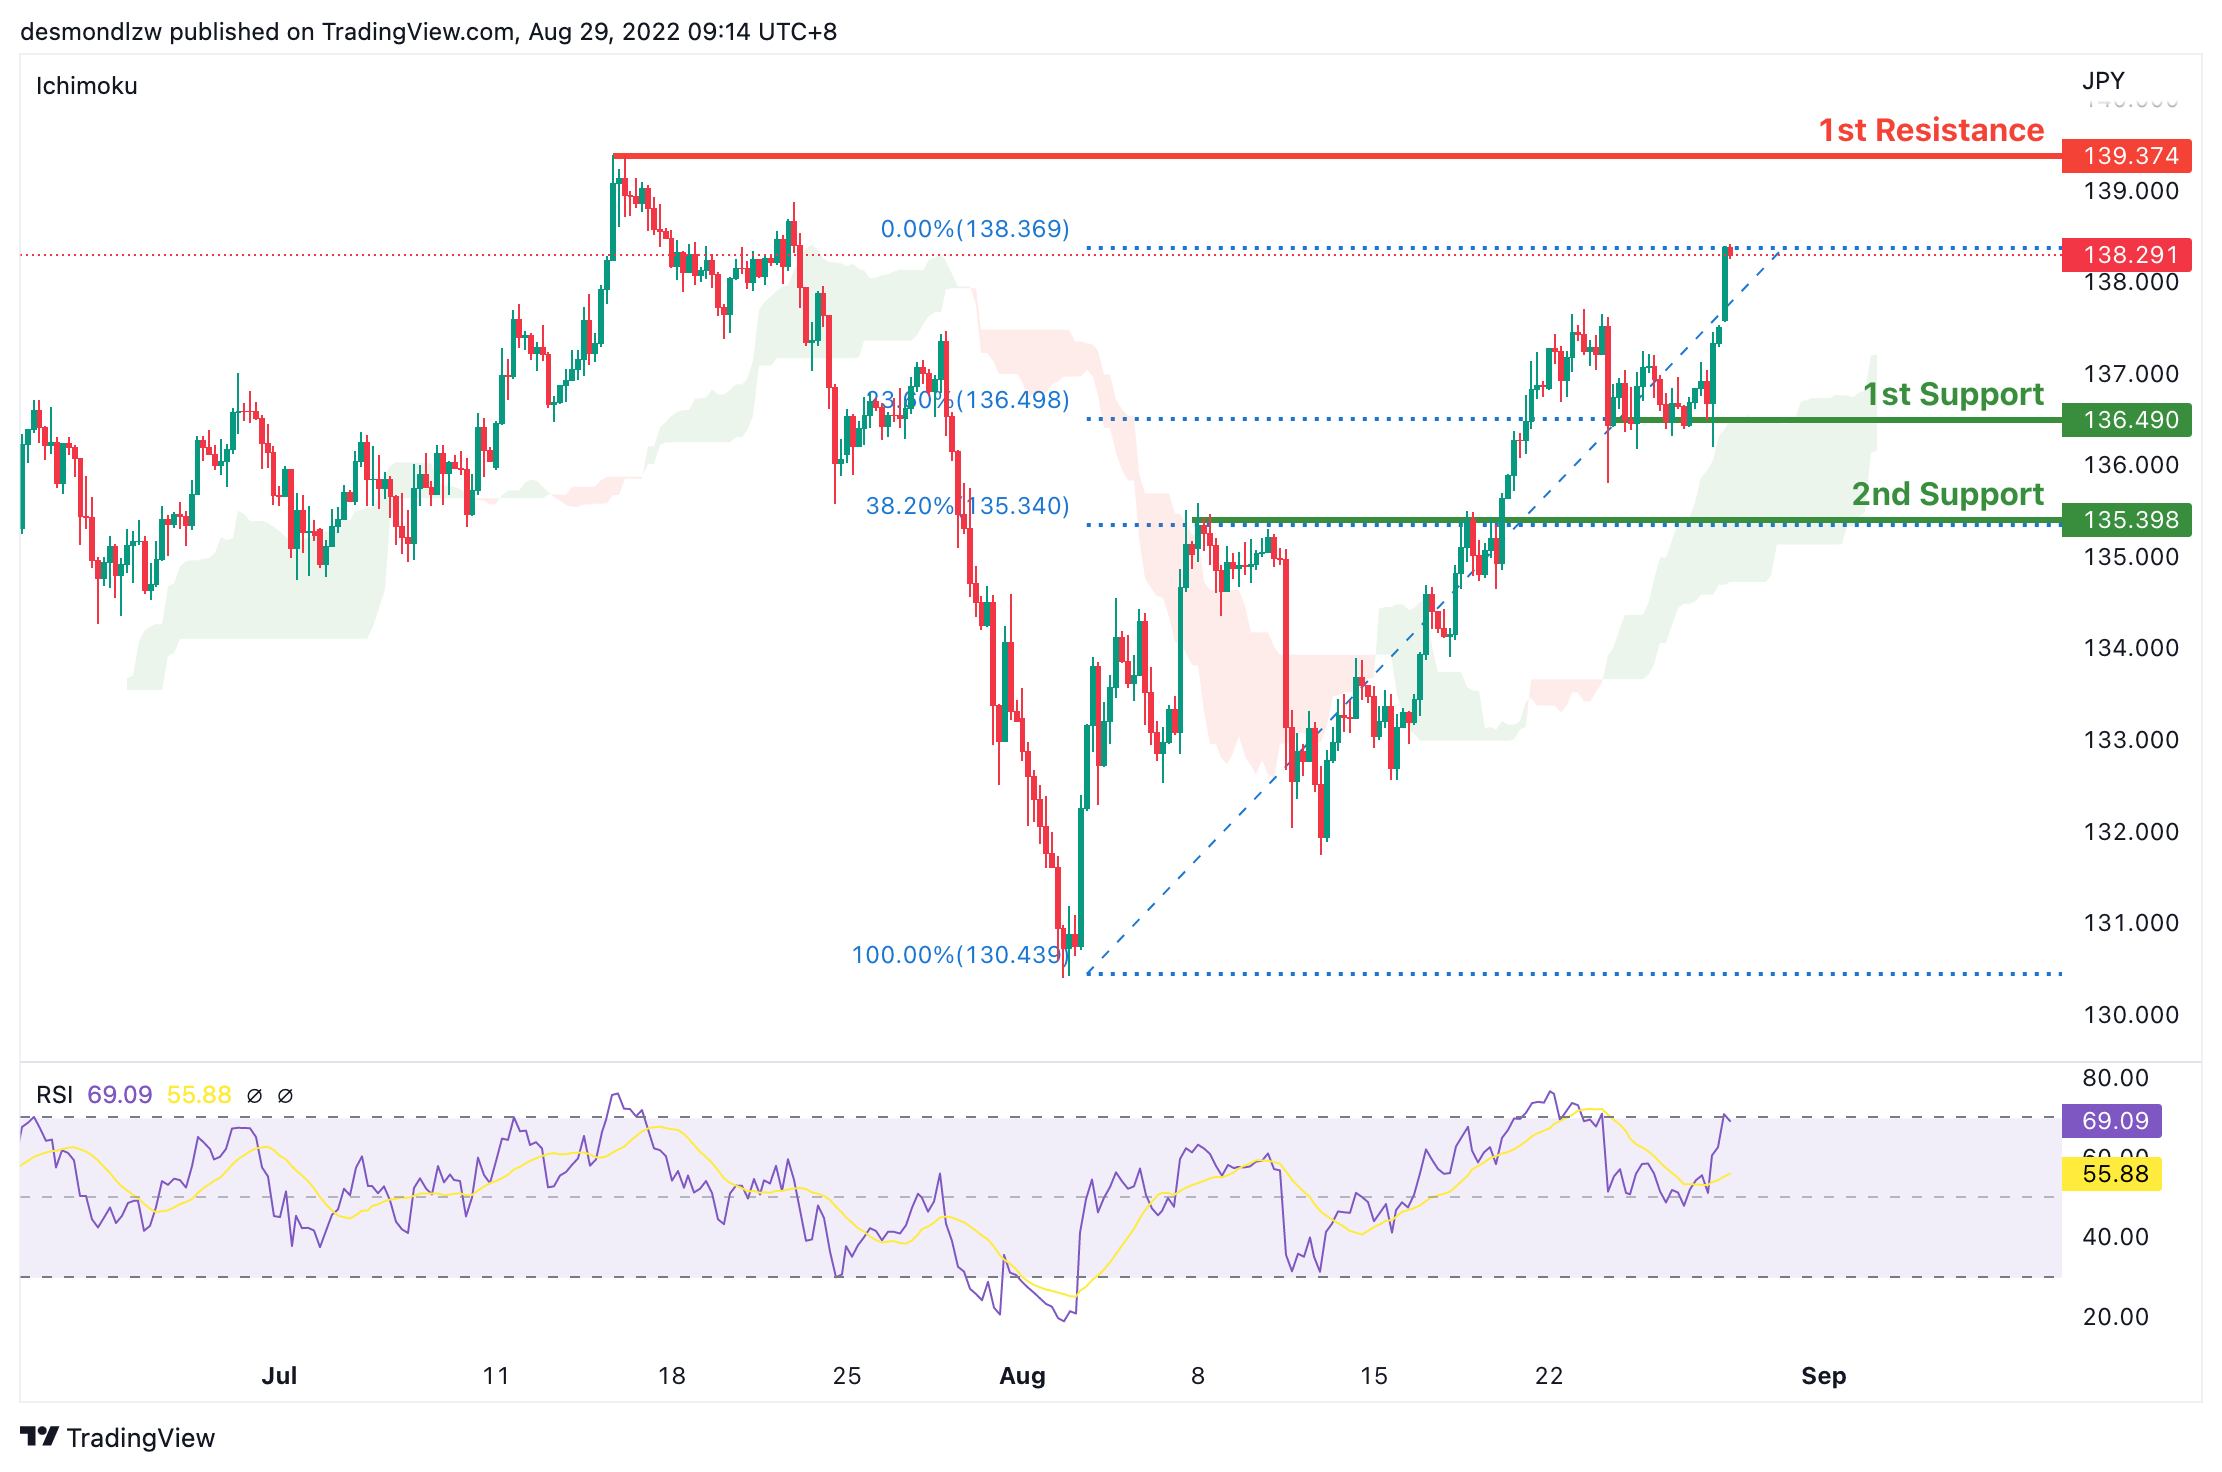
On the H4 chart, price has confirmed a bullish momentum breaking the previous high. We are bullish bias- Price is moving towards the first resistance at 139.374 where the previous swing high sits. Alternatively, if price reverse, it might pull back to test the first support at 136.490 where the 23.6% fibonacci retracement sits then subsequently the second support at 135.398 where the 38.2% retracement sits
Areas of consideration:
- H4 time frame, 1st resistance at 139.374
- H4 time frame, 1st support at 136.490
DXY:
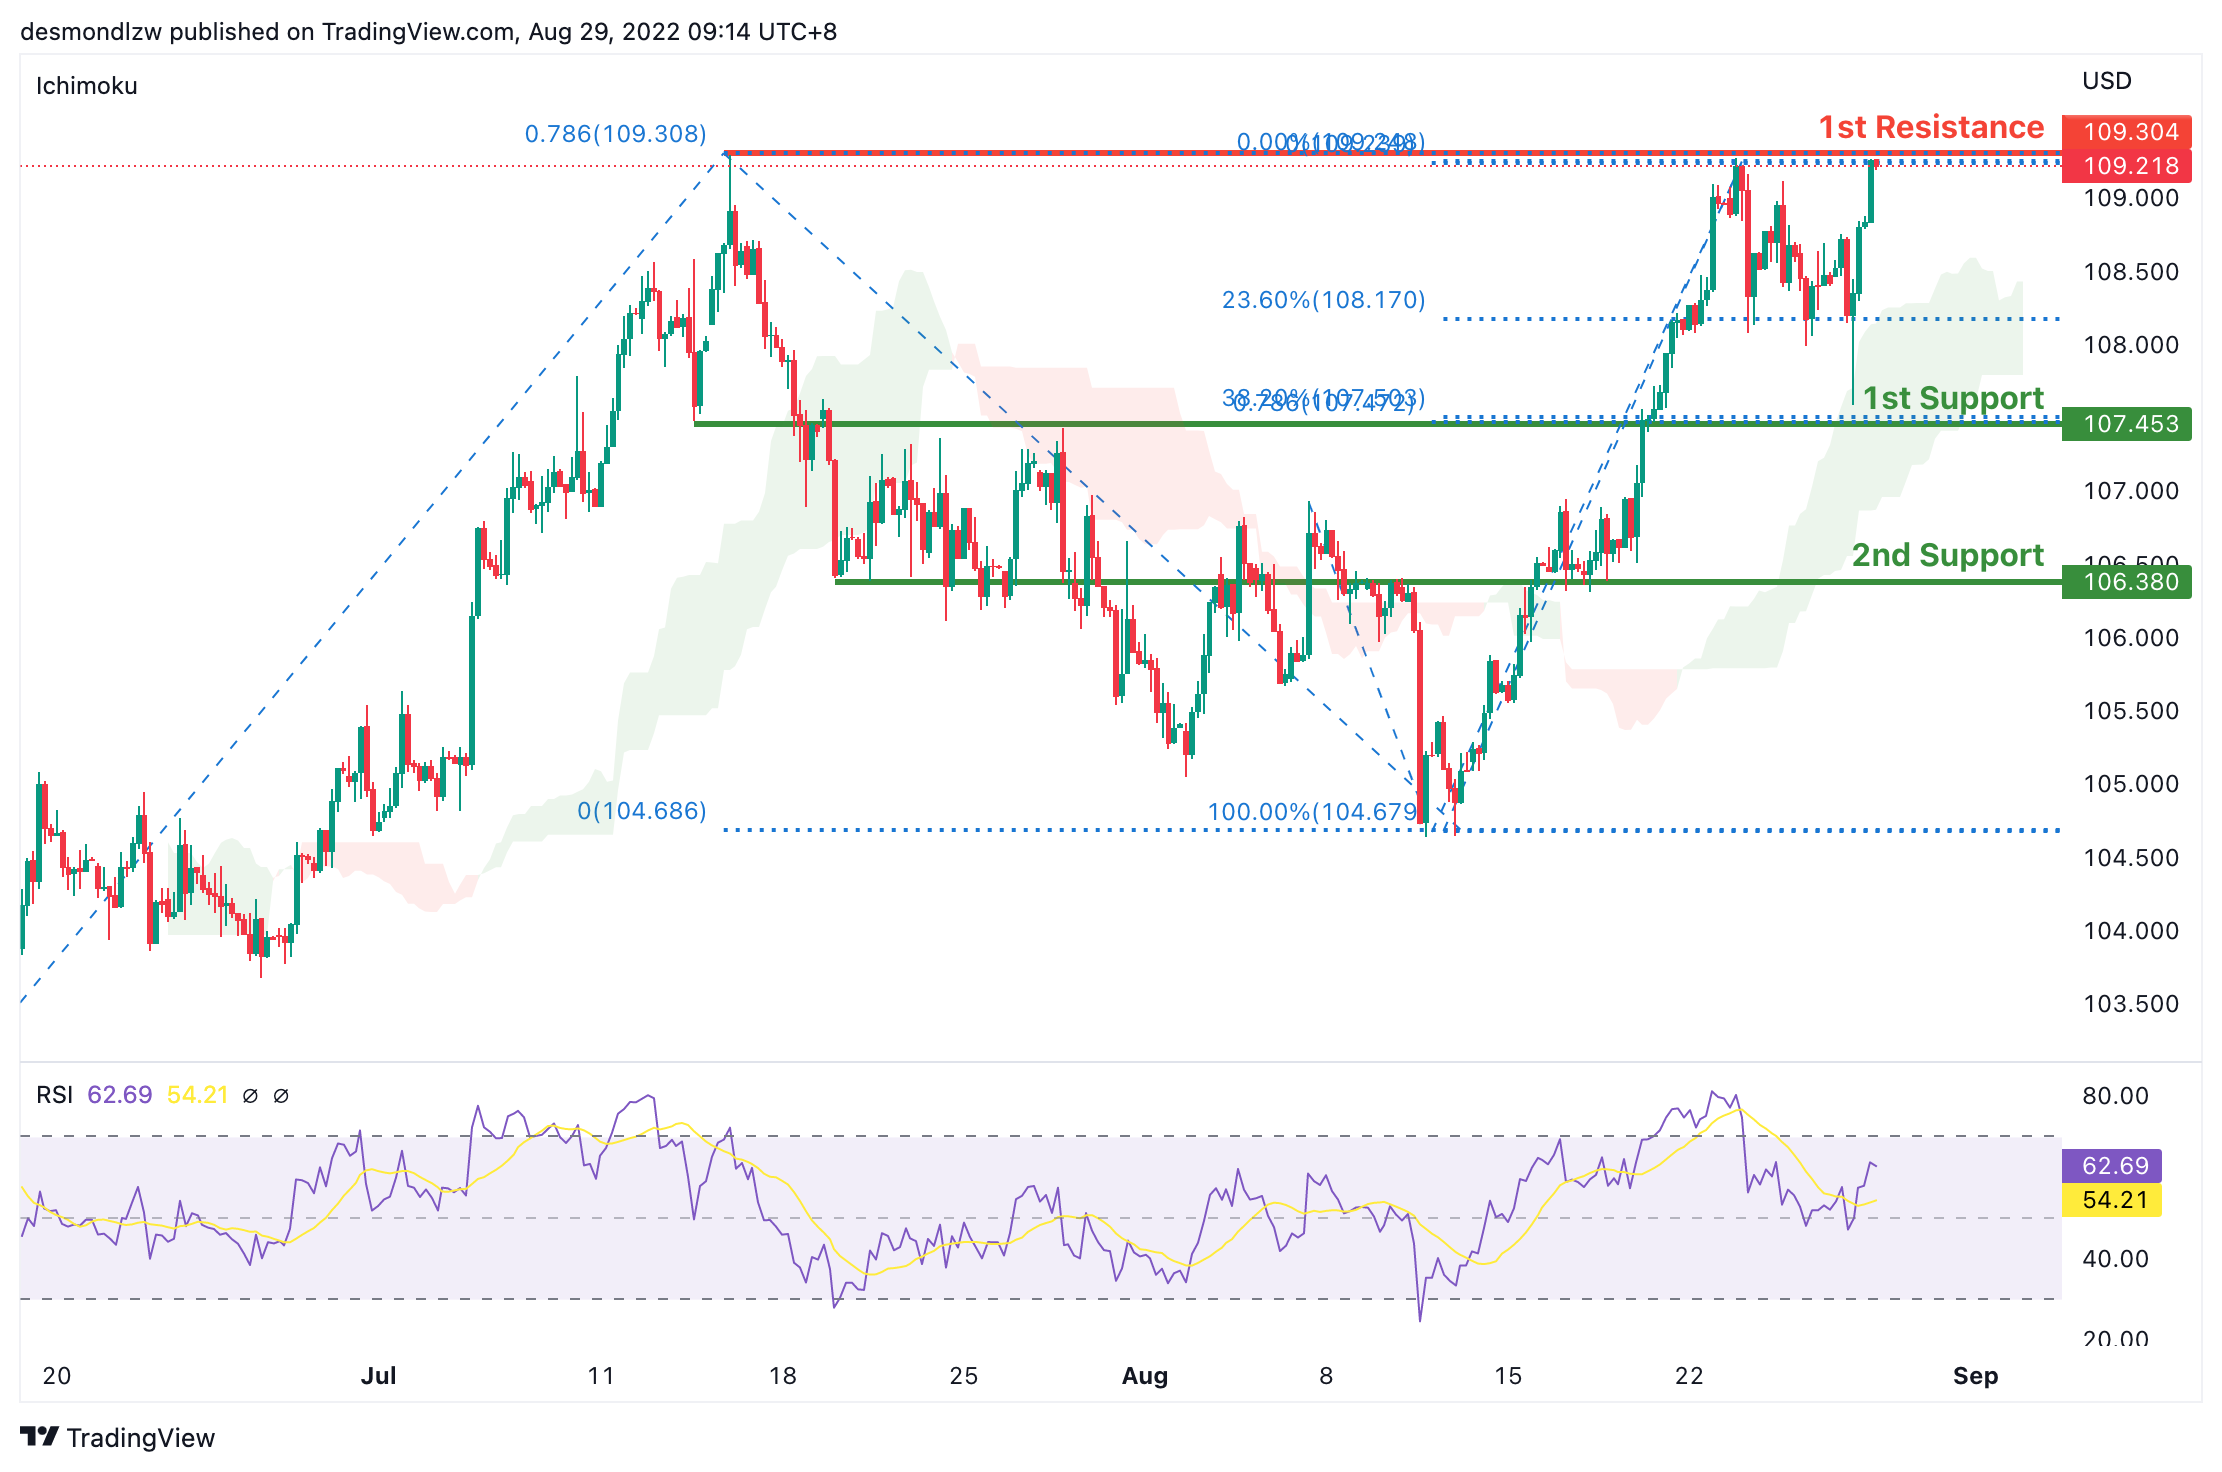
On the H4, price is still moving in an ascending trend and is in a bullish momentum. Price is testing the first resistance at 109.304 where the 78.6% Fibonacci projection and the previous swing high sits. If price fails to break this level, it will pull back to test the first support at 107.453 where the 38.2% retracement and 78.6% projection sits and subsequently the second support at 106.380 where the 61.8% retracement sits
Areas of consideration:
- H4 time frame, 1st resistance at 109.304
- H4 time frame, 1st support at 107.453
EUR/USD:
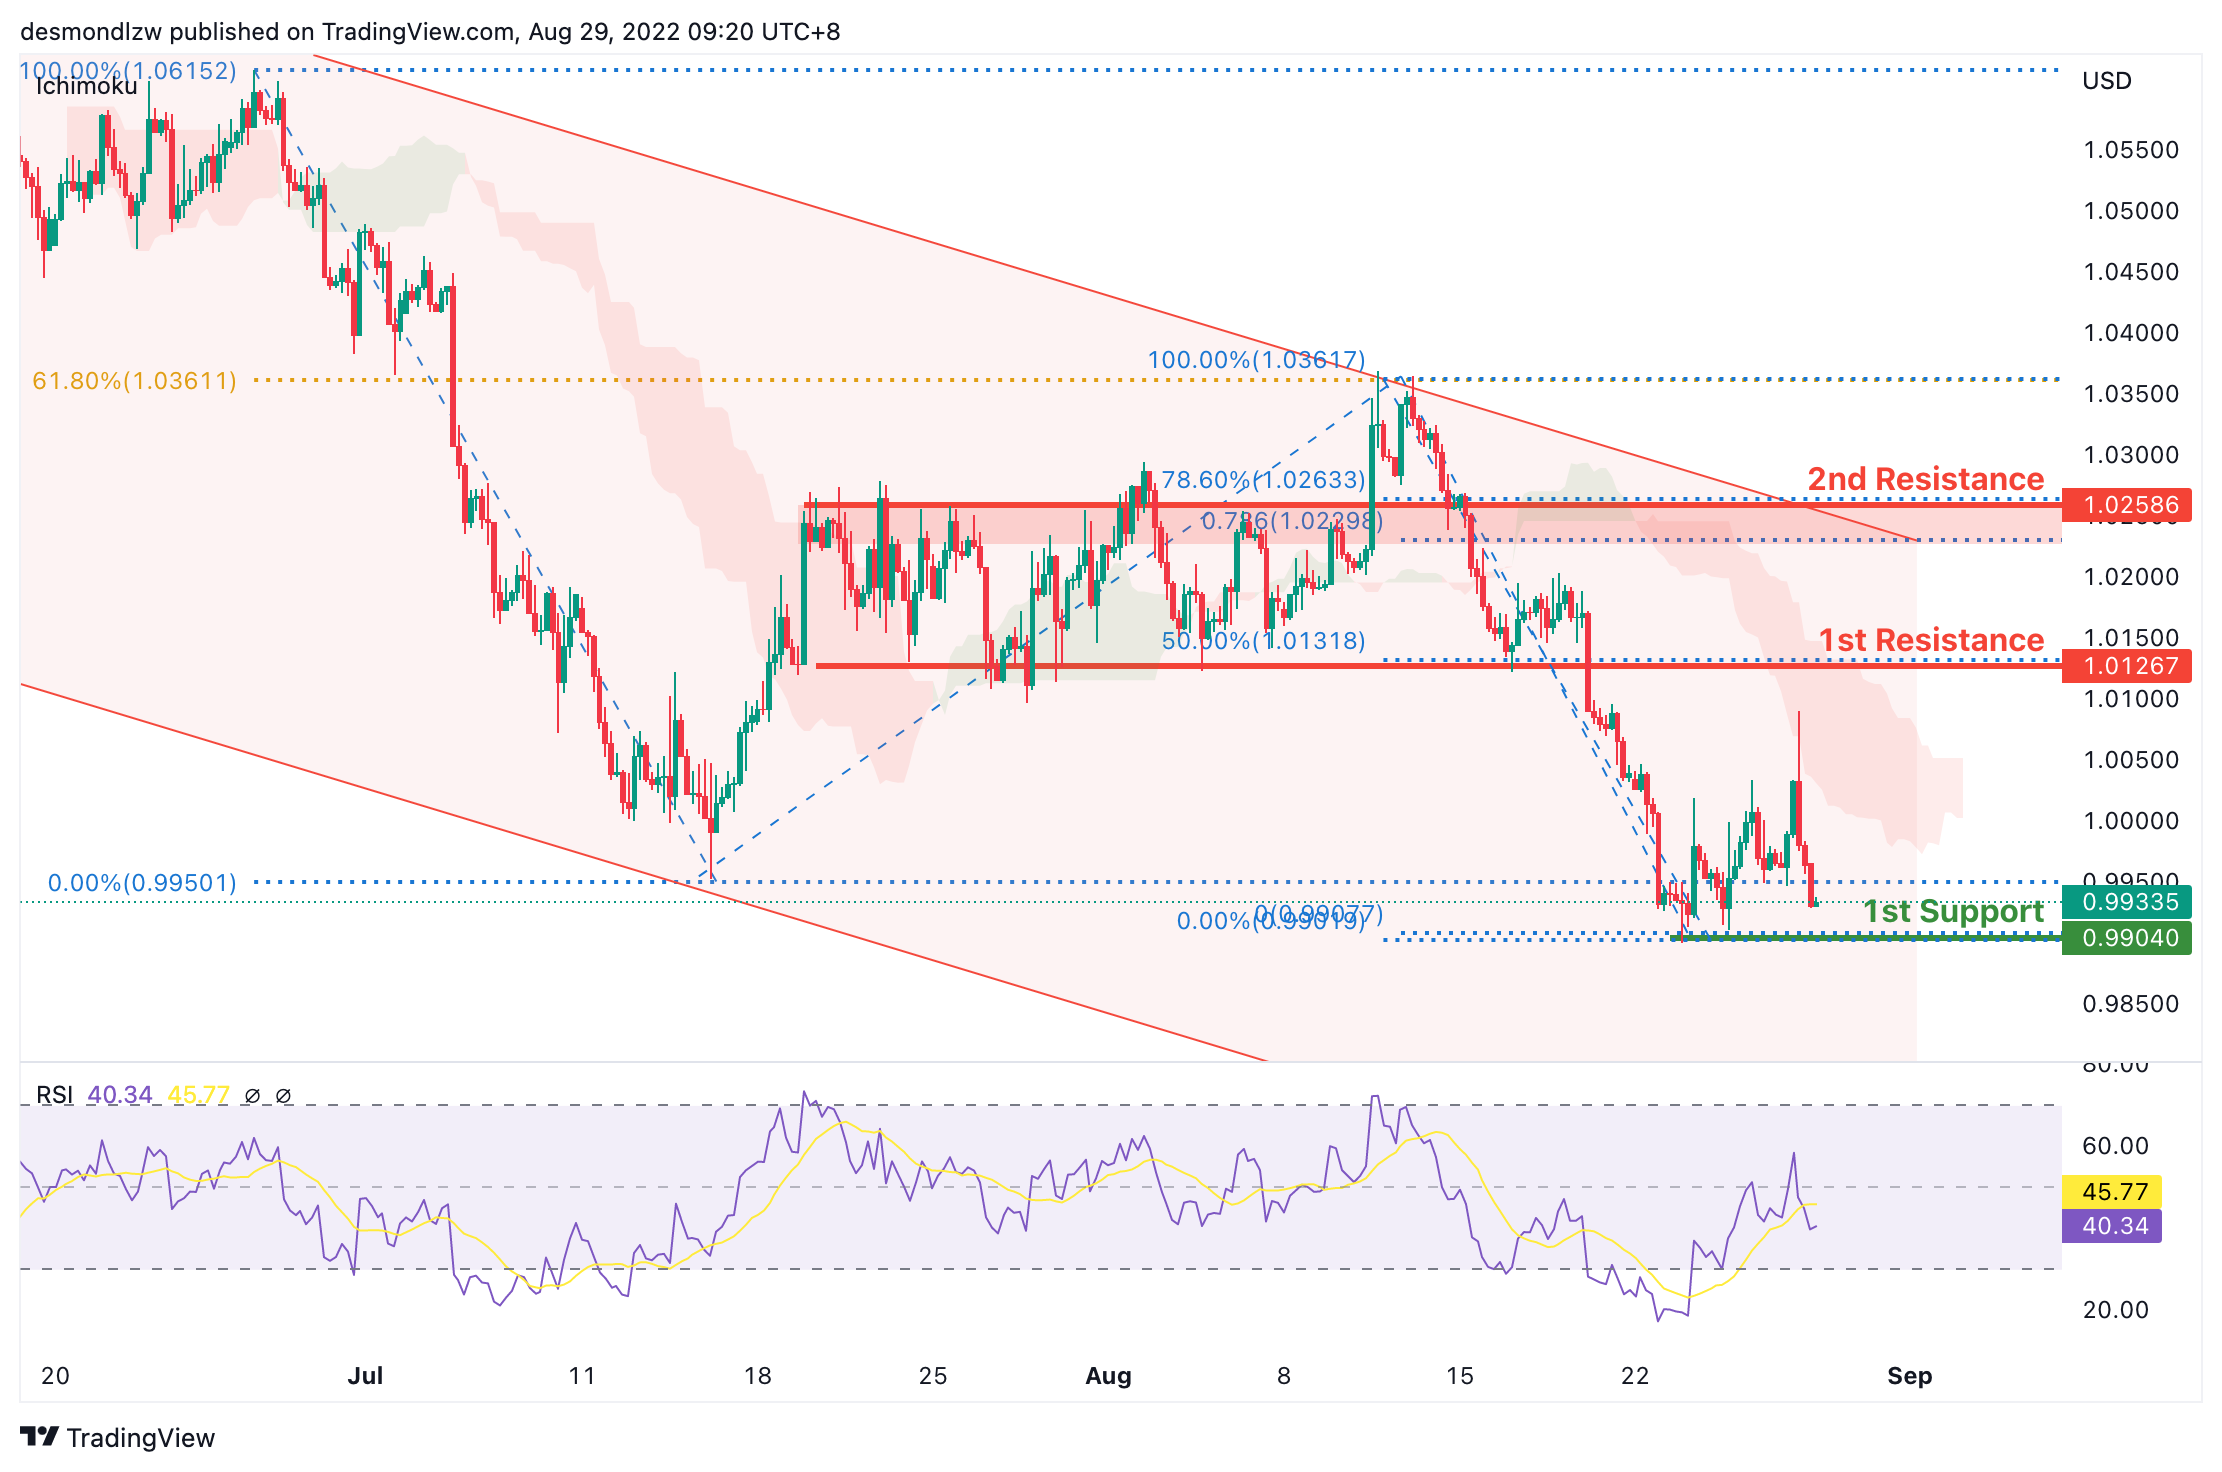
On the H4, prices are still in a descending trend and are below the ichimoku indicator, we are bearish bias. Price is looking to test the first support again at 0.9904 where the 61.8% projection sit. If it fails to break the first support, prices could pull back to test the first resistance at 1.0126 where the previous swing low and 50% retracement sits and subsequently the second resistance at 1.0258 where the 78.6% retracement and swing high sits
Areas of consideration :
- H4 1st resistance at 1.0126
- H4 1st support at 0.9904
GBP/USD:
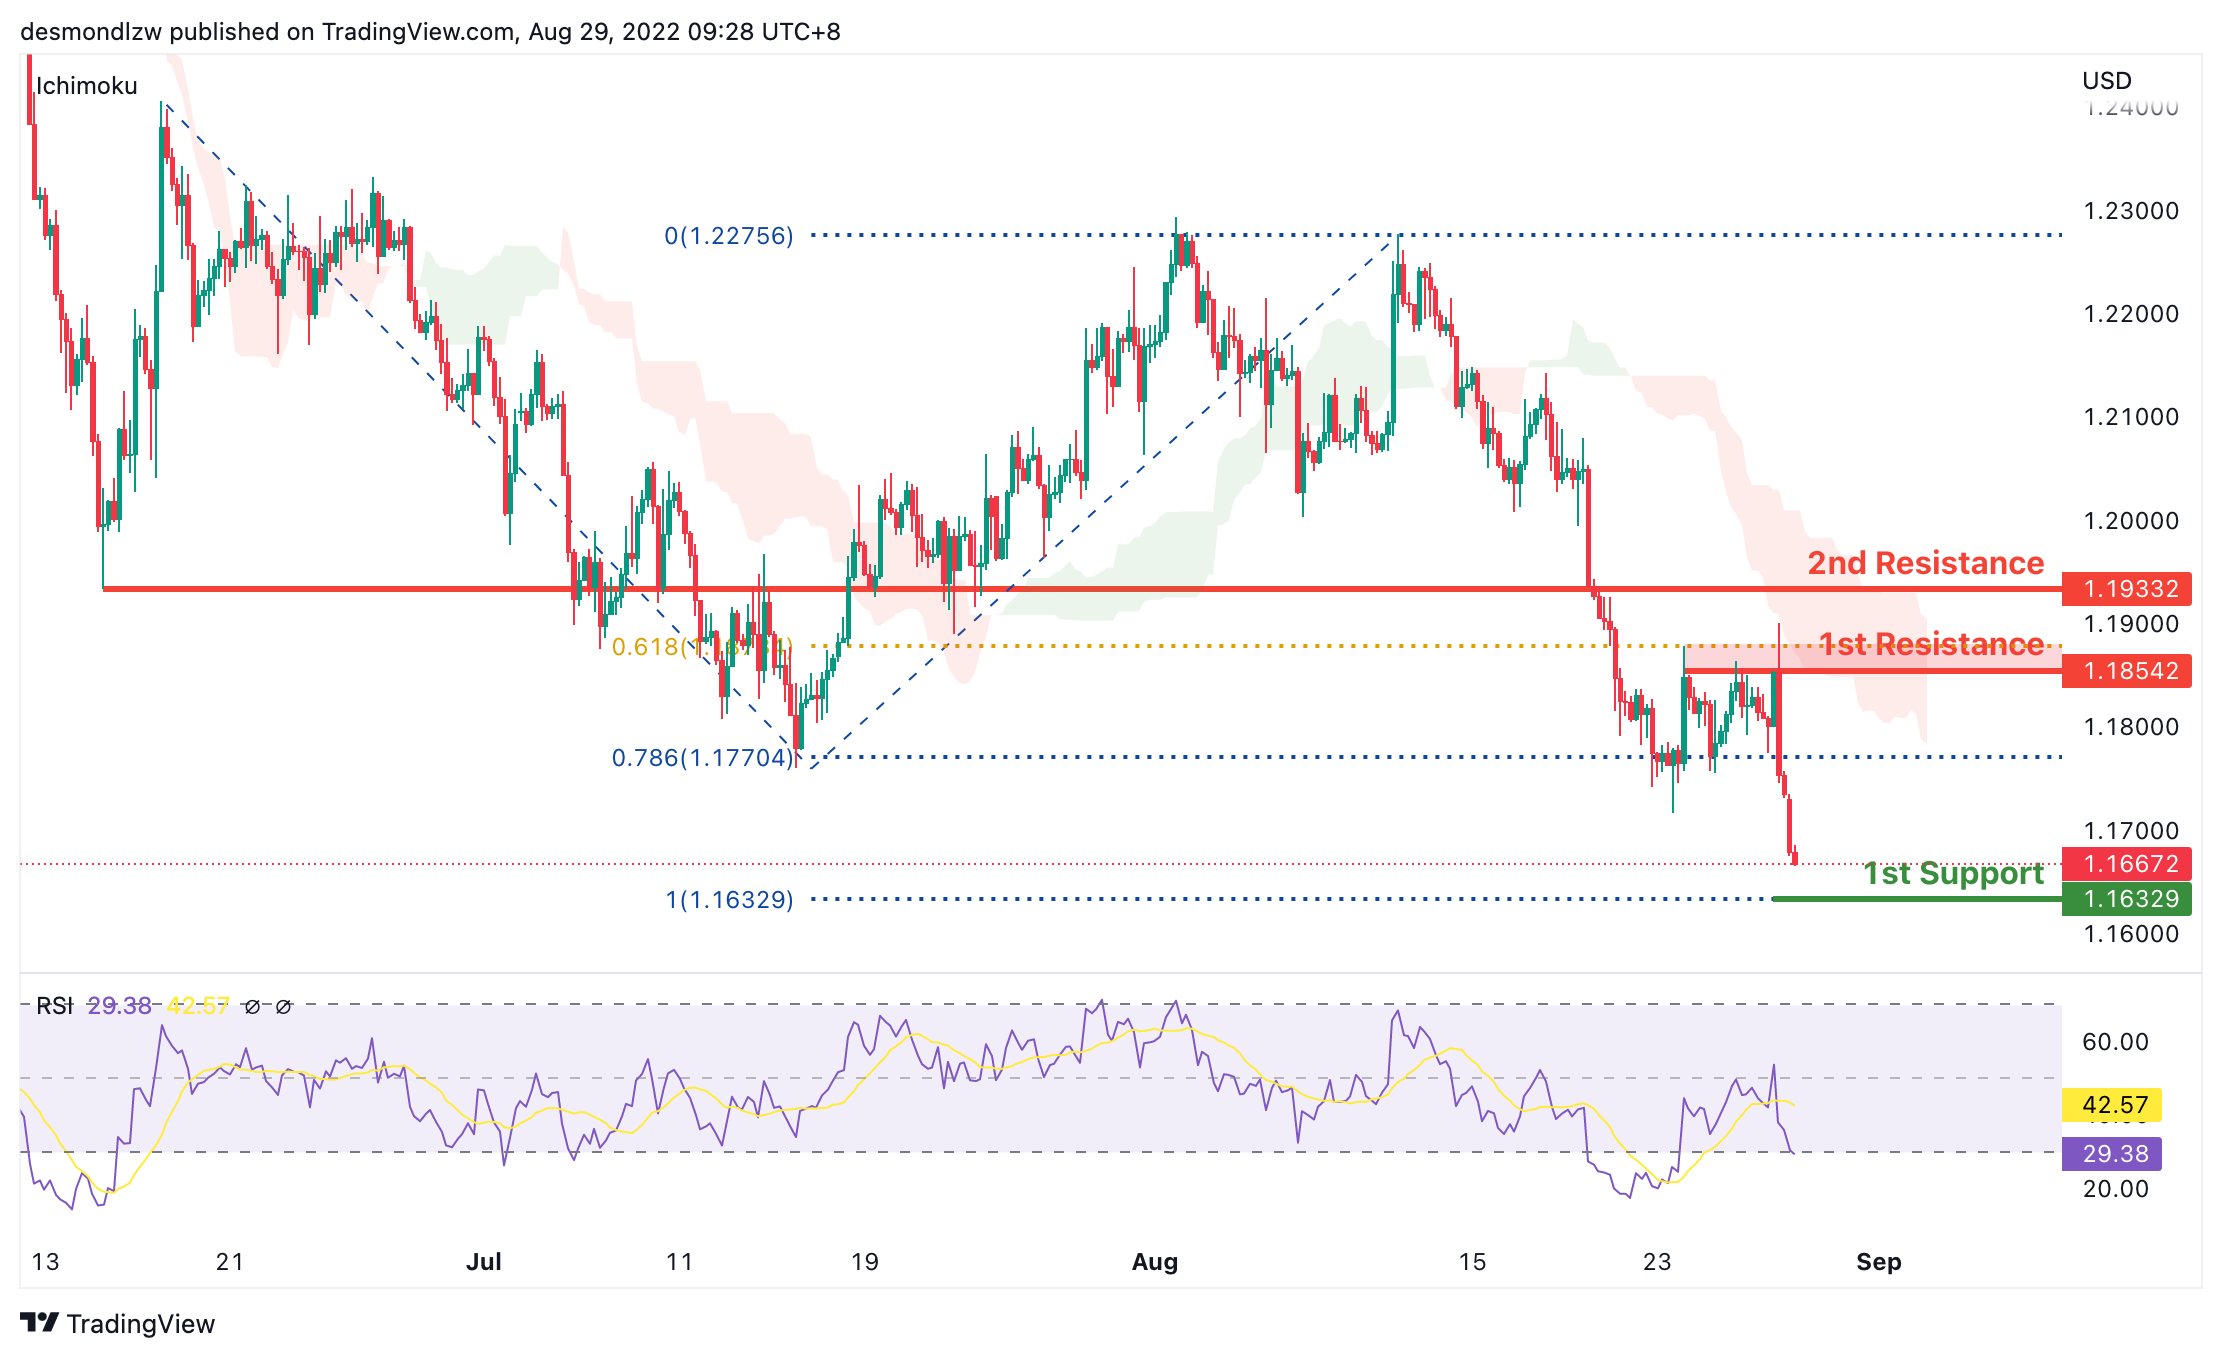
On the H4, prices seem to be in a bearish momentum and respecting the ichimoku cloud. Prices have broken the 78.6% projection level and are moving towards the first support, 100% projection at 1.1632 levels. If price fails to break this level, it might pull back to test the first resistance at 1.1854 where the 38.2% retracement sits.
Areas of consideration:
- H4 1st resistance at 1.1920
- H4 1st support at 1.1722
USD/CHF:
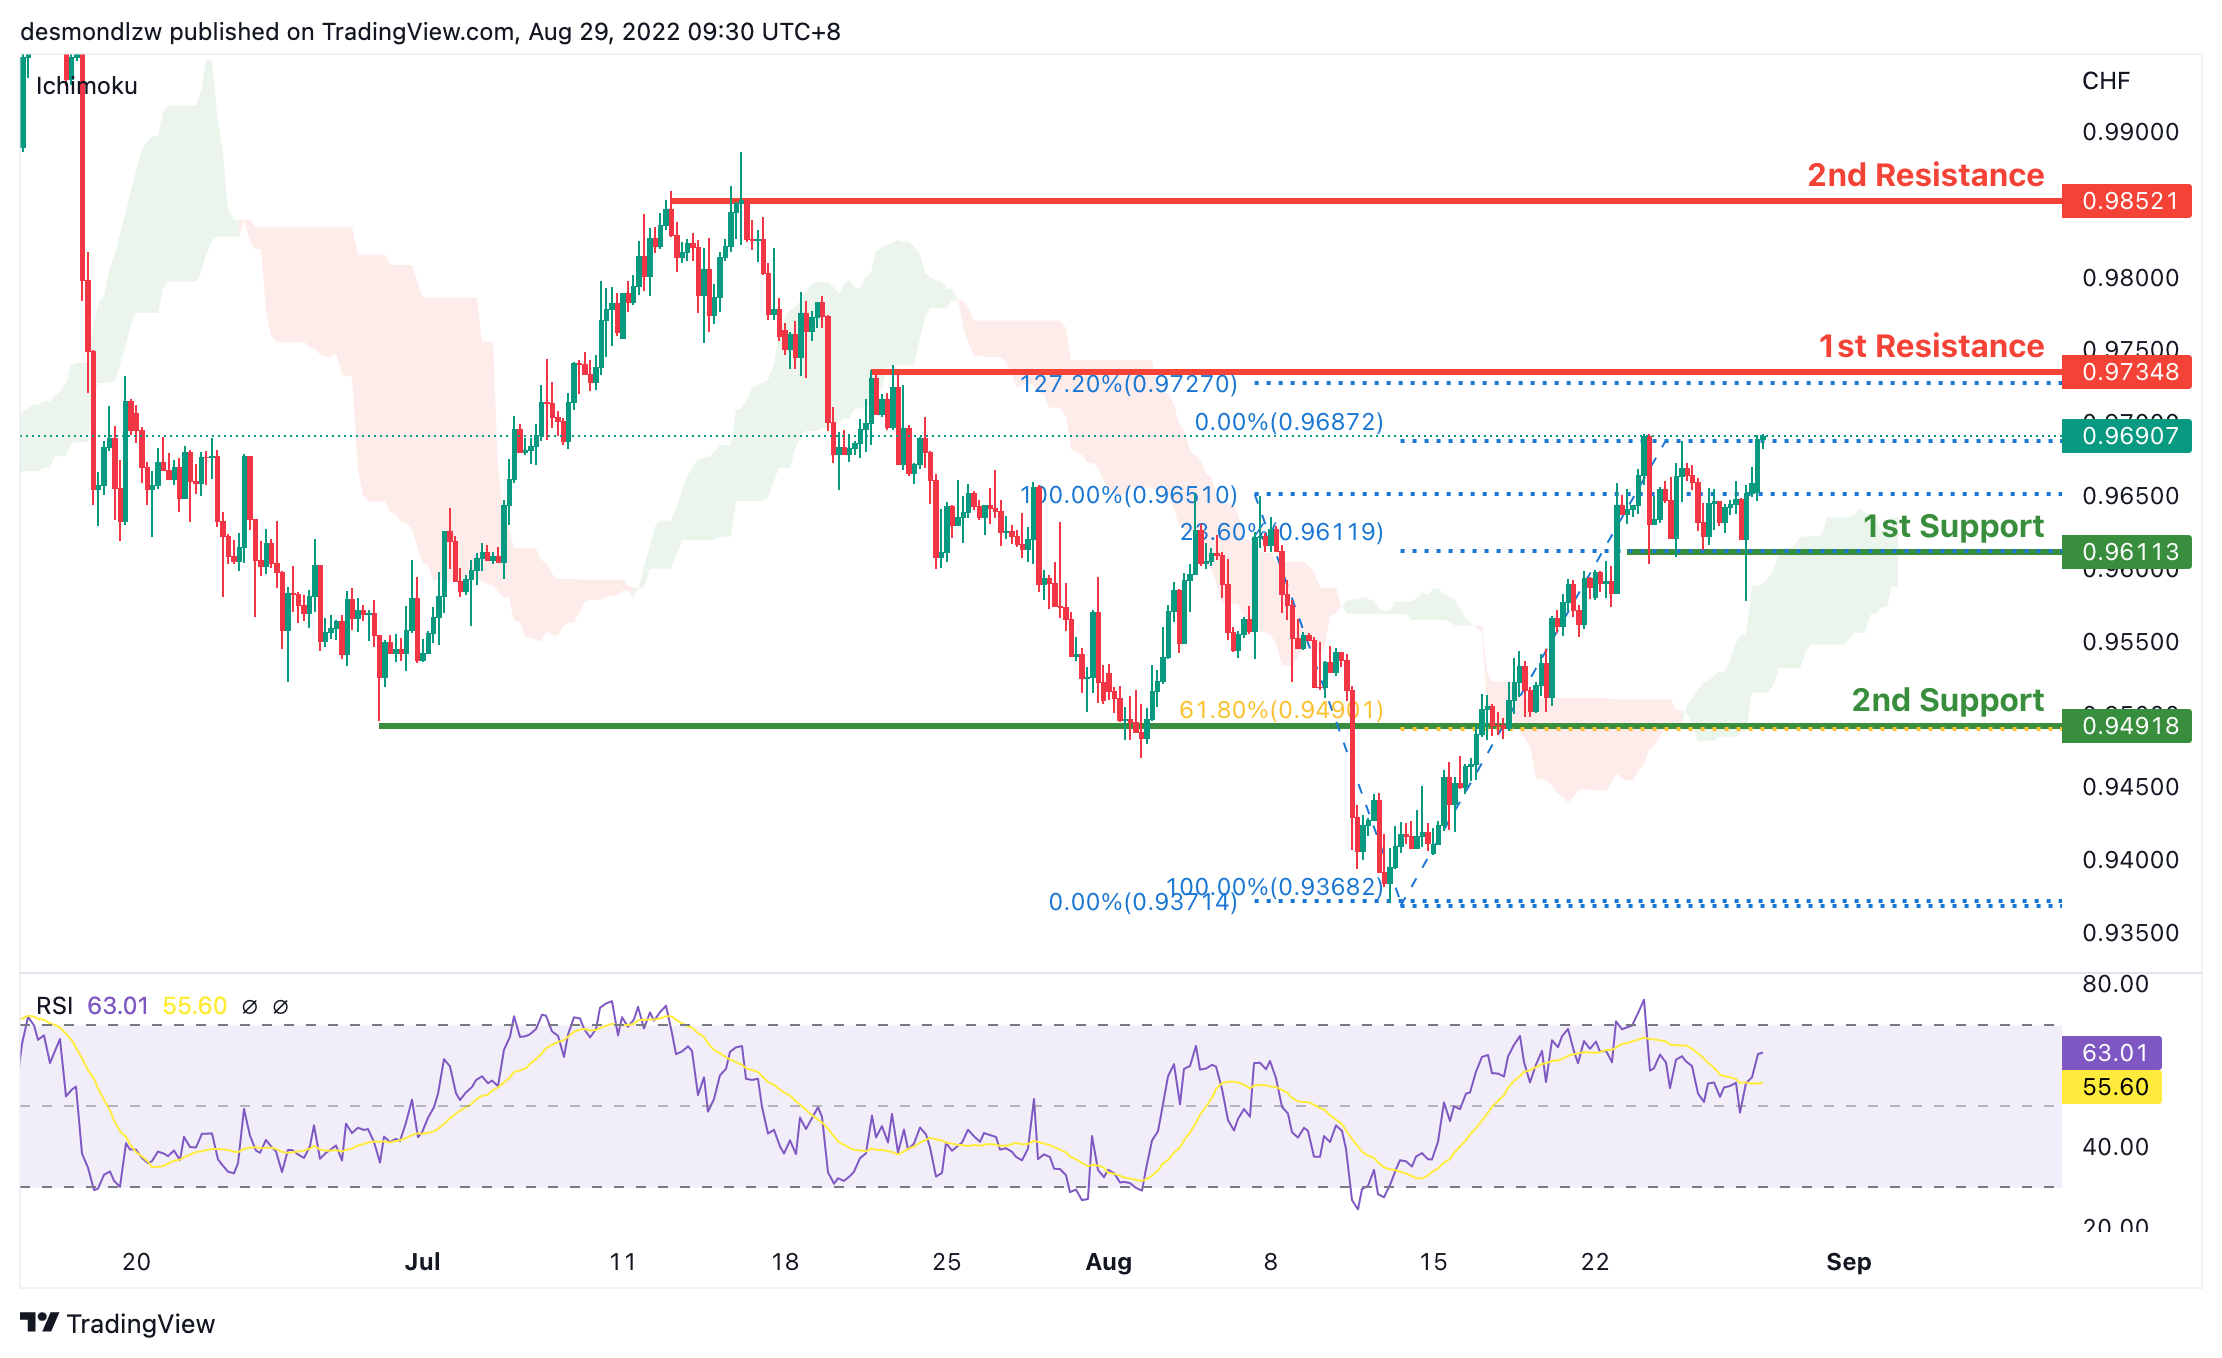
On the H4, with prices moving above the ichimoku cloud and breaking the descending trend, we are bullish bias. We’re looking at price to test the first resistance at 0.9734 where the 127.2% extension sits. If price continues with bullish momentum, it will bring price to second resistance at 0.9852. Alternatively, prices could test the intermediate support at 0.95500 where the swing low sits and then the first support at 0.9469 where the 78.6% fibonacci retracement sits
Areas of consideration
- H4 1st support at 0.9469
- H4 1st resistance at 0.9734
XAU/USD (GOLD):
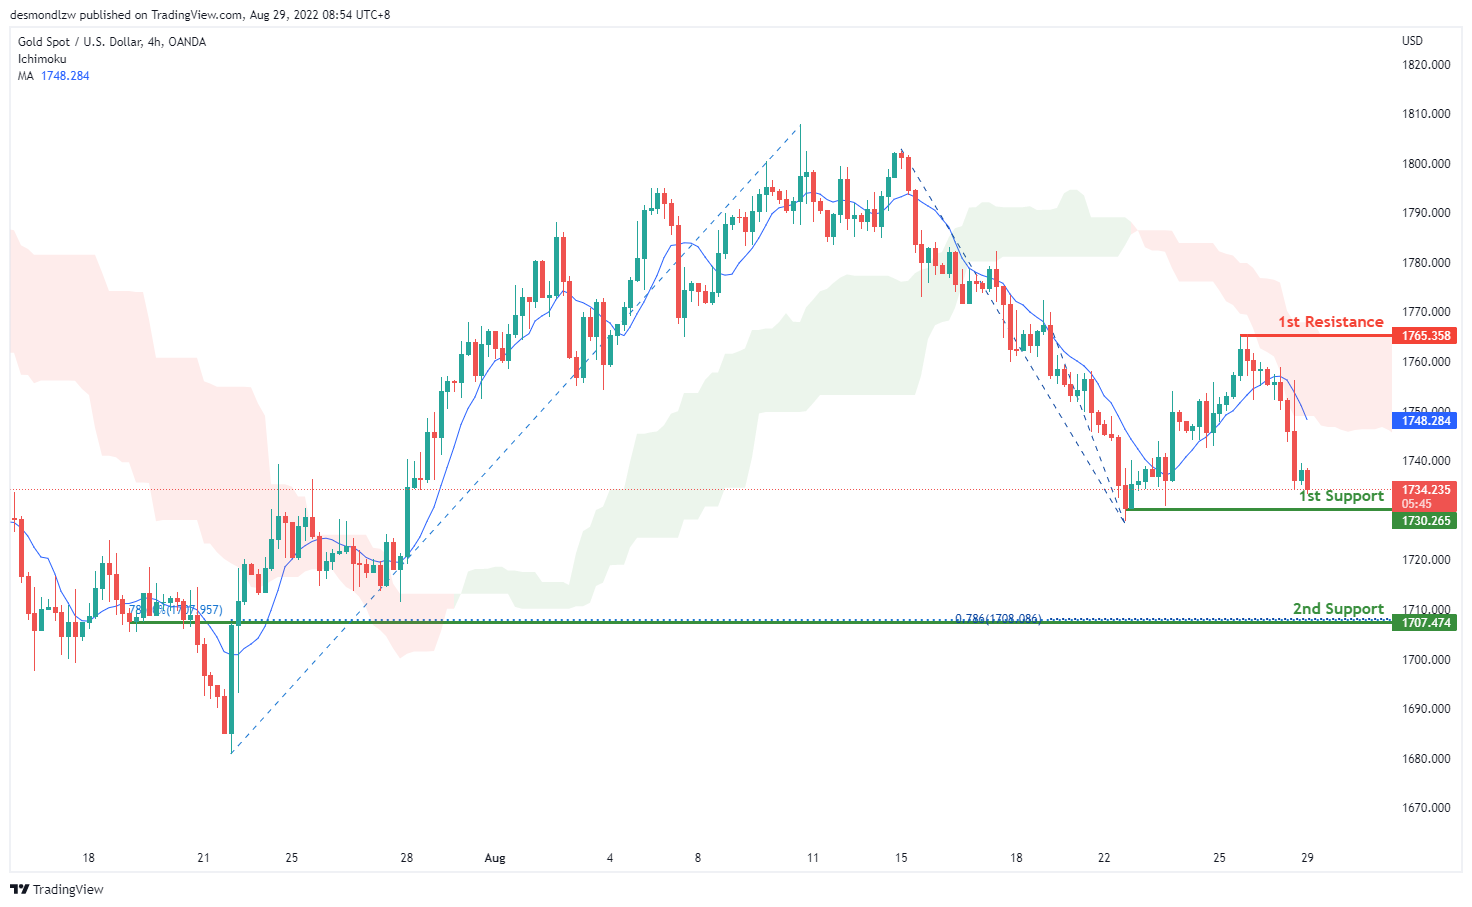
On the H4, with prices moving below ichimoku cloud and MA, we have a bearish bias that the price may drop from the 1st support at 1730.265, which is in line with the swing low to the 2nd support at 1707.474, which is in line with the 78.6% fibonacci retracement and 78.6% fibonacci projection. Alternatively, price may rise to the 1st resistance at 1765.358, where the swing high is.
Areas of consideration:
- H4 time frame, 1st support at 1730.265
- H4 time frame, 2nd support at 1707.474
AUD/USD:
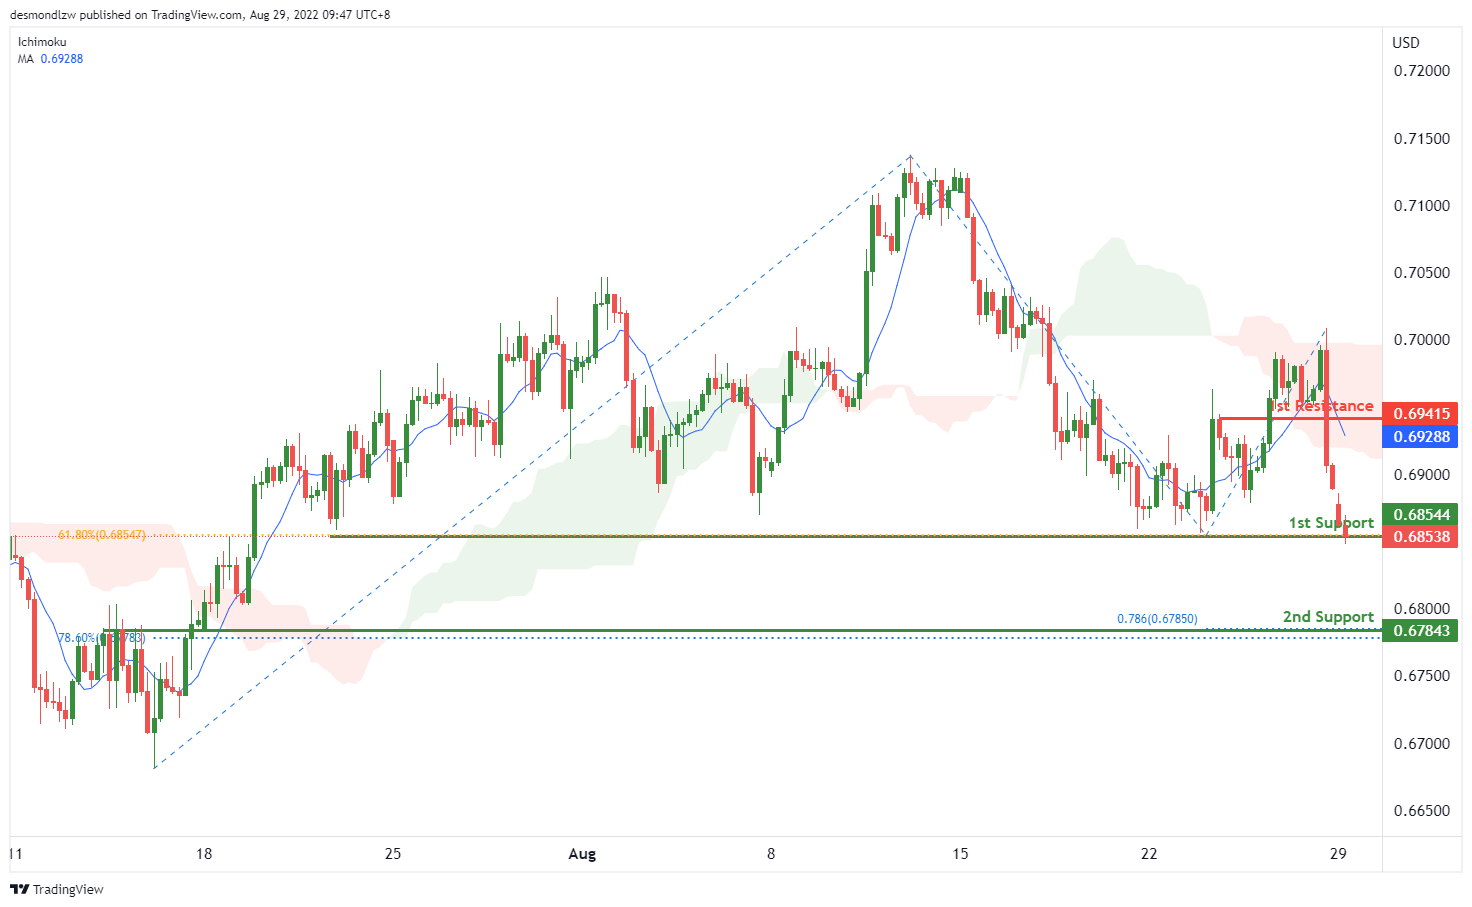
On the H4, with the price moving below the ichimoku cloud and MA, we have a bearish bias. As the price almost break the 1st support at 0.65844, we can expect the price to drop to the 2nd support at 0.67843, where the 78.6% fibonacci projection and 78.6% fibonacci retracement are. Alternatively, the price may rise to the 1st resistance at 0.69415, where the previous swing high is
Areas of consideration
- H4 1st support at 0.65844
- H4 2nd support at 0.67843
NZD/USD:
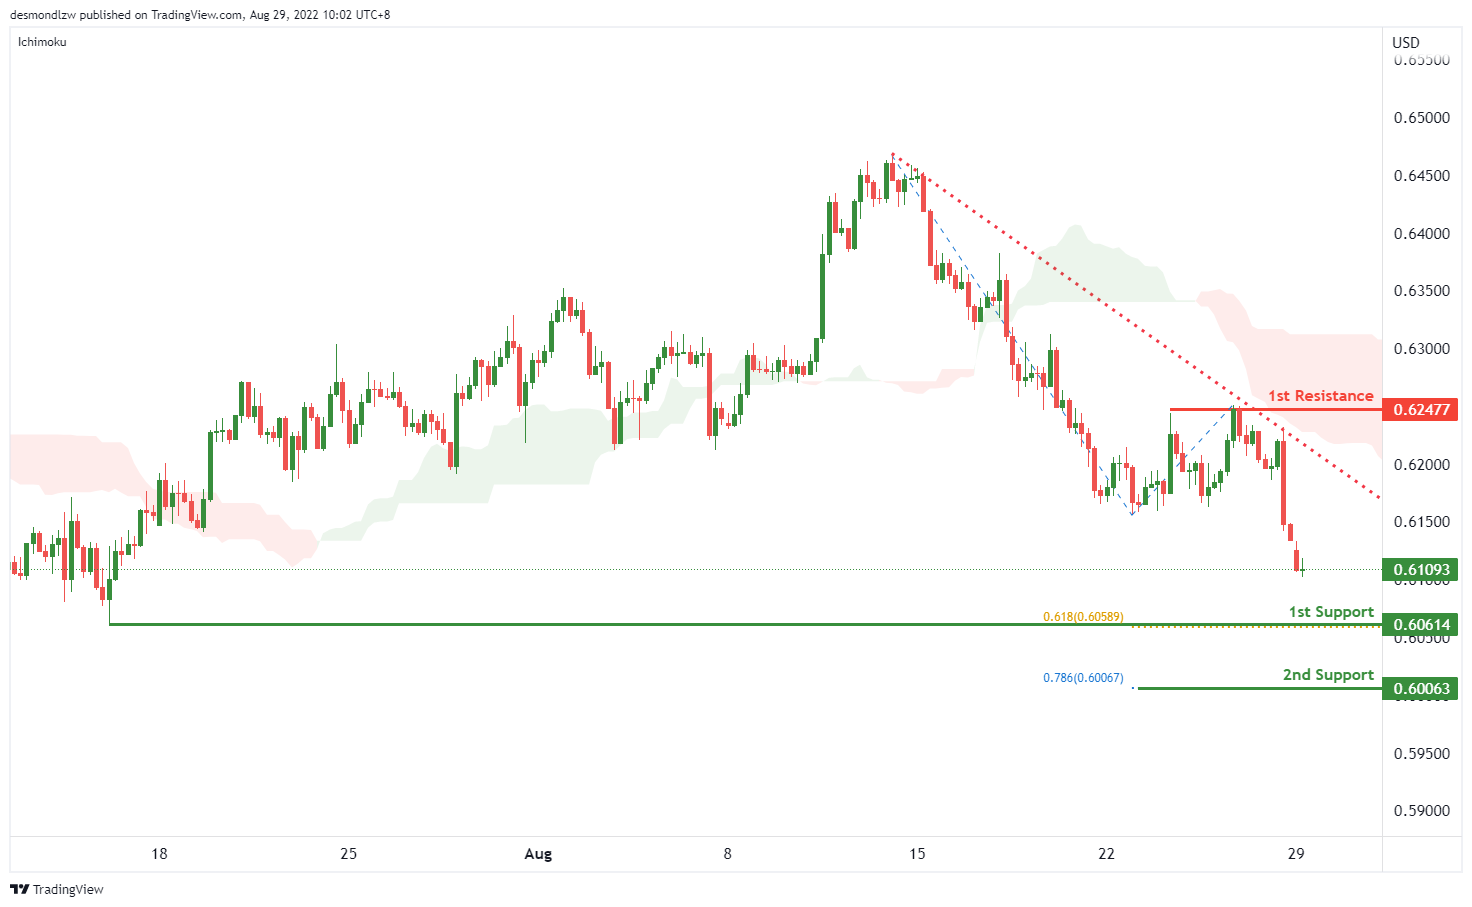
On the H4, with price moving within the descending trendline and below the ichimoku indicator, we have a bearish bias that price will drop to 1st support at 0.60617, where the swing low and 61.8% fibonacci projection are. If the price breaks the 1st support, we can expect the price drop to the 2nd support at 0.60063, where the 78.6% fibonacci projection is. Alternatively, price could rise to 1st resistance at 0.62477, which is in line with the swing highs.
Areas of consideration:
- H4 time frame, 1st support at 0.60617
- H4 time frame, 2nd support at 0.60063
USD/CAD:
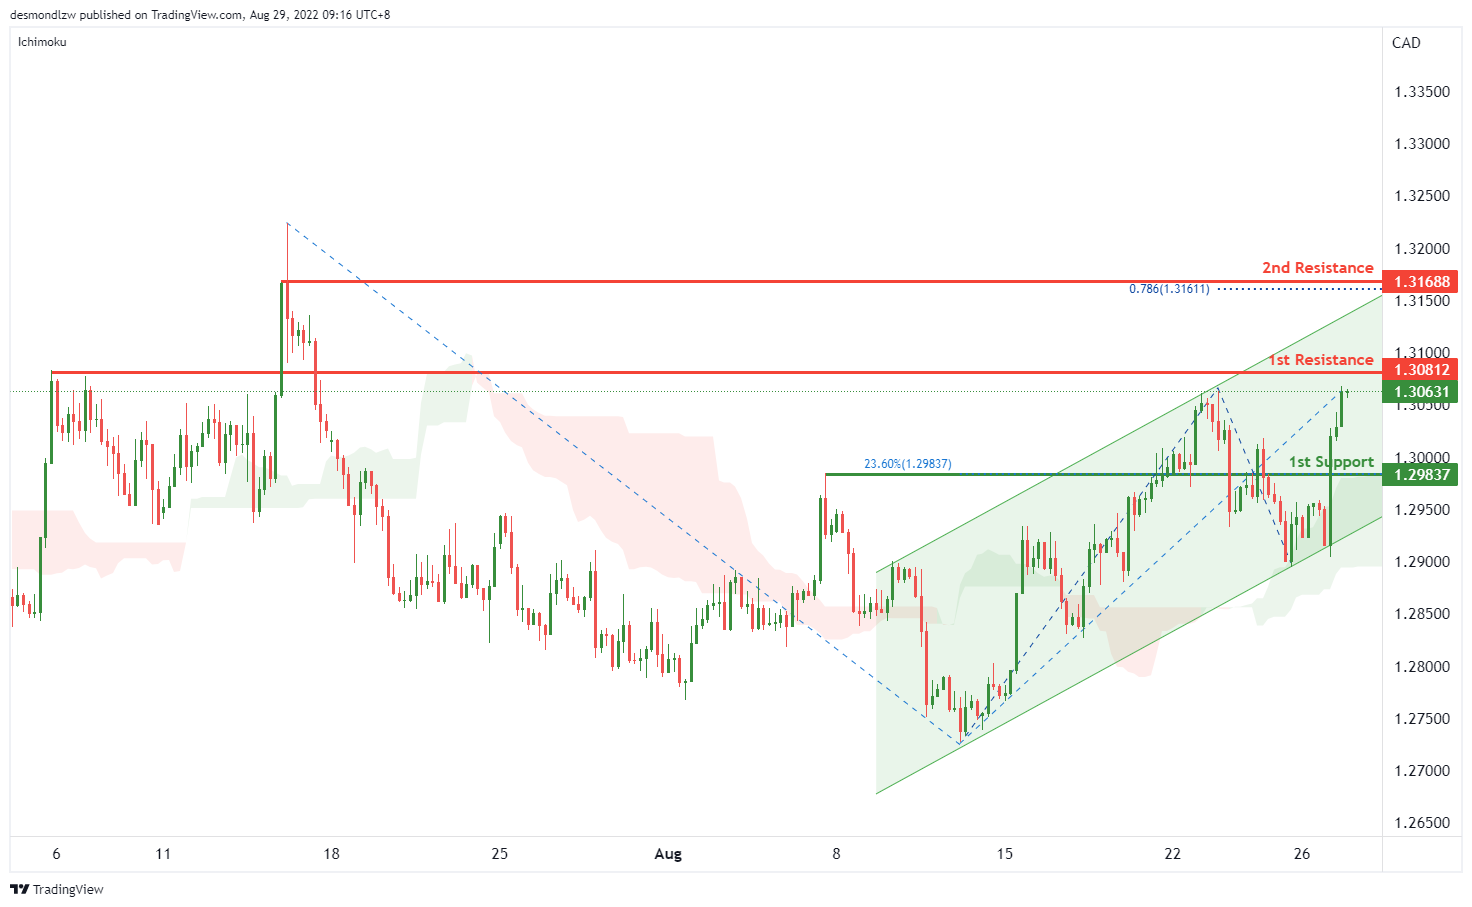
On the H4, with the price within the ascending channel, above ichimoku cloud and MACD indicators are above zero, we have a bullish bias that the price may rise from the 1st resistance at 1.30812, where the swing high is to the 2nd resistance at 1.31688, where the swing high and 78.6% fibonacci projection are. Alternatively, price could drop to the 1st support at 1.30622, where the 23.6% fibonacci retracement is.
Areas of consideration:
- H4 time frame, 1st resistance at 1.30812
- H4 time frame, 2nd resistance at 1.31688
OIL:
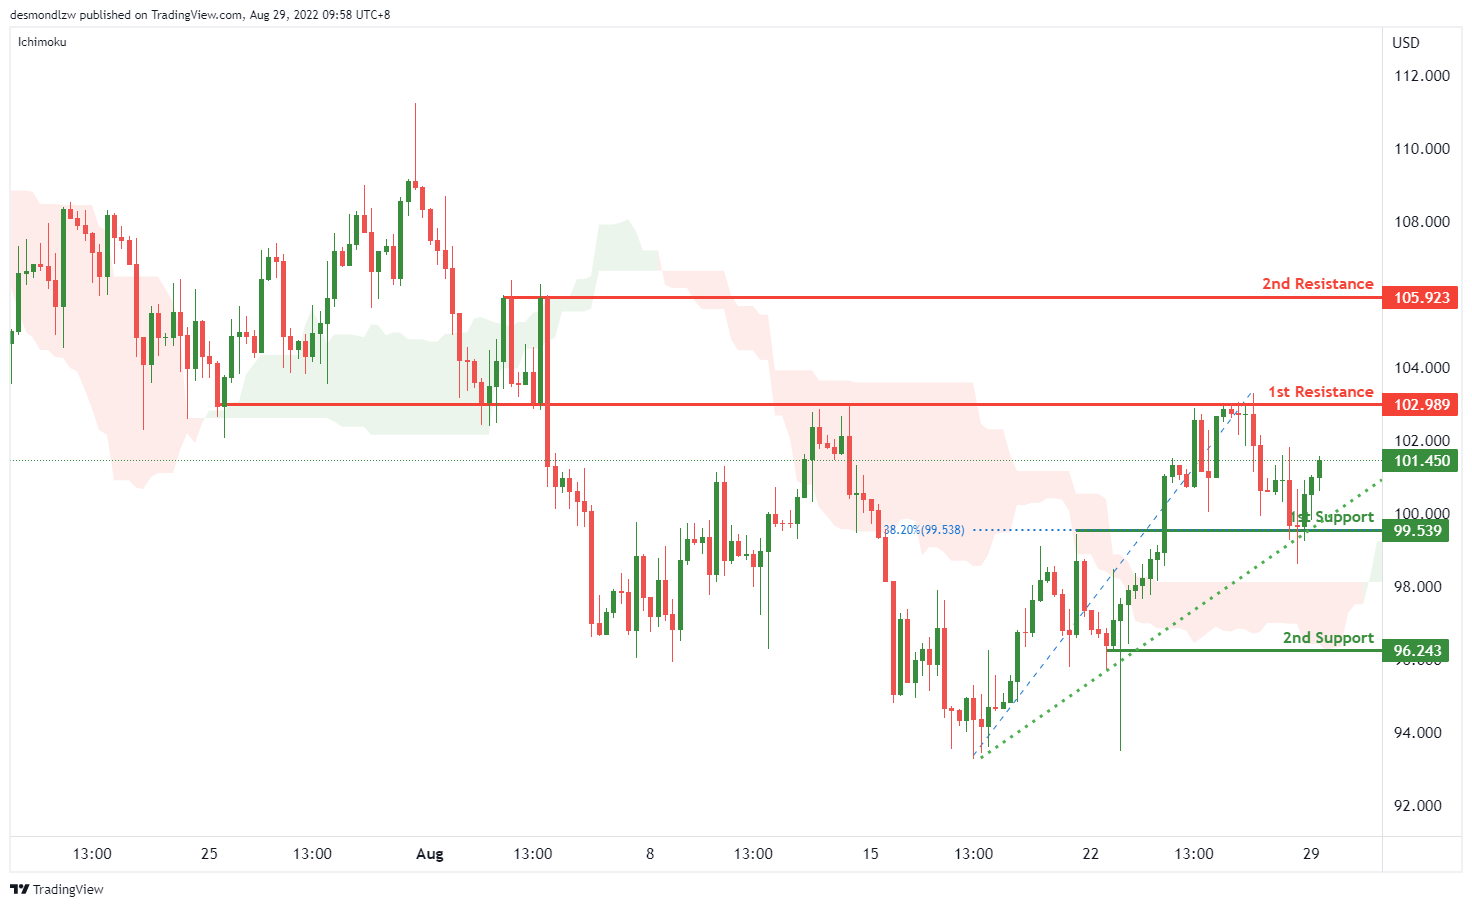
On the H4, with price moving within the ascending trendline and above ichimoku cloud, we have a bullish bias that the price may rise from the, which is in line with the 23.6% fibonacci retracement to the 1st resistance at 102.989, where the overlap resistance is. If the price break the 1st resistance, we can expect the price to rise to the 2nd resistance at 105.923, where the previous swing highs are. Alternatively, the price may drop to the 2nd support at 96.243, which is in line with the swing low support.
Areas of consideration:
- H4 time frame, 1st support at 99.539
- H4 time frame, 1st resistance at 102.989
Dow Jones Industrial Average:
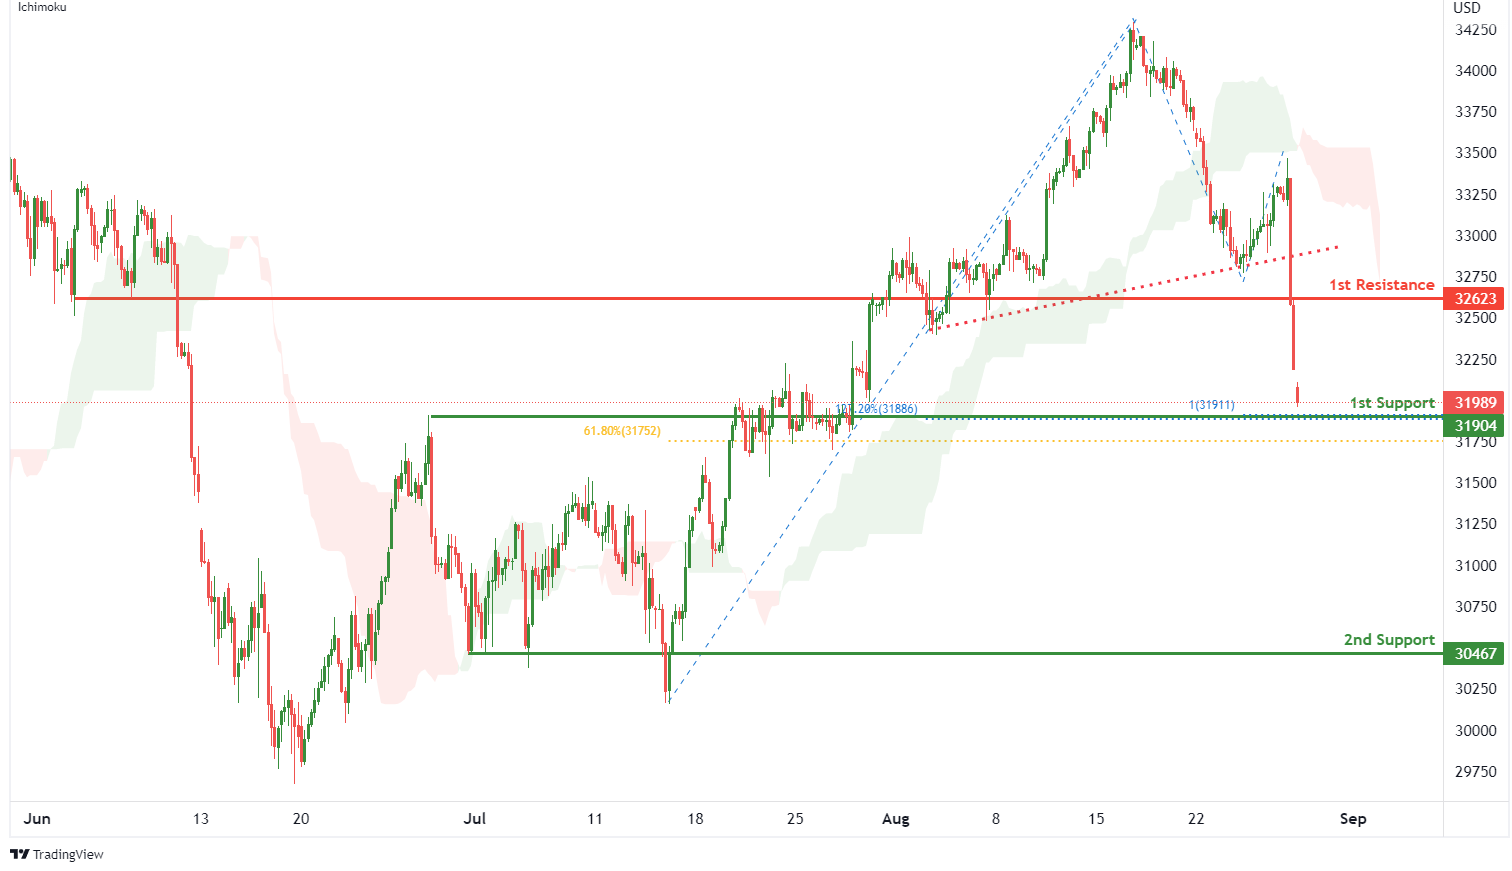
On the H4, with price breaking the ascending trendline and moving below the ichimoku indicator, ,we have a bearish bias that price will drop to 1st support at 31904 where the pullback support, 100% fibonacci projection, 61.8% fibonacci retracement and 127.2% fibonacci extension are. Should price break 1st support, we would expect bearish momentum to carry price to 2nd support at 30467 where the pullback support is. Alternatively, price could rise to 1st resistance at 32623 in line with pullback resistance.
Areas of consideration:
- H4 time frame, 1st resistance of 32623
- H4 time frame, 1st support at 31904
DAX:
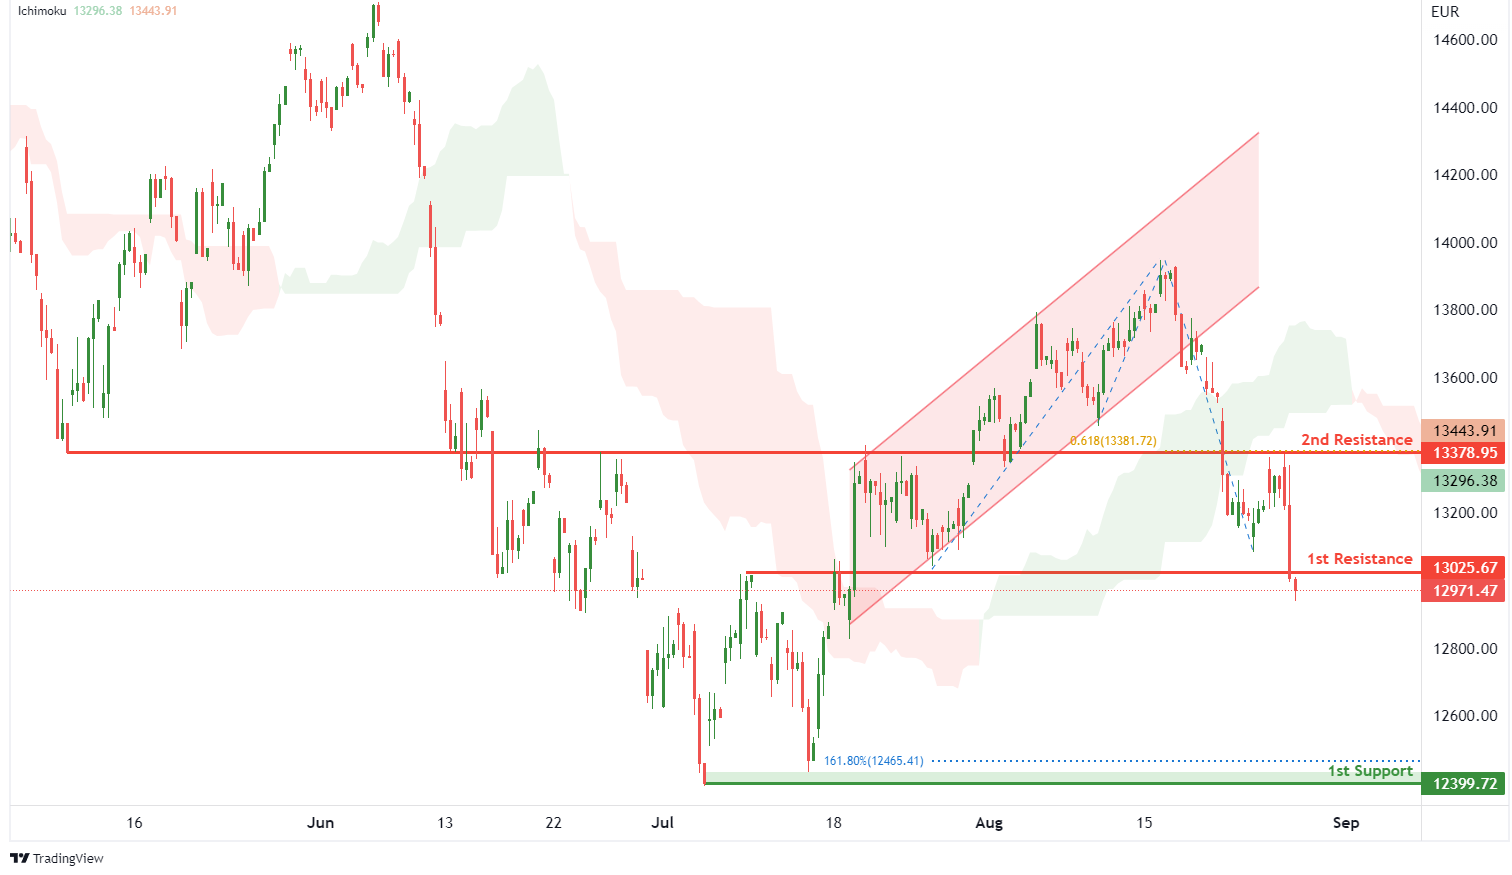
On the H4, with price breaking out of an ascending channel and moving below the ichimoku indicator, we have a bearish bias that price will drop from 1st resistance at 13025.67 where the pullback resistance is to the 1st support at 12399.72 where the swing low support and 161.8% fibonacci extension are. Alternatively, price could break 1st resistance and rise to 2nd resistance at 13378.95 where the overlap resistance and 61.8% fibonacci projection are.
Areas of consideration:
- H4 time frame, 1st resistance of 13025.67
- H4 time frame, 1st support at 12399.72
ETHUSD:
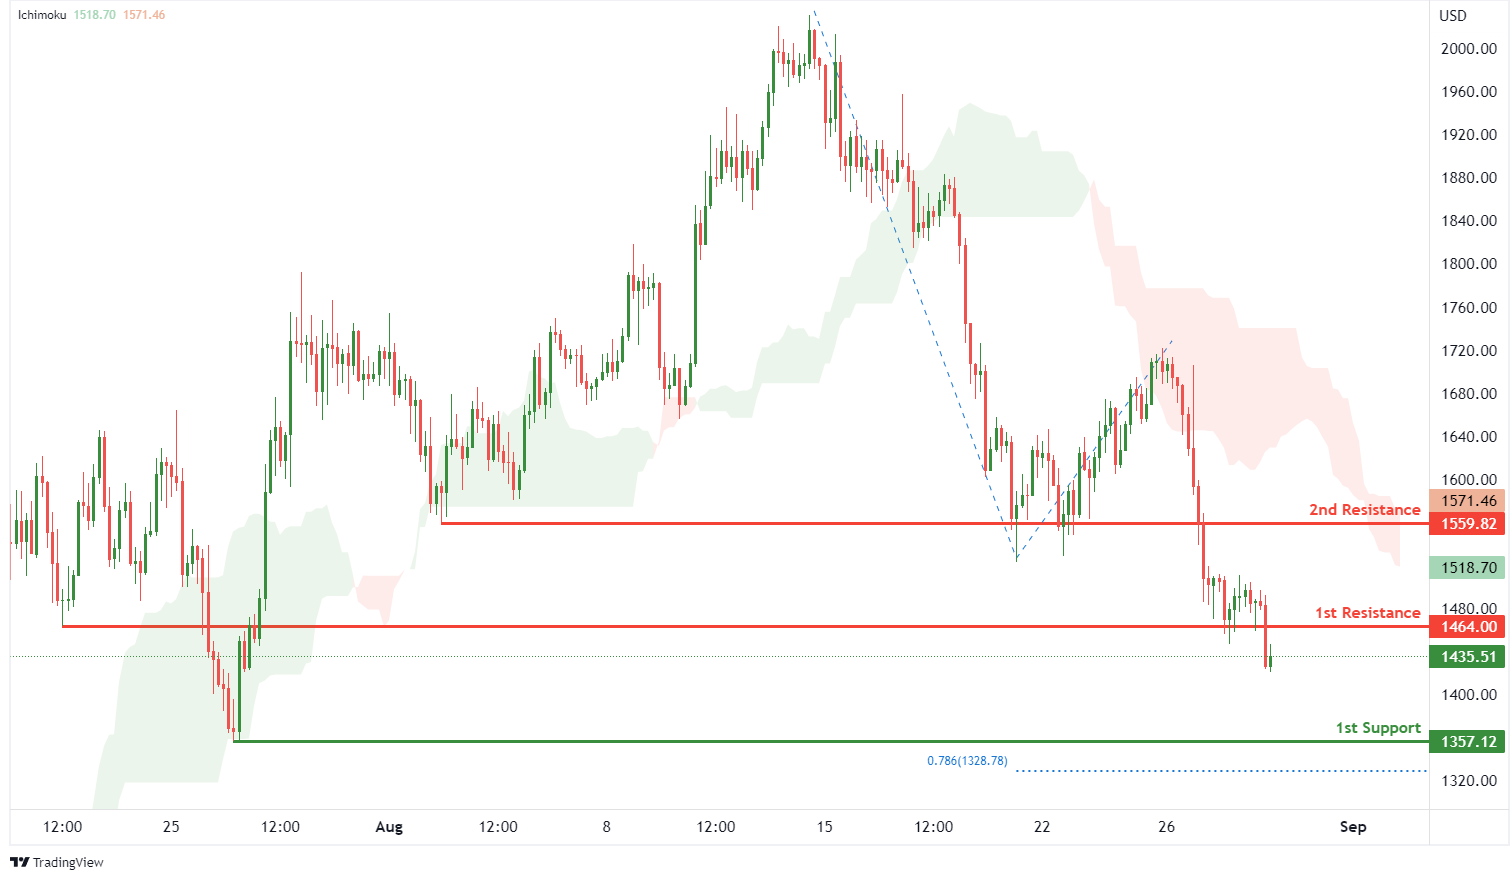
On the H4, with price moving below the ichimoku indicator, we have a bearish bias that price will drop from 1st resistance at 1464.00 where the pullback resistance is to the 1st support at 1357.12 where the swing low support and 78.6% fibonacci projection are. Alternatively, price could break 1st resistance structure and rise to 2nd resistance at 1559.82 where the overlap resistance is.
Areas of consideration:
- H4 time frame, 1st resistance of 1464.00
- H4 time frame, 1st support at 1357.12
BTCUSD:
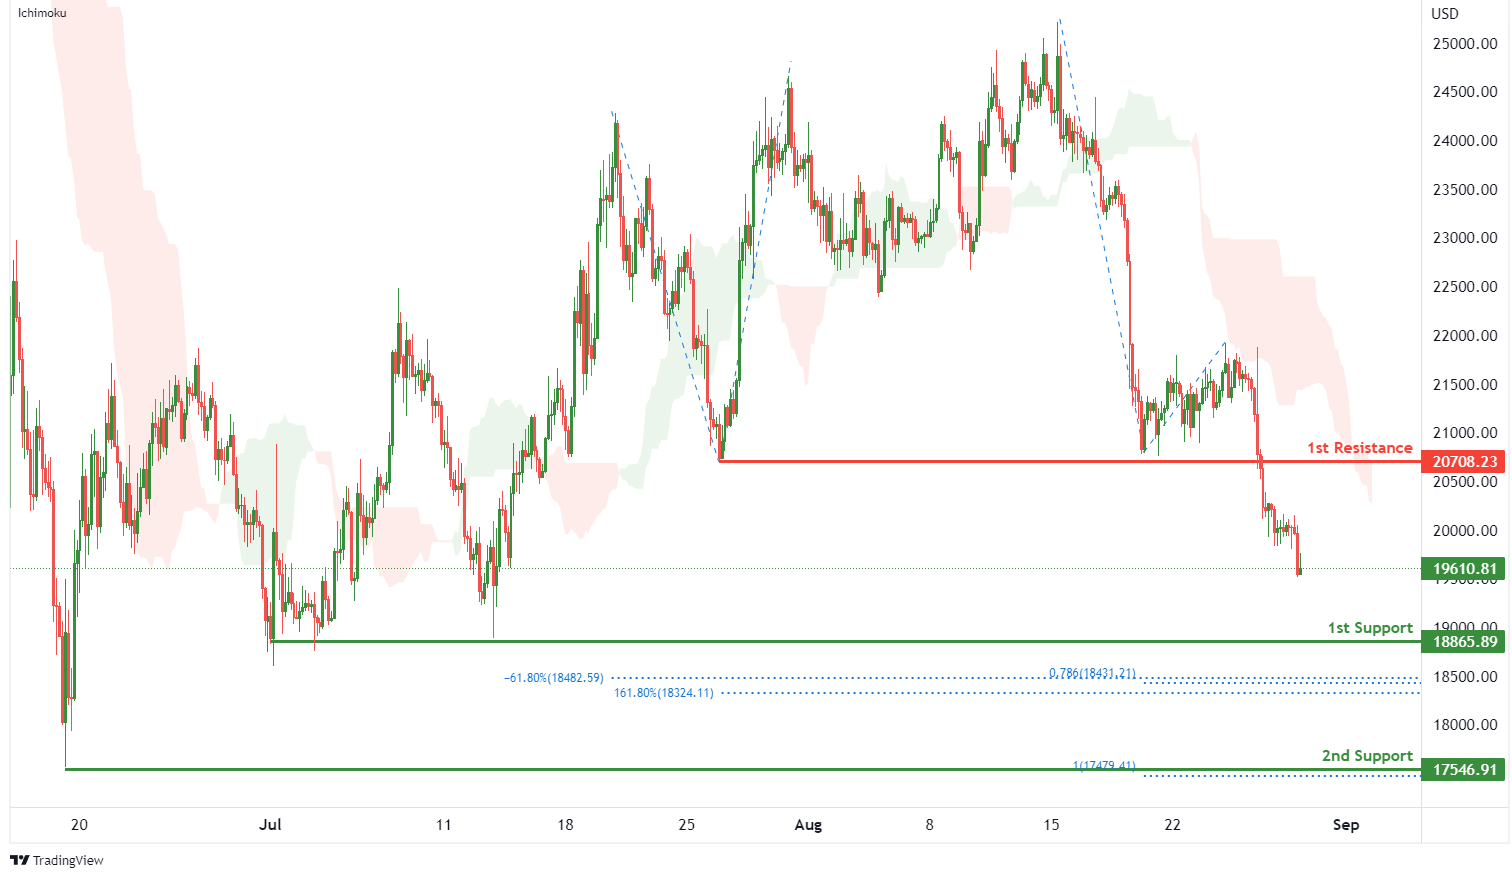
On the H4, with price moving below an ichimoku indicator, we have a bearish bias that price will drop to 1st support 18865.89 where the overlap support, -61.8% fibonacci expansion, 161.8% fibonacci extension and 78.6% fibonacci projection are. Should price break 1st support, we have a bearish bias that price will drop to 2nd support at 17546.91 where the swing low support and 100% fibonacci projection are. Alternatively, price could rise to 1st resistance at 207078.23 where the pullback resistance is.
Areas of consideration:
- H4 time frame, 1st resistance of 207078.23
- H4 time frame, 1st support at 18865.89
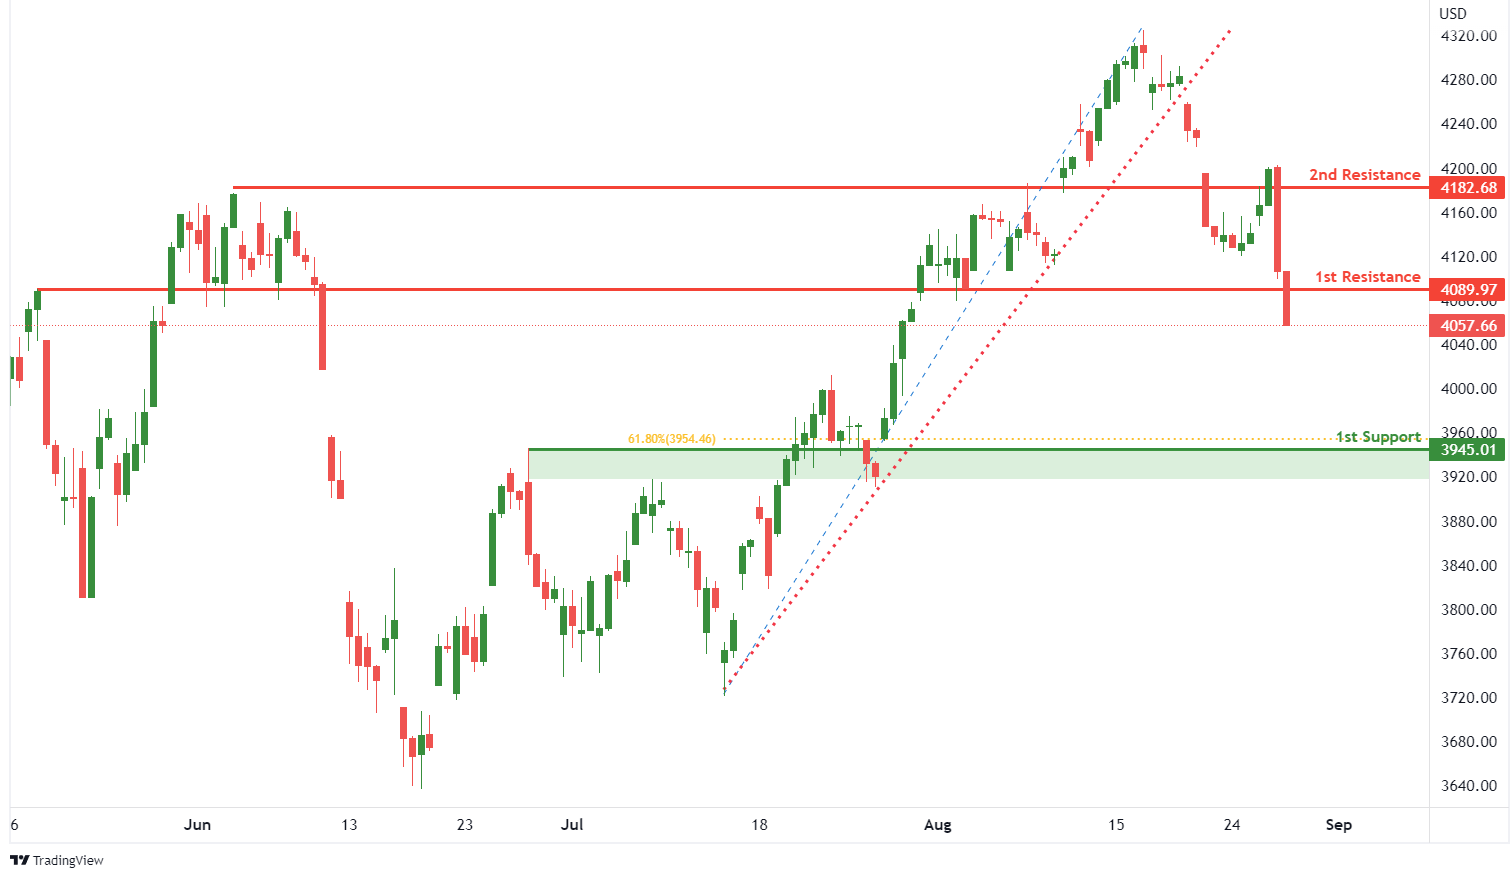
S&P 500:
On the H4, with prices breaking out of the ascending trendline, we have a bearish bias that price will drop from 1st resistance at 4089.97 where the pullback resistance is to the 1st support at 3945.01 where the pullback support and 61.8% fibonacci retracement are. Alternatively, price could rise to 2nd resistance at 4182.68 where the pullback resistance is.
Areas of consideration:
- H4 time frame, 1st resistance of 4089.97
- H4 time frame, 1st support at 3945.01
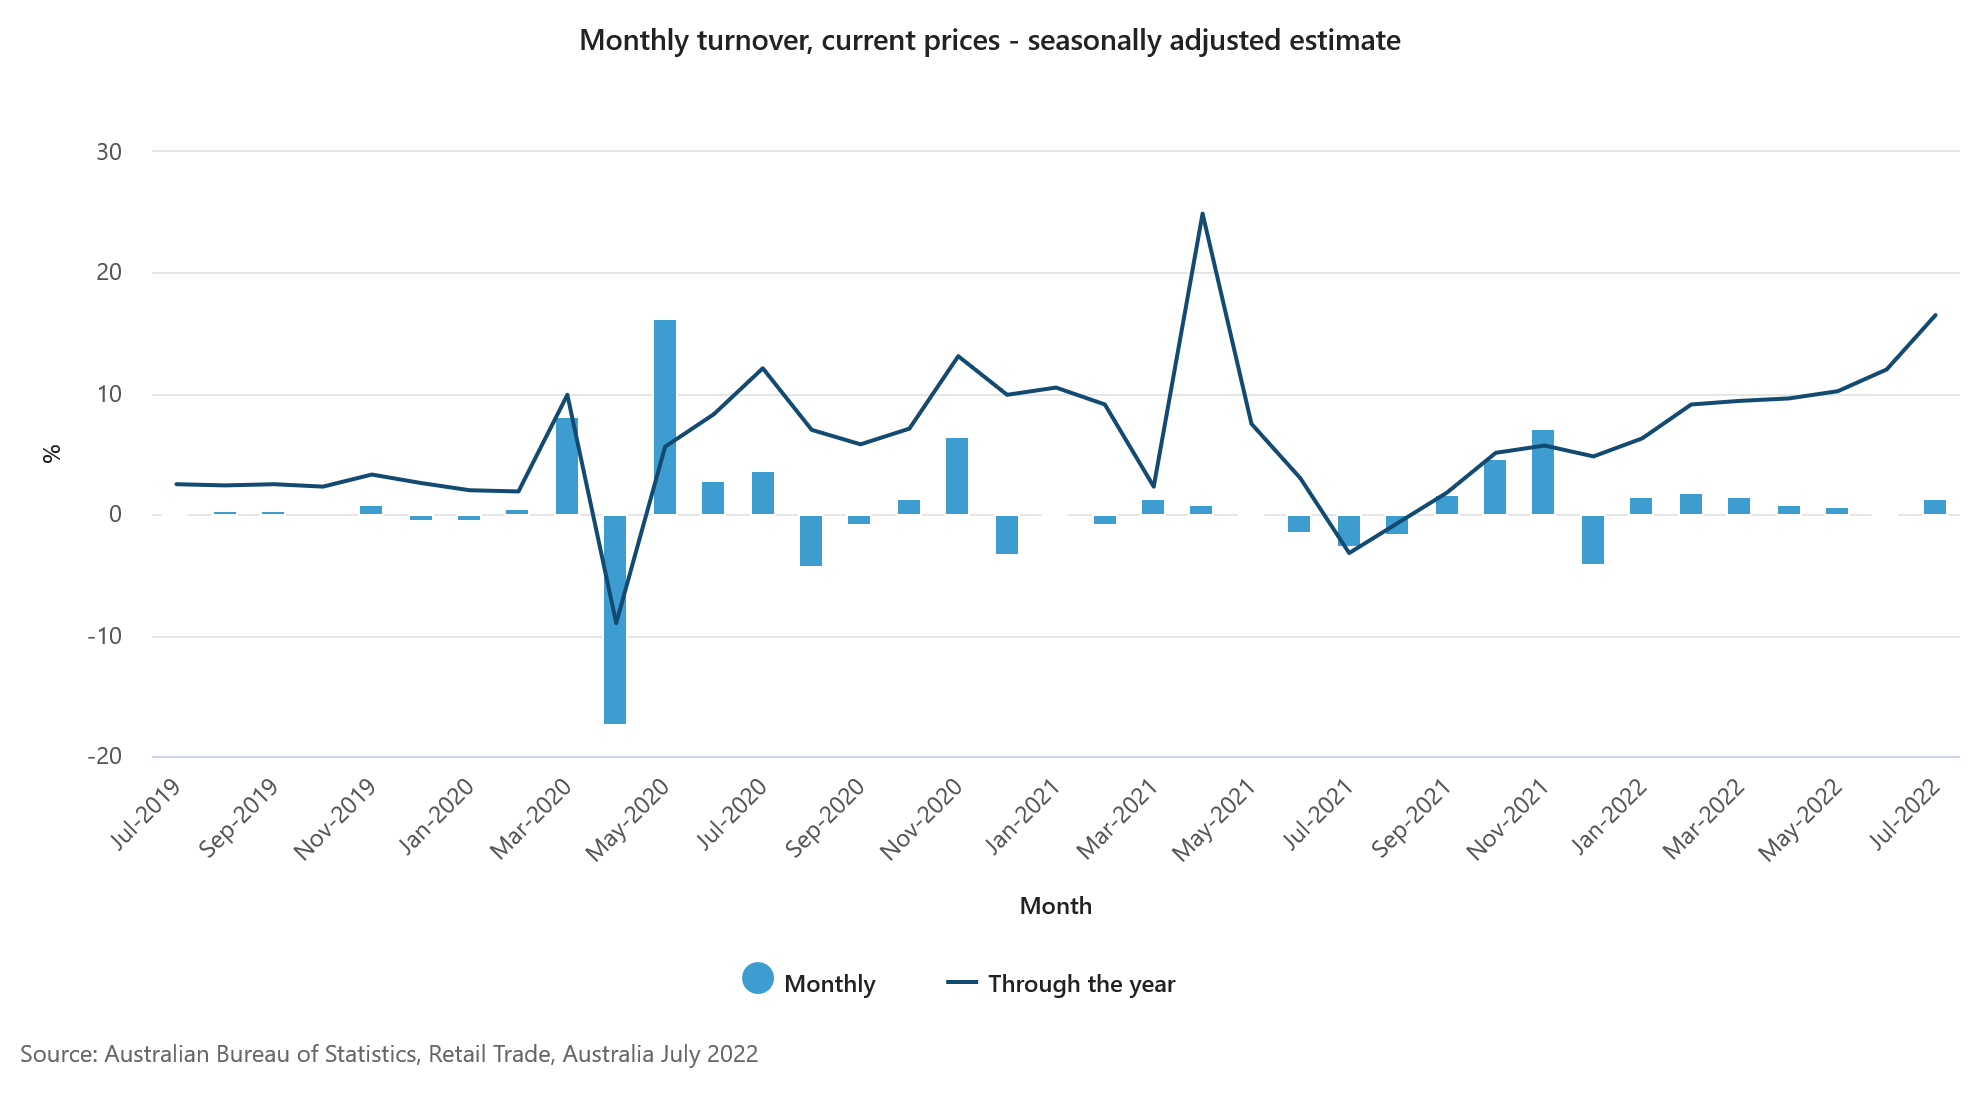
Australia retail sales rose 1.3% mom in Jul
Australia retail sales turnover rose 1.3% mom to AUD 34.67B in July, well above expectation of 0.3% mom.
Ben Dorber, head of retail statistics at the ABS, said: "After slowing growth in recent months, the 1.3 per cent rise in July was the largest since the 1.6 per cent rise in March 2022.
"Turnover rose in five of the six retail industries in July 2022. This shows that, despite cost-of-living pressures, households are continuing to spend."
BoJ Kuroda: We have no choice other than continued monetary easing
BoJ Governor Haruhiko Kuroda said over the weekend, "somewhat miraculously, now we have 2.4% inflation. But almost wholly caused by the international commodity price hike, energy and food."
"So we expect that by the end of this year, maybe inflation rate may approach 2 or 3%, but next year, inflation rate again decelerate toward 1.5%," he said.
"We have no choice other than continued monetary easing until wages and prices rise in a stable and sustainable manner."
SNB Jordan: Inflation is increasingly spreading to goods and services
SNB Chairman Thomas Jordan said over the weekend, "There are signs that inflation is increasingly spreading to goods and services that are not directly affected by the pandemic or the war in Ukraine."
"In fact, it appears that in the current environment, higher prices are being passed on more quickly -- and are also being more readily accepted -- than was the case until just recently," he added.
Inflation expectations "have also been moving upwards slightly" and wage growth is "gathering momentum," Jordan said, cautioning that the "longer-term outlook for monetary policy is also subject to high uncertainty."
"In particular, a decline in global economic integration could increase companies' price-setting power, meaning that they would be able to push through price increases more easily," he said.
ECB policymakers wants forceful actions in September
ECB board member Isabel Schnabel said, "Both the likelihood and the cost of current high inflation becoming entrenched in expectations are uncomfortably high. In this environment, central banks need to act forcefully."
Governing Council member Martins Kazaks said, "Frontloading rate hikes is a reasonable policy choice. We should be open to discussing both 50 and 75 basis points as possible moves. From the current perspective, it should at least be 50."
Another Governing Council member Francois Villeroy de Galhau said ECB needs to be at "neutral rate" before the end of the year, "after another significant step in September... Have no doubt that we at the ECB would if needed raise rates further beyond normalization: bringing inflation back to 2% is our responsibility; our will and our capacity to deliver on our mandate are unconditional."
Governing Council member Olli Rehn said, "The reality is that we have excessively high inflation globally, also in Europe -- that's why it's action time. The next step will be a significant move in September, depending on the incoming data and the inflation outlook."
EUR/USD Bears Target Fresh Lows, Dollar Rallies
Key Highlights
- EUR/USD failed to recover above the parity level and declined.
- It broke a key rising channel with support at 0.9940 on the 4-hours chart.
- GBP/USD is accelerating lower below the 1.1800 support zone.
- AUD/USD and NZD/USD are also gaining bearish momentum.
EUR/USD Technical Analysis
The Euro attempted a recovery wave from the 0.9900 zone against the US Dollar. EUR/USD moved above the 0.9950 and 0.9980 resistance levels, but upsides were limited.
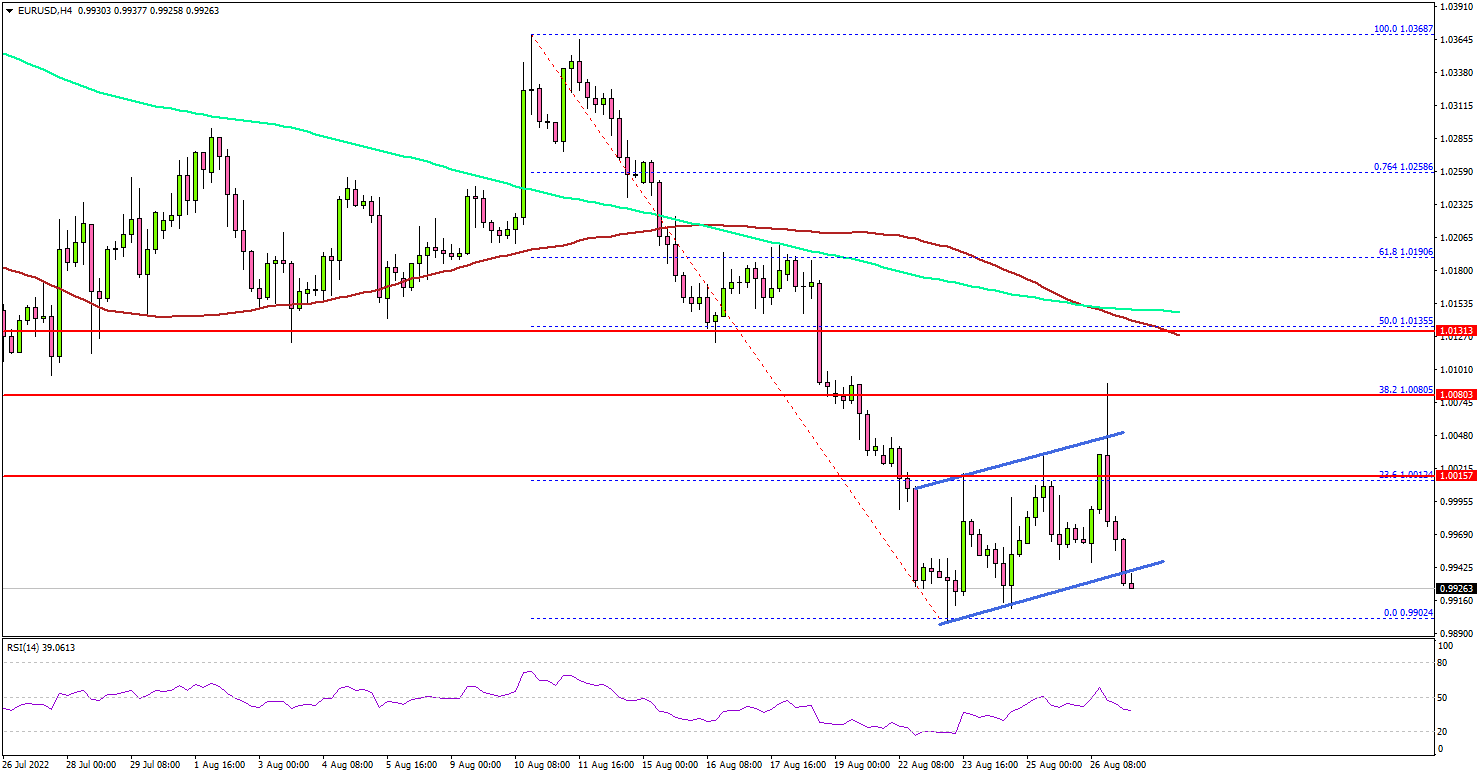
Looking at the 4-hours chart, the pair settled below the 1.0050 level, the 100 simple moving average (red, 4-hours), and the 200 simple moving average (green, 4-hours).
Recently, it saw a minor upward move above the 1.0000 resistance zone. However, the bears were active near the 1.0080 level. It failed to clear the 38.2% Fib retracement level of the downward move from the 1.0368 swing high to 0.9902 low.
It started a fresh decline below the 1.0000 support. There was a break below a key rising channel with support at 0.9940 on the same chart.
The pair is now approaching the 0.9900 support zone. If there is a downside break below the 0.9900 support, the pair could decline towards the 0.9850 support. Any more losses might call for a move towards 0.9720.
Conversely, the pair might rise again above 0.9950. On the upside, the pair is facing resistance near the 1.0000 level. The next major resistance is near the 1.0080 level. A clear move above the 1.0080 resistance might send the pair higher towards the 1.0120 level or the 100 simple moving average (red, 4-hours).
The 50% Fib retracement level of the downward move from the 1.0368 swing high to 0.9902 low is also near the 1.0135 zone to act as a resistance.
Looking at GBP/USD, the pair struggled to clear the 1.1900 level and started a fresh decline below the 1.1800 support zone.
Economic Releases
- Dallas Fed Manufacturing Business Index for August 2022 – Forecast -20.2, versus -22.6 previous.