Sample Category Title
GBP/USD Could Extend Losses, UK Employment Report Next
Key Highlights
- GBP/USD started a downside correction from the 1.2280 zone.
- It traded below a key bullish trend line with support near 1.2110 on the 4-hours chart.
- EUR/USD started a downside correction after it failed to clear 1.0365.
- The UK Claimant count could change -32K in July 2022.
GBP/USD Technical Analysis
The British Pound cleared the 1.2150 resistance against the US Dollar. GBP/USD surpassed the 1.2200 resistance zone before the bears appeared.
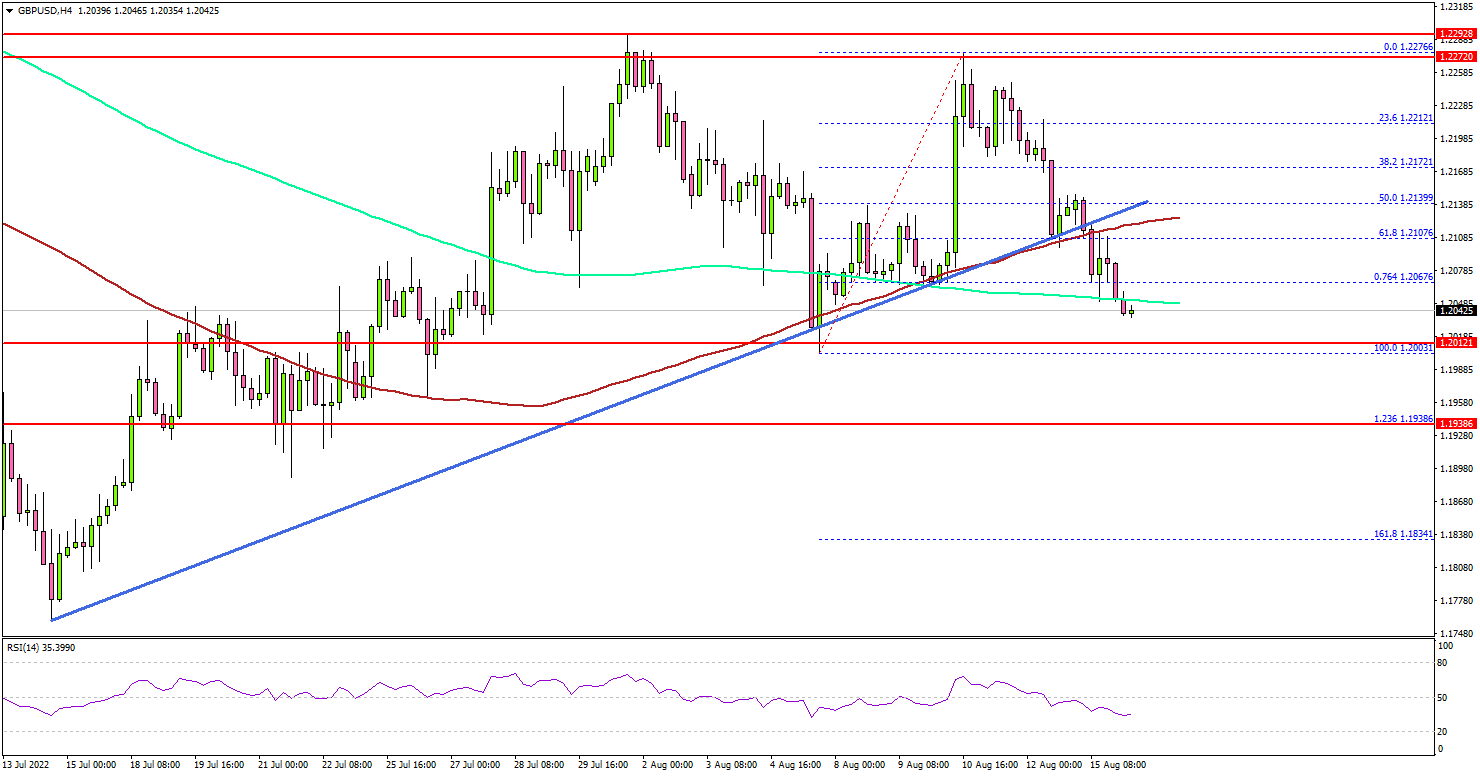
Looking at the 4-hours chart, the pair even spiked above the 1.2250 level. However, the pair failed to gain strength to clear the 1.2300 resistance. A high was formed near 1.2276 before there was a downside correction.
There was a move below the 1.2220 and 1.2200 levels. The bears pushed the pair below the 50% Fib retracement level of the upward move from the 1.2003 swing low to 1.2276 high.
Besides, it traded below a key bullish trend line with support near 1.2110 on the same chart. The pair even broke the 1.2100 level and the 100 simple moving average (red, 4-hours). Finally, it tested the 1.2050 support and the 200 simple moving average (green, 4-hours).
On the downside, there is a decent support forming near 1.2020 level. The main support is now forming near the 1.2000 level. A downside break below the 1.2000 support might push the pair in a negative zone.
The next major support is near the 1.1935 level. Any more losses might send the pair towards the 1.1880 zone. On the upside, the pair is facing resistance near the 1.2140 level.
The next major resistance is near the 1.2170 level. A clear move above the 1.2170 resistance might send the pair higher towards the 1.2250 level. The next major resistance is 1.2275, above which the pair could accelerate higher. In the stated case, the pair could rise towards the 1.2350 resistance zone in the near term.
Looking at EUR/USD, the pair started a downside correction below the 1.0280 support and there might be a move towards the 1.0120 support.
Economic Releases
- UK Claimant Count Change for July 2022 – Forecast -32.0K, versus -20.0K previous.
- UK ILO Unemployment Rate for June 2022 (3M) – Forecast 3.8%, versus 3.8% previous.
- Canadian Consumer Price Index for July 2022 (MoM) – Forecast +0.1%, versus +0.7% previous.
- Canadian Consumer Price Index for July 2022 (YoY) – Forecast +7.6%, versus +8.1% previous.
Elliott Wave View: Further Downside Likely in EURUSD
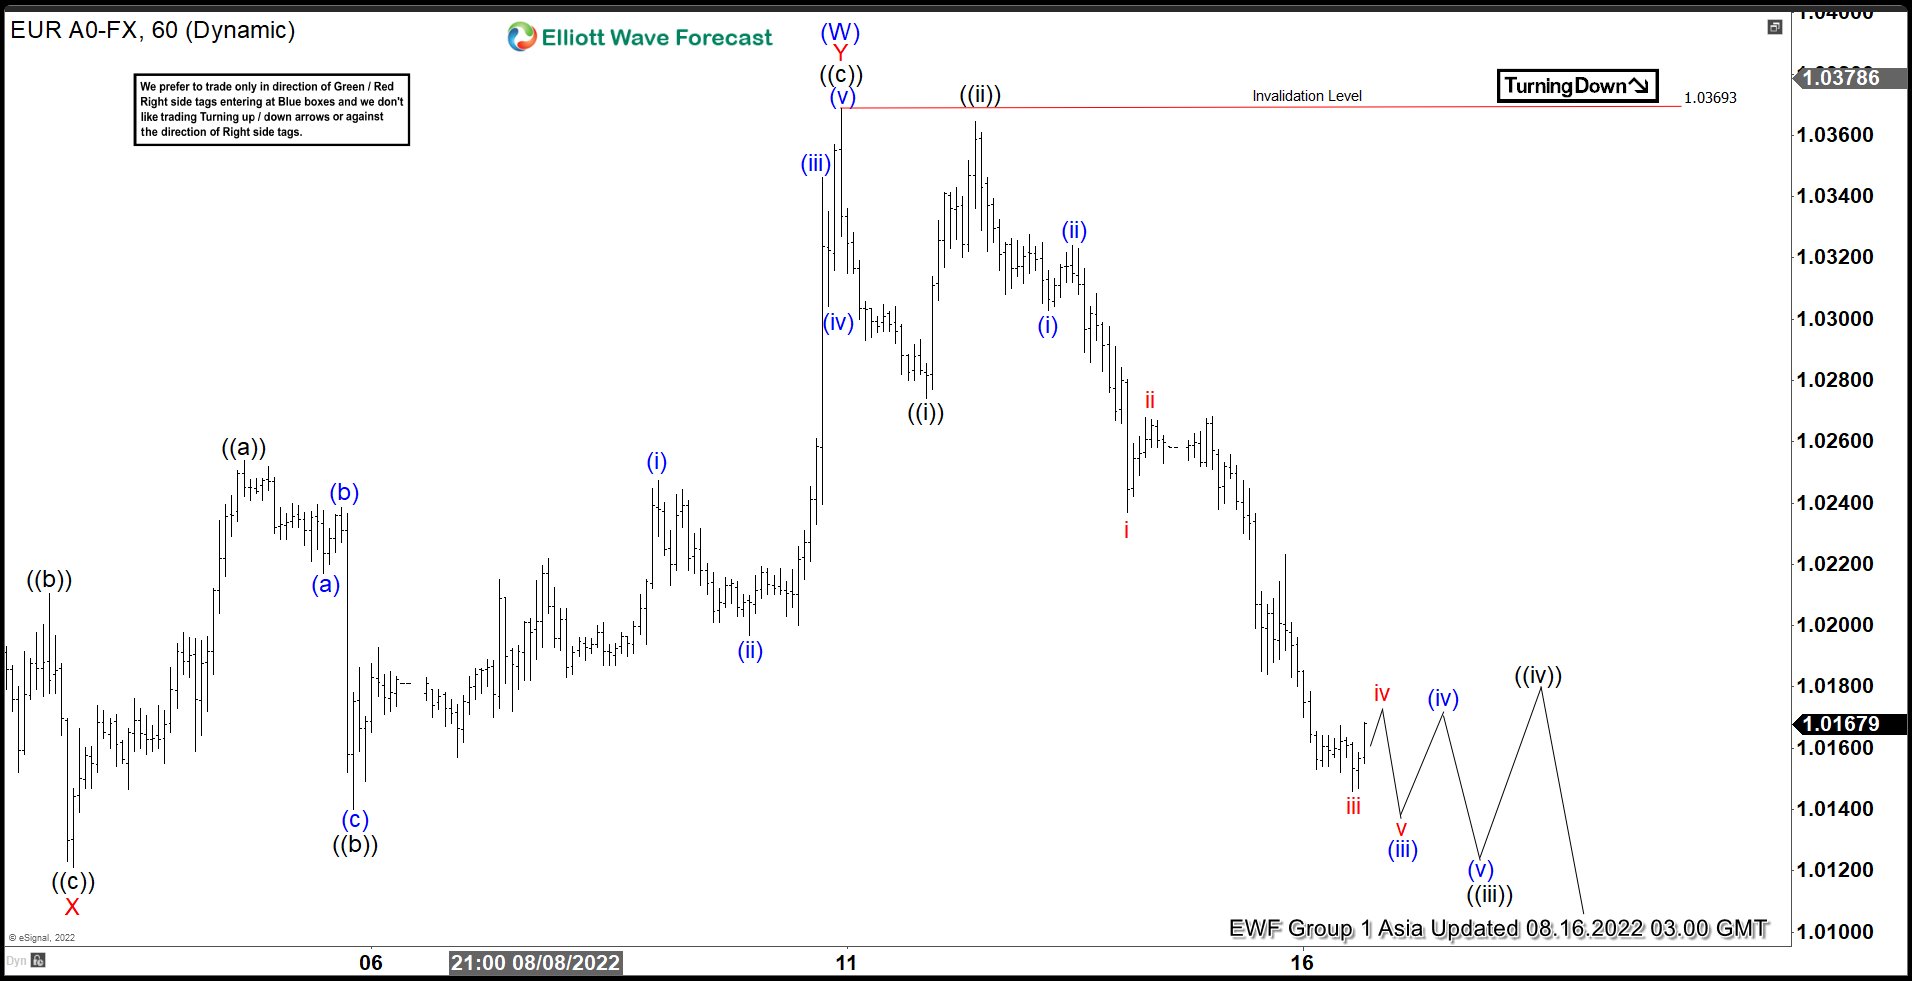
Short Term Elliott Wave View in EURUSD suggests the rally from 7.14.2022 low is unfolding as a double three Elliott Wave structure. Up from 7.14.2022 low, wave W ended at 1.02939, and pullback in wave X ended at 1.0121. Wave Y higher ended at 1.0369 and this completed wave (W) in higher degree. Wave (X) pullback is in progress as a zigzag structure. A zigzag is a 5-3-5 structure, typically labelled as an ABC. Wave A of the zigzag is currently in play as an impulsive 5 waves.
Down from wave (W), wave ((i)) ended at 1.0274, and rally in wave ((ii)) ended at 1.0364. Expect wave ((iii)) to end soon with possibly a few more marginal lows, then it should rally in wave ((iv)) in 3, 7, or 11 swing before turning lower again in wave ((v)). The 5 waves down should end wave A of (X). Pair should then rally in wave B to correct cycle from 8.10.2022 high before it resumes lower again. Short term, as far as pivot at 1.0369 high stays intact, expect rally to fail in 3, 7, or 11 swing for further downside.
EURUSD 60 Minutes Elliott Wave Chart
Eco Data 8/16/22
[php_everywhere instance="1"]
The Pound Is Losing Momentum
The Pound Sterling continues to fall against the USD on Monday; the instrument is mostly trading at 1.2117.
First of all, the Pound got under significant pressure from the USD, which has pretty much improved recently. Secondly, statistics published by the United Kingdom last week showed that inflation had a severe impact on key macroeconomic parameters.
For example, Industrial Production lost 0.9% m/m in June after adding 1.3% m/m the month before and against the expected reading of -1.3% m/m. The fact that the actual reading is better than the forecast is not comforting at all: the indicator is declining, and this decline is caused by an inflation boost. Manufacturing Production and Construction Output have also dropped. The preliminary GDP report for the second quarter showed -0.1% q/q after being +0.8% q/q the quarter before.
It’s still rather unclear how much the global price surge might hurt the British economy. However, it will be hurt, there is no doubt about it.
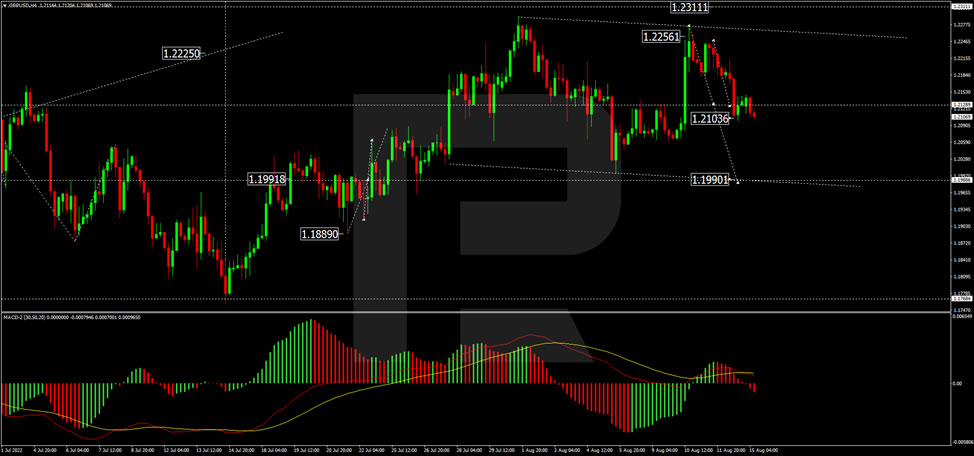
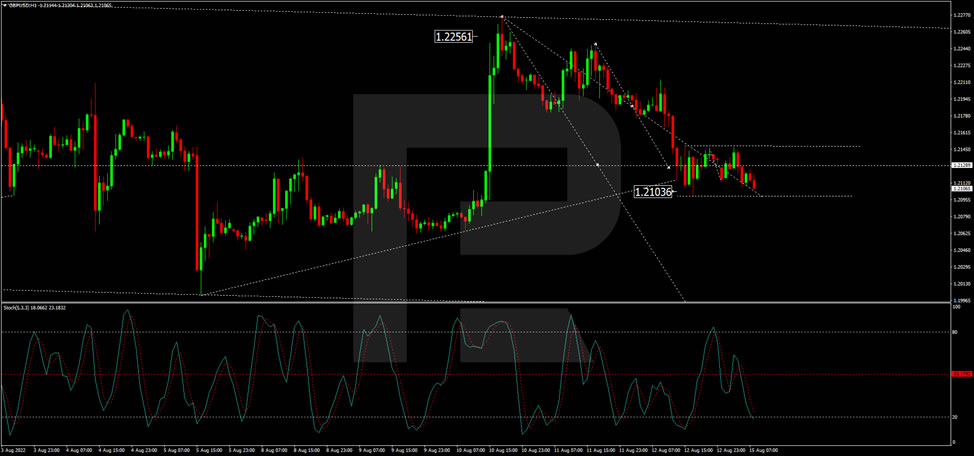
As we can see in the H4 chart, after finishing the ascending impulse at 1.2256, GBP/USD is forming a new descending structure towards 1.1990. Later, the market may start another growth to reach 1.2311 and then resume trading downwards with the target at 1.1990, or even extend this structure down to 1.1890. From the technical point of view, this scenario is confirmed by the MACD Oscillator: its signal line is moving downwards outside the histogram area and may reach new lows soon.
In the H1 chart, having completed the descending structure at 1.2133, GBP/USD is consolidating above this level. If later the price breaks this range to the upside, the market may grow towards 1.2190, and then start a new decline with the target at 1.1990; if to the downside – resume falling to reach the above-mentioned target, and then form one more ascending wave towards 1.2311. From the technical point of view, this scenario is confirmed by the Stochastic Oscillator: after breaking 50, its signal line is falling to reach 20.
Chinese Economy Slowdown Spooks Markets and Presses CNY
The statistics released from China today raise concerns about the economy’s near-term prospects, preventing the USDCNH from bucking the uptrend.
July data showed a slowdown in retail sales growth from 3.1% y/y to 2.7%, in stark contrast to the average forecasted acceleration to 5.0%. Industrial growth slowed from 3.9% YoY to 3.8% vs 4.5% expected. Fixed-asset investment slowed from 6.1% YoY to 5.7% YoY.
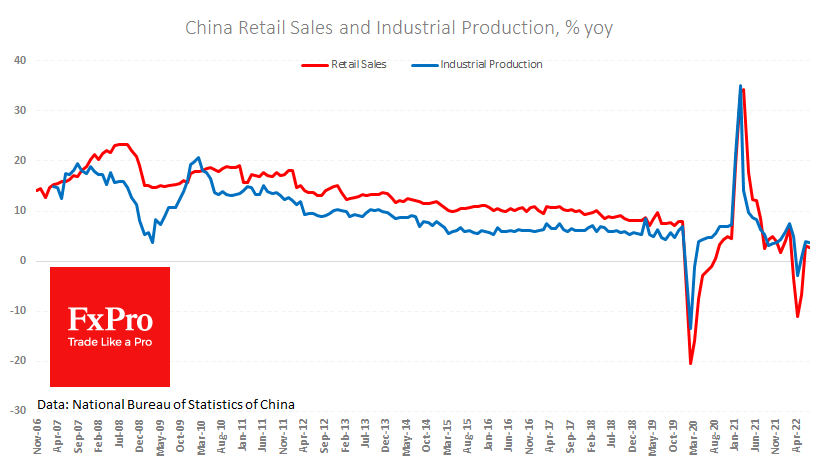
The People’s Bank of China reacted quickly to the statistics by reducing its annual lending rate by 0.1 percentage point to 2.75%. More remarkable, though, is the speed of the reaction, not its scale.
The short-term technical picture of the yuan is now on the sellers’ side. The USDCNH got support from the buyers last week on the way down to the 50-day moving average, which was just above the 76.4% Fibonacci retracement of the February-May rally.
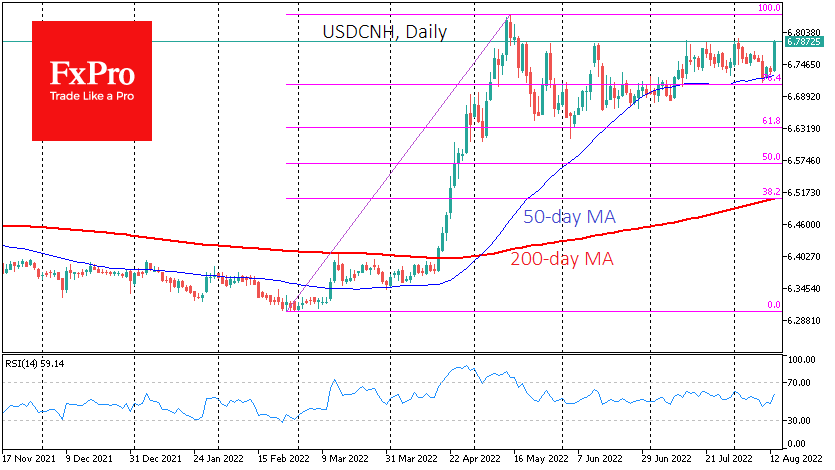
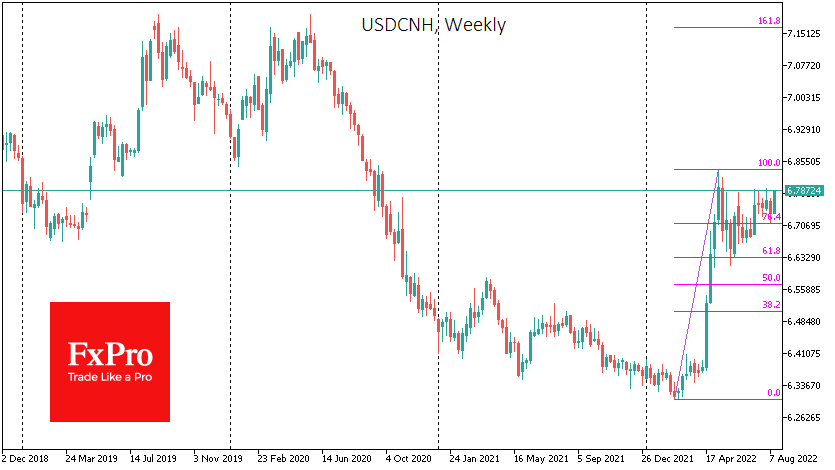
The intraday rise of 0.8% that we see today indicates the determination of the yuan sellers and could signal the second act of growth with a potential target at 7.16, near where the 161.8% levels of the said rally and the multi-year highs of the pair set in 2019 and 2020 are concentrated.
GBP/JPY Mid-Day Outlook
Daily Pivots: (S1) 161.62; (P) 162.21; (R1) 162.61; More...
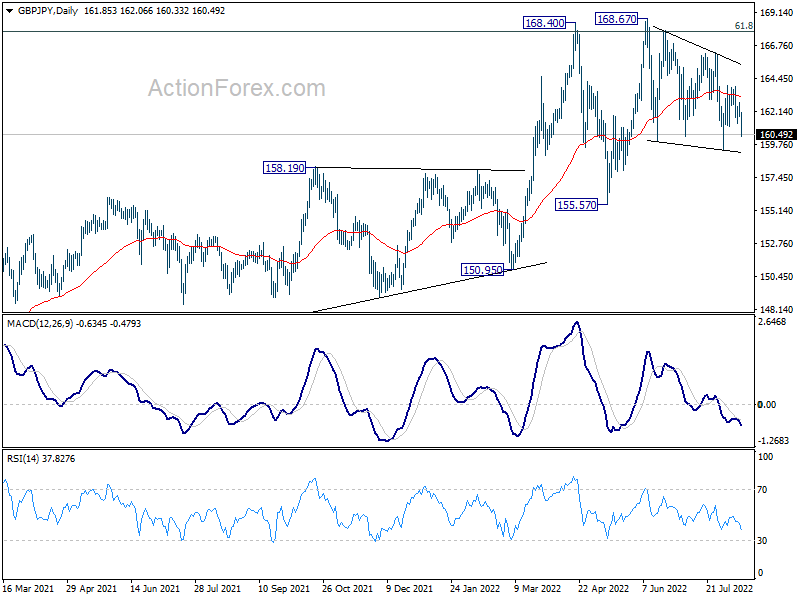
Intraday bias in GBP/JPY is back on the downside with break of 161.08 minor support. Deeper fall would be seen to 159.52 support and below. On the upside, above 162.77 minor resistance will turn bias back to the upside for 163.91 resistance instead.
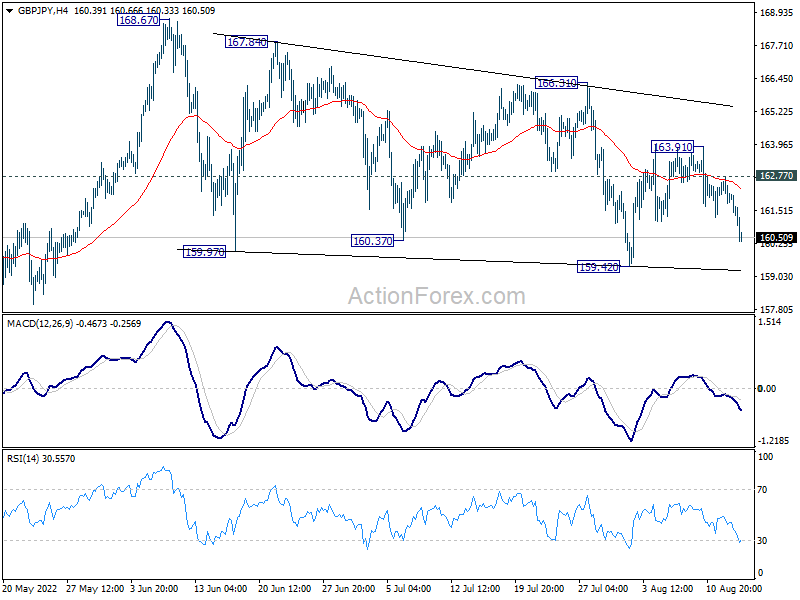
In the bigger picture, up trend from 123.94 (2020 low) is still in progress. Sustained break of 61.8% retracement of 195.86 (2015 high) to 122.75 (2016 low) at 167.93 will be a long term bullish signal, and could pave the way back to 195.86 high. This will remain the favored case as long as 155.57 support holds, even in case of deep pull back.
EUR/JPY Mid-Day Outlook
Daily Pivots: (S1) 136.63; (P) 137.18; (R1) 137.46; More....
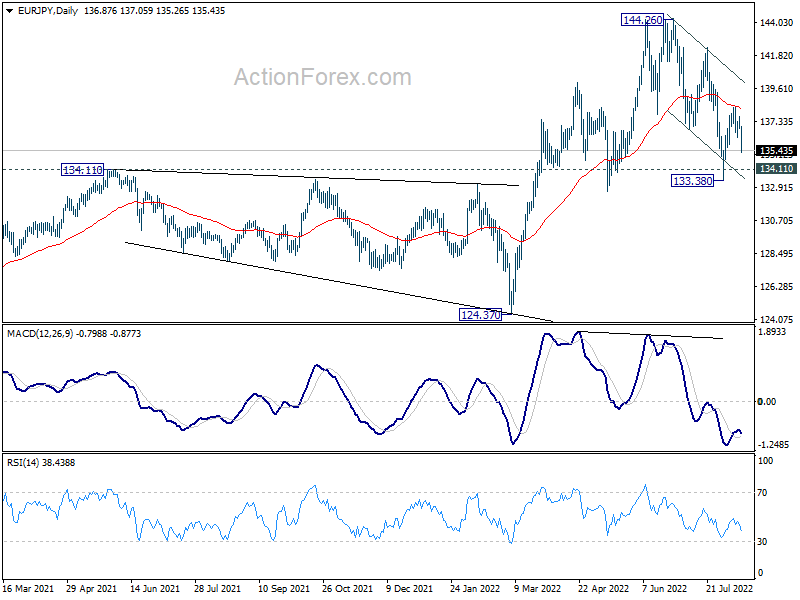
EUR/JPY's break of 135.63 minor support indicates that rebound from 133.38 has completed at 138.38 already. Intraday bias is back on the downside for retesting 133.38 first. Sustained break of 133.38/134.11 support zone will carry larger bearish implications. On the upside, above 136.28 minor resistance will turn intraday bias neutral first.
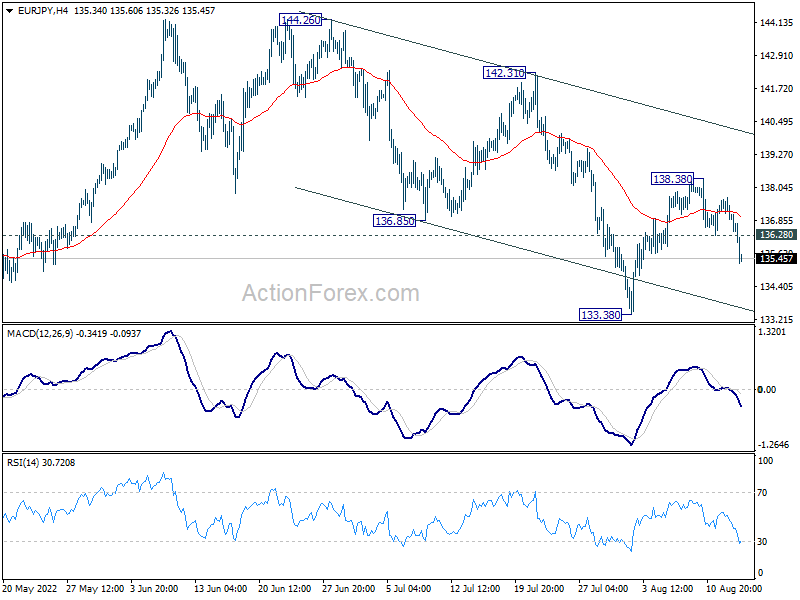
In the bigger picture, up trend from 114.42 (2020 low) is seen as the third leg of the pattern from 109.30 (2016 low). Further rally is in favor as long as 134.11 resistance turned support holds, even in case of deep pull back. Next target is 149.76 (2015 high). However, sustained break of 134.11 will be a sign of medium term bearish reversal and turn focus to 124.37 support for confirmation.
EUR/USD Mid-Day Outlook
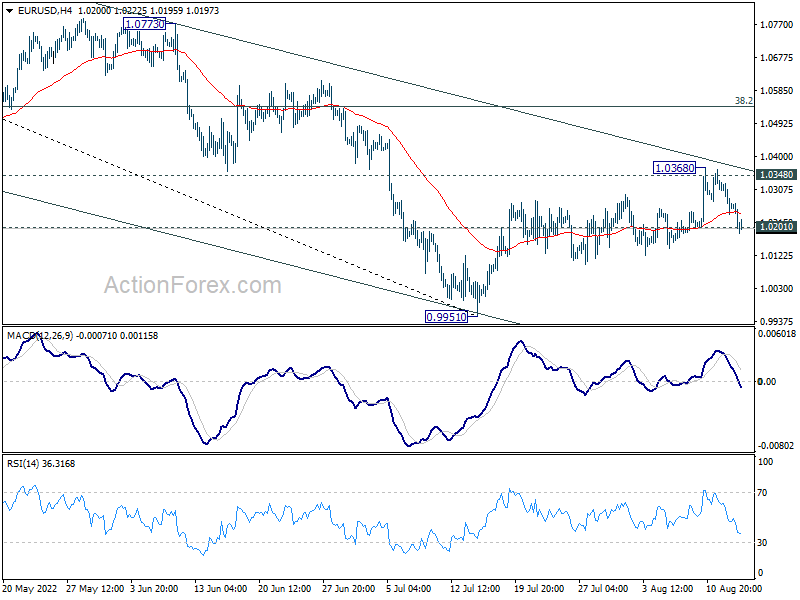
Daily Pivots: (S1) 1.0223; (P) 1.0276; (R1) 1.0312; More...
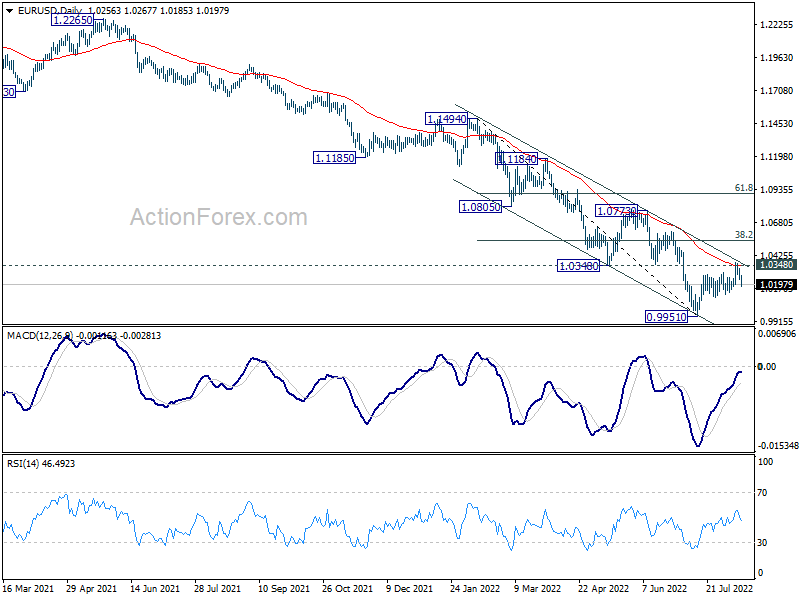
Intraday bias in EUR/USD stays neutral. Firm break of 1.0201 support will argue that rebound from 0.9951 is completed, after rejection by 55 day EMA too. Intraday bias will be back to the downside for retesting 0.9951 low. Nevertheless, firm break of 1.0348 will argue that rally from 0.9951 is at least correcting the fall from 1.1494. Further rise should then be seen to 38.2% retracement of 1.1494 to 0.9951 at 1.0540.
In the bigger picture, down trend from 1.6039 (2008 high) is still in progress. Next target is 100% projection of 1.3993 to 1.0339 from 1.2348 at 0.8694. In any case, outlook will stay bearish as long as 1.0773 resistance holds, in case of strong rebound.
GBP/USD Mid-Day Outlook
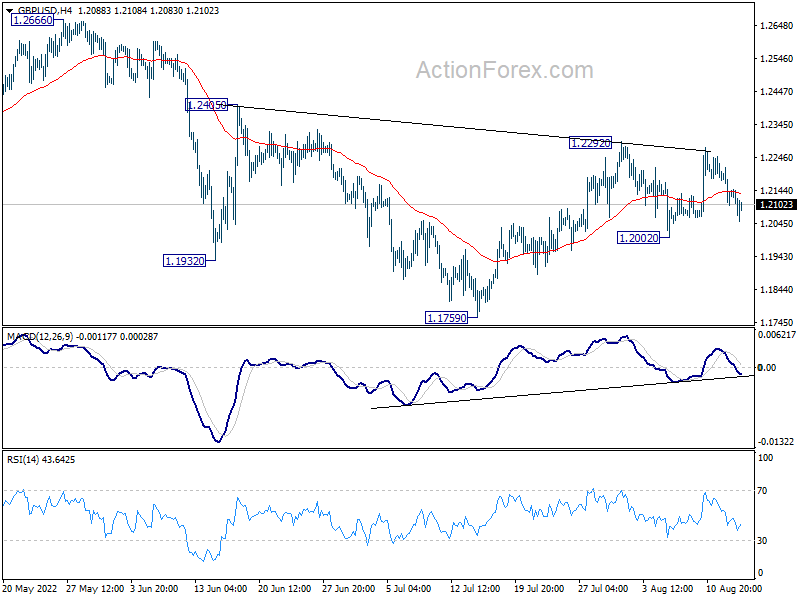
Daily Pivots: (S1) 1.2085; (P) 1.2150; (R1) 1.2201; More...
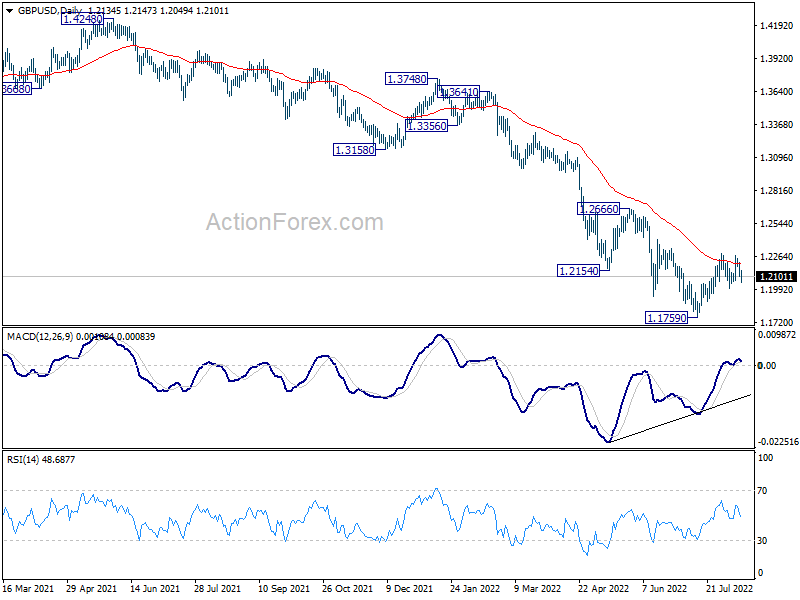
Intraday bas in GBP/USD stays neutral first. Break of 1.2922 resistance will resume the rise from 1.1759, and target 1.2666 key resistance next. On the downside, however, break of 1.2002 will bring deeper fall back to retest 1.1759 low.
In the bigger picture, fall from 1.4248 (2018 high) could be a leg inside the pattern from 1.1409 (2020 low), or resuming the longer term down trend. Deeper decline is expected as long as 1.2666 resistance holds. Next target is 1.1409 low. However, firm break of 1.2666 will bring stronger rise back to 55 week EMA (now at 1.2897).
USD/CHF Mid-Day Outlook
Daily Pivots: (S1) 0.9397; (P) 0.9423; (R1) 0.9440; More...
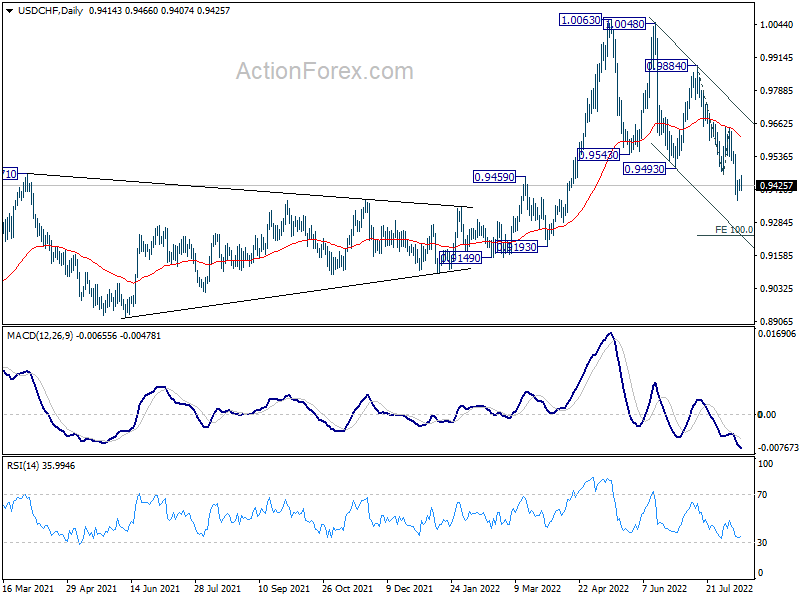
USD/CHF is staying in consolidation above 0.9369 temporary low and intraday bias stays neutral. Upside should be limited well below 0.9648 resistance to bring another fall. Break of 0.9369 will resume larger fall to 100% projection of 0.9884 to 0.9468 from 0.9648 at 0.9232.
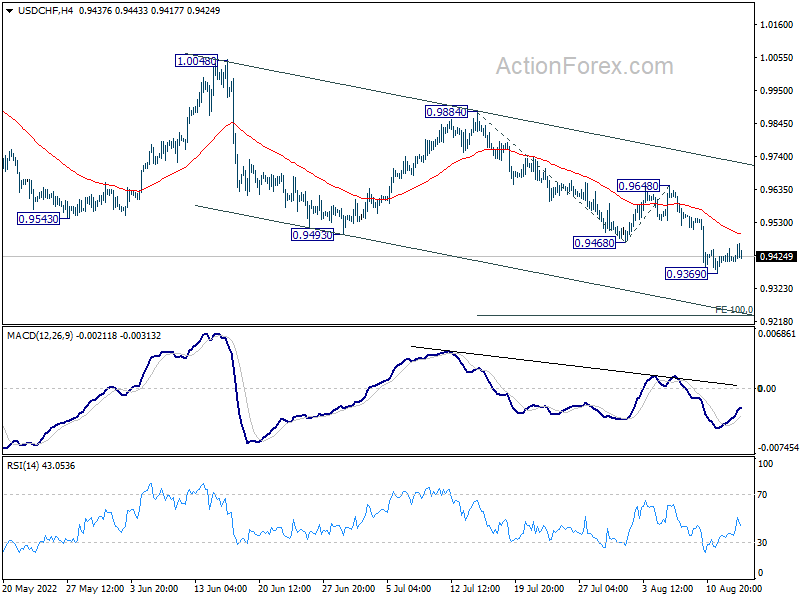
In the bigger picture, break of 0.9471 support turned resistance argues that medium term up trend from 0.8756 has completed with three waves up to 1.0063. Long term sideway pattern might have started another falling leg. Deeper decline would now be in favor as long as 0.9648 resistance holds, to 0.9149 structural support. Sustained break there could pave the way back to 0.8756.