

Sample Category Title
Both Dollar and Euro Performed Mixed Against G10 Peers
Markets
FOMC member Bullard join the hawkish parade kickstarted by Daly, Mester and Evans yesterday. This morning he reiterated his views of a policy rate at 3.75-4% by the end of the year and said there’s a need to get into more restrictive territory. During early US dealings he doubled down in another speech, saying rates may need to be higher for longer to ease inflation. It’s a sneer towards money markets pricing in rate cuts as soon as the first quarter of next year. We’re looking forward to the remaining flurry of speakers scheduled for today. The string of recent Fed comments in any case forces bond markets right now to rethink their extremely dovish repositioning over the course of June and July. After the impressive bear flattening yesterday, US yields extend a rebound north today. Changes go from 2.1 bps in the 30y to 4.7 bps in the 2y with Fed rate hike expectations changing mainly for 2023 (ie pricing out rate cuts). The 10y yield adds 2.5 bps to be a bit more comfortable above the 2.70/72% support zone. German Bunds underperform as they catch up with USTs having extended a drop after the European close yesterday. The curve bear flattens as well, printing gains from 2.4 bps (30y) to 6.1 bps (2y/5y). European swap yields have a decent run as well, rising 4.2 to 4.6 bps at the front end of the curve. The 10y yield, just as is the case for Germany, finds the way back higher within the downward sloping trend channel. Today’s move in yields is also supported by commodity prices with the likes of oil snapping higher (see headline below) and – maybe – with some of the geopolitical tensions easing after Pelosi left Taiwan and a harsh Chinese response so far remains absent. Equity markets hold on tight. Core bond yields advance but the orderly fashion allows for the general risk-on mood to prevail for risky assets. US stocks open with gains ranging 0.4% (DJI) and 0.8% (Nasdaq). The Eurostoxx50 adds 0.70%.
Currency markets trade relatively quiet. Both the dollar and the euro performed mixed against G10 peers. Put against each other, EUR/USD is going nowhere around 1.017 as a result. The pair tried to recoup some of the losses yesterday but they evaporated as today’s session evolved. The trade-weighted USD (DXY) sought to extend yesterday’s bounce off the 105 barrier but the move ran into resistance soon. It’s now holding steady around Tuesday’s close at 106.22. The Japanese yen took a breather after its recent surge. Rising core bond yields help USD/JPY and EUR/JPY higher to the 133.65 and 135.92 area respectively. A bit of nervousness is creeping into sterling now, going into the monetary policy meeting of the BoE tomorrow. The influential think tank NIESR painted a gloomy picture of the UK economy, calling it already in a recession with a stagflationary outlook, and probably weighed on the British currency too. EUR/GBP ekes out a gain to 0.837. Cable (GBP/USD) stabilizes around 1.215.
News Headlines
Turkish inflation rose to a new 24-y high as prices rose 2.37m/m to be up a whopping 79.60% y/y with the July reading even weighed down by a monthly drop in transportation costs (-0.87% m/m). It’s an acceleration from the 78.62% last month and only marginally below the 80.24% analysts were expecting. Core inflation quickened from 57.26% to 61.69% y/y. It’s believed that price pressures in Turkey have yet to peak with the country’s central bank holding rates at a way-too-low policy rate of 14%. With real rates this negative, it is still supporting growth and thus inflation. Instead, Turkish authorities rely on macroprudential measures but without much success so far. The Turkish lira loses ground against the euro (EUR/TRY 18.30) and the dollar (USD/TRY trending to 18).
OPEC+ agreed on a minor and rather symbolic production increase for September at their meeting today, delegates said. An additional 100k barrels/day would hit the markets after the oil cartel fast-tracked the reversal of their Covid-era production curbs in July and August. The small output bump is designed to keep a balance between consumers suffering from high energy prices and the looming threat of a recession in areas including the US and Europe that may sap demand hard and fast. There were no discussions about whether to keep raising production beyond September. Oil prices advanced after the meeting. Brent oil is trading at $101.75/barrel.
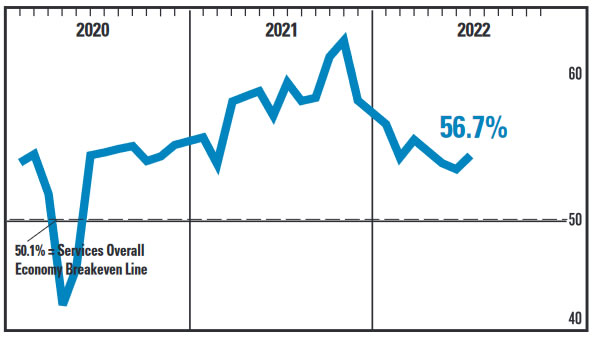
US ISM services rose to 56.7, corresponds to 2.4% annualized GDP growth
US ISM Services PMI rose from 55.3 to 56.7 in July, above expectation of 53.5. Business activity/production rose from 56.1 to 59.9. New orders rose from 55.6 to 59.9. Employment rose from 47.4 to 49.1. Prices dropped from 80.1 to 72.3.
ISM said: "The past relationship between the Services PMI® and the overall economy indicates that the Services PMI for July (56.7 percent) corresponds to a 2.4-percent increase in real gross domestic product (GDP) on an annualized basis."
EUR/USD Mid-Day Outlook
Daily Pivots: (S1) 1.0122; (P) 1.0208; (R1) 1.0252; More...
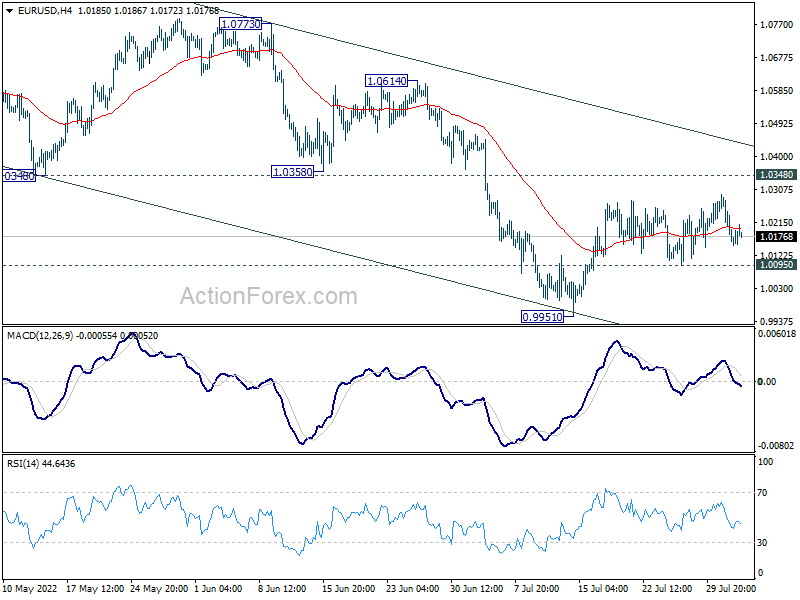
Intraday bias in EUR/USD stays neutral and further rise will remain in favor as long as 1.0095 support holds. Rebound from 0.9951 will target 1.0348 support turned resistance. Break there will target channel resistance at 1.0452. On the downside, break of 1.0095 minor support will turn bias back to the downside, and bring retest of 0.9951 low instead.
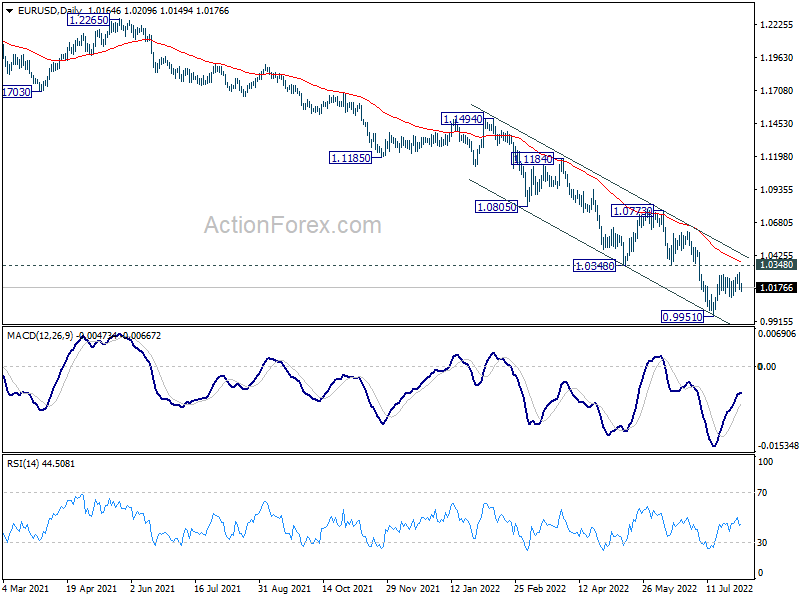
In the bigger picture, down trend from 1.6039 (2008 high) is still in progress. Next target is 100% projection of 1.3993 to 1.0339 from 1.2348 at 0.8694. In any case, outlook will stay bearish as long as 1.0773 resistance holds, in case of strong rebound.
GBP/USD Mid-Day Outlook
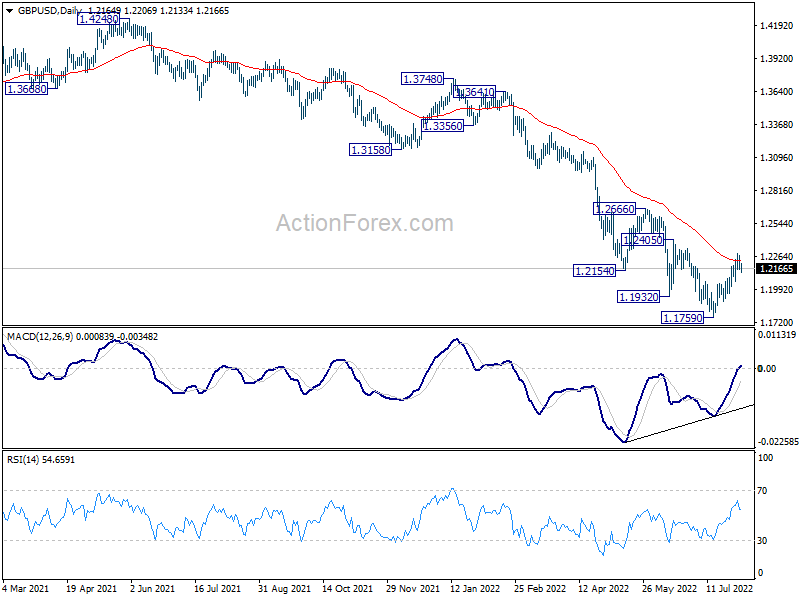
Daily Pivots: (S1) 1.2122; (P) 1.2200; (R1) 1.2242; More...
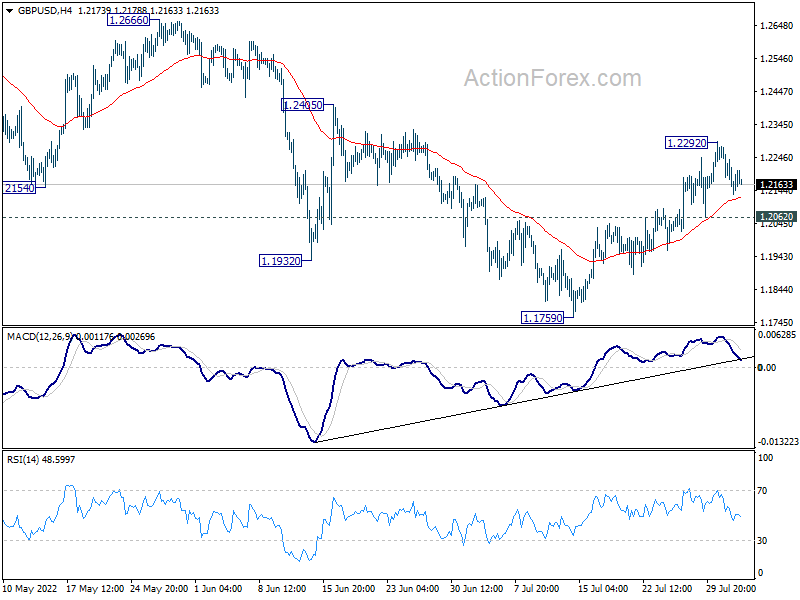
Intraday bias in GBP/USD remains neutral and further rally is in favor as long as 1.2062 minor support holds. Above 1.2292 will target 1.2405 resistance first. Firm break there will target 1.2666 key resistance next. On the downside, however, break of 1.2062 minor support will argue that the rebound is over, and turn bias back to the downside for retesting 1.1759 low instead.
In the bigger picture, fall from 1.4248 (2018 high) could be a leg inside the pattern from 1.1409 (2020 low), or resuming the longer term down trend. Deeper decline is expected as long as 1.2666 resistance holds. Next target is 1.1409 low. However, firm break of 1.2666 will bring stronger rise back to 55 week EMA (now at 1.2957).
USD/CHF Mid-Day Outlook
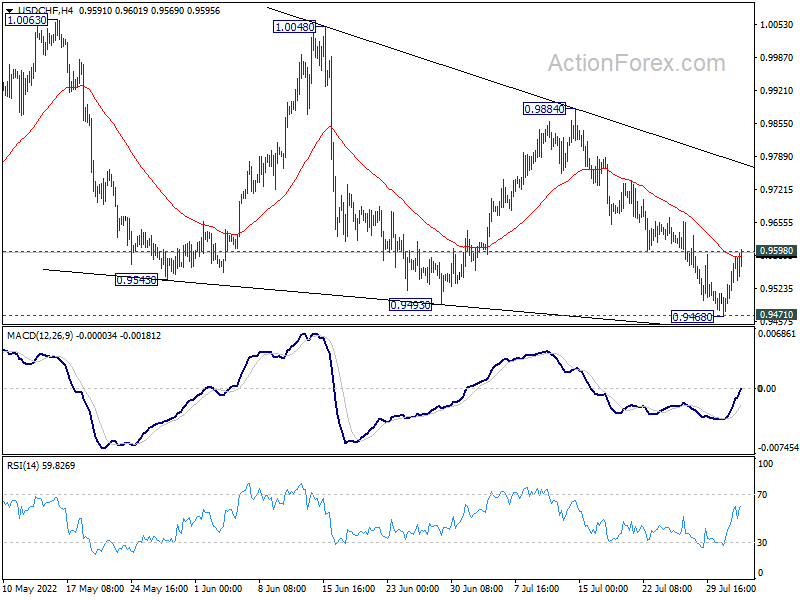
Daily Pivots: (S1) 0.9504; (P) 0.9540; (R1) 0.9609; More...
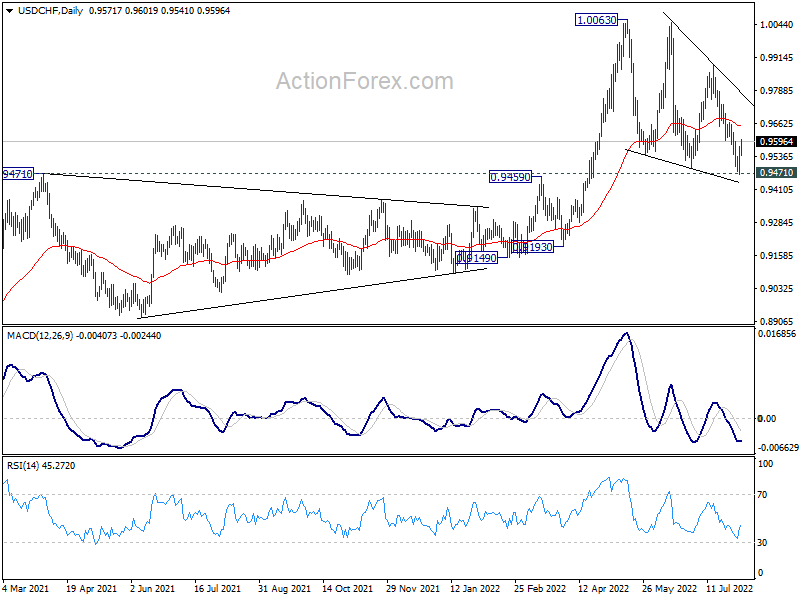
Intraday bias in USD/CHF remains neutral and focus stays on 0.9598 minor resistance. Firm break there should confirm short term bottoming at 0.9468, after defending 0.9471 keys support. Intraday bias will be back to the upside for 55 day EMA (now at 0.9650) and above. However, sustained break of 0.9471 will carry larger bearish implication and target 0.9193 support next.
In the bigger picture, medium term up trend from 0.8756 (2021 low) is still in progress. On resumption, next target is 1.0342 (2016 high). Sustained break there will resume long term up trend from 0.7065 (2011 low). This will remain the favored case as long as 0.9471 resistance turned support holds. However, firm break of 0.9471 will raise the chance that such up trend is over. Sustained trading below 55 week EMA (now at 0.9424) could bring deeper medium term fall back to 0.9149 support and below.
USD/JPY Mid-Day Outlook
Daily Pivots: (S1) 131.33; (P) 132.25; (R1) 134.10; More...
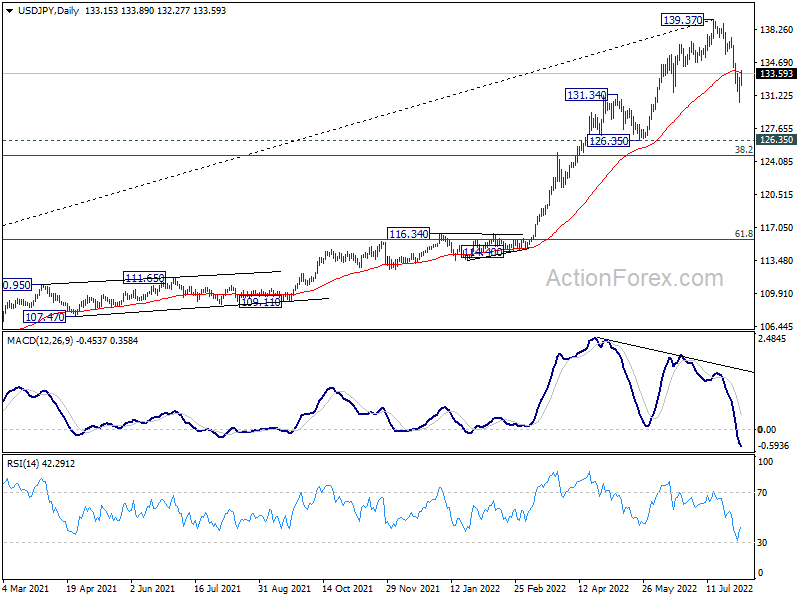
Intraday bias in USD/JPY remains neutral and some consolidations would be seen above 130.38 first. On the downside, below 130.38 will resume the fall from 139.37, as a correction to medium term uptrend, towards 126.35 support. Strong support is expected above there, at least on first attempt, to bring rebound. On the upside, firm break of 134.58 will turn bias to the upside for stronger rally to retest 139.37 high.
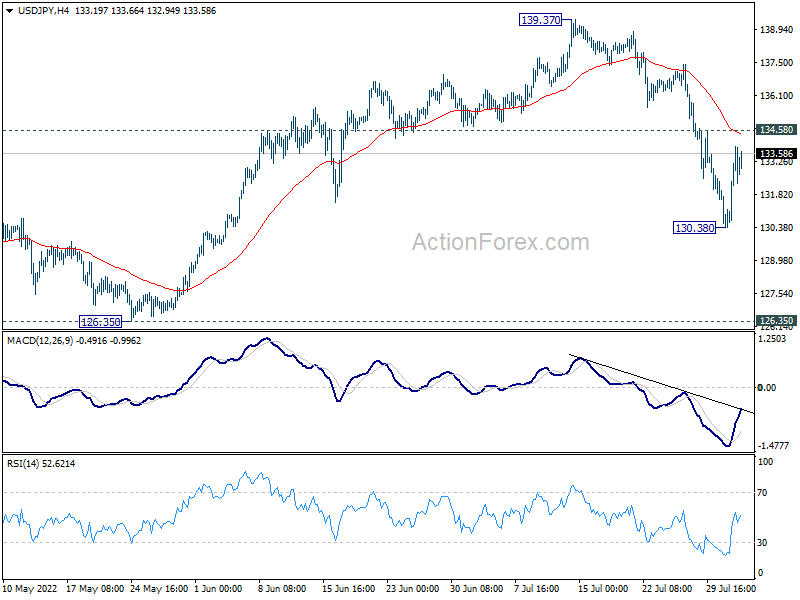
In the bigger picture, a medium term top should be in place at 139.37, on bearish divergence condition in daily MACD. Fall from there could be correcting whole up trend from 101.18 (2020 low). While deeper decline cannot be ruled out, outlook will stays bullish as long as 55 week EMA (now at 121.84) holds. Long term up trend is expected to resume through 139.37 at a later stage, after the correction finishes.
Yen, Swiss Franc and Dollar Turn Softer on Slightly Upbeat Sentiment
Yen, Swiss Franc and Dollar turn softer with other markets trading in slightly upbeat tone. Traders are back to business as usual, after no substantial actions from China during the time US House Speaker Nancy Pelosi visited Taiwan. Australian Dollar is leading Canadian and Sterling higher. Euro is mixed for now. Focuses will turn to BoE rate decision tomorrow.
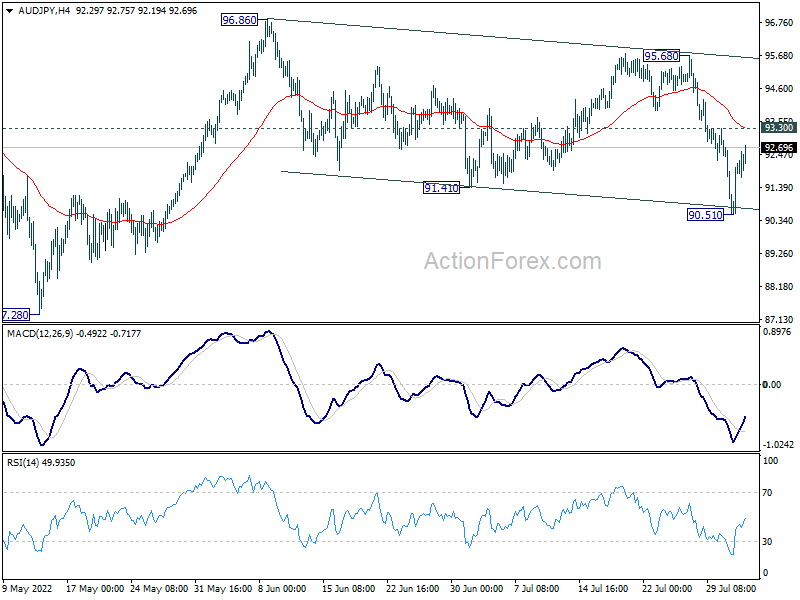
Technically, one focus is now on AUD/JPY to gauge the chance of resumption in risk-on trades. Break of 93.30 minor resistance will argue that whole corrective pattern from 96.86 has completed with three waves down to 90.51. Further rally would be seen back to 95.68 resistance first. Break will argue that medium term up trend is ready to resume.
In Europe, at the time of writing, FTSE is up 0.16%. DAX is up 0.22%. CAC is up 0.40%. Germany 10-year yield is up 0.065. Earlier in Asia, Nikkei rose 0.53%. Hong Kong HSI rose 0.40%. China Shanghai SSE dropped -0.71%. Singapore Strait Times rose 0.40%. Japan 10-year JGB yield rose 0.0130 to 0.190.
Eurozone retail sales dropped -1.2% mom in Jun, EU down -1.3% mom
Eurozone retail sales dropped -1.2% mom in June versus expectation of 0.1% mom rise. The volume of retail trade decreased by -2.6% mom for non-food products, by -1.1% for automotive fuels mom and by -0.4% mom for food, drinks and tobacco.
EU retail sales dropped -1.3% mom. Among Member States for which data are available, the largest monthly decreases in the total retail trade volume were registered in Denmark (-3.8%), the Netherlands (-3.4%) and Estonia (-2.4%). Increases were observed in Ireland and Malta (both +0.5%), Finland (+0.3%) and Austria (+0.2%).
Eurozone PPI up 1.1% mom, 35.8% yoy in Jun
Eurozone PPI rose 1.1% mom, 35.8% yoy in June, versus expectation of 1.0% mom, 35.7% yoy. For the month, Industrial producer prices increased by 2.7% mom in the energy sector, by 0.7% mom for durable consumer goods and non-durable consumer goods and by 0.4% mom for intermediate goods and for capital goods. Prices in total industry excluding energy increased by 0.4% mom.
EU PPI rose 1.3% mom, 36.1% yoy. The highest monthly increases in industrial producer prices were recorded in Ireland (+13.2%), Lithuania (+5.2%) as well as Latvia and Finland (both +4.0%). Decreases were observed in Greece (-3.2%) and Luxembourg (-2.2%).
Eurozone PMI composite finalized at 49.9, outlook darkened, signalling July GDP contraction
Eurozone PMI Services was finalized at 51.2 in July, down from 53.0 in June. That's the lowest level in 6 months. PMI Composite was finalized at 49.9, down from 52.0 in June, a 17-month low.
Looking at some member states, Spain PMI Composite was finalized at 52.7 (6-month low), France at 51.7 (15-month low), Germany at 48.1 (25-month low), and Italy at 47.7 (18-month low).
Chris Williamson, Chief Business Economist at S&P Global Market Intelligence said: "The eurozone economic outlook has darkened at the start of the third quarter, with the latest survey data signalling a contraction of GDP in July. Soaring inflation, rising interest rates and supply worries – notably for energy – have led to the biggest drops in output and demand seen for a almost a decade, barring pandemic lockdown months.
UK PMI services finalized at 52.6, composite at 52.1
UK PMI Services was finalized at 52.6 in July, down from June's 54.3, worst reading in 17 months. PMI Composite was finalized at 52.1, down from 53.7 in June, the lowest rate of expectation since February 2021.
Tim Moore, Economics Director at S&P Global Market Intelligence: "UK service providers reported their worst month for business activity expansion since the national lockdown in February 2021. Reduced levels of discretionary consumer spending and efforts by businesses to contain expenses due to escalating inflation have combined to squeeze demand across the service economy. The near-term outlook also looks subdued, as new order growth held close to June's 16-month low and business optimism was the second weakest since May 2020.
Swiss CPI unchanged at 3.4% yoy in Jul, core CPI ticked up to 1.8% yoy
Swiss CPI was unchanged at 3.4% yoy in July, below expectation of 3.6% yoy. Core CPI rose from 1.9% yoy to 2.0% yoy. Domestic products inflation rose from 1.7% yoy to 1.8% yoy. Imported products inflation dropped from 8.5% yoy to 8.4% yoy.
FSO said: "The stability of the index compared with the previous month is the result of opposing trends that counterbalanced each other overall. Prices for heating oil decreased, as did those for clothing and footwear due to seasonal sales. In contrast, prices for gas and supplementary accommodation increased."
Australia AiG construction dropped to 45.3, RBA tightening will end the boom
Australia AiG Performance of Construction Index dropped -0.9 to 45.3 in July. Activity dropped -3.5 to 42.7. Employment rose 2.2 to 53.0. New orders dropped -2.7 to 43.1. Supplier deliveries rose 3.2 to 42.2. Input prices dropped -2.2 to 93.8. Selling prices rose 4.4 to 87.1.
HIA Economist, Thomas Devitt, said: "Confidence in the housing sector has been adversely impacted by rising rates which will compound the rise in the cost of construction. This has not yet materialised in slowing sales or approvals of new homes and there is still a large volume of building work in the pipeline to complete. Recent declines in confidence, as shown in this month's Australian PCI, reflect an anticipation on the part of builders of less new work entering the pipeline in coming months as the RBA's current tightening cycle will, inevitably, bring an end to the boom."
New Zealand employment flat in Q2, wage grow strongest since 2008
New Zealand employment was essentially flat in Q2, below expectation of 0.4% rise. Unemployment rate ticked up from 3.2% to 3.3%, against expectation a fall to 3.1%. Labor force participation rate dropped -0.1% to 70.8%.
Wage inflation (salary and wage rates, including overtime) in all sectors rose 1.1% qoq, 3.5% yoy. It grew 1.3% qoq, 3.4% yoy in private sector, and 0.6% qoq, 3.0% yoy in public sector.
"Measures of spare labour market capacity have fallen over the year and remained low for several quarters, continuing to show a tight labour market," work and wellbeing statistics senior manager Becky Collett said.
"The June quarter had the largest increase in LCI salary and wages rates since late-2008. Over the year, a steadily increasing number of wages have been raised to better match market rates, as well as attracting or retaining staff," business employment insights manager Sue Chapman said.
China Caixin PMI services rose to 55.5, composite dropped to 54.0
China Caixin PMI Services rose from 54.5 to 55.5 in July, above expectation of 54.0. That's the highest level since April 2021. PMI Composite dropped from 55.3 to 54.0.
Wang Zhe, Senior Economist at Caixin Insight Group said: "In general, the eased Covid situation and restrictions facilitated a continuous recovery in the economy. The services sector, which had been previously hit harder by the outbreaks than manufacturing, showed stronger improvement. Supply and demand continued to improve with supply stronger than demand. The labor market shrank greatly, adding to employment pressures. Business costs steadily climbed while prices charged remained stable, posing challenges for company profits. The market held on to positive sentiment, even with concerns about the outlook for Covid and the economy."
Looking ahead
Germany trade balance, Swiss CPI, Eurozone PMI services final, PPI and retail sales, and UK PMI services final will be released in European session. Later in the day, US will release ISM services and factory orders.
USD/JPY Mid-Day Outlook
Daily Pivots: (S1) 131.33; (P) 132.25; (R1) 134.10; More...
Intraday bias in USD/JPY remains neutral and some consolidations would be seen above 130.38 first. On the downside, below 130.38 will resume the fall from 139.37, as a correction to medium term uptrend, towards 126.35 support. Strong support is expected above there, at least on first attempt, to bring rebound. On the upside, firm break of 134.58 will turn bias to the upside for stronger rally to retest 139.37 high.
In the bigger picture, a medium term top should be in place at 139.37, on bearish divergence condition in daily MACD. Fall from there could be correcting whole up trend from 101.18 (2020 low). While deeper decline cannot be ruled out, outlook will stays bullish as long as 55 week EMA (now at 121.84) holds. Long term up trend is expected to resume through 139.37 at a later stage, after the correction finishes.
Economic Indicators Update
| GMT | Ccy | Events | Actual | Forecast | Previous | Revised |
|---|---|---|---|---|---|---|
| 22:30 | AUD | AiG Performance of Construction Index Jul | 45.3 | 46.2 | ||
| 22:45 | NZD | Employment Change Q2 | 0.00% | 0.40% | 0.10% | |
| 22:45 | NZD | Unemployment Rate Q2 | 3.30% | 3.10% | 3.20% | |
| 22:45 | NZD | Labour Cost Index Q/Q Q2 | 1.30% | 1.10% | 0.70% | |
| 01:45 | CNY | Caixin Services PMI Jul | 55.5 | 54 | 54.5 | |
| 06:00 | EUR | Germany Trade Balance (EUR) Jun | 6.4B | -1.1B | -1.0B | |
| 06:30 | CHF | CPI M/M Jul | 0.00% | 0.00% | 0.50% | |
| 06:30 | CHF | CPI Y/Y Jul | 3.40% | 3.60% | 3.40% | |
| 07:45 | EUR | Italy Services PMI Jul | 48.4 | 50 | 51.6 | |
| 07:50 | EUR | France Services PMI Jul F | 53.2 | 52.1 | 52.1 | |
| 07:55 | EUR | Germany Services PMI Jul F | 49.7 | 49.2 | 49.2 | |
| 08:00 | EUR | Eurozone Services PMI Jul F | 51.2 | 50.6 | 50.6 | |
| 08:00 | EUR | Italy Retail Sales M/M Jun | -1.10% | 0.20% | 1.90% | 2.00% |
| 08:30 | GBP | Services PMI Jul F | 52.6 | 53.3 | 53.3 | |
| 09:00 | EUR | Eurozone PPI M/M Jun | 1.10% | 1.00% | 0.70% | 0.50% |
| 09:00 | EUR | Eurozone PPI Y/Y Jun | 35.80% | 35.70% | 36.30% | 36.20% |
| 09:00 | EUR | Eurozone Retail Sales M/M Jun | -1.20% | 0.10% | 0.20% | 0.40% |
| 13:45 | USD | Services PMI Jul F | 47 | 47 | ||
| 14:00 | USD | ISM Services PMI Jul | 53.5 | 55.3 | ||
| 14:00 | USD | Factory Orders M/M Jun | 0.80% | 1.60% | ||
| 14:30 | USD | Crude Oil Inventories | -1.4M | -4.5M |
Pound Edges Higher, Markets Eye BoE
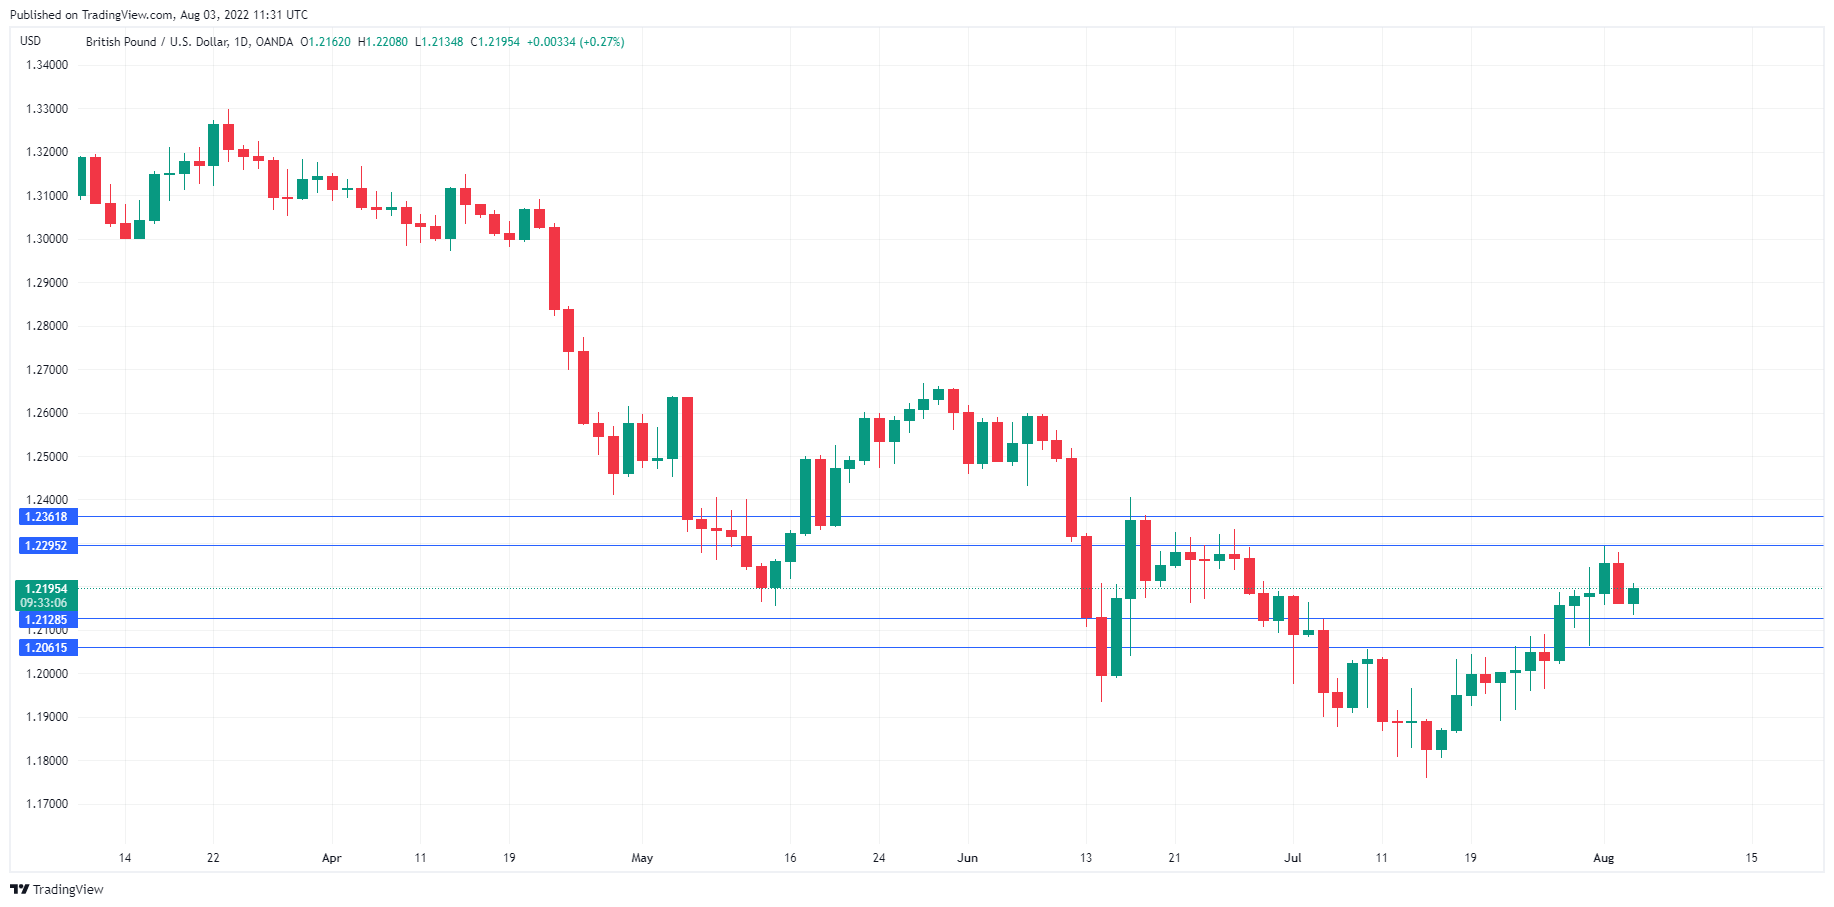
The British pound is in positive territory today and briefly climbed above the 1.22 line. In the European session, GBP/USD is trading at 1.2185, up 0.18% on the day.
Will BoE tighten by 50bp?
The Bank of England meets on Thursday, and a 50bp hike looks likely, especially after hints from Governor Bailey to that effect. In today’s business climate of high inflation and central banks aggressively raising rates, such increases are no longer viewed as ‘massive’ or ‘supersize’. Still, it should be remembered that the BoE has not raised rates by 50bp since 1995, so such a move would be significant, even if it has been priced in by the markets. This would bring the Bank Rate to 1.75%, still well below the rate levels at the Federal Reserve and many other major central banks.
In June, the MPC voted 6-3 to raise rates by 25bp, suggesting that Thursday’s decision will not be unanimous either. If the majority wins six or more votes, it would send out a strong message that the BoE is prepared to continue hiking and another 50bp move would be a strong possibility in September, which would be bullish for the pound. A close 5-4 vote might result in less hawkish wording in its comments and would signal that we may be getting close to the end of the rate-tightening cycle and the pound could weaken.
The BoE is under heavy pressure to alleviate the cost-of-living crisis in the UK, with inflation rising to 9.4% in June, up from 9.1% in May. Inflation expectations are also accelerating, which will make it difficult for the BoE to curb inflation. The danger with a faster pace of tightening is that it could result in the UK economy, which is already showing signs of slowing, tipping into recession. Central banks have circled inflation as public enemy number one, even if the price is a recession. Investors, however, are jittery about the “R” word, and any indications that the UK is in a recession would likely sour sentiment towards the British pound.
GBP/USD Technical
- GBP/USD faces resistance at 1.2295, followed by a monthly resistance line at 1.2362
- There is support at 1.2128 and 1.2061
New Zealand Dollar Stems Bleeding
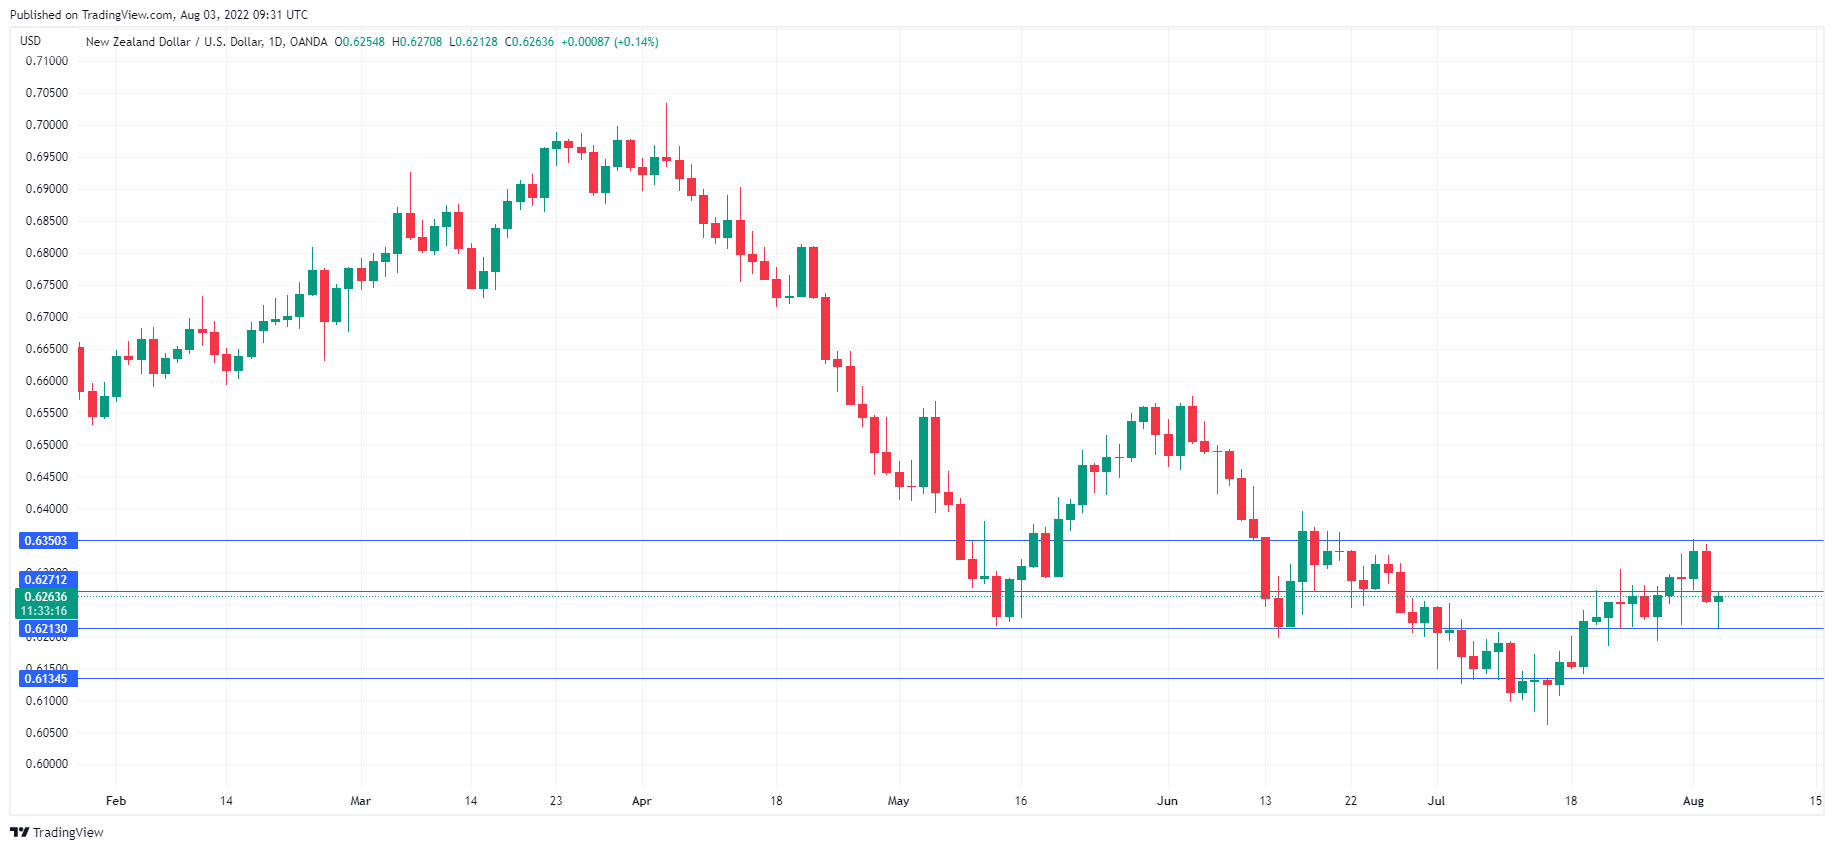
The New Zealand dollar has edged higher today. In the European session, NZD/USD is trading at 0.6261, up 0.11% on the day.
NZD/USD took a tumble on Tuesday, as nervous investors waited to see if Nancy Pelosi would indeed visit Taiwan, despite furious threats from China. The New Zealand dollar slipped 1.24%, its worst daily performance since mid-June. A defiant Pelosi did indeed land in Taiwan on Tuesday night. China announced it will conduct live-fire drills in areas encircling Taiwan this week, but the currency markets are calm. China/Taiwan remains a hotspot and any incident between Taiwanese and Chinese forces could trigger a geopolitical crisis and volatility in the markets.
New Zealand wage inflation jumps
New Zealand employment in Q2 came in at a flat 0.0%, unchanged from the first quarter. This was shy of the 0.4% estimate and points to a stagnant labour market. What was of particular interest was that annual wage inflation jumped 3.4% in Q2, nudging up from 3.2% and above the forecast of 3.1%. This was the highest level since 2006 and will likely put pressure on the Reserve Bank of New Zealand to remain aggressive in its efforts to curb inflation.
The RBNZ has raised rates to 2.50%, but there is no sign of inflation easing, as it climbed to 7.3% in Q2, up from 6.9% in the first quarter. The central bank’s aggressive rate cycle has cooled the housing market and dampened business and consumer confidence, raising fears that the economy could tip into a recession. The good news is that the labour market remains tight, in part because the country’s borders have been closed and the lack of migrant workers has resulted in an acute shortage of labour. The markets have priced in another 0.50% at the August 17th meeting.
The RBNZ is also concerned about inflation expectations, which if left unchecked will strengthen inflation and exacerbate the Bank’s efforts to curb inflation. Inflation Expectations accelerated for eight straight quarters and hit 3.29% in Q1, up from 3.27% and a 31-year high. We’ll get a look at Inflation Expectations for Q2 next week, and if the current upward trend continues, it will make a 0.50% hike more likely.
NZD/USD Technical
- 0.6271 has switched to resistance and is a weak line. Above, there is resistance at 0.6350
- There is support at 0.6213 and 0.6134
Gold and Silver: Time to Decide on the Direction
Silver has pulled back 3% in the last 18 hours, while Gold has lost 1.2% in the same time frame. The pullback came as some investors exhaled after China’s reaction to the Pelosi plane landing in Taiwan. Investors were banking on a slight chance of a sharper escalation than they saw.
On the technical analysis side, yesterday’s pullback prevented the precious metals from breaking out of the grip of a short-term bearish trend, exposing the 50-day moving average as resistance.
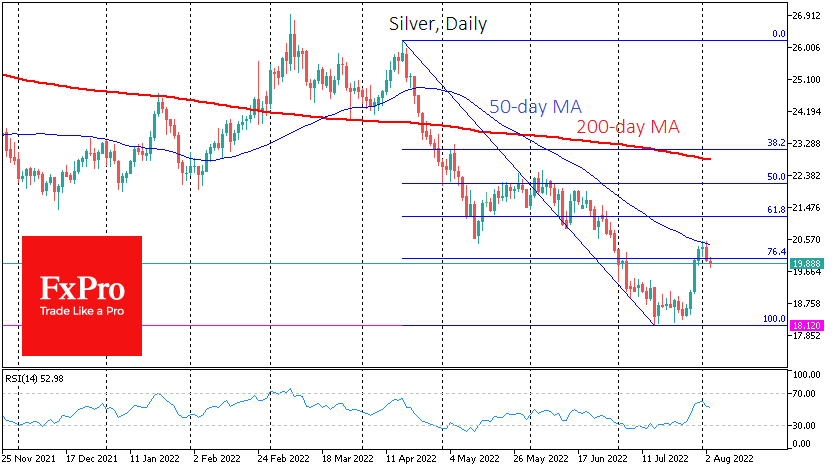
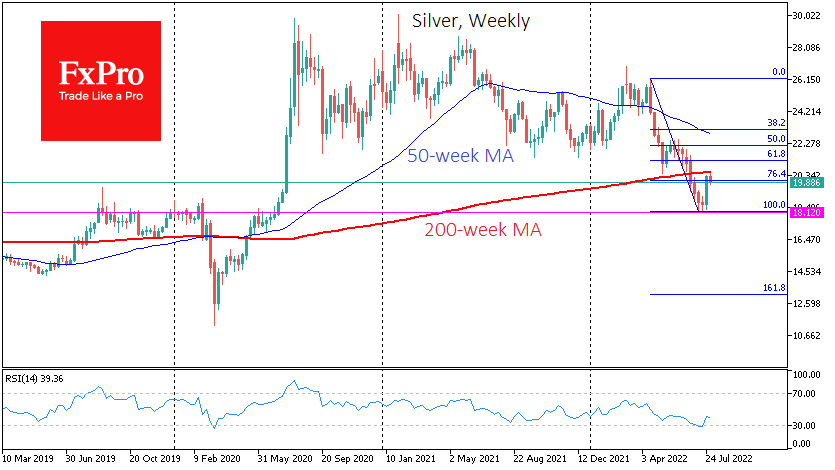
The situation, in this case, looks double-edged. A bearish view on silver suggests that the momentum of the rise since the beginning of last week was a corrective bounce to 76.4% from the declines from April’s highs to July’s lows. Resistance in the 50-day moving average served as an additional pressure factor, keeping silver within the short-term downtrend. In addition, silver also bounced back when it tried to return to the 200-week average, further encouraging sellers.
The bullish scenario in silver suggests that yesterday and today, the market cooled down a bit after the latest momentum. The drawdown to two-year lows and the previous meaningful consolidation area made silver attractive for long-term buyers. This is doubly true with easing expectations of further monetary policy tightening in the US and other major economies.
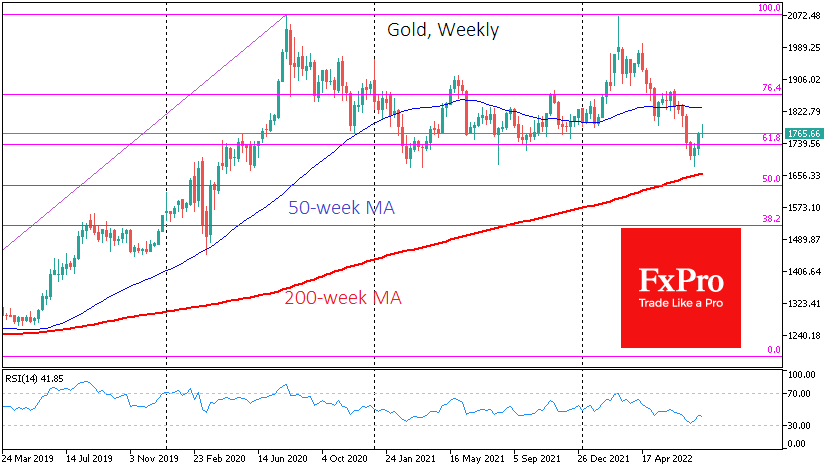
Gold has seen more sustained buying, with the price already showing positive momentum on Wednesday morning. This relatively quick return to growth suggests less about the persistence of geopolitical risks and more about gold’s continued attractiveness after touching the two-year lows earlier last month.
On the weekly gold timeframes, the RSI has been recovering strongly after approaching the oversold area and staying close to its 200-week moving average in July. Also, on the longer-term gold charts, the two-year sidewall looks like a prolonged correction after an upside impulse.
This week we see an intensified tug-of-war between bulls and bears, which might spark a further strong move in the next few years. Traders and investors, even long-term ones, should not overlook the signals that silver and gold could give this week, particularly if we see an apparent capitulation by either side.