

Sample Category Title
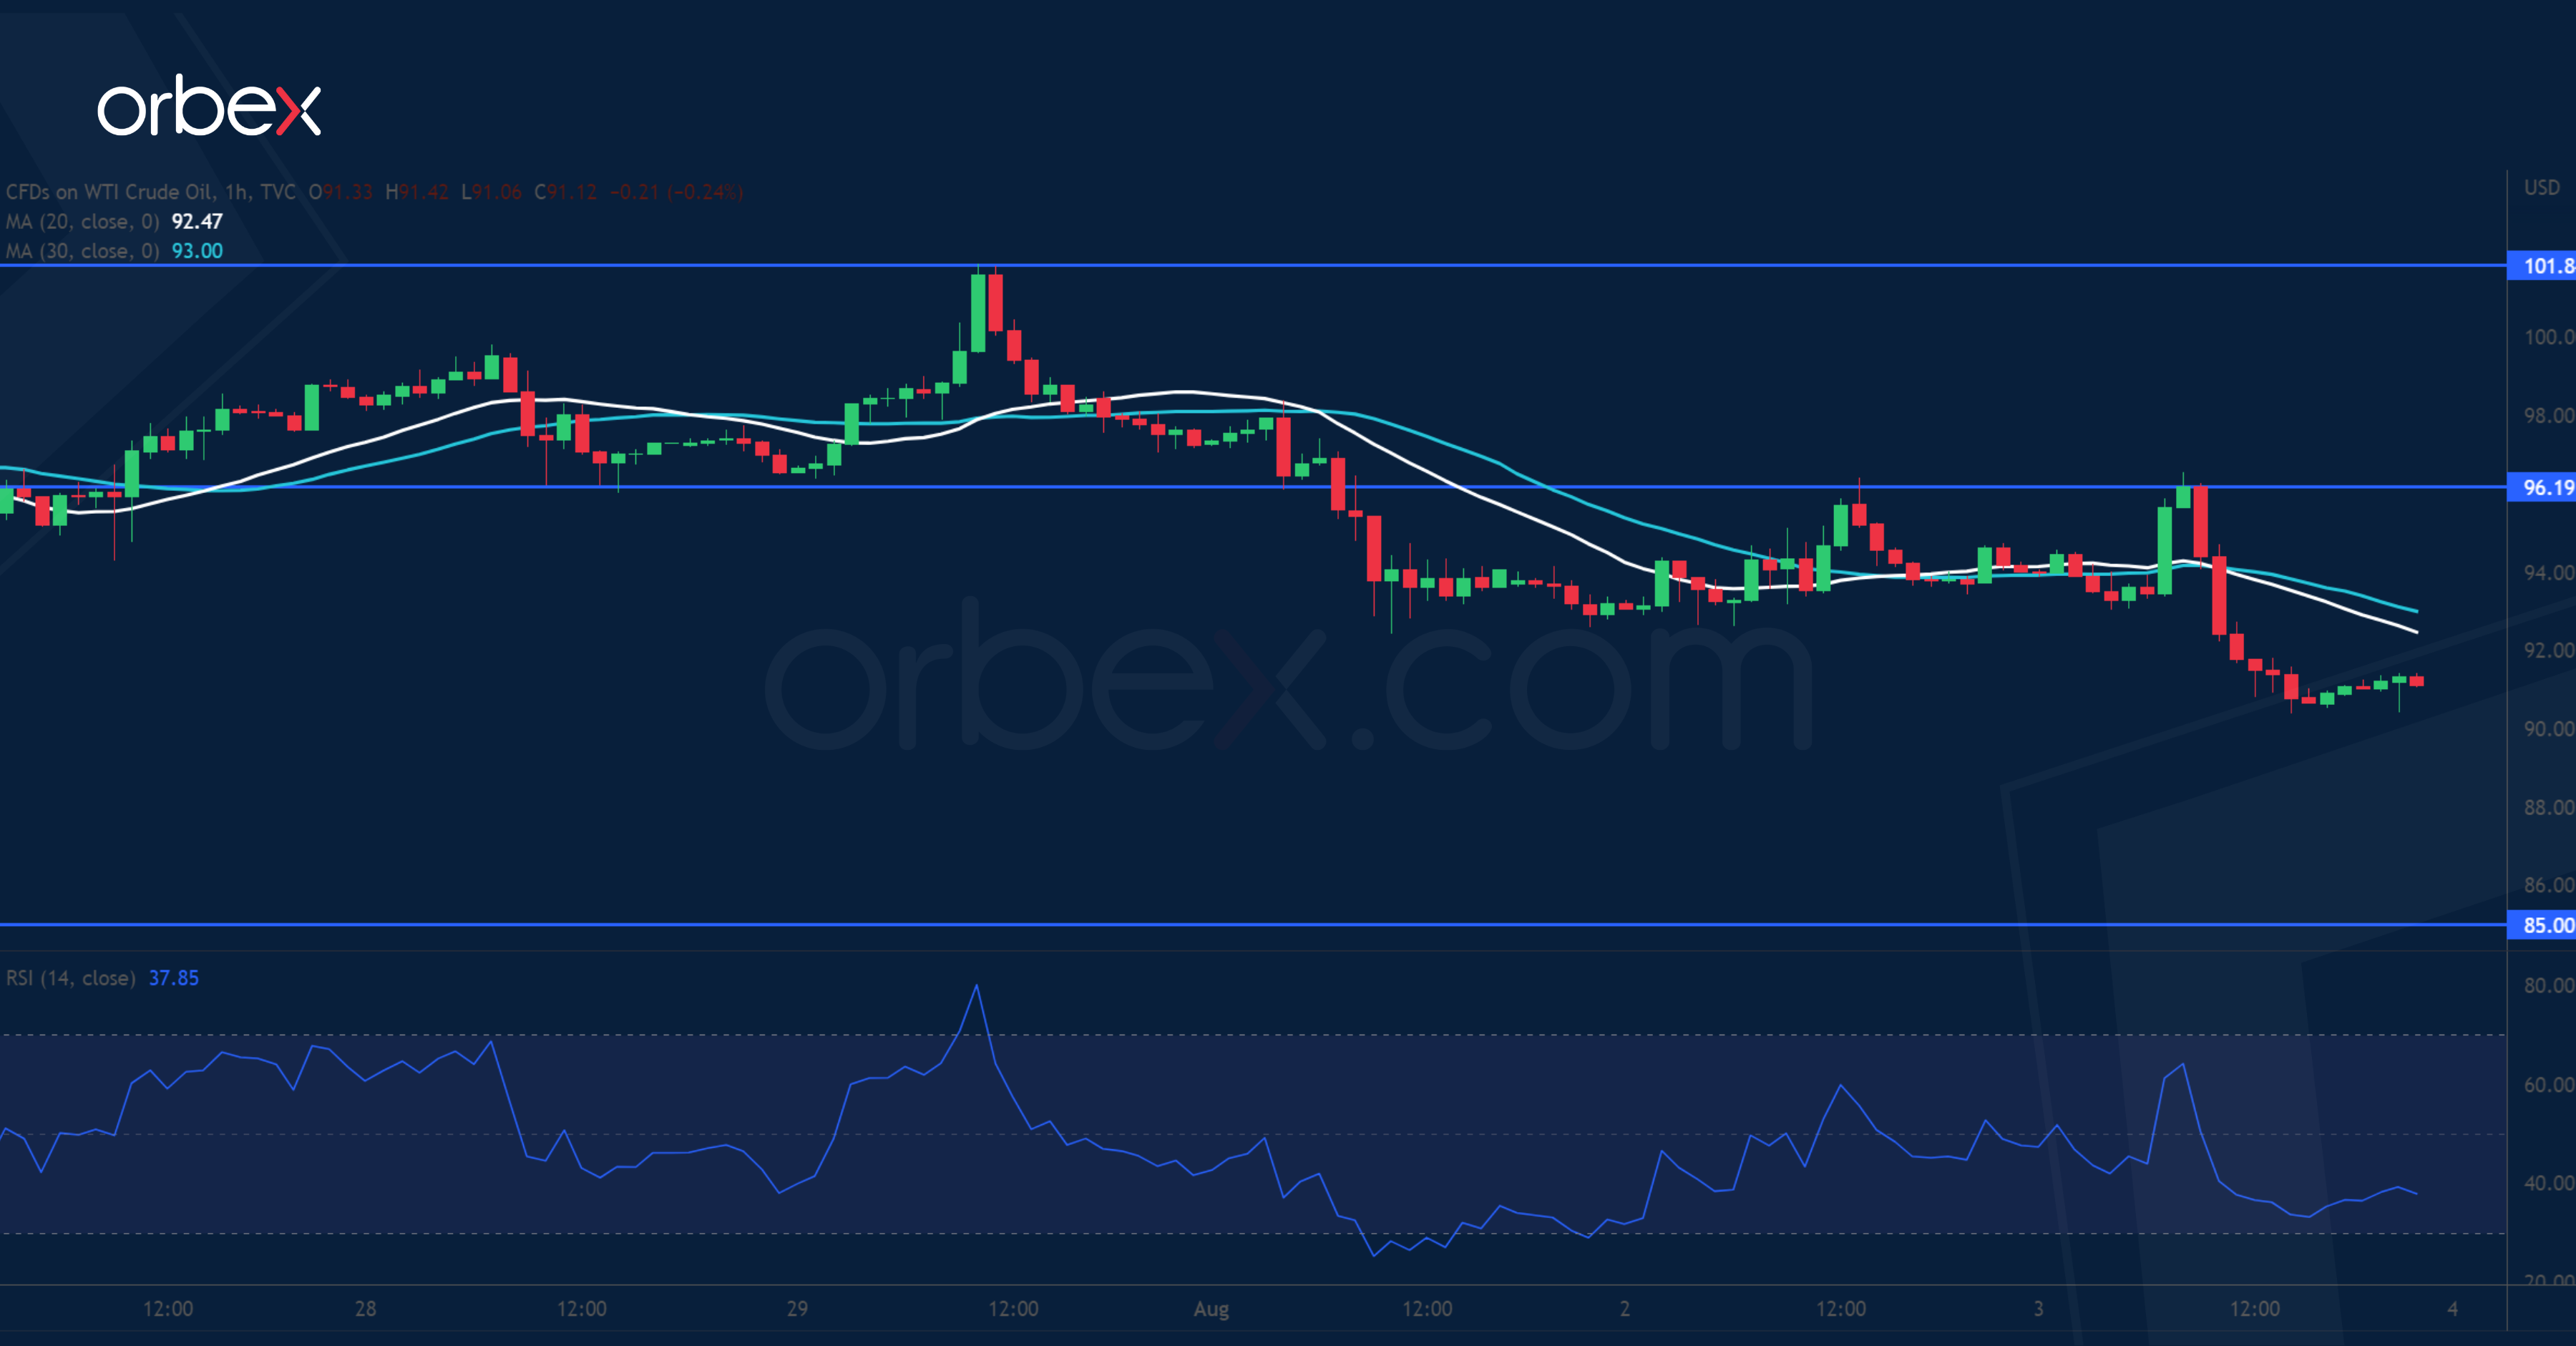
US Oil Breaks Critical Support
Oil prices slumped after OPEC+ decided to raise output. Downbeat sentiment prevails as WTI struggles to achieve a higher high. The recent rebound came to a halt at 101.80 next to the 30-day moving average. A subsequent fall below 96.50 suggests that the path of least resistance is still down. A break below 91.10 could trigger liquidation towards 85.00, opening the door for a bearish reversal in the weeks to come. 96.20 is the first hurdle and the bulls need to clear 101.80 before a recovery could take place.
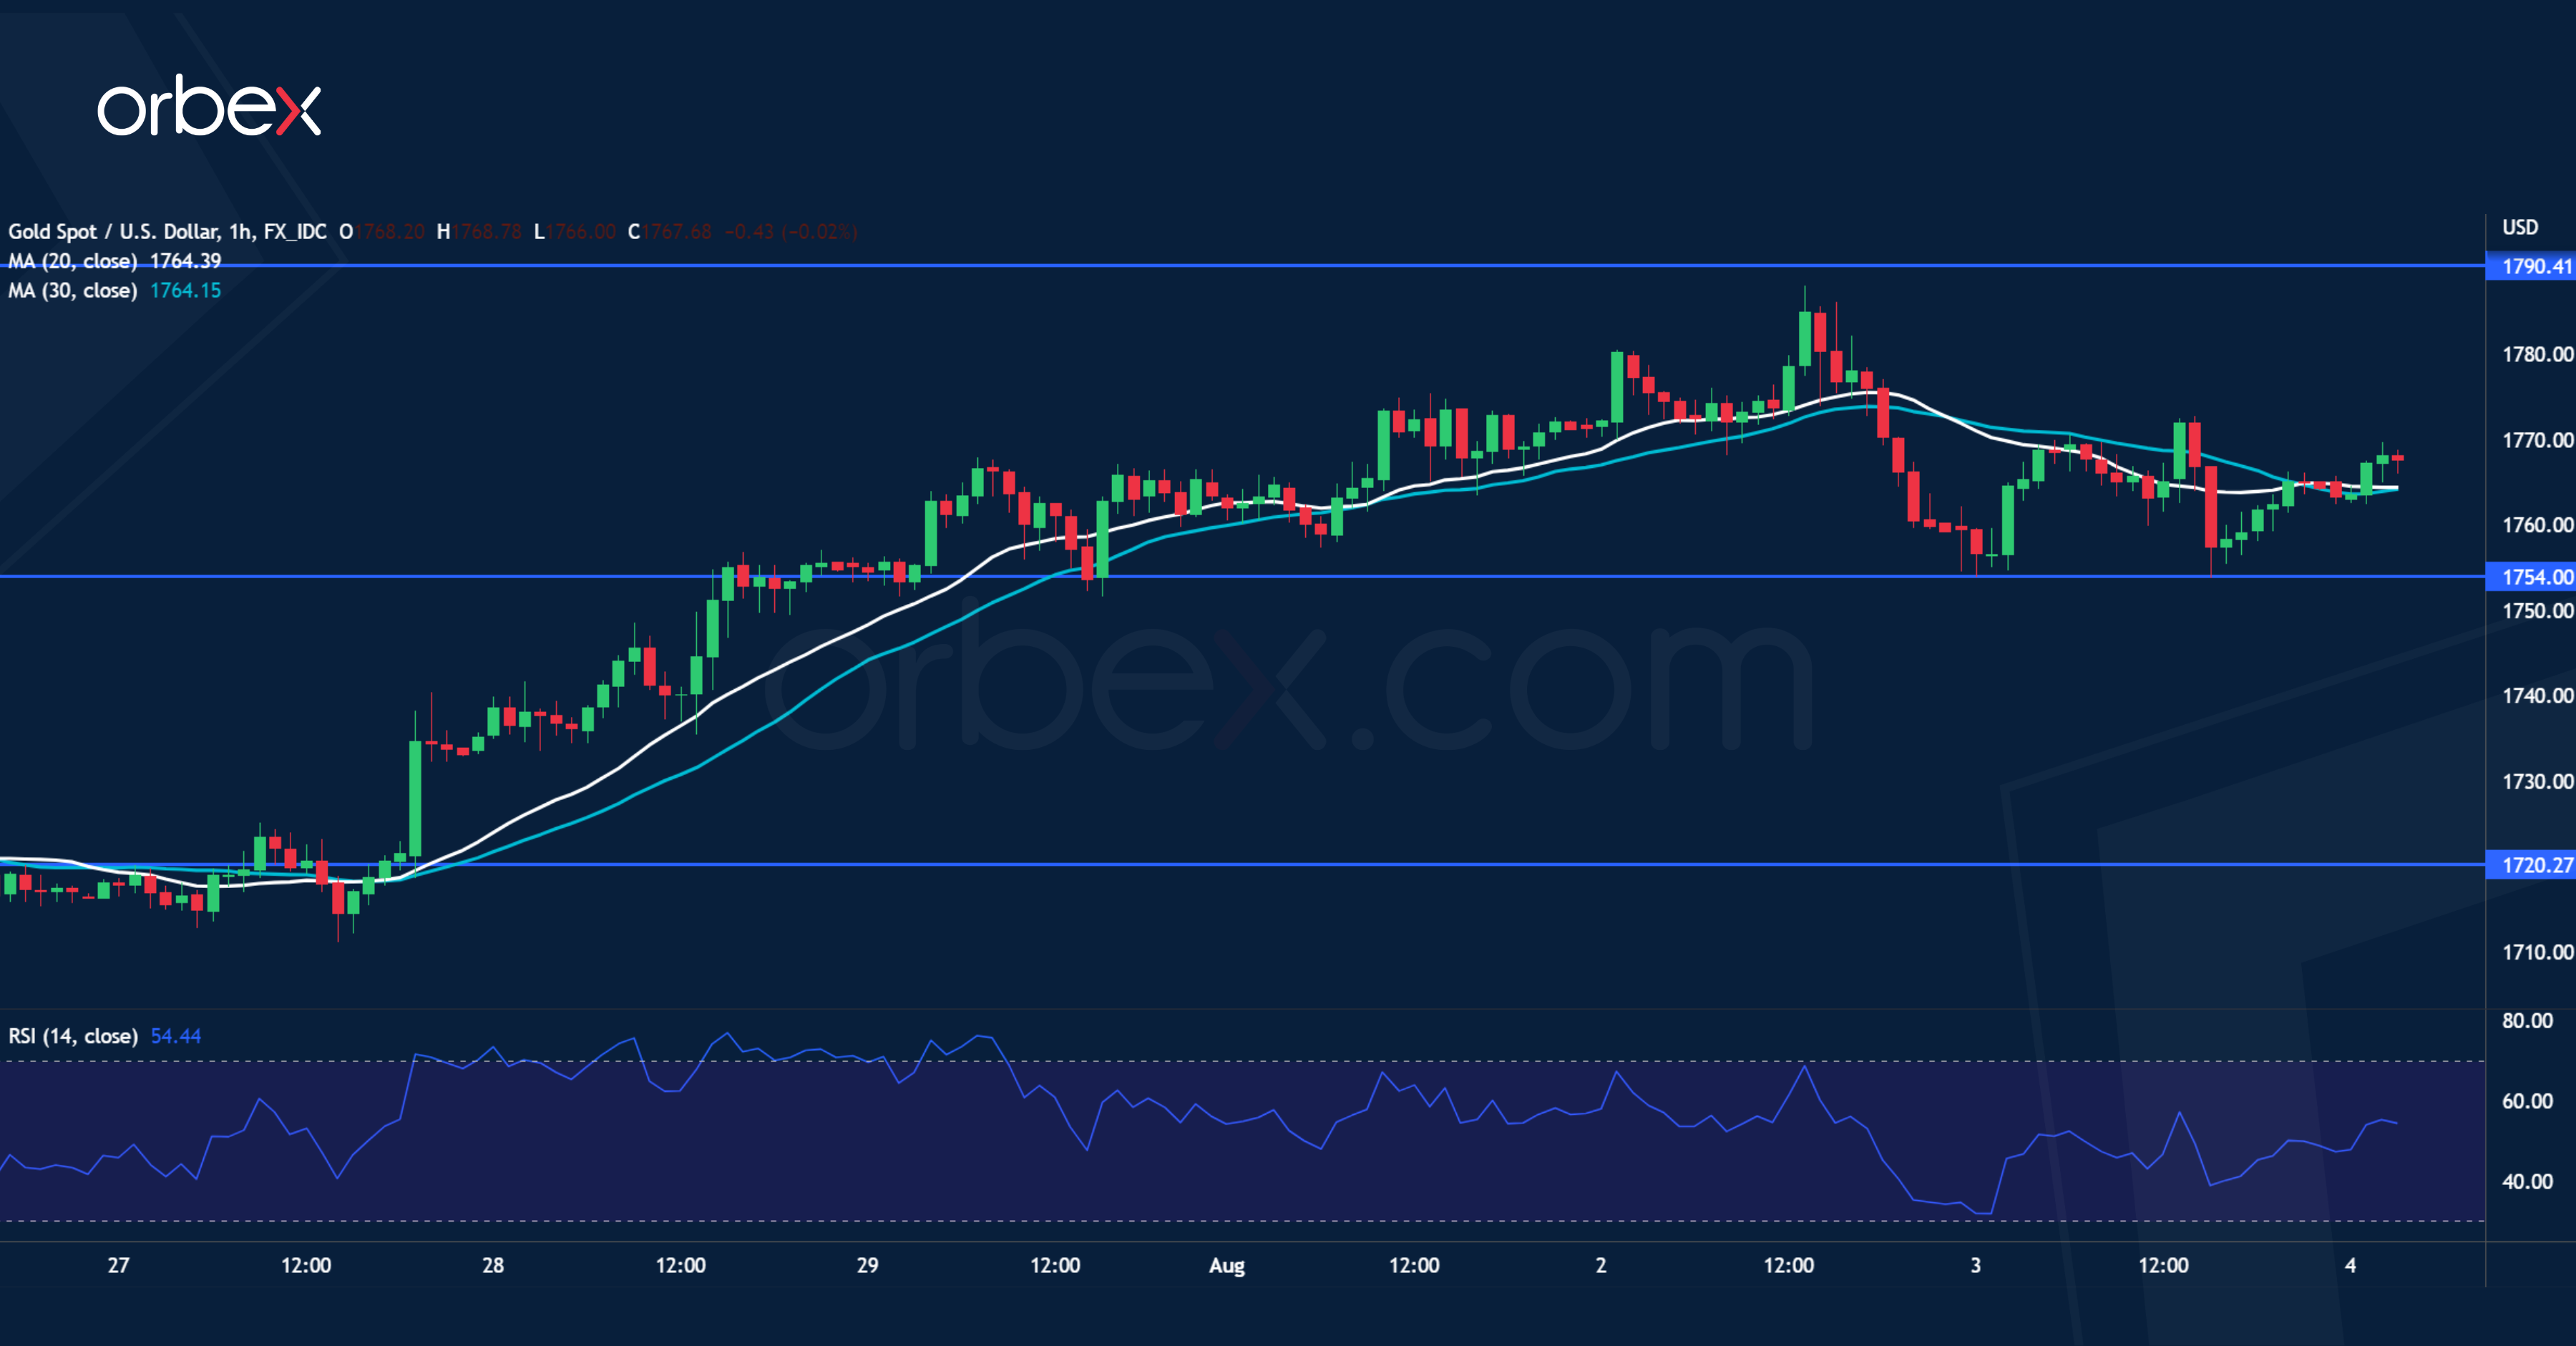
XAU/USD Seeks Support
Gold softens as US Treasury yields bounce over solid economic data. The price hit resistance at 1790 which used to be a critical floor on the daily chart. Sentiment has remained cautious after its breakout and the bears could be waiting to sell into strength. A break below 1770 has prompted some leveraged buyers to bail out leaving 1754 as their second line of defence. Its breach could attract momentum selling and extend losses towards 1720. Only a rally back above 1790 would renew buyers’ interest and send bullion to 1825.
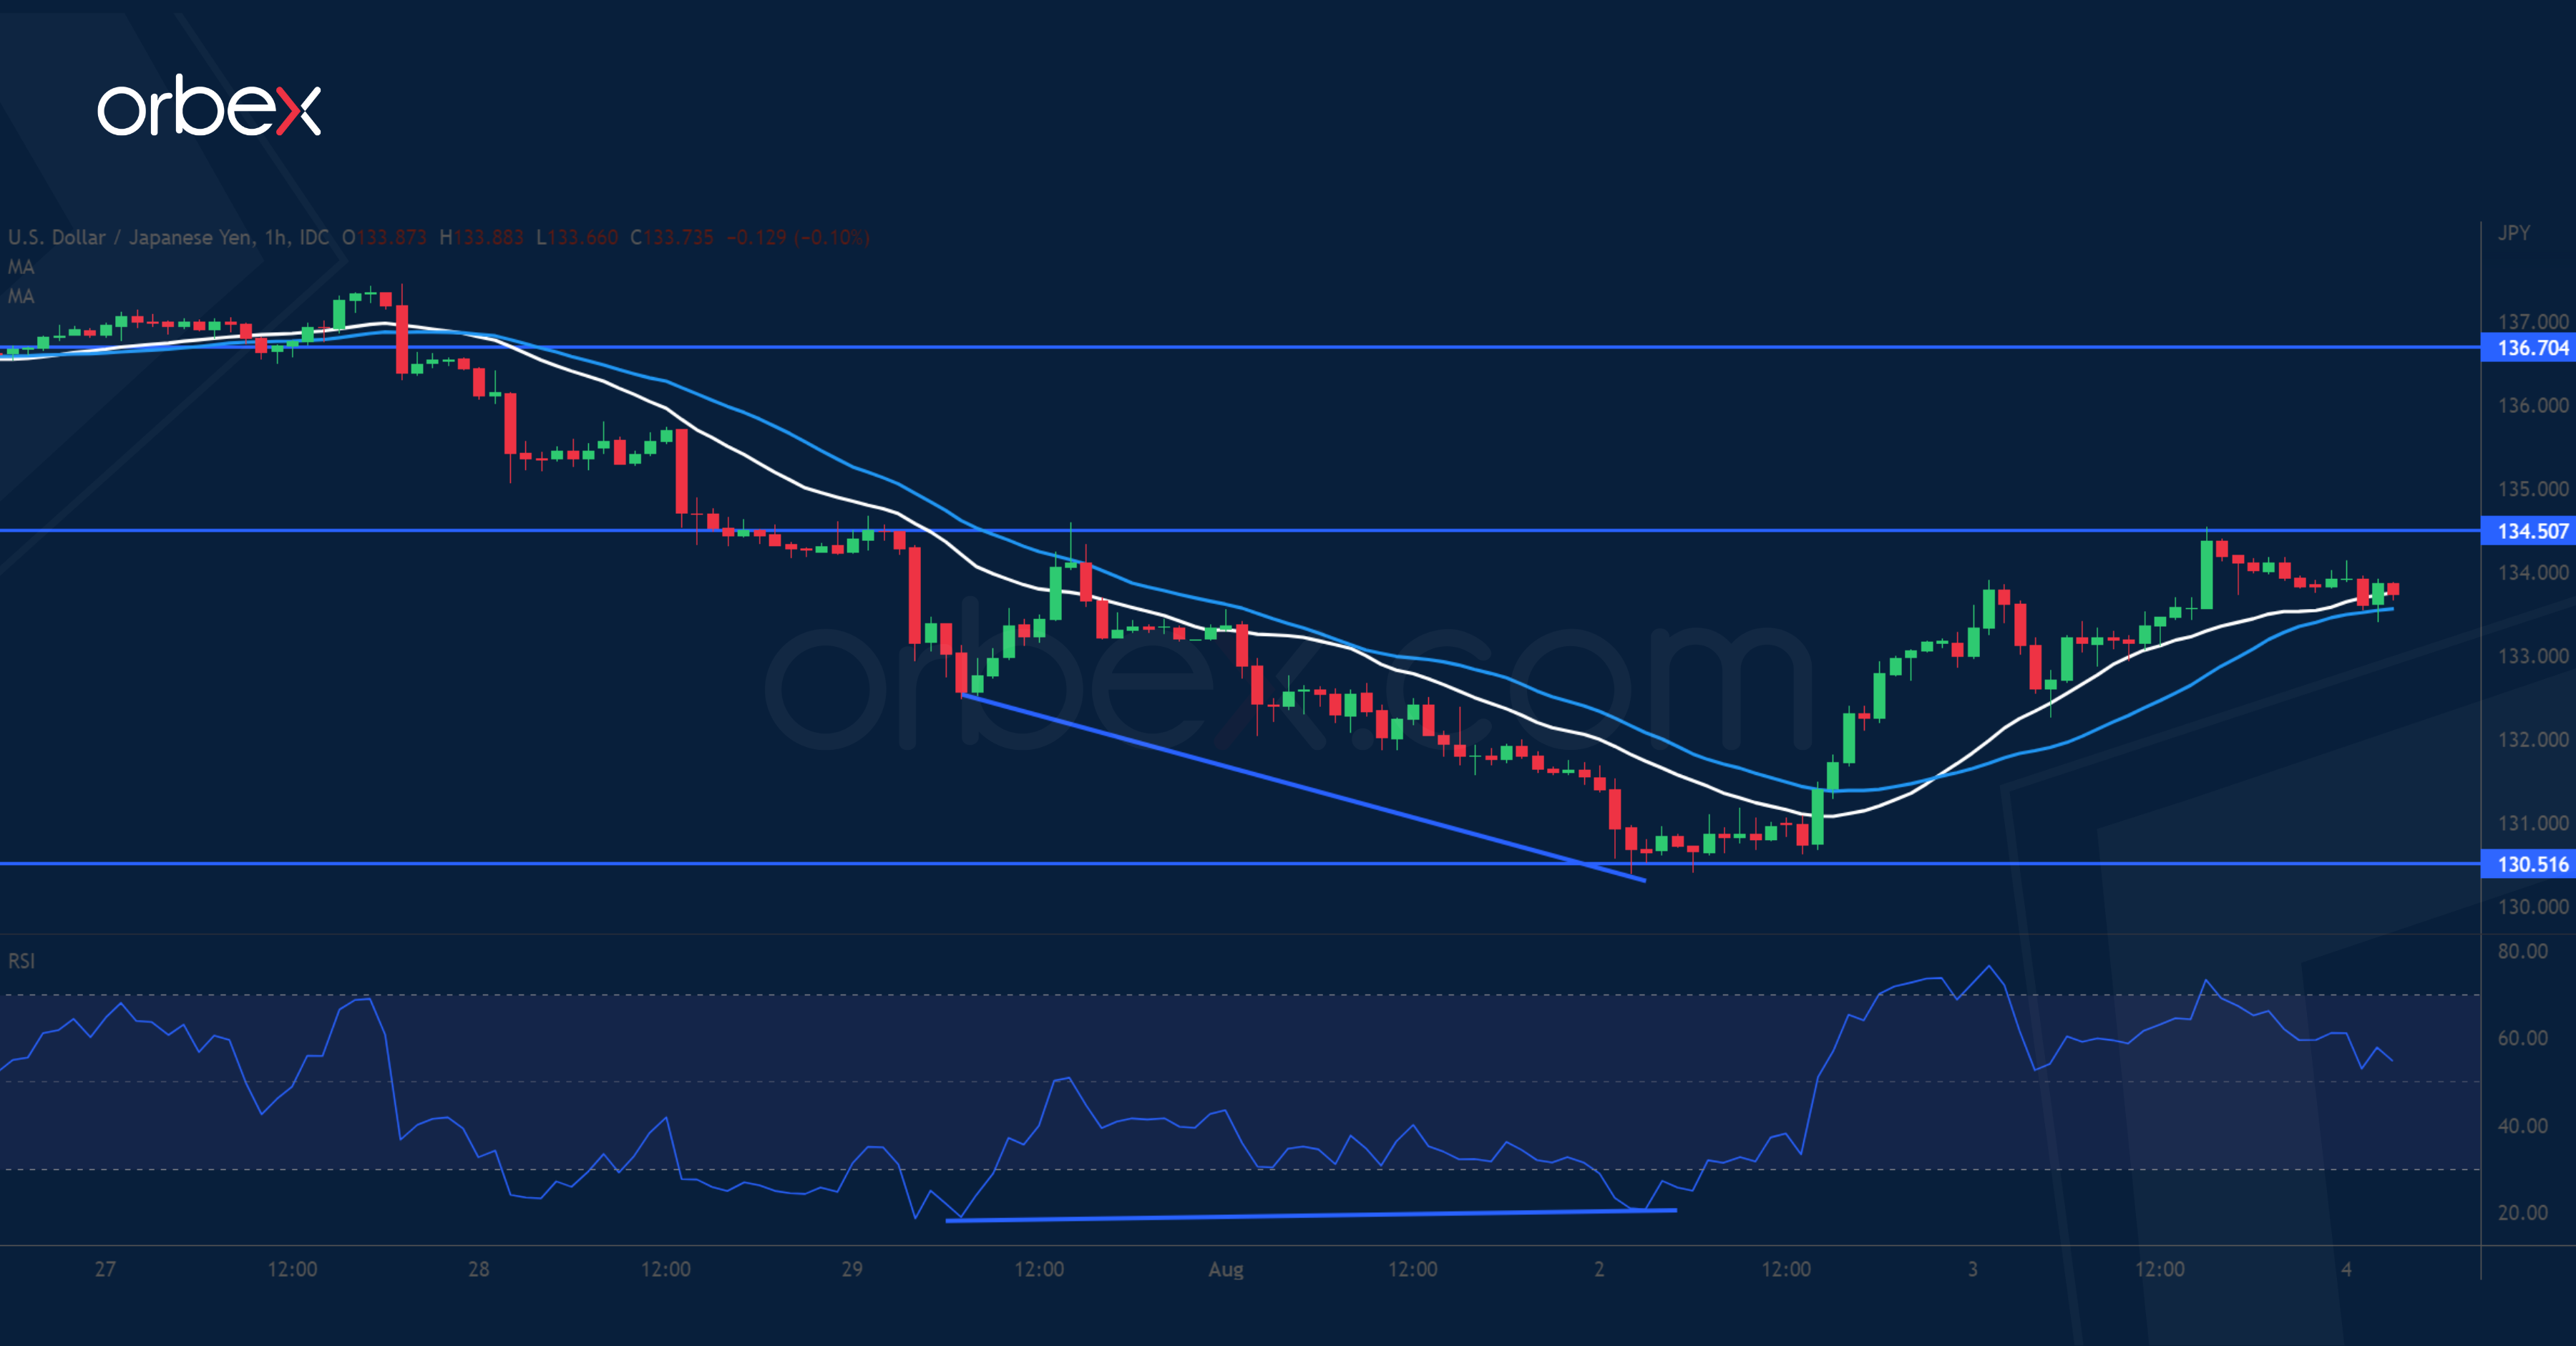
USD/JPY Bounces Back
The US dollar clawed back losses as services PMI exceeded expectations. A bullish RSI divergence indicates a loss of momentum in the sell-off. The pair bounced off the demand zone around 130.50 at the start of the June breakout. This could be due to profit-taking from the short side. A close above 134.50 would help the bulls reclaim control of the price action. From the daily chart perspective, the uptrend is still intact in the medium-term, though there is a chance of consolidation in the coming days.
BoE to Jack Up Rates by 50 bps Today to 1.75%
Markets
Minneapolis Fed and SF president Kashkari and Daly yesterday put it very clearly: rate cuts in 2023 are very unlikely and markets are ahead of themselves pricing them in. These are just two more quotes from a concerted hawkish intervention by the Fed. Fed’s Barkin sought to ease concerns for a recession, citing the strong labour market. His words were also backed by the strong US services ISM, which increased from 55.3 to 56.7, defying expectations for a drop to 53.5. Business activity and new orders surged. Prices paid fell to the lowest since February 21 while backlogs (viewed by some as a proxy for demand-supply imbalances) eased too. US yields shot up before retracing again. The shorter tenors did retain some of the gains though. The 2y finished 1.6 bps higher compared to losses between 4.4 and 6.2 bps for the 10y-30y segment. Bunds underperformed. The curve bear flattened, seeing changes of 7.8 bps at the front and 4.3 bps further out. The yen on FX markets lagged G10 peers, allowing USD/JPY to extend a comeback to 133.86. The dollar itself traded directionless. EUR/USD ended flat sub 1.02 while the DXY index eked out a small gain (thanks to the weak yen) to 106.50. The intraday core bond yield dynamics supported stocks. European shares rose 1.3%, gains on WS were even double that (2.6% for Nasdaq). Oil prices briefly jumped to $102/b (Brent) following OPEC’s symbolic output boost of 100k barrels/day but soon slipped back below the triple digits.
Asian-Pacific trading this morning is muted with little news flow to guide markets through. The kiwi and Aussie dollar secure the first and second place, amongst others helped by a massive Australian trade surplus (see below). Equities trade mostly in the green. Taiwan underperforms (-0.6%) amid lingering geopolitical tensions. Core bonds shift lower.
The Bank of England is in focus today. At the previous meeting, the statement read that if inflation looks more persistent, the central bank may have to act “more forcefully”. Price increases meanwhile rose to 9.4% in June. With gas prices having surged again, which some say could raise the household energy cap in October by a stunning 70%, the BoE’s estimate of inflation peaking at 11%+ is outdated once again. In order to prevent high inflation expectations getting entrenched (triggering second-round effects), we expect the BoE to jack up rates by 50 bps today to 1.75%. This is, however, discounted by markets, not least sterling, and not doing so would thus come as a major disappointment. The accompanying rhetoric will determine any follow-up gains for the Queen’s money. From a technical point of view, EUR/GBP, currently trading in the 0.836 area, has some room left to deepen losses within the downward sloping trend channel towards the 0.83 area. We assume this to be solid support. The policy meeting may even set the tone for EU and US markets in absence of other economic data. However, with the payrolls report looming (Friday), we don’t expect a material reaction. We’re keen though to see if the bottoming out process in core bond yields continues.
News Headlines
Australia’s trade surplus pushed to another record high amid searing prices of export products ranging from grains to metals and gold. Exports rose 5% while imports increased 1% amid Australians travelling overseas, bringing the June figure to A$17.7bn. Trade has been a key reason for the Australian economy to hold up pretty well and will provide another big boost to the country’s second-quarter GDP. Down Under is stacking monthly surpluses for 4.5 years in a row now.
Brazil’s central bank (BCB) raised rates by an expected 50 bps to 13.75% while keeping the door open for a smaller increment in September. The central bank shifted its focus to the outlook for inflation more than a year ahead. It does so because of recent tax changes and a $7.6bn social aid package that have opposing effects on inflation, thus making near-term price behaviour estimates even more difficult. But it also indicates the BCB is keen on ending the tightening cycle. Inflation, standing at 11.39% in mid-July, is seen at 4.6% next year and 3.5% in 2024Q1. The BCB targets 3.25% in 2023 and 3% in 2024.
Technical Outlook and Review
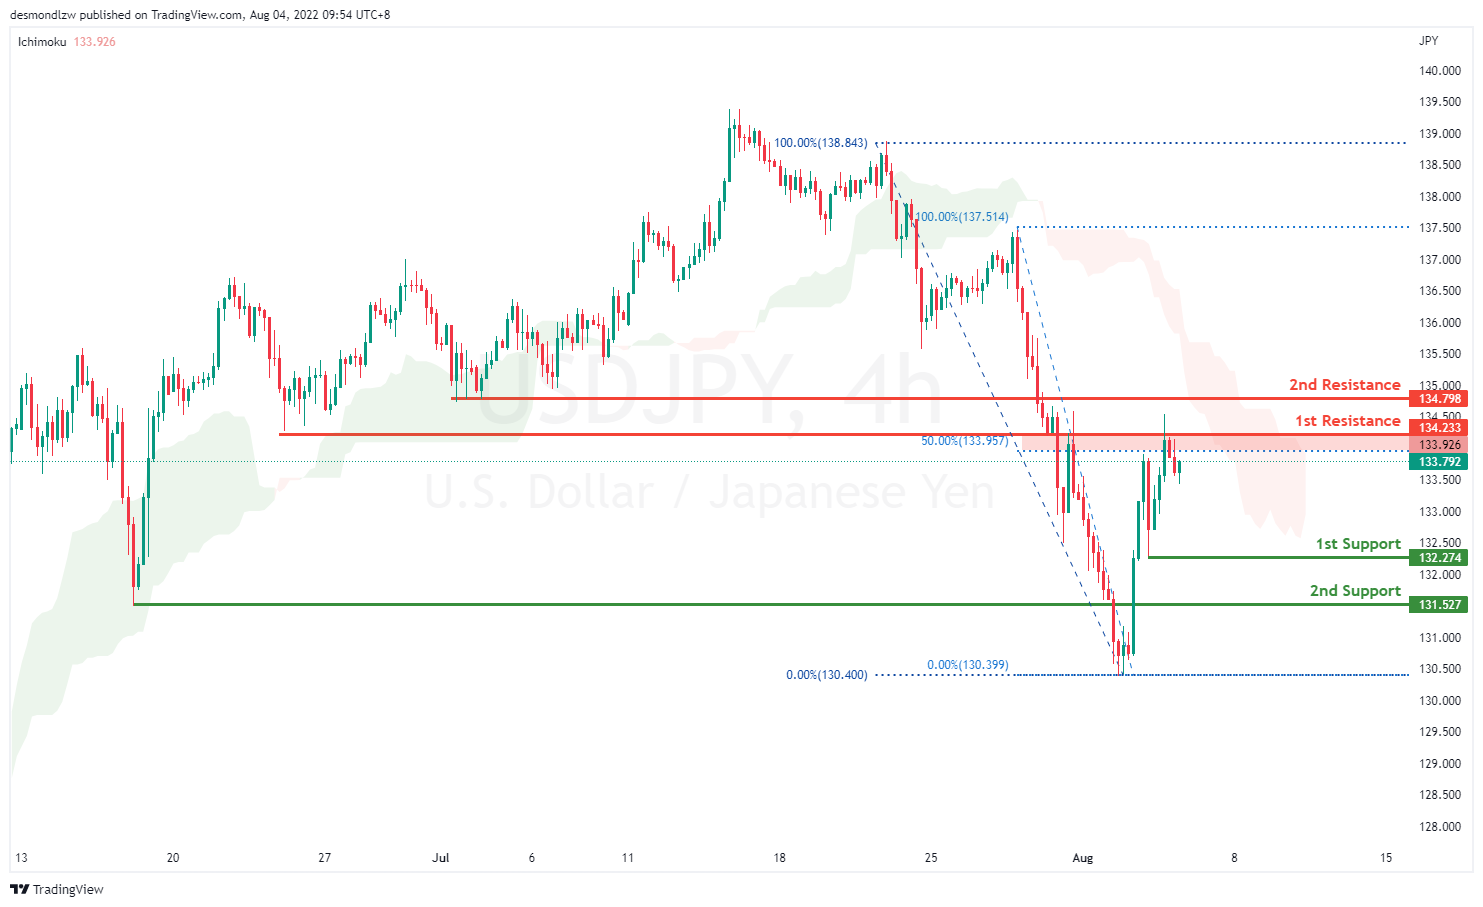
USD/JPY:
On the H4, price is bearish biased and moving strongly in an ascending trendline. It is still respecting the Ichimoku indicator, and has confirmed a strong downside momentum. It is now going to test at the first support at 132.256 which the previous swing low sits at. If prices were to break first support it will go to the second support at 131.527. Alternatively, price could bounce back up to test at the first resistance, 50% retracement at 134.213
Areas of consideration:
- H4 time frame, 1st resistance at 134.233
- H4 time frame, 1st support at 131.543
DXY:
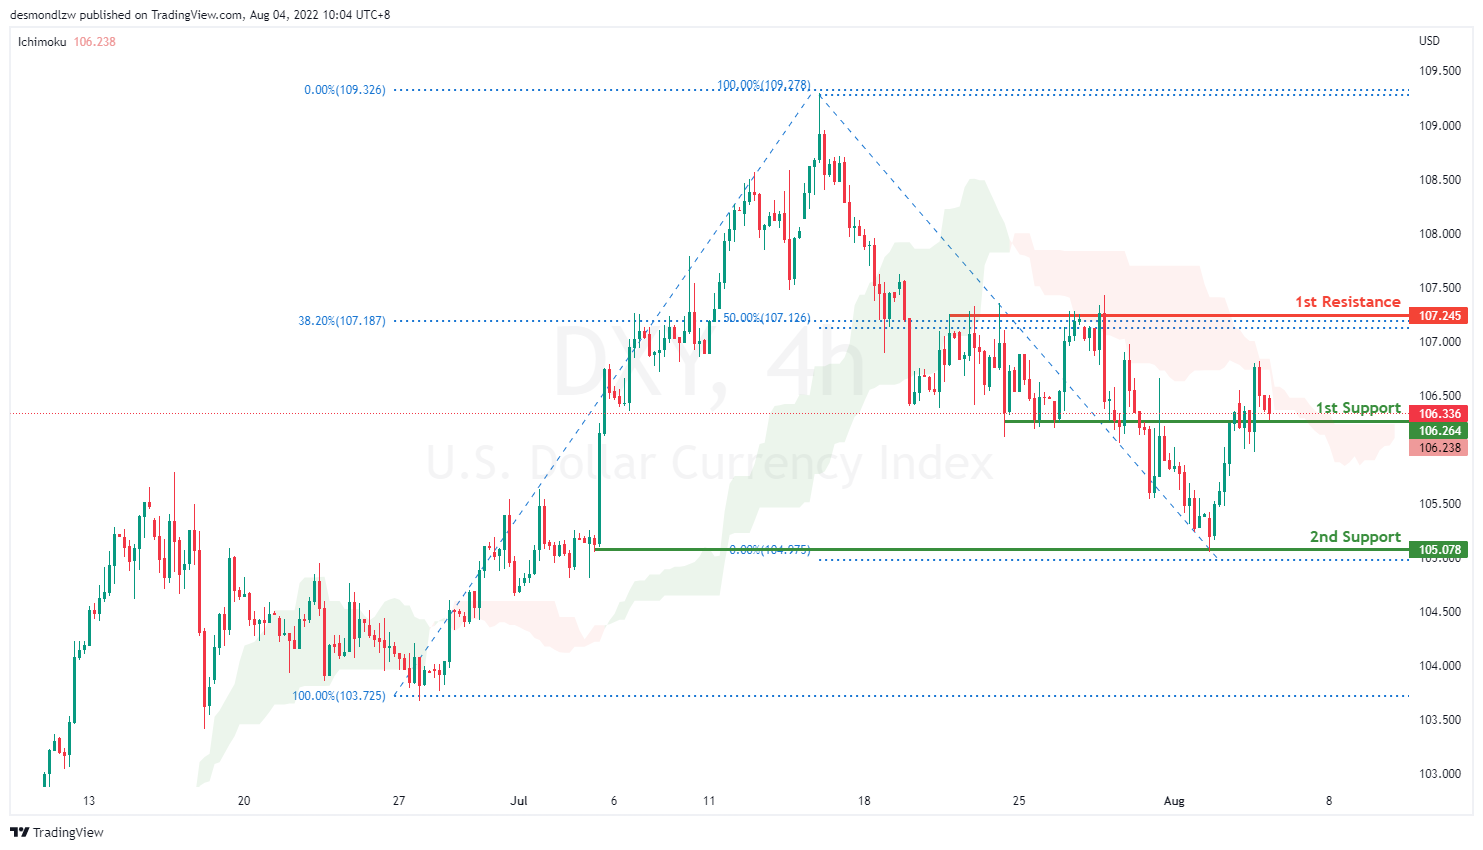
On the H4, prices have broken the ascending trend into an overall bearish biased trend. Prices has confirmed descending momentum, still respecting the Ichimoku cloud. It is now testing first support at 106.264 which is the previous swing low. If price were to break this key level, it will pull back further to test at second support 105.078. Alternatively, price could bounce back and test at 107.245 which coincides with 38.2% Fibonacci retracement
Areas of consideration:
- H4 time frame, 1st resistance at 107.245
- H4 time frame, 1st support at 106.264
EUR/USD :
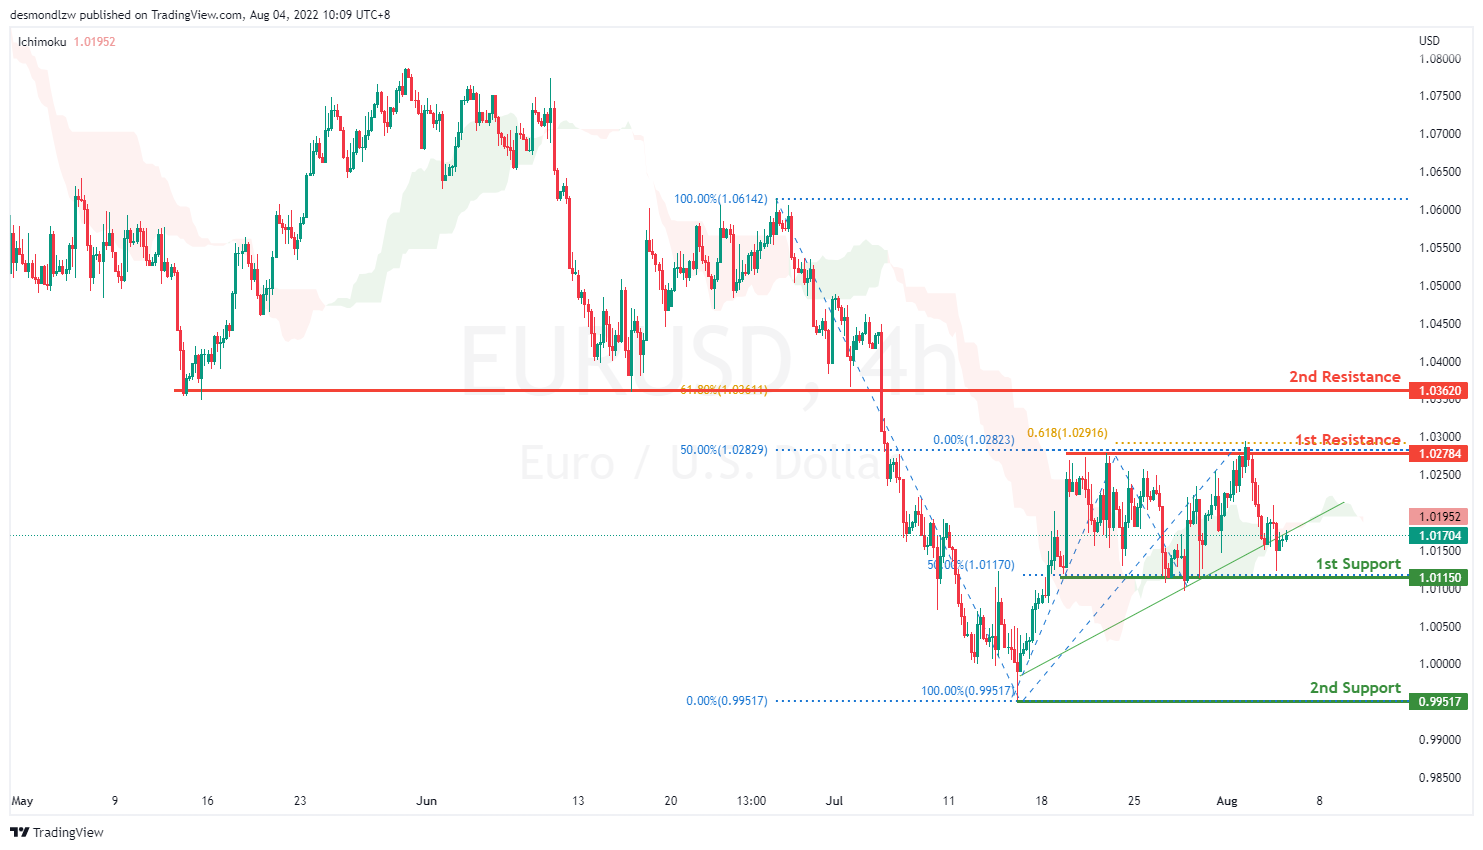
On the H4, prices have broken the bearish trend moving into a bullish biased trend. Price has rejected the 1.027 level, 50% retracement. It might pull back to test the previous swing low at 1.011, first support level. If prices break 1st support it will pull back further to test at 2nd support 0.995. Alternatively, If price fails to break the first support it might bounce off the first support to test at 1.027, 50% resistance level
Areas of consideration :
- H4 1st resistance at 1.027
- H4 1st support at 1.011
GBP/USD:
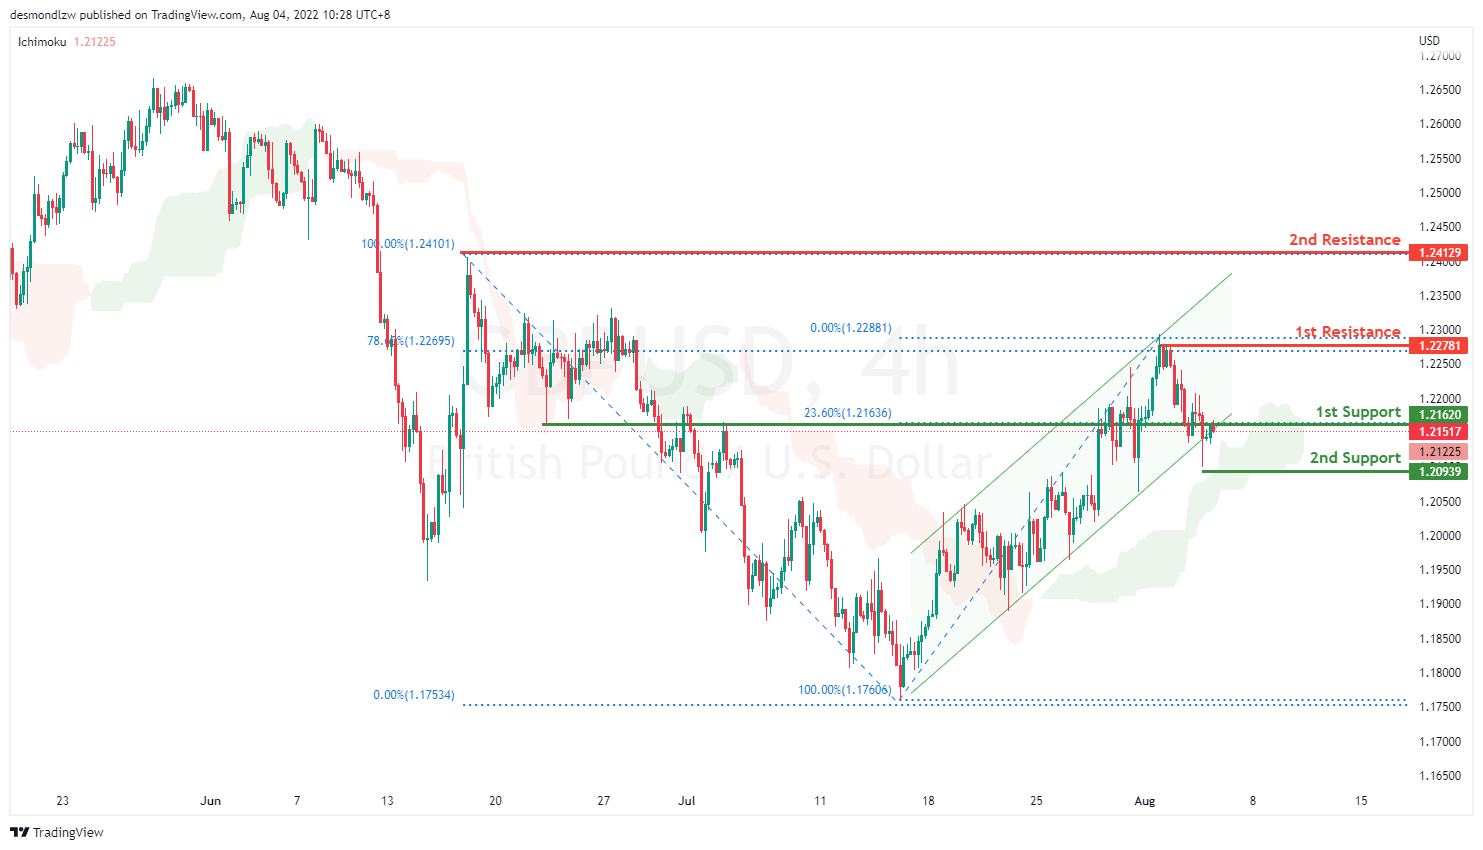
On the H4, with prices moving in an ascending channel and respecting the Ichimoku cloud, we are bullish biased. Price is now testing the first support at 1.216 which coincides with 23.6% Fibonacci retracement. If price fails to break support, and confirm an upside trend, we would expect bullish momentum to carry price to 1st resistance at 1.227 78.6% Fibonacci retracement then second resistance at 1.24129
Areas of consideration:
- H4 1st resistance at 1.227
- H4 1st support at 1.216
USD/CHF:
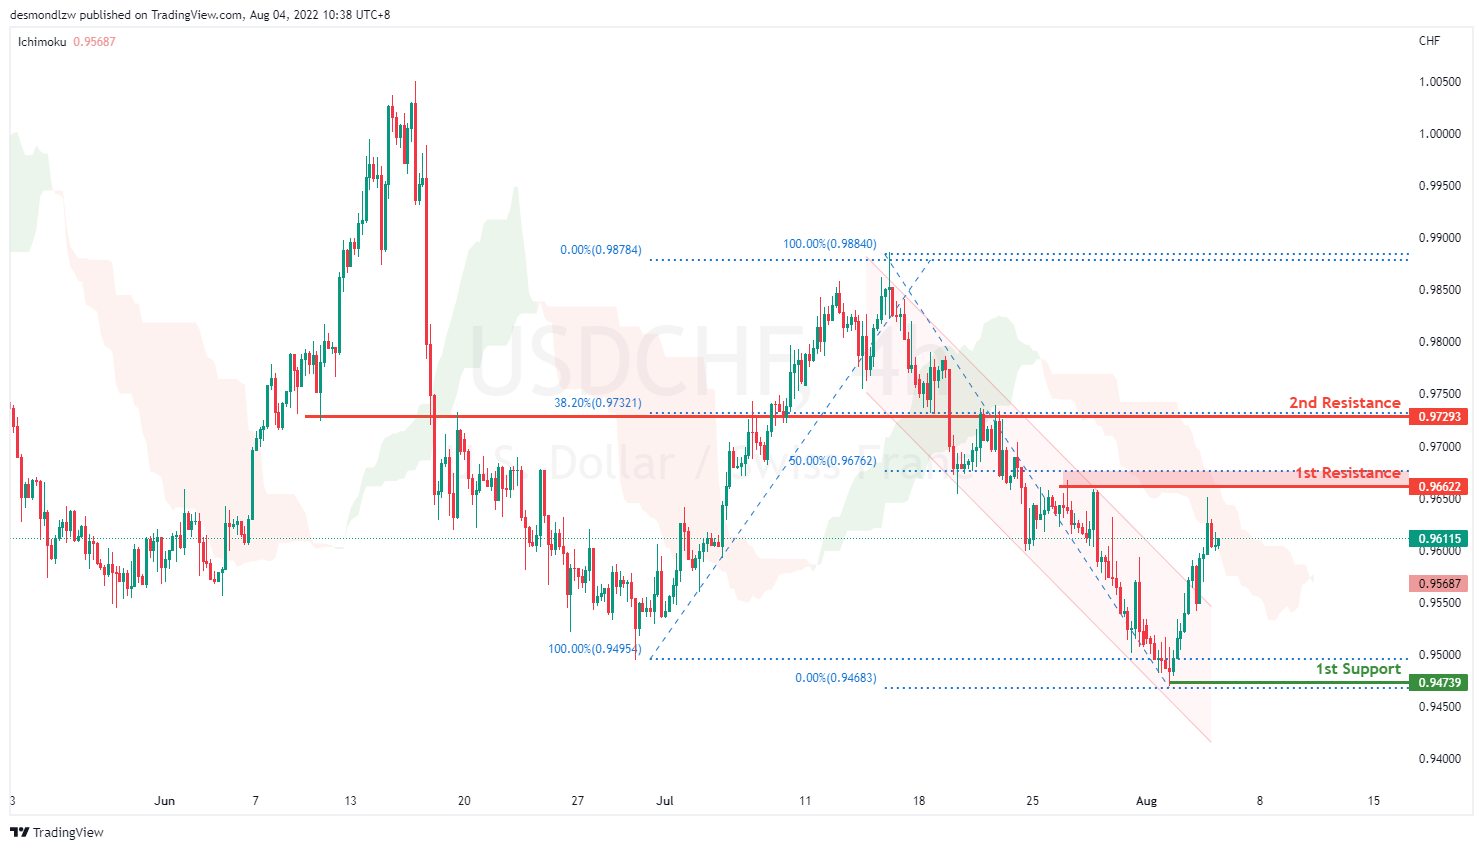
On the H4, prices have broken the descending channel and move into a slightly bullish momentum. It is moving towards the 1st resistance at 0.966 which is also the 50% Fibonacci retracement. If prices break this key level, it will pull back further to test at the second resistance 0.977 which is also the 38.2% retracement level. Alternatively if price rejects, it will test the support level 0.947
Areas of consideration
- H4 1st resistance at 0.966
- H4 1st support at 0.947
XAU/USD (GOLD):
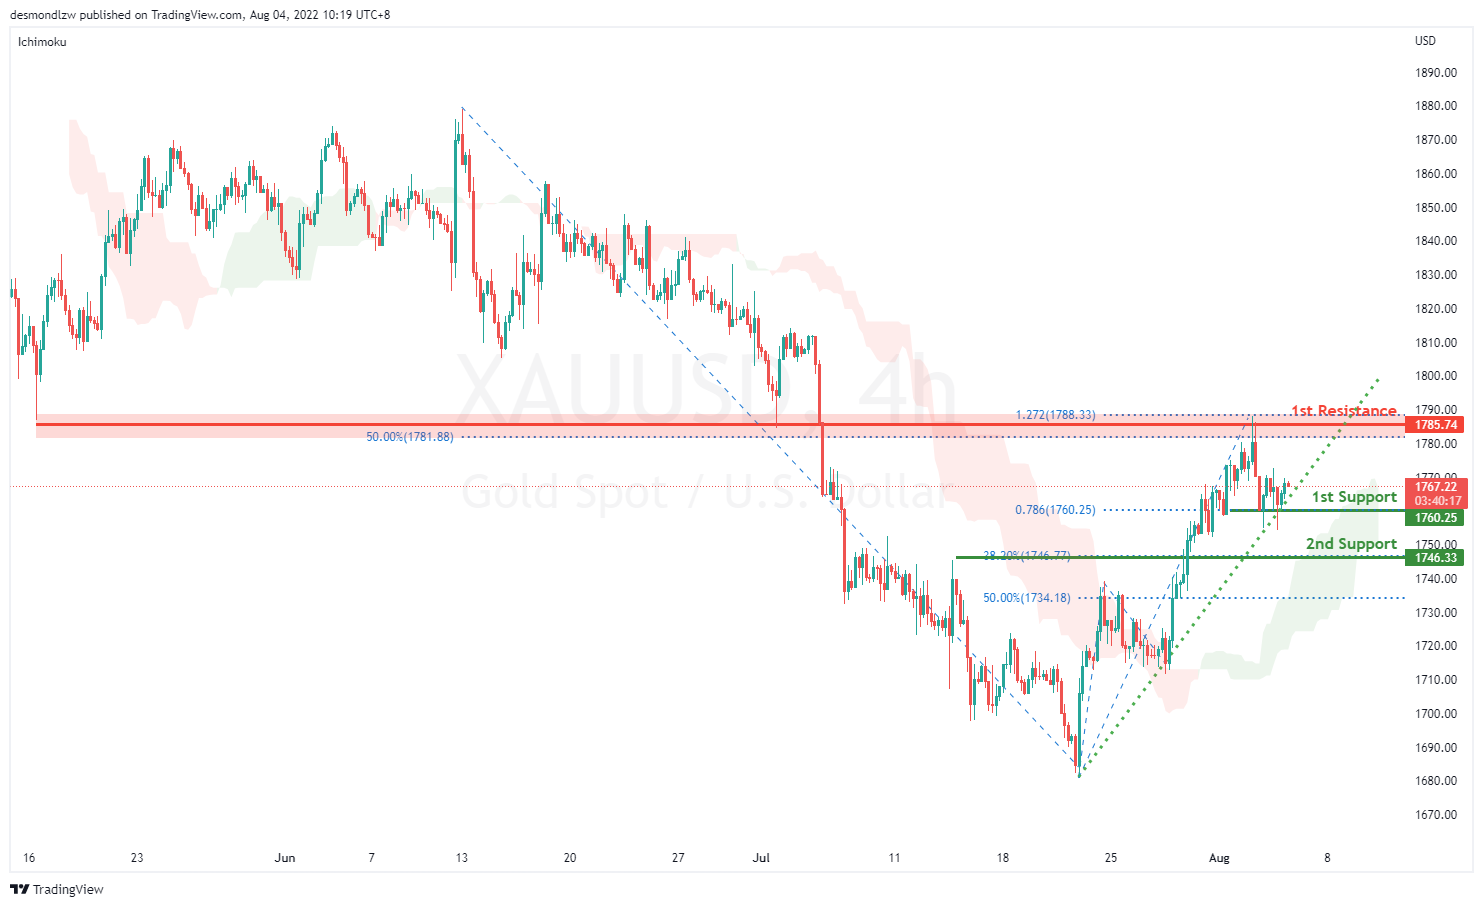
On the H4, with prices going along the ascending trendline and moving above ichimoku cloud, we have a bullish bias that price may rise from the 1st support at 1760.25, which is in line with the 78.6% fibonacci projection to 1st resistance at 1785.74 where the the swing high, 127.2% projection and 50% fibonacci retracement are. Alternatively, prices may drop to 2nd support at 1746.33,which is in line with 38.2% fibonacci retracement.
Areas of consideration:
- H4 time frame, 1st support at 1760.25
- H4 time frame, 1st resistance at 1785.74
AUD/USD:
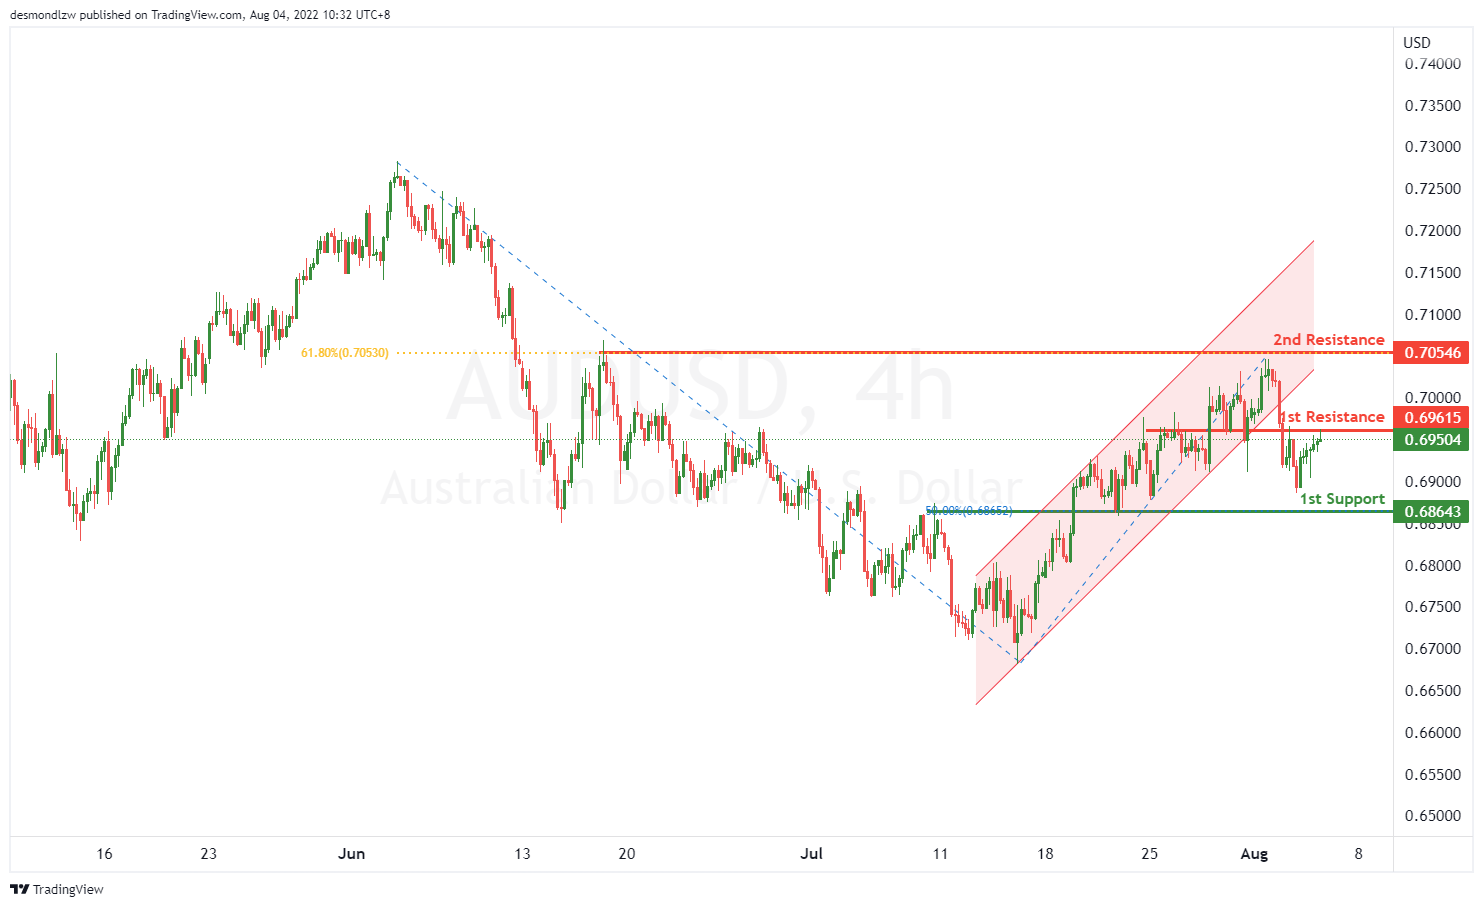
On the H4, with price breaking the ascending trend channel, we have a bearish bias that price will drop from the 1st resistance at 0.69615, where the overlap resistance is to the 1st support at 0.68643 where the 50% fibonacci retracement is. Alternatively, price may rise to the 2nd resistance at 0.70546 which is in line with 61.8% fibonacci retracement.
Areas of consideration
- H4 1st resistance at 0.69615
- H4 1st support at 0.68643
NZD/USD:
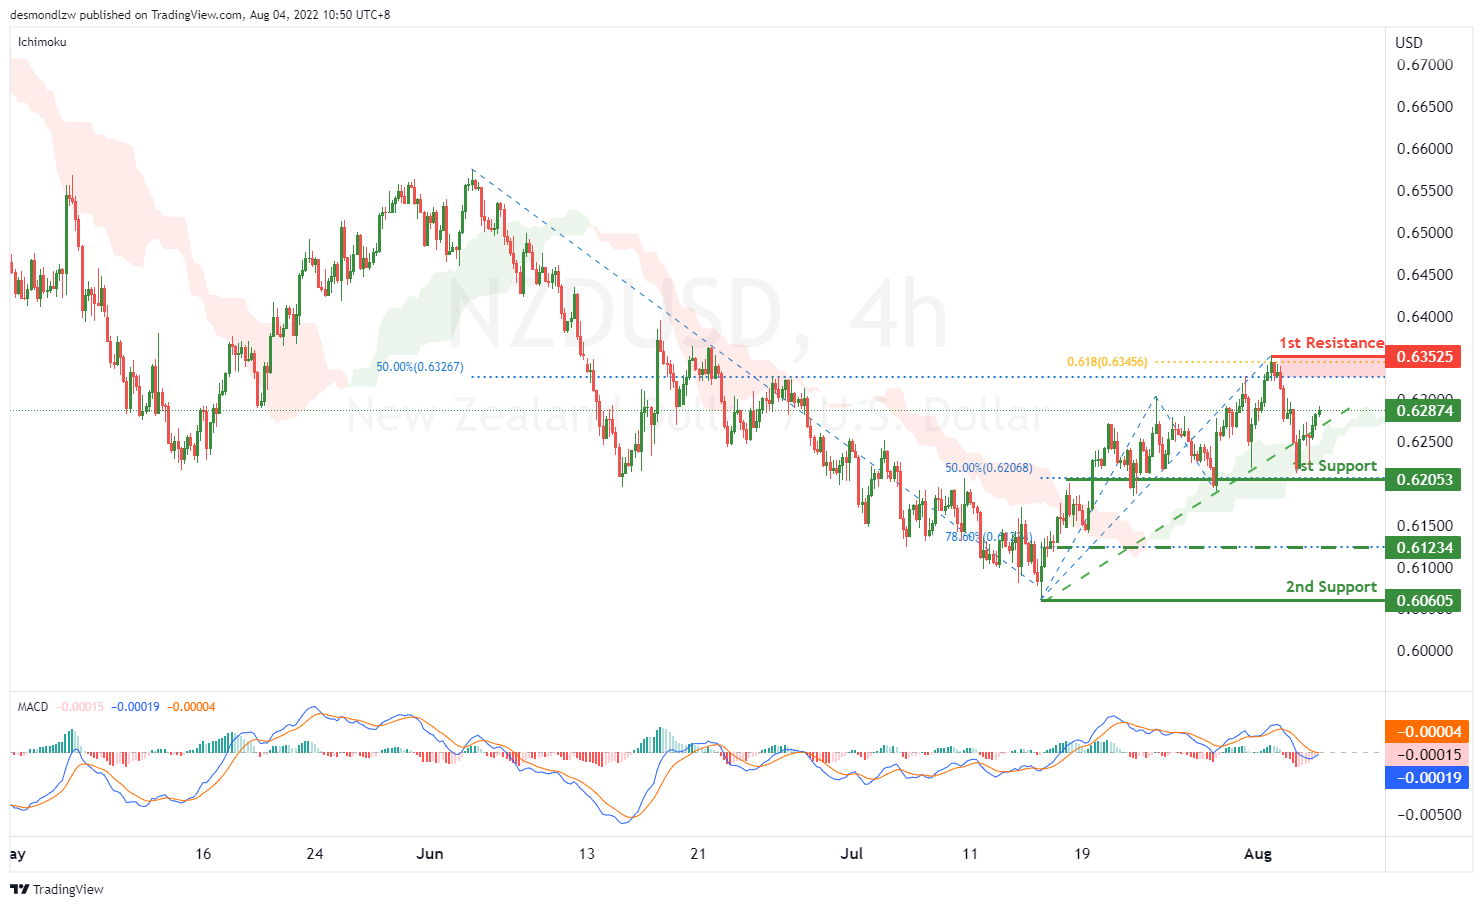
On the H4, with price bouncing off to the ascending trendline, also, the momentum of red histogram is decreasing, we have a bullish bias that price may rise from the 1st support at 0.62053 where 50% fibonacci retracement is to the 1st resistance at 0.63525 at the swing high, 61.8% fibonacci projection and 50% fibonacci retracement. Alternatively, price may reverse off the 1st support and drop to 2nd support at 0.60605 where the swing low is. Take note the price of 0.61234 could be the intermediate support, which is in line with the 78.6% fibonacci retracement.
Areas of consideration:
- H4 time frame, 1st support at 0.62053
- H4 time frame, 1st resistance at 0.63525
USD/CAD:
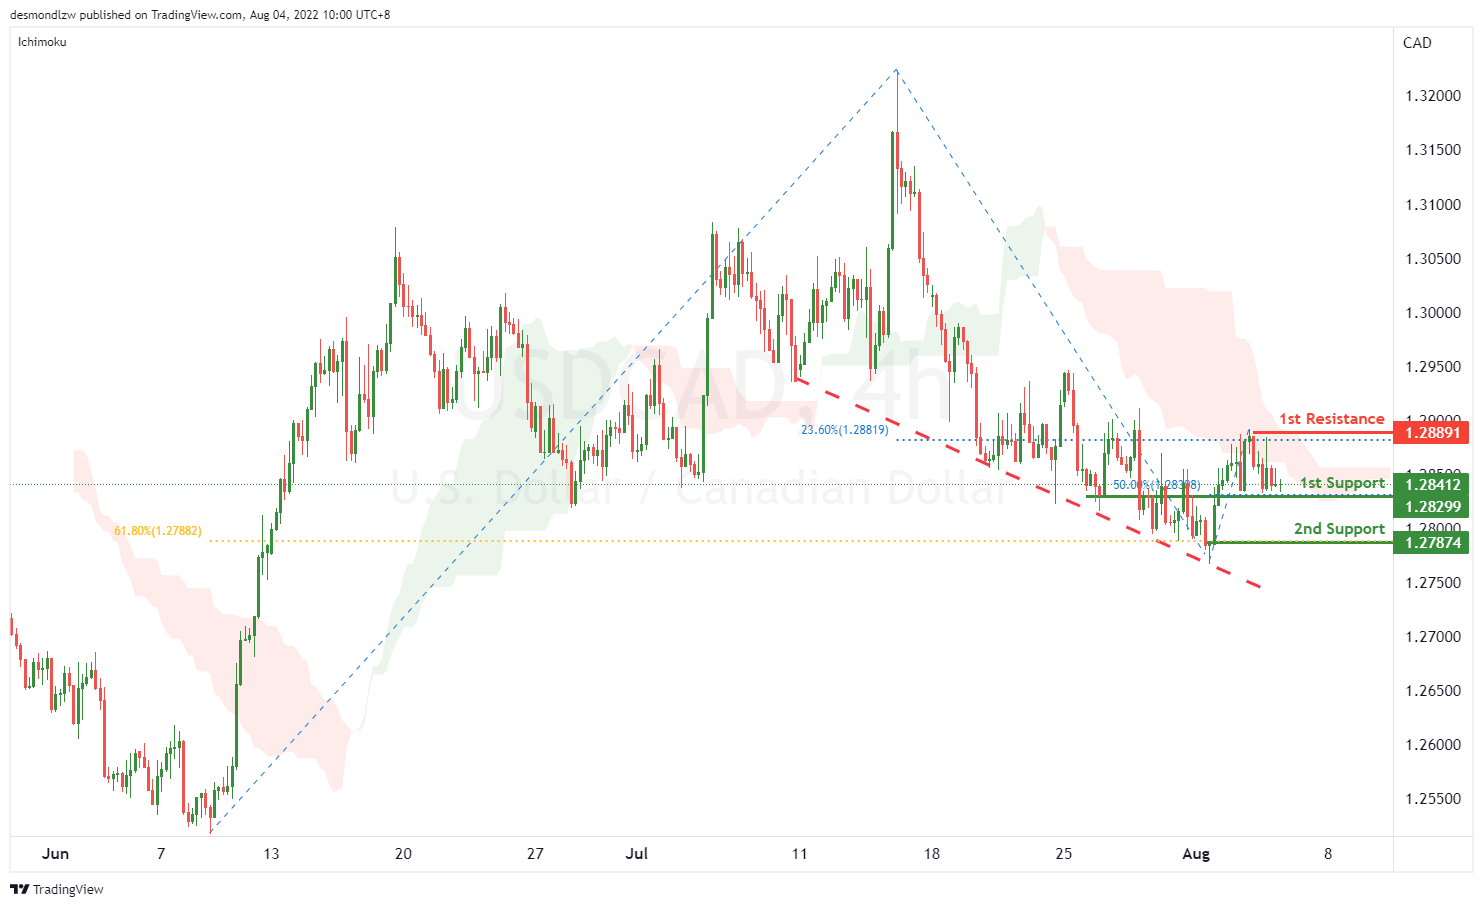
On the H4, with the price going along the descending trendline and below ichimoku cloud, we have a bearish bias that the price may drop from our 1st support at 1.28299, which is in line with 50% fibonacci retracement to our 2nd support at 1.27874, which is in line with the 61.8% fibonacci retracement. Alternatively, the price may rise to the 1st resistance at 1.28891, which is in line with the swing high and 23.6% fibonacci retracement.
Areas of consideration:
- H4 time frame, 1st support at 1.28299
- H4 time frame, 2nd support at 1.27874
OIL:
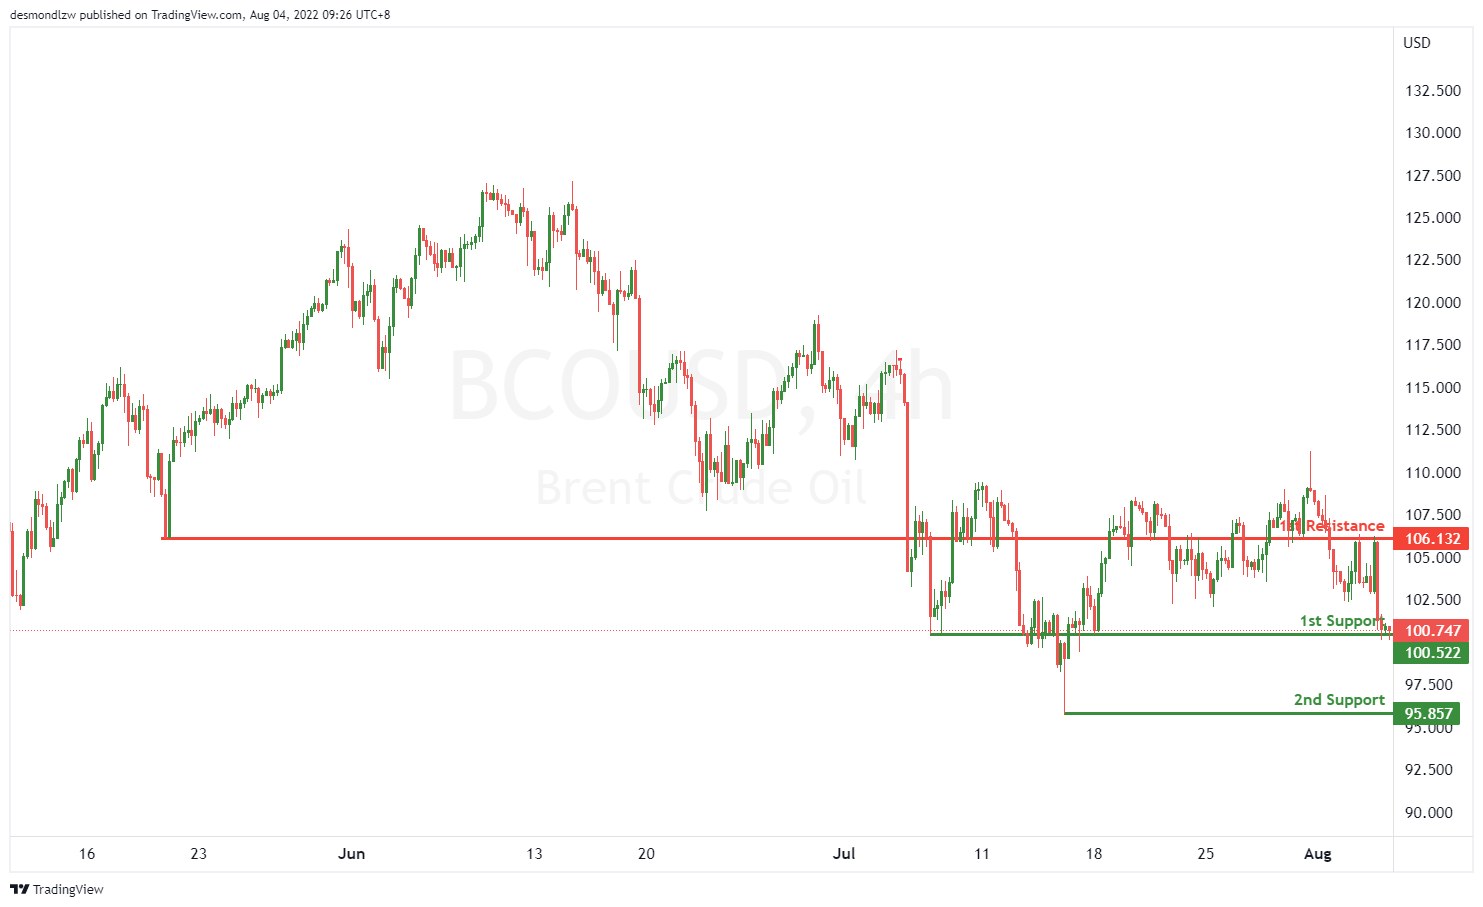
On the H4, with price fluctuating within the consolidation area, we have a neutral bias that price might rise from the 1st support at 100.851, where the overlap support is to 1st resistance at 109.025, where the overlap resistance is. Otherwise, the price may drop to our 2nd support at 95.857, where the swing low is.
Areas of consideration:
- H4 time frame, 1st support of 100.851
- H4 time frame, 1st resistance of 109.025
Or
- H4 time frame, 1st support of 100.851
- H4 time frame, 2ndt support of 95.857
Dow Jones Industrial Average:
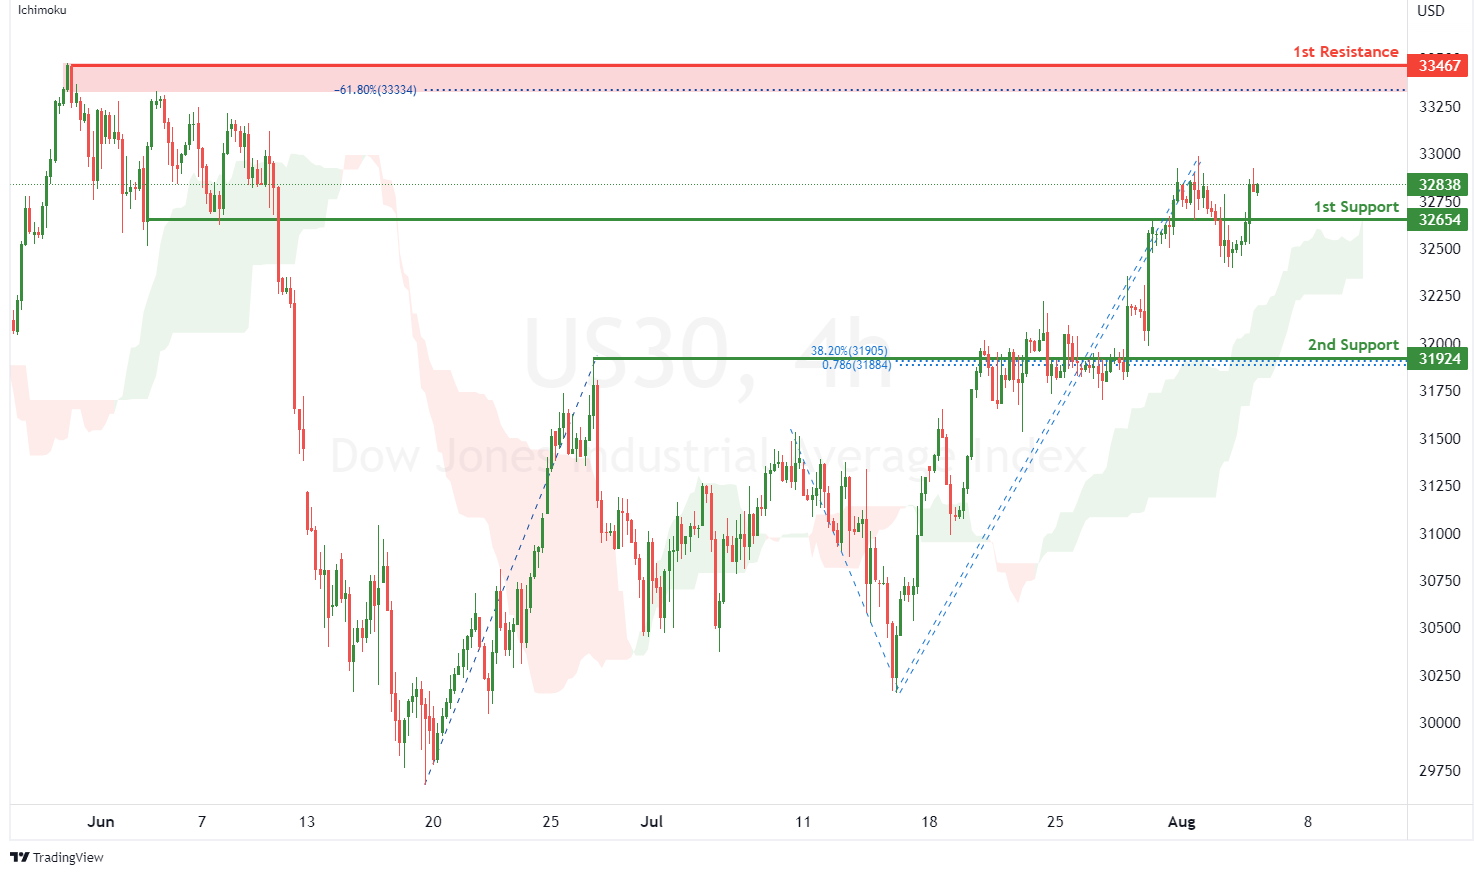
On the H4, with price moving above the ichimoku indicator, we have a bullish bias that price will rise from the 1st support at 32654 where the pullback support is to the 1st resistance at 33467 where the swing high resistance and -61.8% fibonacci expansion are. Alternatively, price could break 1st support structure and drop to 2nd support at 31924 where the pullback support, 38.2% fibonacci retracement and 78.6% fibonacci projection are.
Areas of consideration:
- H4 time frame, 1st resistance of 33467
- H4 time frame, 1st support at 32654
DAX:
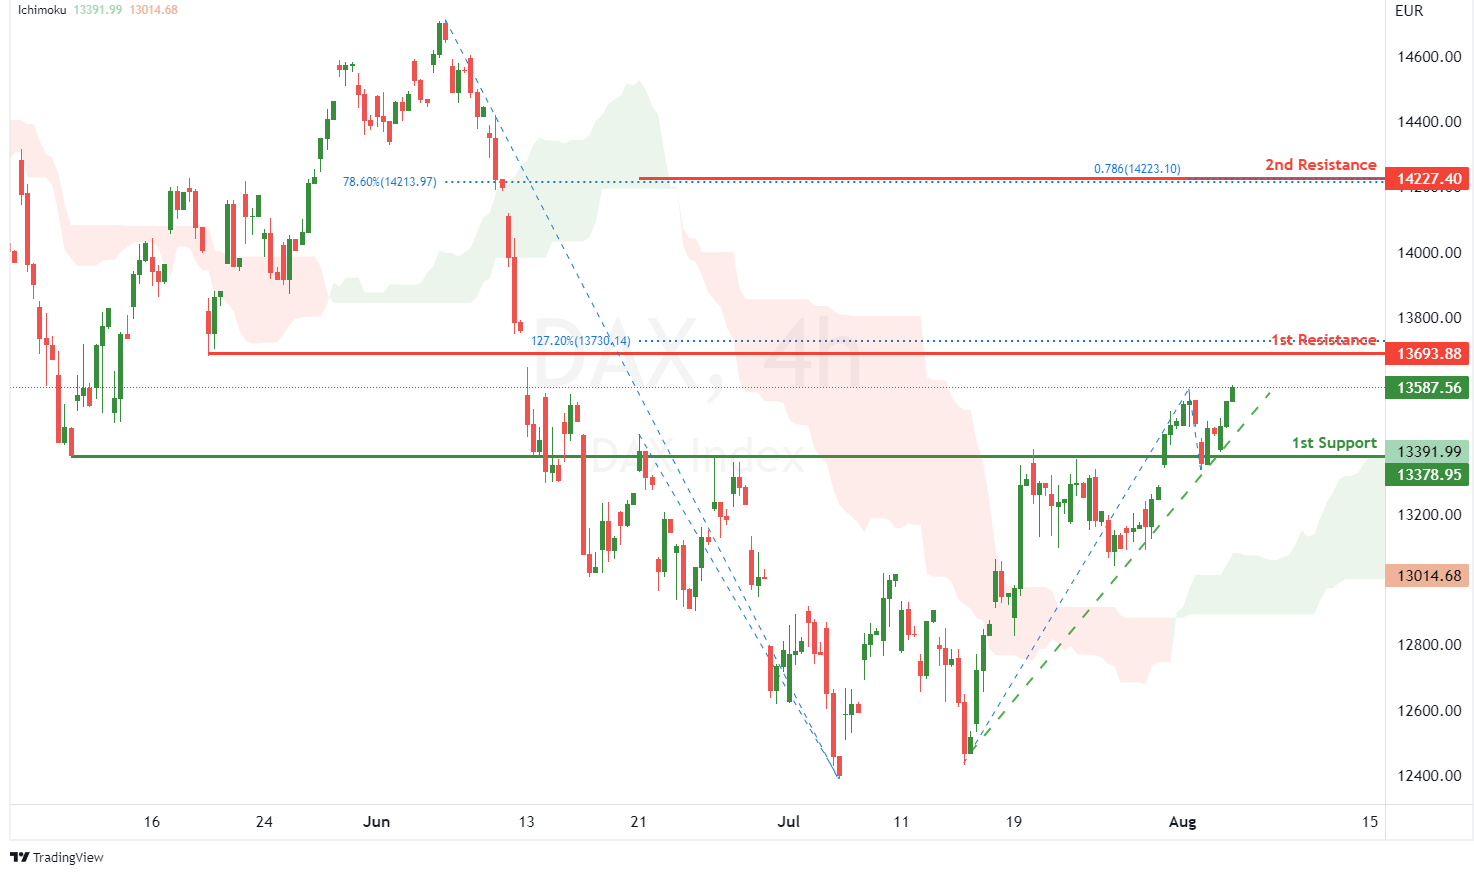
On the H4, with price moving above the ichimoku indicator and along the ascending trendline, we have a bullish bias that price will rise to 1st resistance at 13693.88 where the pullback support and 127.2% fibonacci extension are. Once there is upside confirmation of price breaking 1st resistance structure, we would expect bullish momentum to carry price to 2nd resistance at 14227.40 in line with 78.6% fibonacci projection and 78.6% fibonacci retracement. Alternatively, price could drop to 1st support at 13378.95 where the overlap support is.
Areas of consideration:
- H4 time frame, 1st resistance of 13693.88
- H4 time frame, 1st support at 13378.95
ETHUSD:
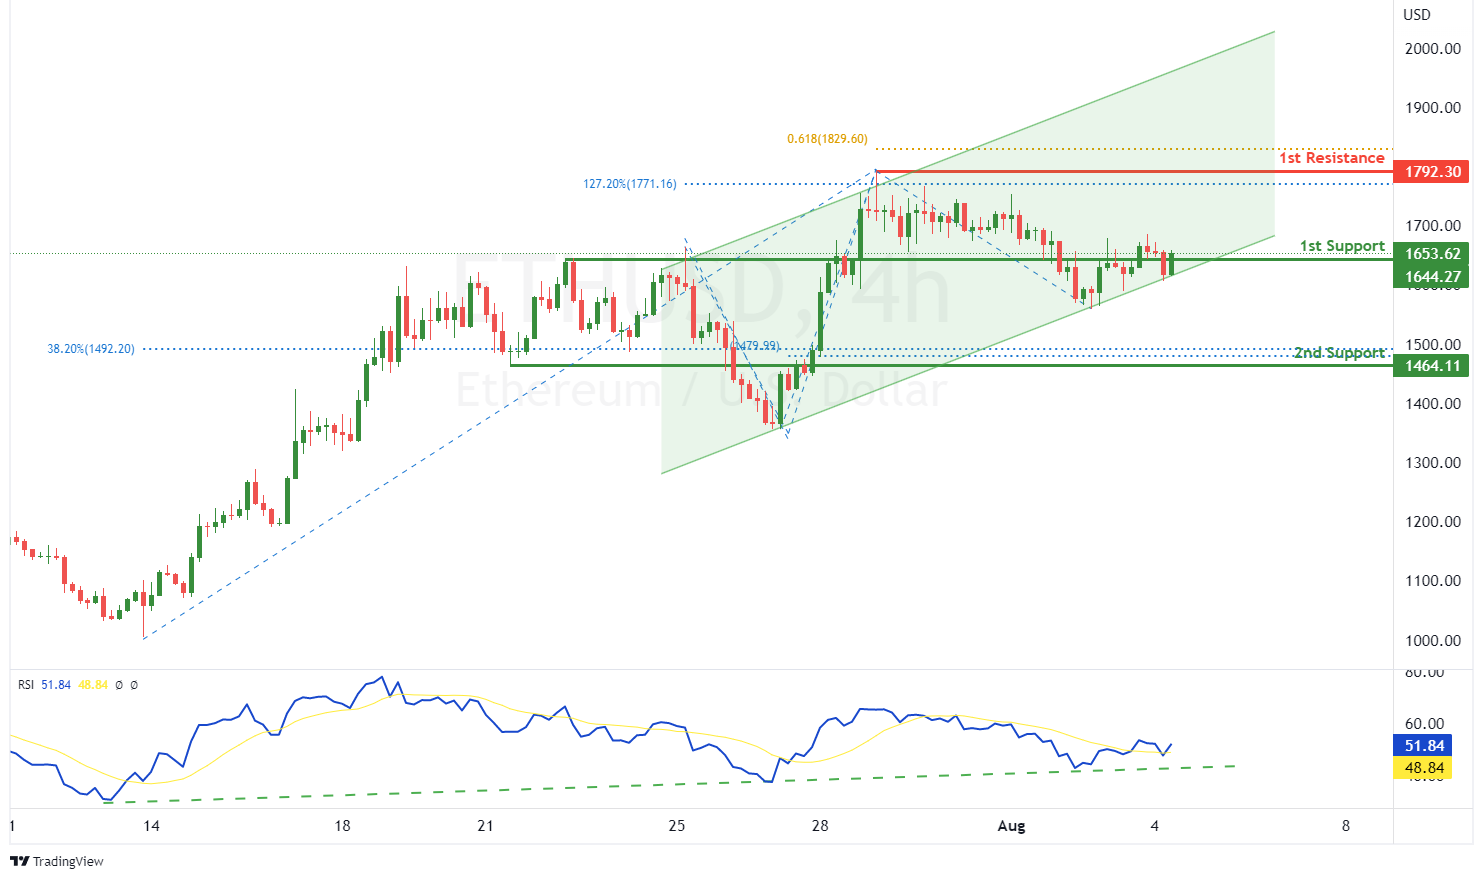
On the H4, with RSI moving along an ascending trendline, we have a bullish bias that price will rise from 1st support at 1644.27 where the overlap support is to the 1st resistance at 1792.30 where the swing high resistance, 127.2% fibonacci extension and 61.8% fibonacci projection are. Alternatively, price could break 1st support structure and drop to 2nd support at 1464.11 where the pullback support, 100% fibonacci projection and 38.2% fibonacci retracement.
Areas of consideration:
- H4 time frame, 1st resistance of 1792.30
- H4 time frame, 1st support at 1644.27
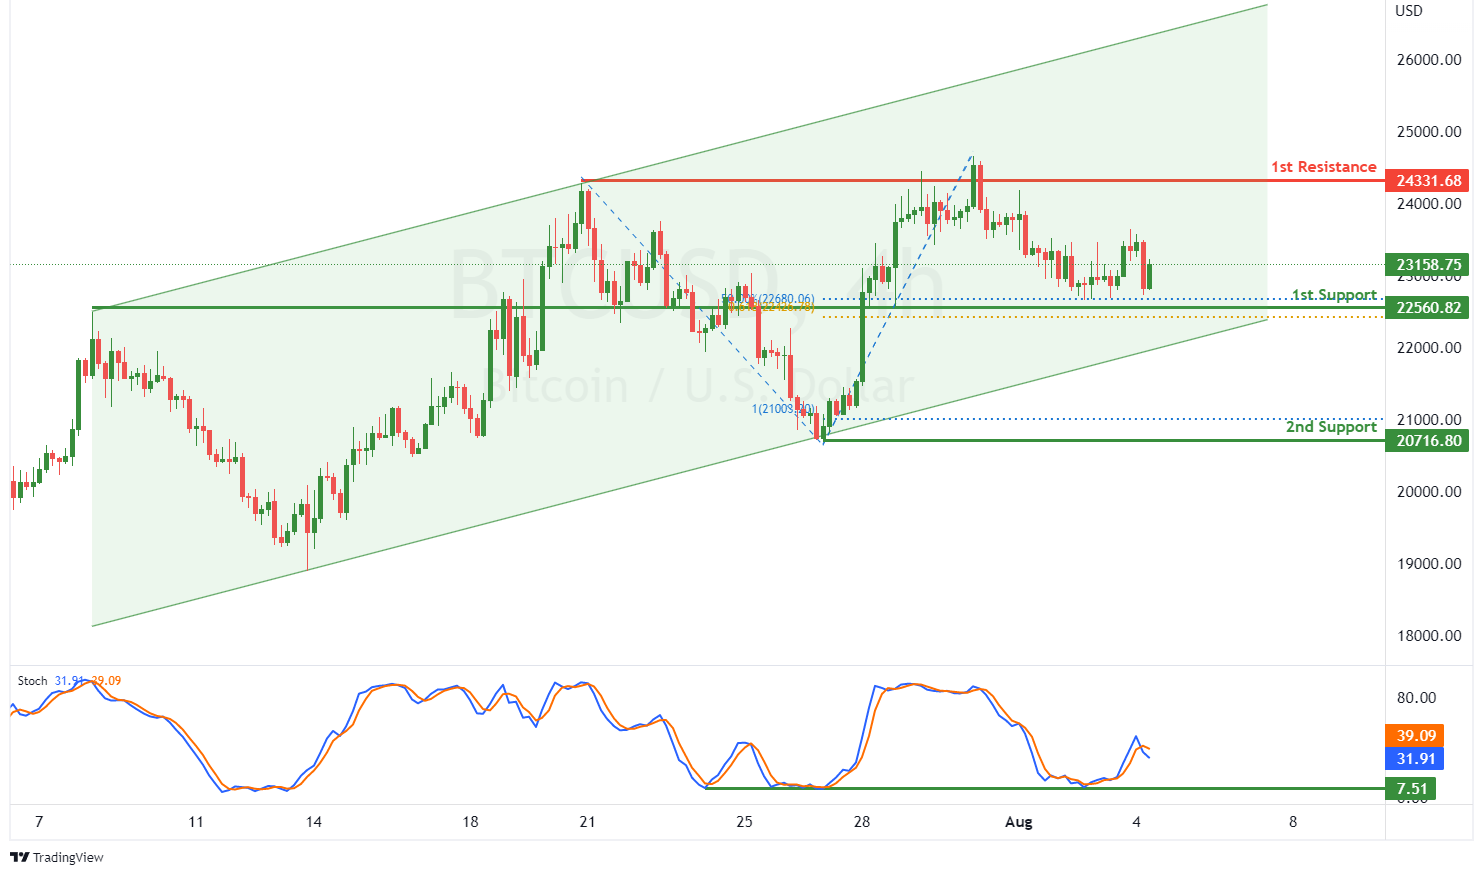
BTCUSD:
On the H4, with price moving within a bullish channel and expected to bounce from the stochastic support, we have a bullish bias that price will rise from our 1st support at 22560.82 where the pullback support, 50% fibonacci retracement and 61.8% fibonacci projection are to the 1st resistance at 24331.68 where the pullback resistance is. Alternatively, price could break 1st support structure and drop to 2nd support at 20716.80 where the swing low support and 100% fibonacci projection are.
Areas of consideration:
- H4 time frame, 1st resistance of 24331.68
- H4 time frame, 1st support at 22560.82
S&P 500:
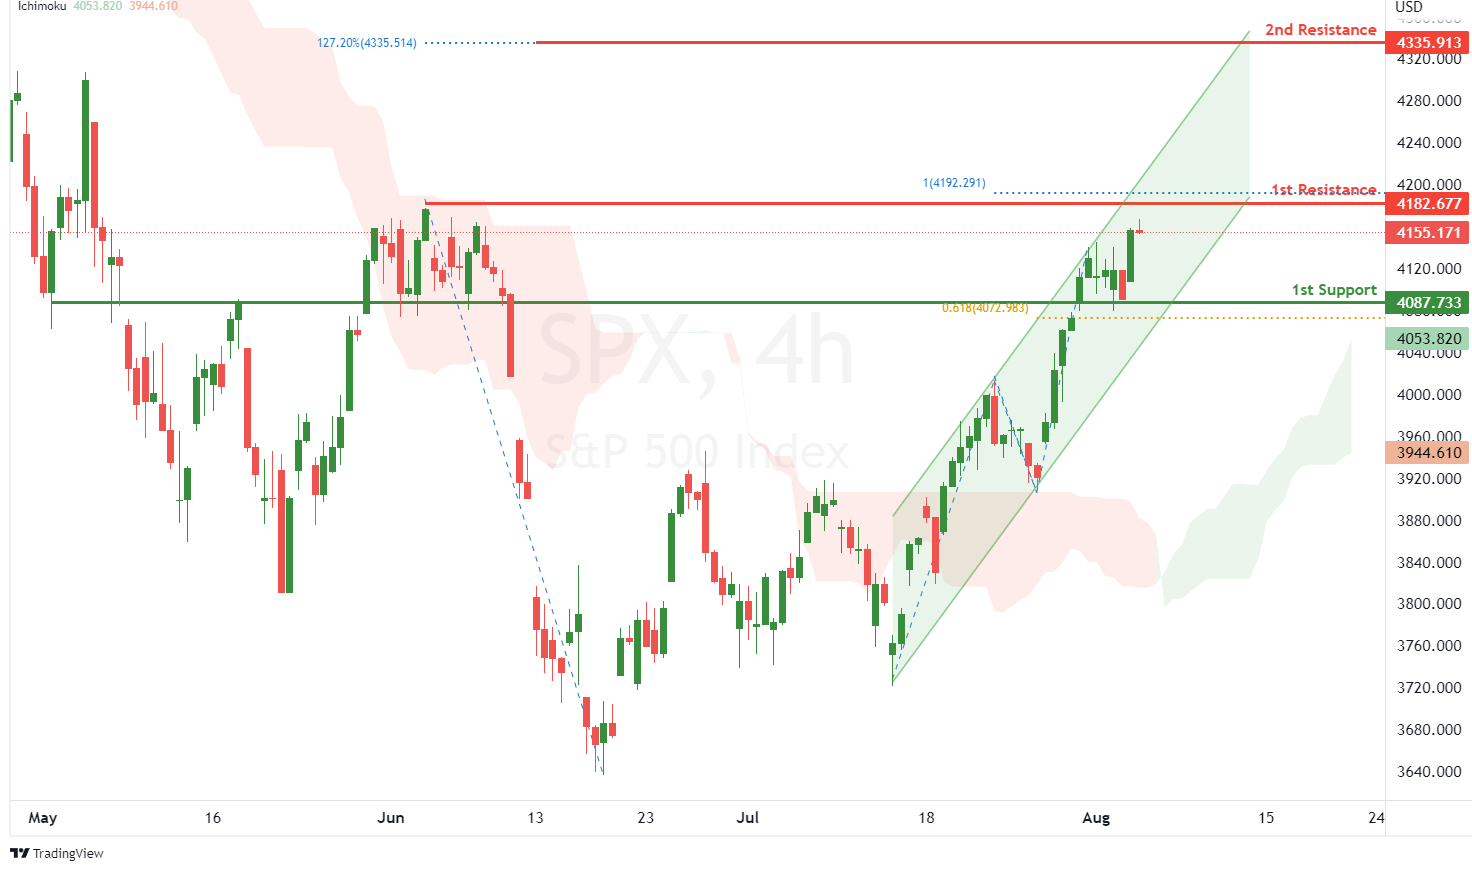
On the H4, with price moving above the ichimoku indicator and within an ascending channel, we have a bullish bias that price will rise to our 1st resistance at 4182.677 where the swing high resistance and 100% fibonacci projection are. Once there is upside confirmation that price has broken the 1st resistance structure, we would expect bullish momentum to carry price to 2nd resistance at 4335.913 where the 127.2% fibonacci extension is. Alternatively, price could drop to 1st support at 4087.733 where the pullback support and 61.8% fibonacci projection are.
Areas of consideration:
- H4 time frame, 1st resistance of 4182.677
- H4 time frame, 1st support at 4087.733
GBP/USD Daily Outlook
Daily Pivots: (S1) 1.2096; (P) 1.2152; (R1) 1.2203; More...
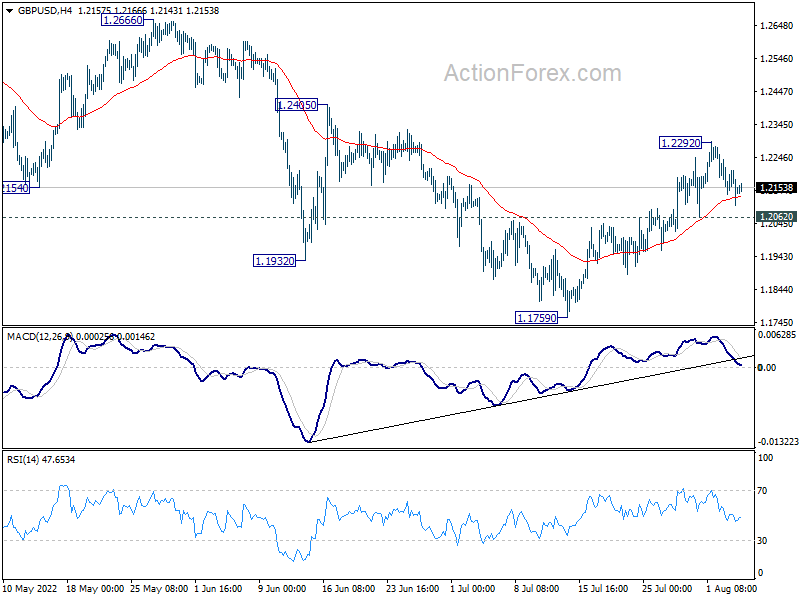
GBP/USD is staying in range below 1.2292 and intraday bias remains neutral first. Further rise could be seen as long as 1.2062 minor support holds. Above 1.2292 will target 1.2405 resistance first. Firm break there will target 1.2666 key resistance next. On the downside, however, break of 1.2062 minor support will argue that the rebound from 1.1759 is over, and turn bias back to the downside for retesting 1.1759 low instead.
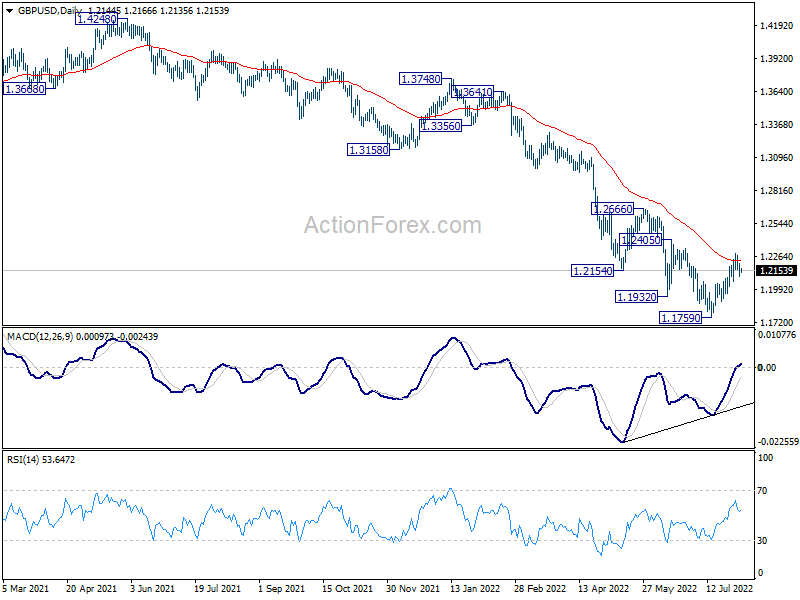
In the bigger picture, fall from 1.4248 (2018 high) could be a leg inside the pattern from 1.1409 (2020 low), or resuming the longer term down trend. Deeper decline is expected as long as 1.2666 resistance holds. Next target is 1.1409 low. However, firm break of 1.2666 will bring stronger rise back to 55 week EMA (now at 1.2957).
Markets Steady Awaiting BoE Rate Hike, Dollar Making Progress
Aussie and Kiwi firm up mildly in Asian session, following the rebound in risk markets. But overall, the currency markets are rather quiet, with major pairs and crosses stuck inside last week's range. Traders are probably holding their bets for now, and await today's BoE rate decision. Another big event of US non-farm payroll employment will come tomorrow.
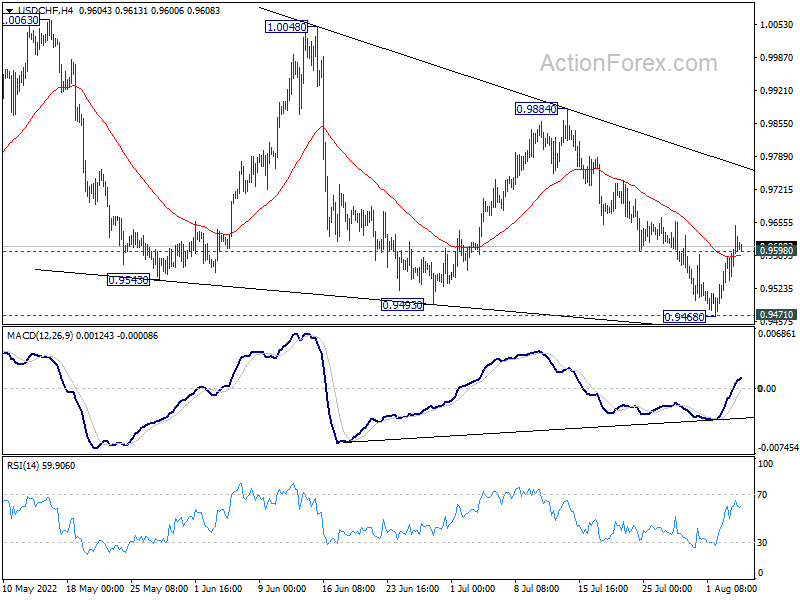
Technically, USD/CHF is making some progress and breaking 0.9598 minor resistance, which should confirm short term bottoming at 0.9468. Focuses will now be particularly on 1.0095 minor support in EUR/USD, 1.2062 minor support in GBP/USD, and 134.58 minor resistance in USD/JPY. Break of these levels would indicate a come back in Dollar.
In Asia, at the time of writing, Nikkei is up 0.60%. Hong Kong HSI is up 1.45%. China Shanghai SSE is up 0.15%. Singapore Strait Times is up 0.15%. Japan 10-year JGB yield is down -0.0097 at 0.180. Overnight, DOW rose 1.29%. S&P 500 rose 1.56%. NASDAQ rose 2.59%. 10-year yield rose 0.007 to 2.748.
Fed Kashkari: Likely scenario is continuing rate hikes and then sit there
Minneapolis Fed President Neel Kashkari said yesterday that Fed moved too slowly in 2021 in tackling high inflation. He's concerned that inflation is pulling wages up and there are risks of going into a wage-driven inflation story. As inflation is spreading, he said that Fed need to act with urgency.
There are some financial markets that are indicating that Fed will cut interest rates in 2024. But Kashkari said, "I don't want to say it's impossible, but it seems like that's a very unlikely scenario right now given what I know about the underlying inflation dynamics."
"The more likely scenario is we would continue raising (interest rates) and then we would sit there until we have a lot of confidence that inflation is well on its way back down to 2%," he said.
Fed Daly: 3.4% by year end is a reasonable place to get to
San Francisco Fed President Mary Daly said, "about 50% of the elevated inflation we're seeing is from demand factors, 50% from supply factors."
"50 bps hike would be a reasonable thing to do in September but if we see inflation roaring ahead undauntedly then perhaps 75 bps hike would be more appropriate," she added.
Also, she does not believe that Fed has reached the threshold for interest rate to be considered restrictive As for tightening, having rate at 3.4% by the end end is a "reasonable place" to get to.
Fed Barkin: There's a path to control inflation, but recession could happen in the process
Richmond Fed President Thomas Barkin said in a speech, "we are committed to returning inflation to our 2 percent target and have made clear we will do what it takes." He expected Fed's tools to "work over time" and "inflation to come down but not immediately, not suddenly and not predictably".
"There is a path to getting inflation under control," he said. "But a recession could happen in the process."
"We are out of balance today because stimulus-supported excess demand overwhelmed supply constrained by the pandemic and global commodity shocks. Returning to normal means products on shelves, restaurants fully staffed and cars at auto dealers. "
"Most importantly, moderating demand has a higher purpose squarely in our mandate: containing inflation. If there is any lesson that's been relearned in the last year, it is that inflation is painful, and everyone hates it."
BoE to hike 50bps, GBP/CHF ready for breakout?
BoE is expected raise interest rate by 50bps to 1.75% today. That would be the largest rate hike since 1995, while interest rate will then be at the highest level since 2008. The voting will again be a focus and the new economic projections will be scrutinized too. Back in June BoE said inflation is expected to rise to slightly above 11% in October while GDP was weaker than anticipated at the May report. The change in outlook would be reflected in the new economic projections.
Here are some previews on BoE:
- BoE Interest Rate Decision: Forecasters Can't Make Up Their Minds
- Bank of England Preview
- Bank of England Ponders a More 'Forceful' Rate Hike
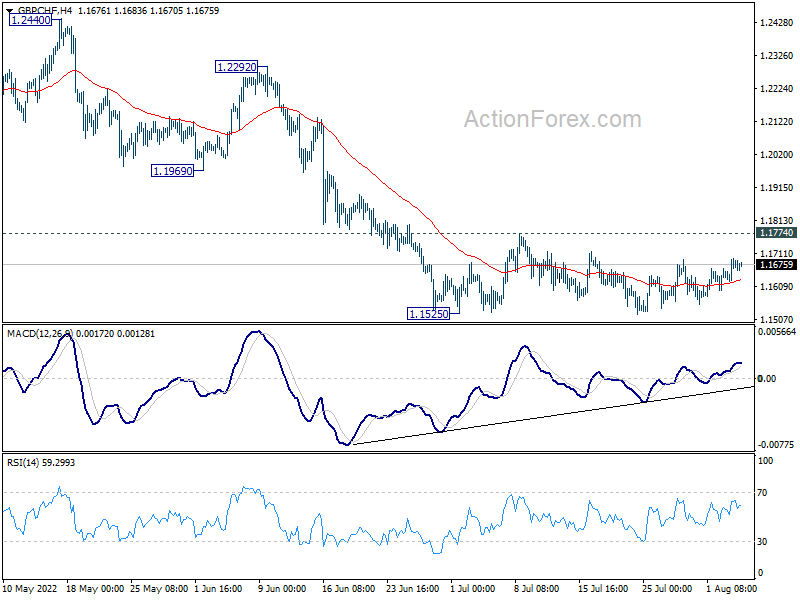
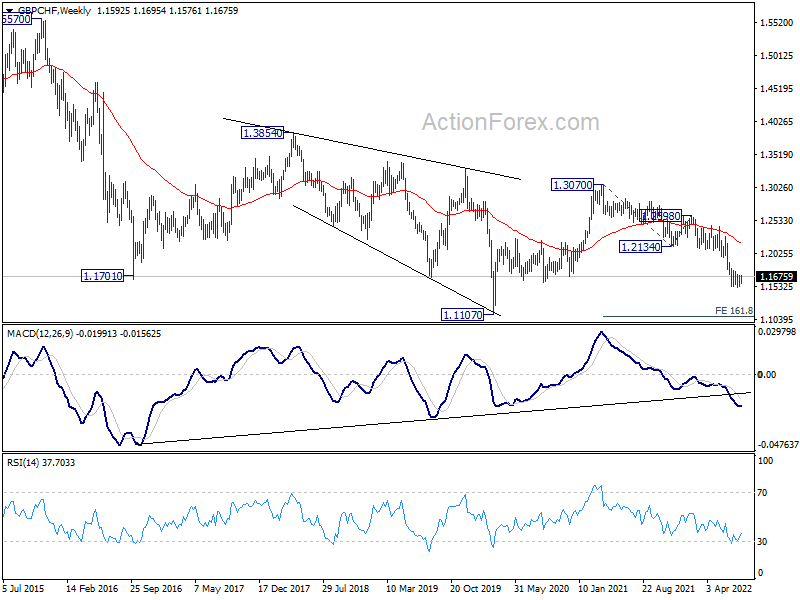
GBP/CHF turned into range trading after hitting 1.1525 in late June. There is risk of sell-on-fact in Sterling after BoE which prompt a downside breakout. But anyway, outlook will stay bearish as long as 1.1774 resistance holds, even in case of a rebound. Current down trend is still expected to resume towards 1.1107 low, which is close to 161.8% projection of 1.3070 to 1.2134 from 1.2598 at 1.1084 next, in the medium term.
Elsewhere
Australia goods and services trade surplus widened to AUD 17.67B in June, versus expectation of AUD 14.0B. Germany factory orders, UK construction PMI will be released in European session. ECB will publish monthly economic bulletin. Later in the day, US will release jobless claims and trade balance. Canada will release building permits and trade balance too.
GBP/USD Daily Outlook
Daily Pivots: (S1) 1.2096; (P) 1.2152; (R1) 1.2203; More...
GBP/USD is staying in range below 1.2292 and intraday bias remains neutral first. Further rise could be seen as long as 1.2062 minor support holds. Above 1.2292 will target 1.2405 resistance first. Firm break there will target 1.2666 key resistance next. On the downside, however, break of 1.2062 minor support will argue that the rebound from 1.1759 is over, and turn bias back to the downside for retesting 1.1759 low instead.
In the bigger picture, fall from 1.4248 (2018 high) could be a leg inside the pattern from 1.1409 (2020 low), or resuming the longer term down trend. Deeper decline is expected as long as 1.2666 resistance holds. Next target is 1.1409 low. However, firm break of 1.2666 will bring stronger rise back to 55 week EMA (now at 1.2957).
Economic Indicators Update
| GMT | Ccy | Events | Actual | Forecast | Previous | Revised |
|---|---|---|---|---|---|---|
| 01:30 | AUD | Trade Balance (AUD) Jun | 17.67B | 14.00B | 15.97B | 15.02B |
| 06:00 | EUR | Germany Factory Orders M/M Jun | -0.70% | 0.10% | ||
| 08:00 | EUR | ECB Economic Bulletin | ||||
| 08:30 | GBP | Construction PMI Jul | 52.1 | 52.6 | ||
| 11:00 | GBP | BoE Interest Rate Decision | 1.75% | 1.25% | ||
| 11:00 | GBP | MPC Official Bank Rate Votes | 9--0--0 | 9--0--0 | ||
| 11:30 | USD | Challenger Job Cuts Y/Y Jul | 58.80% | |||
| 12:30 | CAD | Building Permits M/M Jun | -2.00% | 2.30% | ||
| 12:30 | CAD | International Merchandise Trade (CAD) Jun | 5.0B | 5.3B | ||
| 12:30 | USD | Initial Jobless Claims (Jul 29) | 250K | 256K | ||
| 12:30 | USD | Goods and Services Trade Balance (USD) Jun | -81.5B | -85.5B | ||
| 14:30 | USD | Natural Gas Storage | 25B | 15B |
BoE to hike 50bps, GBP/CHF ready for breakout?
BoE is expected raise interest rate by 50bps to 1.75% today. That would be the largest rate hike since 1995, while interest rate will then be at the highest level since 2008. The voting will again be a focus and the new economic projections will be scrutinized too. Back in June BoE said inflation is expected to rise to slightly above 11% in October while GDP was weaker than anticipated at the May report. The change in outlook would be reflected in the new economic projections.
Here are some previews on BoE:
- BoE Interest Rate Decision: Forecasters Can't Make Up Their Minds
- Bank of England Preview
- Bank of England Ponders a More 'Forceful' Rate Hike
GBP/CHF turned into range trading after hitting 1.1525 in late June. There is risk of sell-on-fact in Sterling after BoE which prompt a downside breakout. But anyway, outlook will stay bearish as long as 1.1774 resistance holds, even in case of a rebound. Current down trend is still expected to resume towards 1.1107 low, which is close to 161.8% projection of 1.3070 to 1.2134 from 1.2598 at 1.1084 next, in the medium term.
Fed Kashkari: Likely scenario is continuing rate hikes and then sit there
Minneapolis Fed President Neel Kashkari said yesterday that Fed moved too slowly in 2021 in tackling high inflation. He's concerned that inflation is pulling wages up and there are risks of going into a wage-driven inflation story. As inflation is spreading, he said that Fed need to act with urgency.
There are some financial markets that are indicating that Fed will cut interest rates in 2024. But Kashkari said, "I don't want to say it's impossible, but it seems like that's a very unlikely scenario right now given what I know about the underlying inflation dynamics."
"The more likely scenario is we would continue raising (interest rates) and then we would sit there until we have a lot of confidence that inflation is well on its way back down to 2%," he said.
Crude Oil Price Turns Red, Risk of More Losses
Key Highlights
- Crude oil price started a fresh decline from the $103.50 resistance.
- A key bearish trend line is forming with resistance near $100.20 on the 4-hours chart.
- EUR/USD struggled to clear 1.0280 and started a downside correction.
- GBP/USD started a downside correction from the 1.2300 zone.
Crude Oil Price Technical Analysis
After a steady increase above the $100 level, crude oil price faced sellers against the US Dollar. The price struggled to clear the $103.50 resistance zone and started a fresh decline.
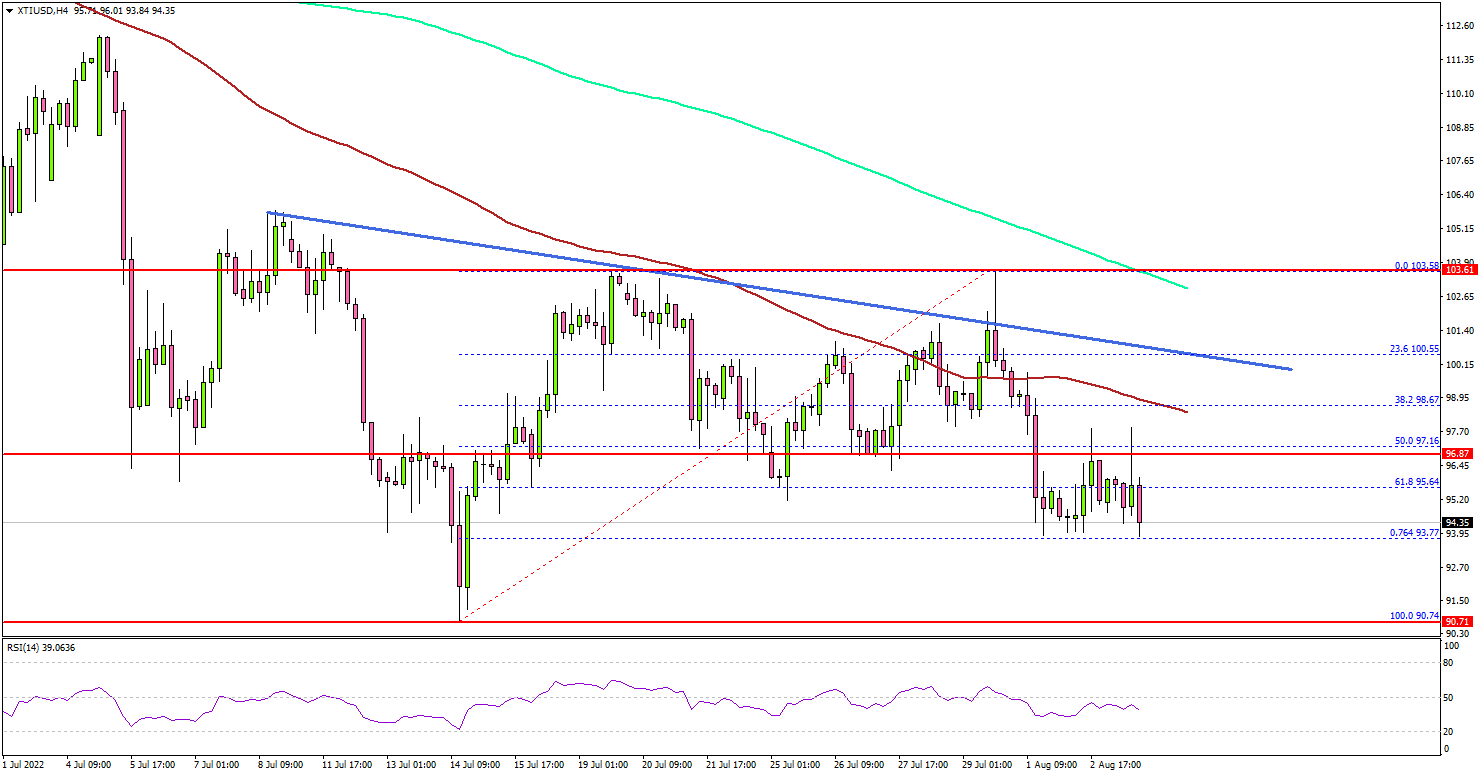
Looking at the 4-hours chart of XTI/USD, there was a bearish reaction below the $102.00 and $101.00 levels. The price even settled below the $100 level, the 100 simple moving average (red, 4-hours) and the 200 simple moving average (green, 4-hours).
It traded below the 61.8% Fib retracement level of the upward move from the $90.74 swing low to $102.58 high. If the bears remain in action, there is a risk of a move towards the $91.50 support zone.
The next major support is near $90.50. The main support sits near $90, below which there is a risk of a move towards the $88.00 level. Any more losses might call for a test of the $85 zone.
On the upside, the price is facing resistance near the $98.50 level. Besides, there is a key bearish trend line forming with resistance near $100.20 on the same chart. A clear move above the trend line resistance could set the pace for a larger increase towards $103. The next major resistance is near $103.50, above which the price could accelerate higher towards the $106 zone.
Looking at the EUR/USD pair, the pair failed to extend its recovery above 1.0280 and corrected lower. Similarly, GBP/USD dipped below the 1.2200 support.
Economic Releases to Watch Today
- BoE Interest Rate Decision - Forecast 1.75%, versus 1.25% previous.
- US Initial Jobless Claims - Forecast 259K, versus 256K previous.