

Sample Category Title
Elliott Wave View: Dollar Index (DXY) Resumes Higher
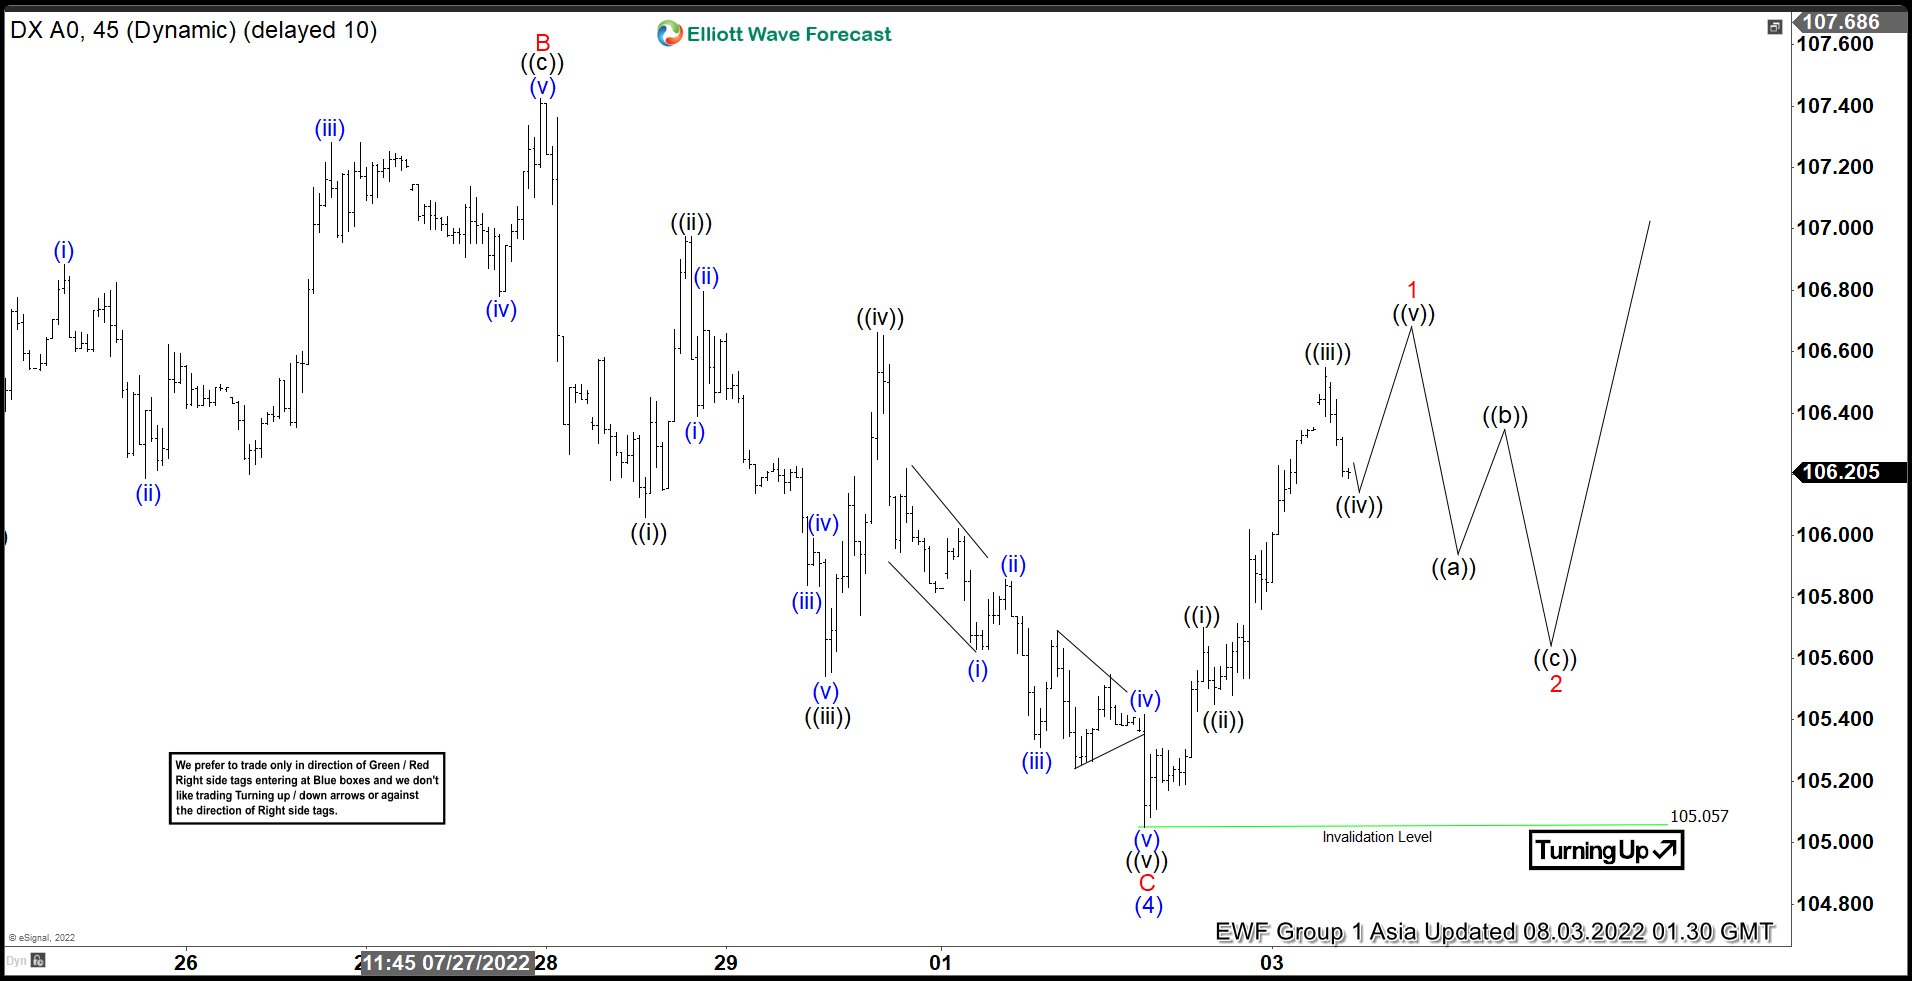
Short Term Elliott Wave view in Dollar Index (DXY) suggests rally to 109.29 on 7.14.2022 peak ended wave (3). Pullback in wave (4) ended at 105.05 with internal subdivision as a zigzag Elliott Wave structure. Down from wave (3), wave A ended at 106.38. Wave B rally ended at 107.42. The Index then resumes lower in wave C which ended at 105.05. The 45 minutes chart below shows the internal subdivision of wave C in 5 waves. Down from wave B, wave ((i)) ended at 106.06, and rally in wave ((ii)) ended at 106.975.
Index resumes lower in wave ((iii)) towards 105.54, and rally in wave ((iv)) ended at 106.66. Final leg lower wave ((v)) ended at 105.05 which completed wave C of (4). The Index has turned higher in wave (5), but it still needs to break above the previous wave (3) peak at 109.29 to rule out a double correction. Up from wave (4), wave ((i)) ended at 105.7 and dips in wave ((ii)) ended at 105.45. Index then resumes higher in wave ((iii)) towards 106.55. Expect the Index to extend higher 1 more time to complete wave ((v)) of 1, then it should pullback in wave 2 to correct cycle from 8/2/2022 low before the next leg higher. As far as pivot at 105.05 low stays intact, expect dips to find support in 3, 7, or 11 swing for further upside.
$DXY 45 Minutes Elliott Wave Chart
UK 100 Consolidates
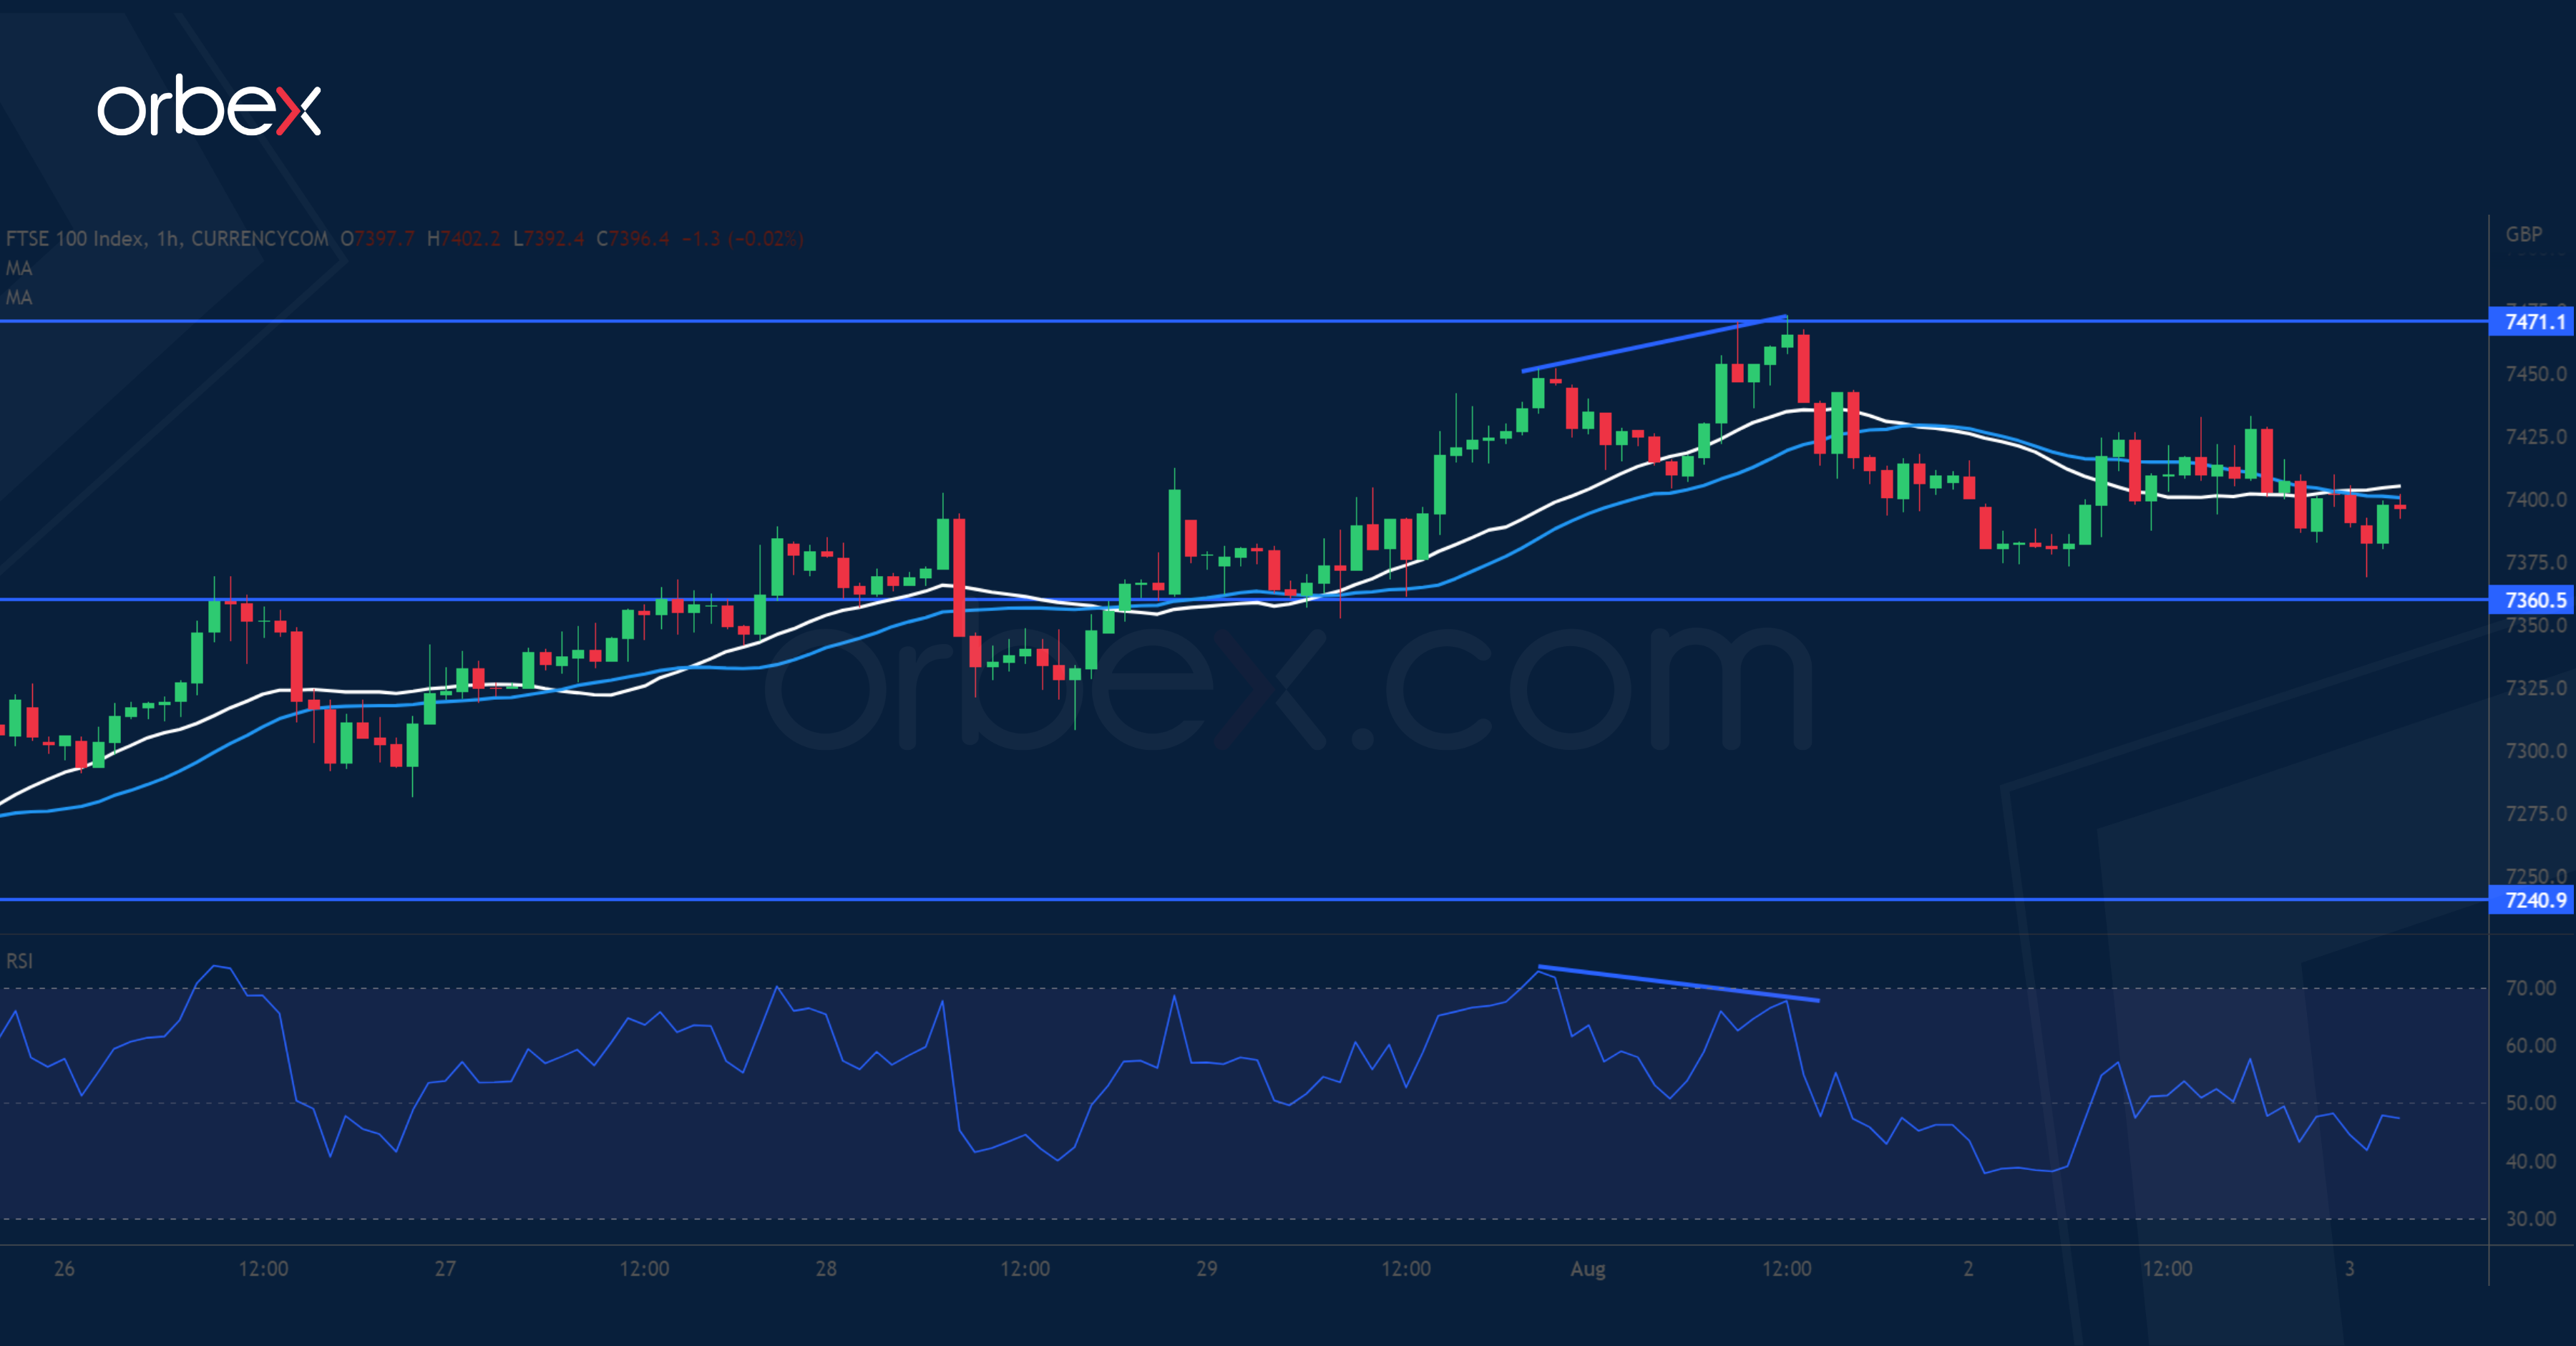
Equity markets tread water amid US-China tensions over Taiwan. The FTSE is testing the supply zone (7470) at the start of a previous liquidation in early June. A bearish RSI divergence is a sign of over-extension and the rally could use some breathing room. 7360 is the first support and its break would force more buyers to bail out, triggering a sell-off to 7240, which is a critical level to keep the current rebound intact. On the upside, a close above 7470 would resume the recovery towards the triple top on the daily chart (7640).
NZD/USD Hits Resistance
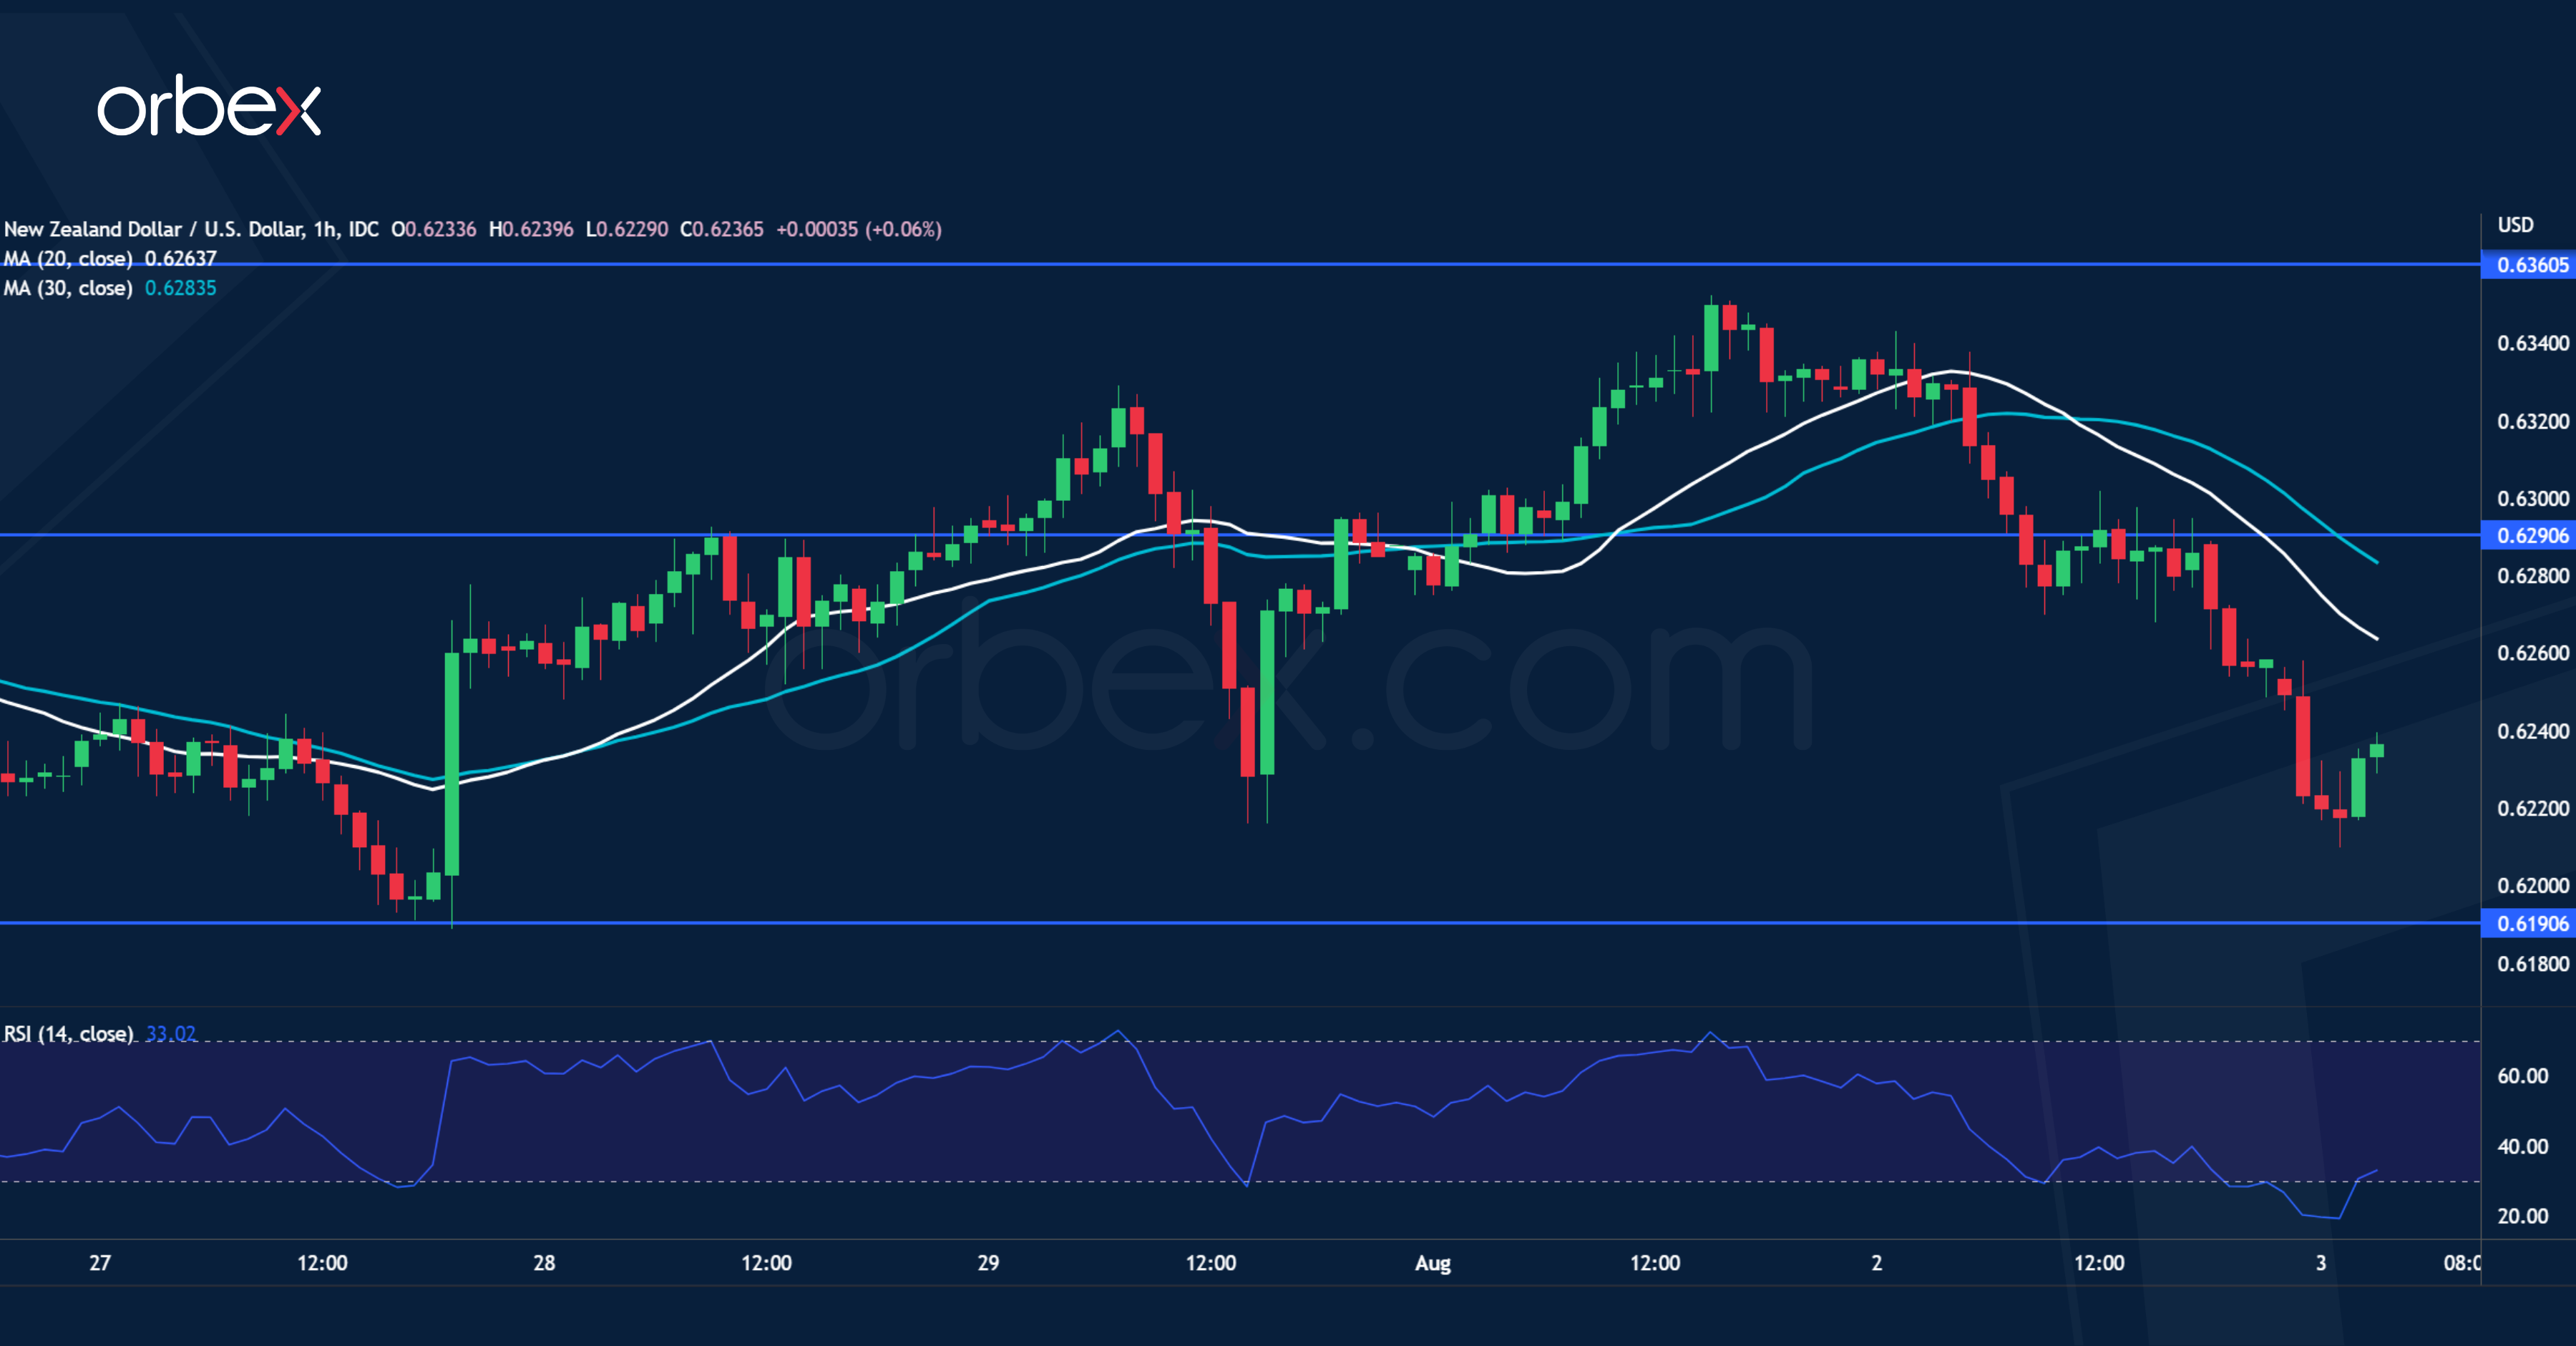
The New Zealand dollar weakened as the Q2 unemployment rate missed the mark. The pair has met stiff selling pressure at the daily resistance (0.6360) which was the start of the mid-June sell-off. As the RSI shows a double top in the overbought area, the bears may have doubled down in hope of a bearish continuation in the medium-term. 0.6190 is a key level to see whether there are follow-up bids. Failing that, the kiwi could tank towards 0.6140. The former support at 0.6290 has turned into a fresh resistance.
AUD/USD Over-Extends
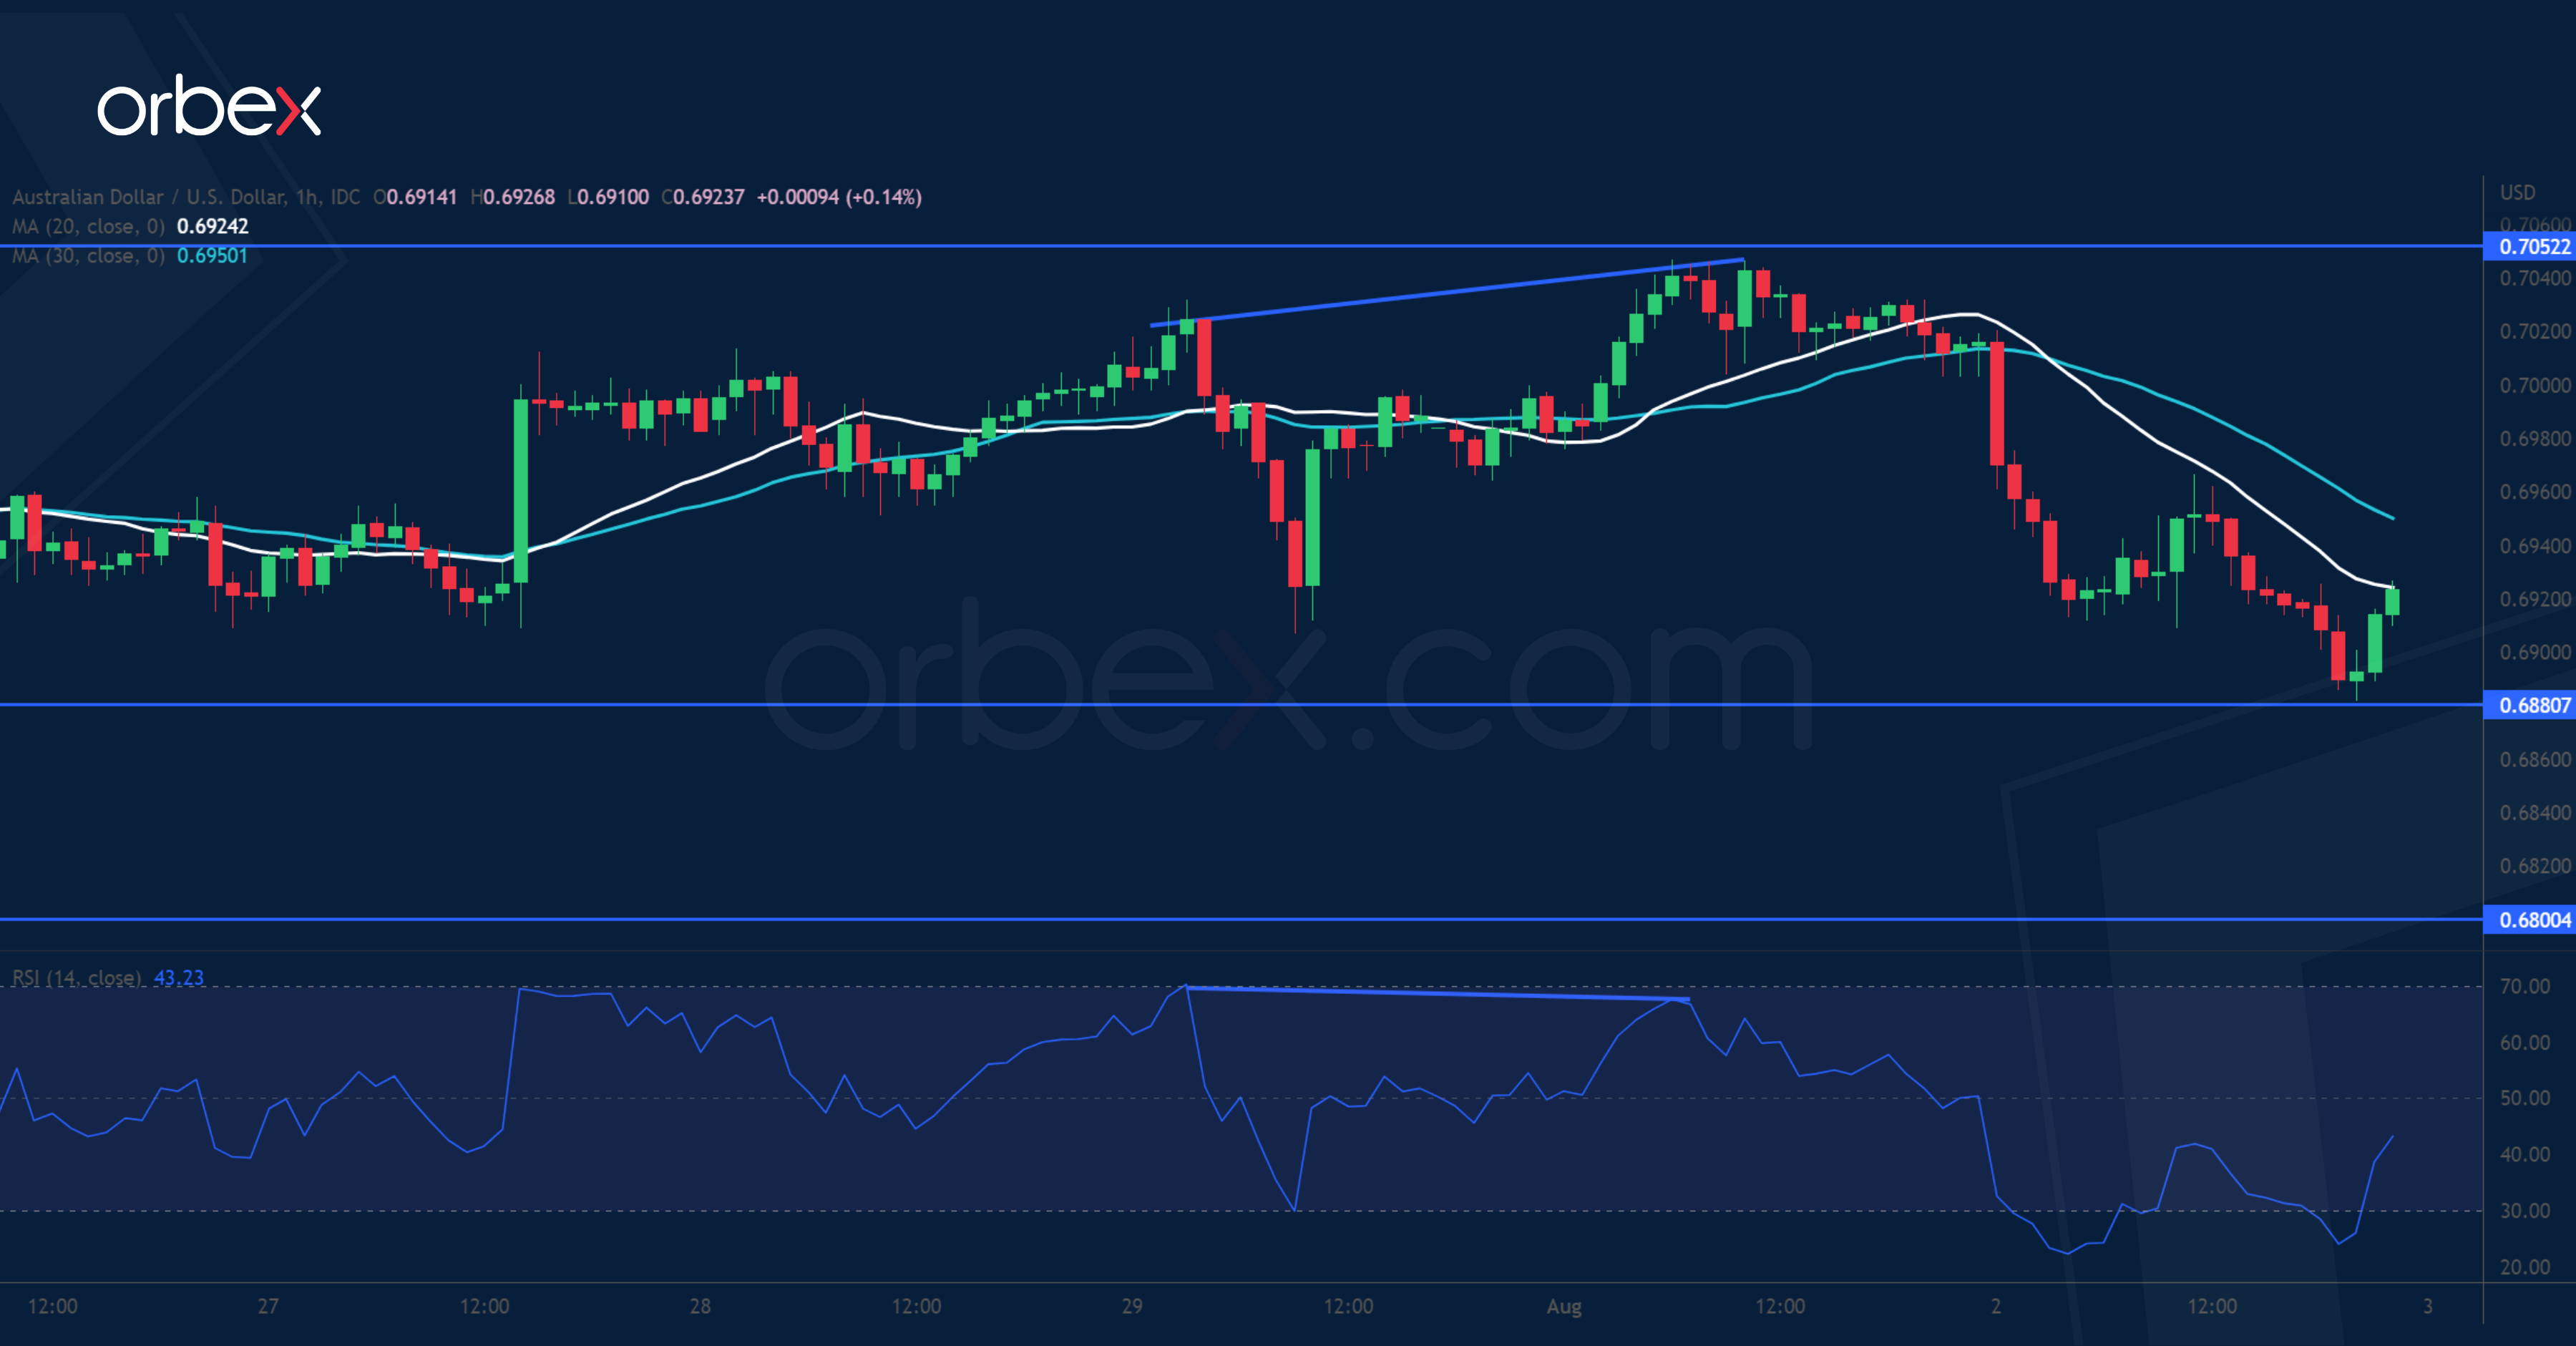
The Australian dollar tumbles as the RBA’s downbeat outlook may signal a slowdown in future rate hikes. The rally came to a halt in the vicinity of the daily resistance at 0.7050. A bearish RSI divergence showed a loss of momentum in the recovery, then a break below 0.6910 would act as a confirmation of a U-turn. As buyers’ profit-taking meets fresh selling, the Aussie could be vulnerable to a deeper correction. 0.6880 would be the next support and the origin of a previous breakout at 0.6800 is an important floor level.
USD/JPY Daily Outlook
Daily Pivots: (S1) 131.33; (P) 132.25; (R1) 134.10; More...
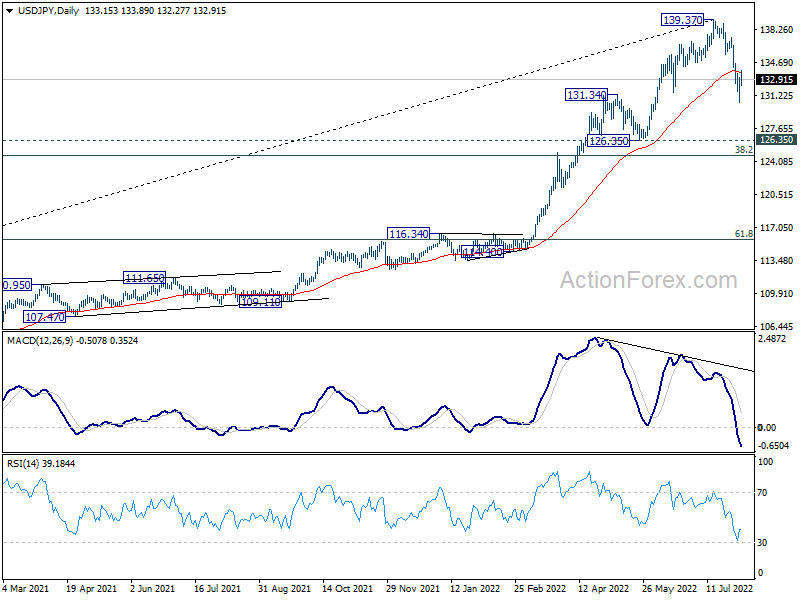
Intraday bias in USD/JPY is turned neutral first with current recovery. Some consolidations could be seen above 130.38 temporary low. On the downside, below 130.38 will resume the fall from 139.37, as a correction to medium term uptrend, towards 126.35 support. Strong support is expected above there, at least on first attempt, to bring rebound. On the upside, firm break of 134.58 will turn bias to the upside for stronger rally to retest 139.37 high.
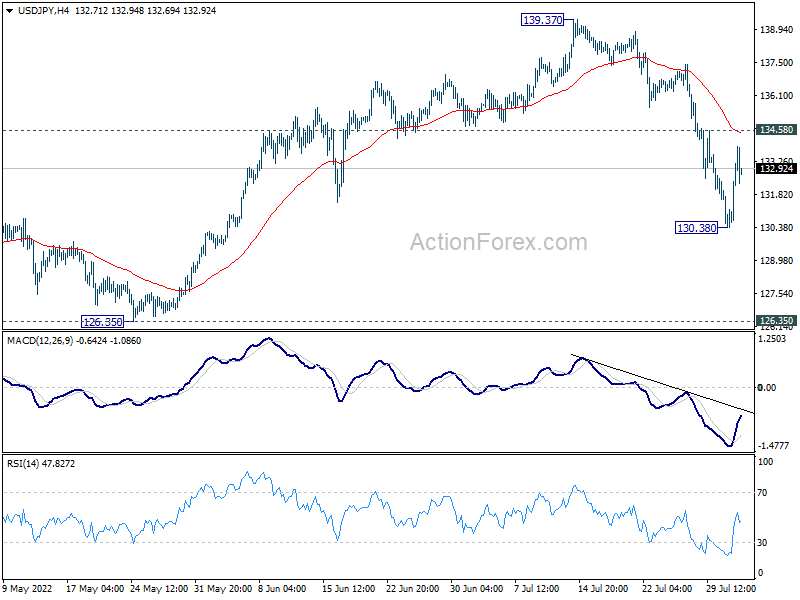
In the bigger picture, a medium term top should be in place at 139.37, on bearish divergence condition in daily MACD. Fall from there could be correcting whole up trend from 101.18 (2020 low). While deeper decline cannot be ruled out, outlook will stays bullish as long as 55 week EMA (now at 121.84) holds. Long term up trend is expected to resume through 139.37 at a later stage, after the correction finishes.
USD/CHF Daily Outlook
Daily Pivots: (S1) 0.9504; (P) 0.9540; (R1) 0.9609; More...
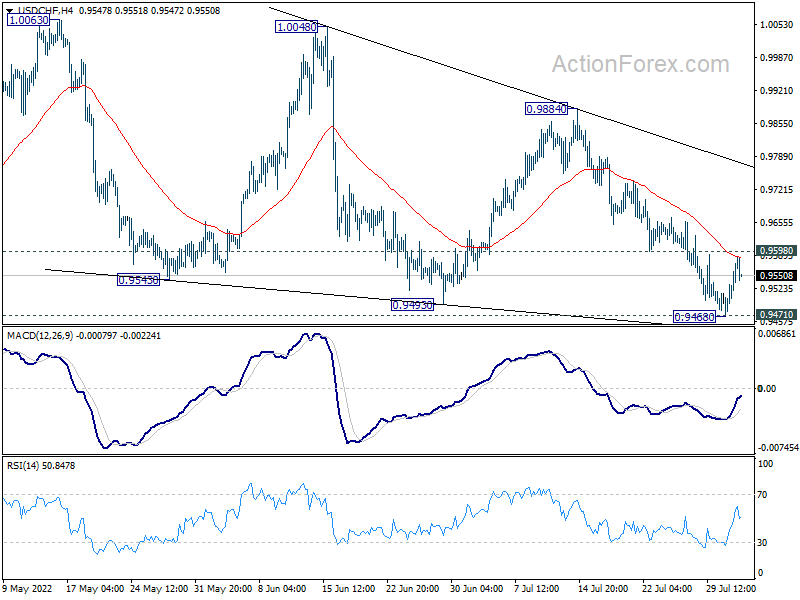
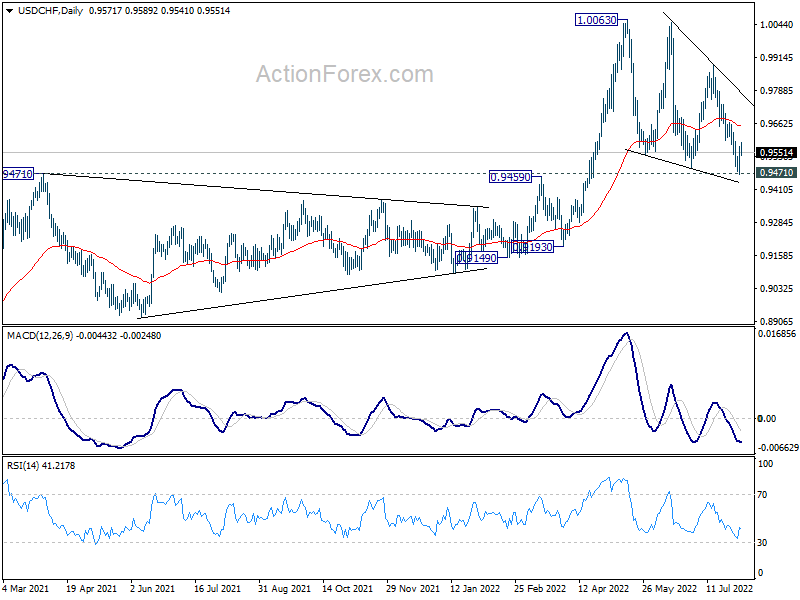
Intraday bias in USD/CHF remains neutral with focus on 0.9598 minor resistance. Firm break there should confirm short term bottoming at 0.9468, after defending 0.9471 keys support. Intraday bias will be back to the upside for 55 day EMA (now at 0.9650) and above. However, sustained break of 0.9471 will carry larger bearish implication and target 0.9193 support next.
In the bigger picture, medium term up trend from 0.8756 (2021 low) is still in progress. On resumption, next target is 1.0342 (2016 high). Sustained break there will resume long term up trend from 0.7065 (2011 low). This will remain the favored case as long as 0.9471 resistance turned support holds. However, firm break of 0.9471 will raise the chance that such up trend is over. Sustained trading below 55 week EMA (now at 0.9424) could bring deeper medium term fall back to 0.9149 support and below.
EUR/USD Daily Outlook
Daily Pivots: (S1) 1.0122; (P) 1.0208; (R1) 1.0252; More...
Intraday bias in EUR/USD is neutral for the moment, but further rise will remain in favor as long as 1.0095 support holds. Rebound from 0.9951 will target 1.0348 support turned resistance. Break there will target channel resistance at 1.0452. On the downside, break of 1.0095 minor support will turn bias back to the downside, and bring retest of 0.9951 low instead.
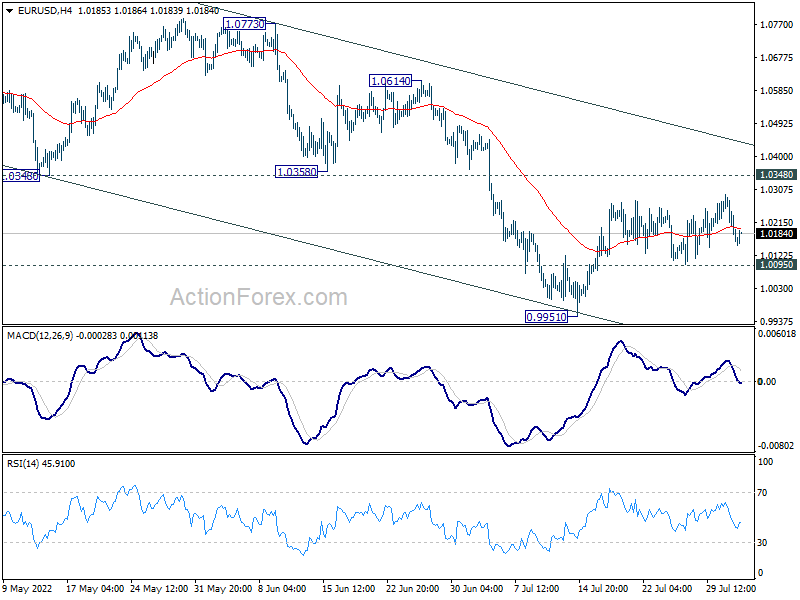
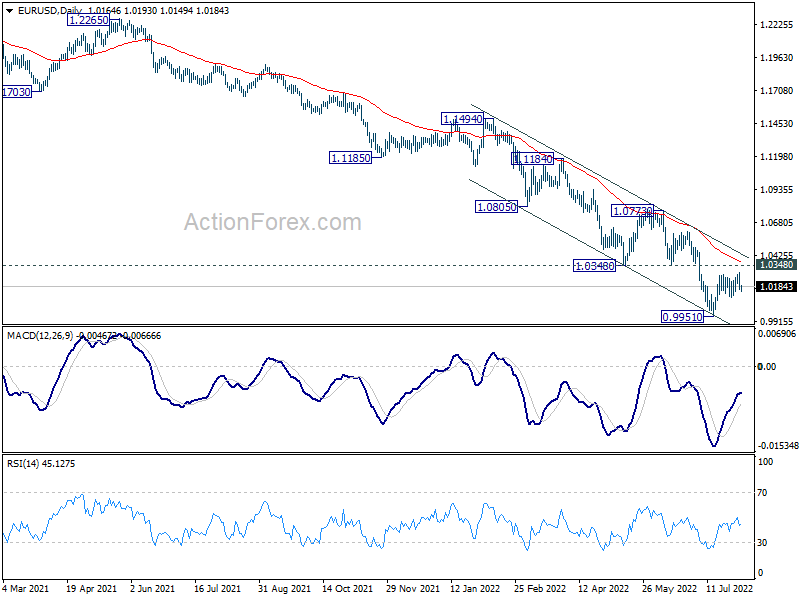
In the bigger picture, down trend from 1.6039 (2008 high) is still in progress. Next target is 100% projection of 1.3993 to 1.0339 from 1.2348 at 0.8694. In any case, outlook will stay bearish as long as 1.0773 resistance holds, in case of strong rebound.
Technical Outlook and Review
USD/JPY:
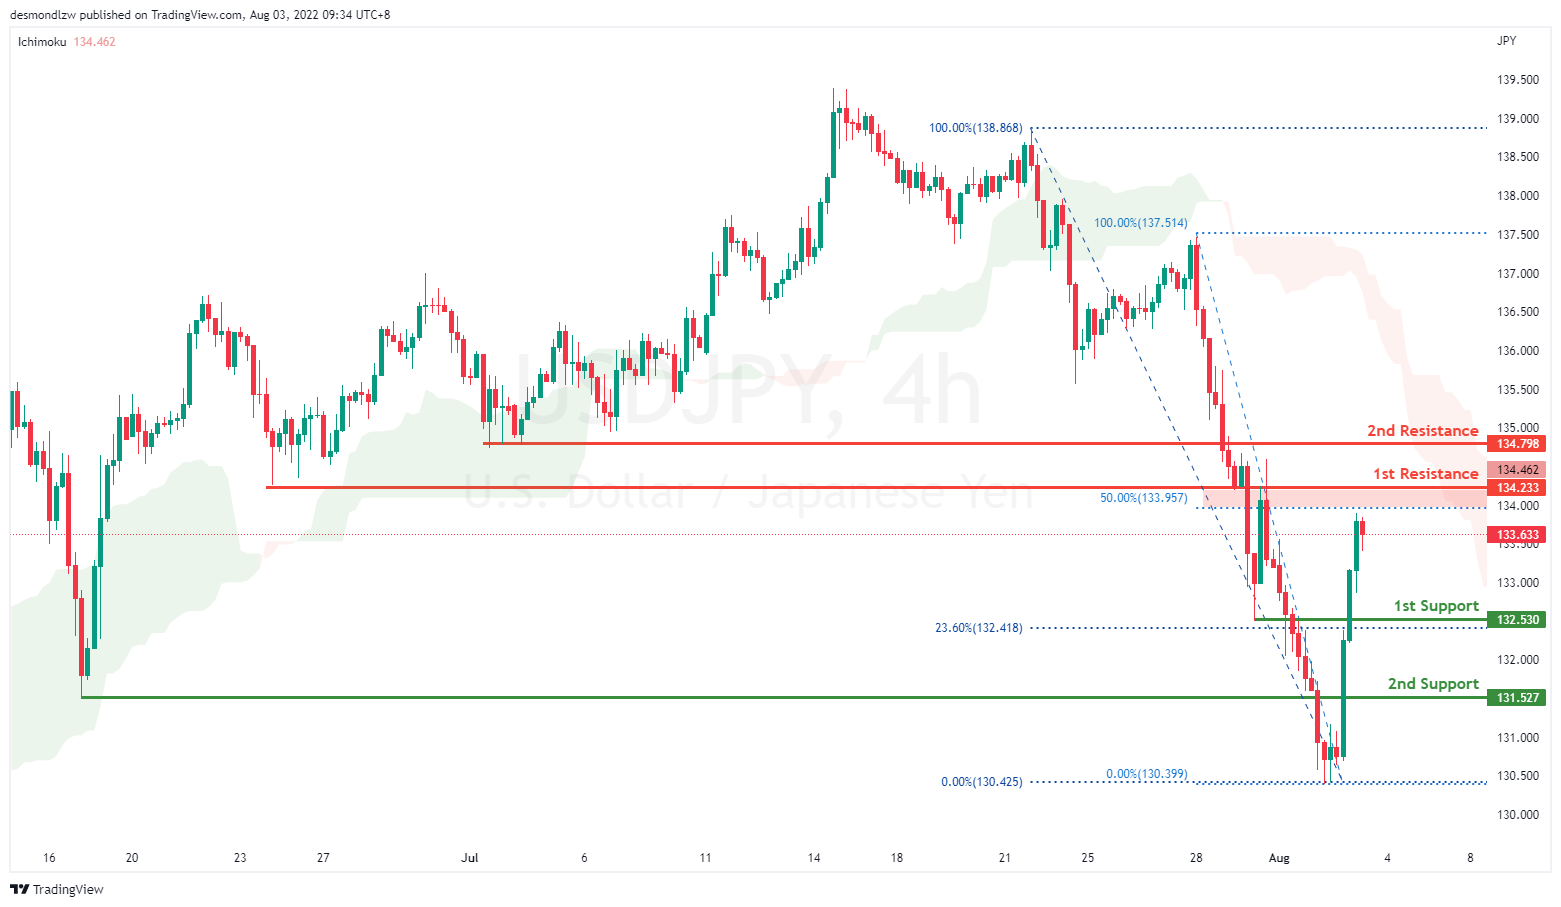
On the H4, price is bearish biased and moving strongly in an ascending trendline. It is still respecting the Ichimoku indicator, and has already broken the key support level at 131.527. The chart has confirmed a strong downside momentum and is now going to test at 134.233 which coincides with 50% Fibonacci retracement. If price were to pull back further, it will test the 2nd resistance at 134.798. Alternatively, price could bounce back to test at 132.543 which is the Fibonacci 23.6% and previous swing low
Areas of consideration:
- H4 time frame, 1st resistance at 134.233
- H4 time frame, 1st support at 131.543
DXY:
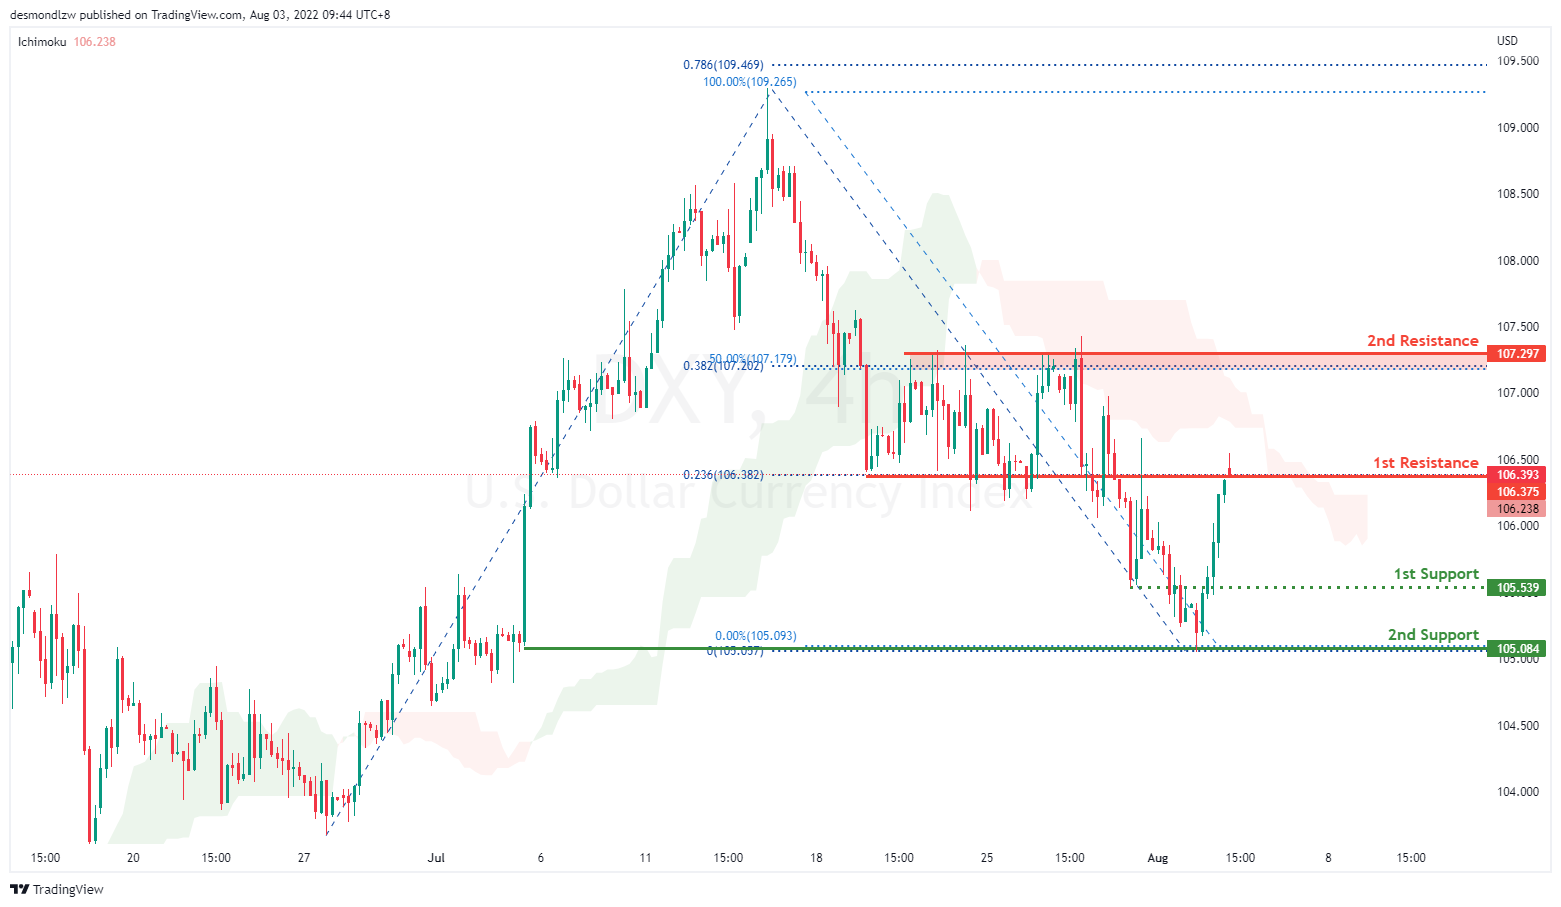
On the H4, prices have broken the ascending trend into an overall bearish biased trend. Prices have made a turn into a slightly bullish biased trend, though it is still respecting the Ichimoku cloud. It is now testing 23.6% Fibonacci Projection. If price were to break this resistance level, it will pull back further to test at 23.6% Fibonacci Projection and 50% retracement level at 107.271. Alternatively, price could bounce back and test at the first intermediate support at 105.539 then 105.084 which is the the previous swing low and key support level
Areas of consideration:
- H4 time frame, 1st resistance at 107.271
- H4 time frame, 1st support at 105.084
EUR/USD :
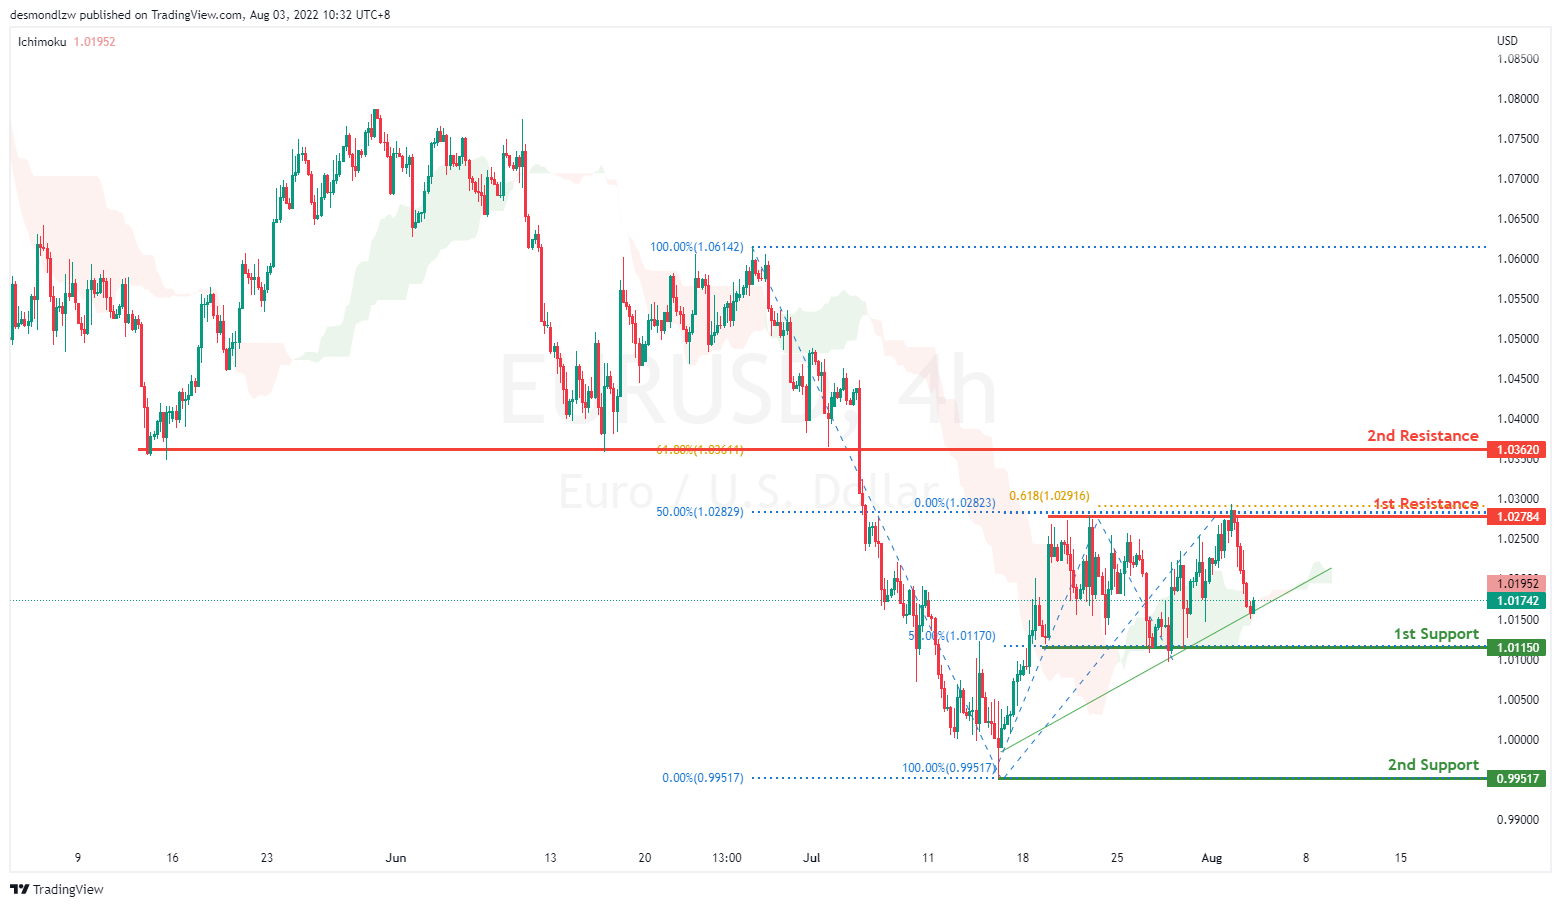
On the H4, prices have broken the bearish trend moving into a bullish biased trend. Price has rejected the 1.027 level, 50% retracement. It might pull back to test the previous swing low at 1.011, first support level. Alternatively, If price fails to break the first support it might bounce off the first support to test at 1.027, 50% resistance level
Areas of consideration :
- H4 1st resistance at 1.027
- H4 1st support at 1.011
GBP/USD:
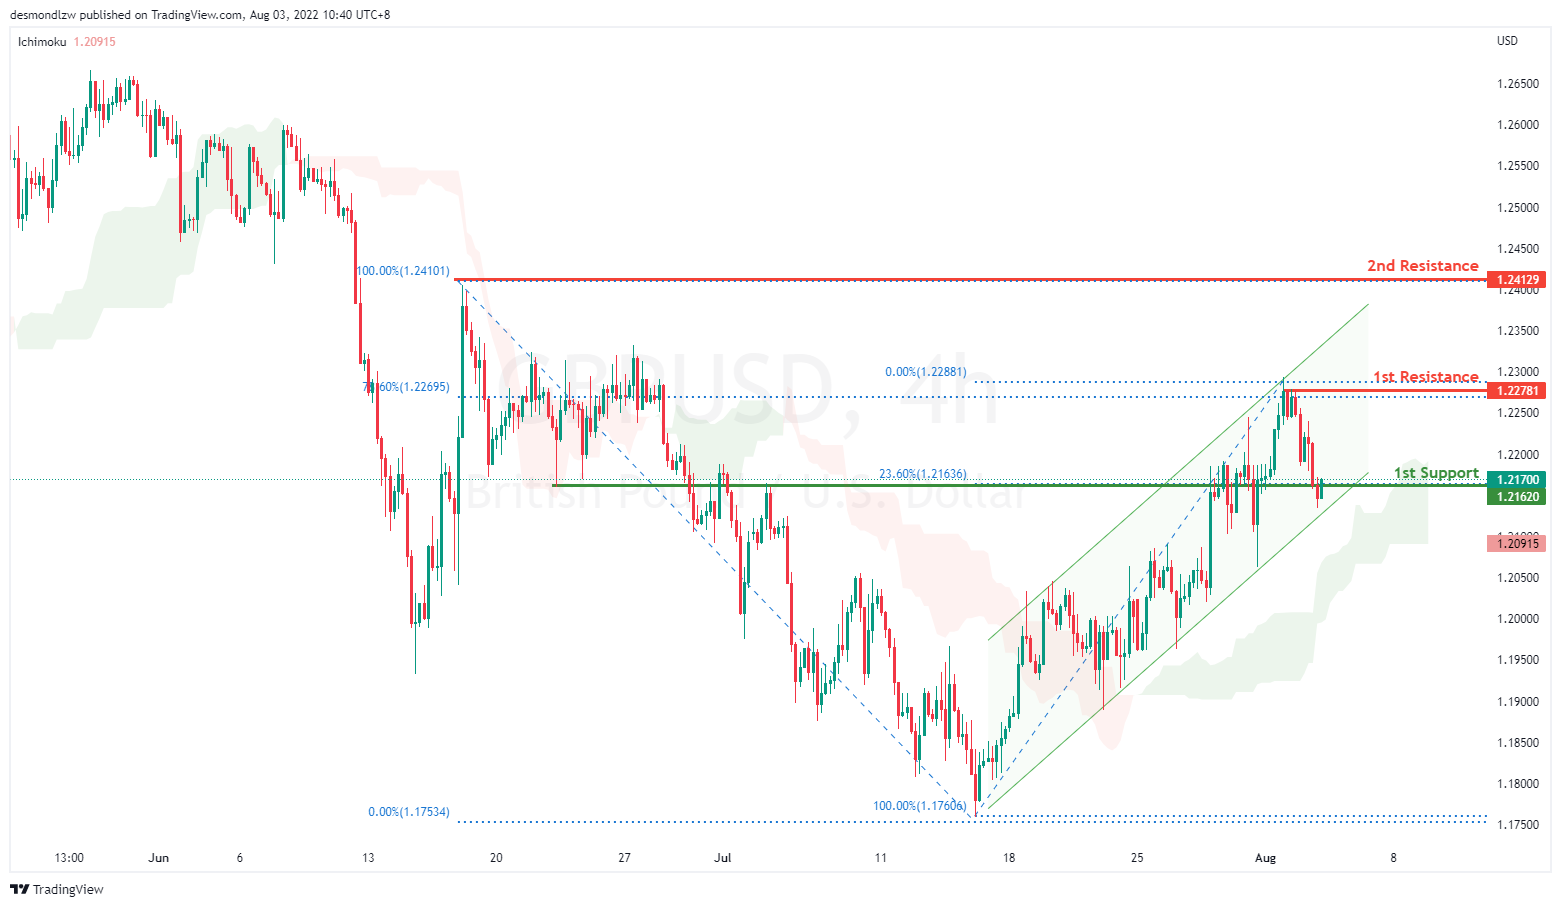
On the H4, with prices moving in an ascending channel and respecting the Ichimoku cloud, we are bullish biased. Price is now testing the first support at 1.216 which coincides with 23.6% Fibonacci retracement. If price fails to break support, and confirm an upside trend, we would expect bullish momentum to carry price to 1st resistance at 1.227 78.6% Fibonacci retracement then second resistance at 1.24129
Areas of consideration:
- H4 1st resistance at 1.227
- H4 1st support at 1.216
USD/CHF:
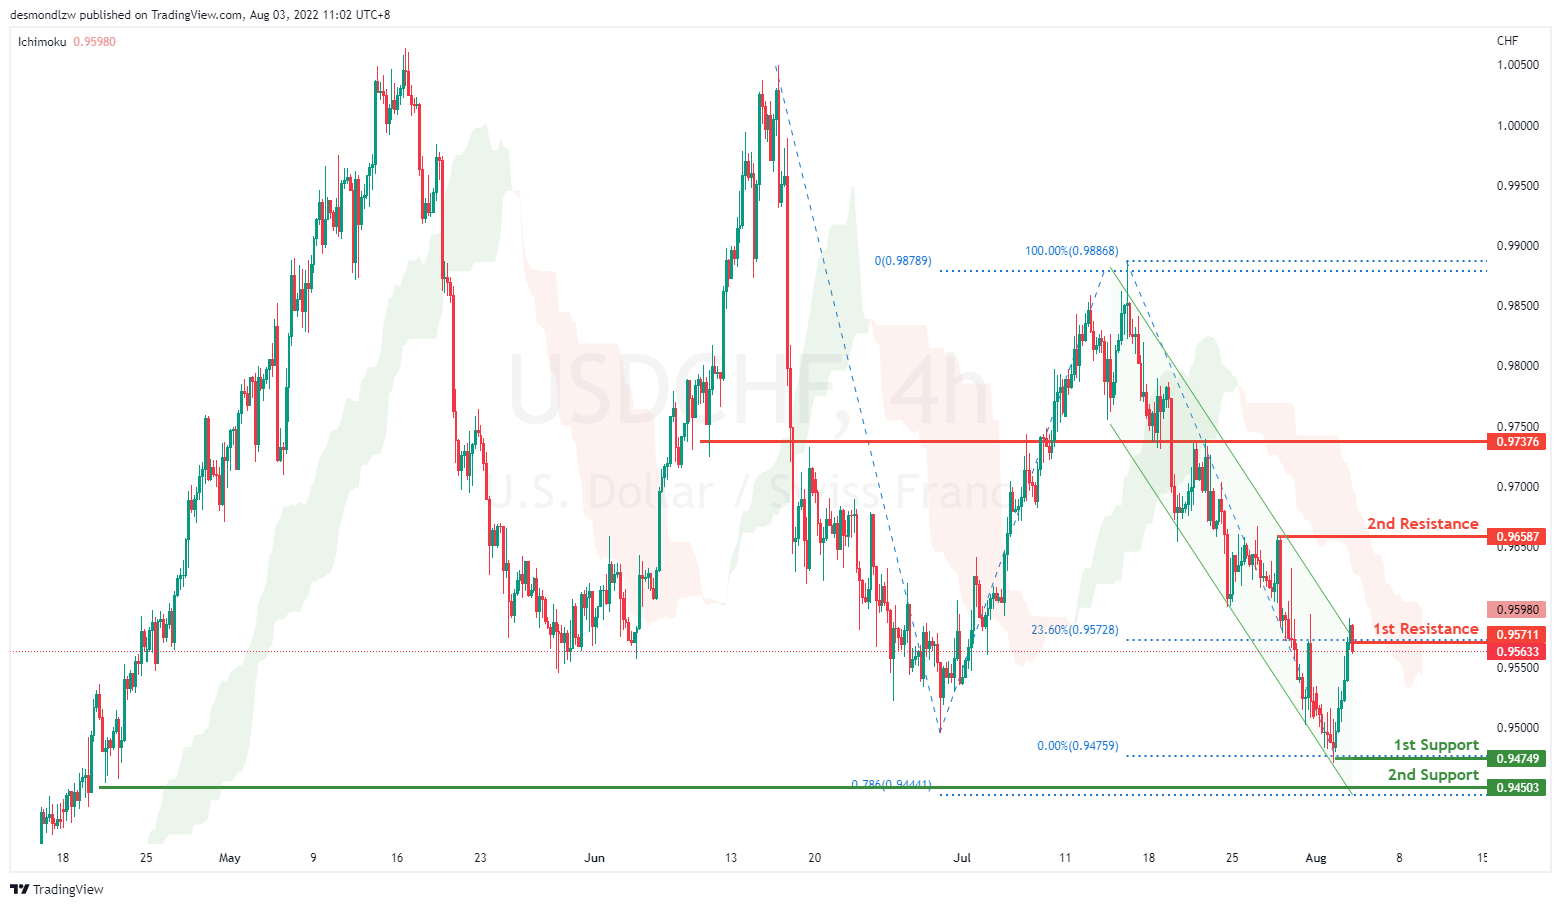
On the H4, prices are moving in a strong bearish momentum, respecting the descending channel. We have a bearish bias and price is testing at the first resistance level, 23.6% retracement 0.957. If prices break this level, it will test at the second resistance level 0.965. Alternatively if price rejects, it will pull back to test the first support level 0.947 subsequently 78.6% fibonacci projection level at 0.945
Areas of consideration
- H4 1st resistance at 0.957
- H4 1st support at 0.947
XAU/USD (GOLD):
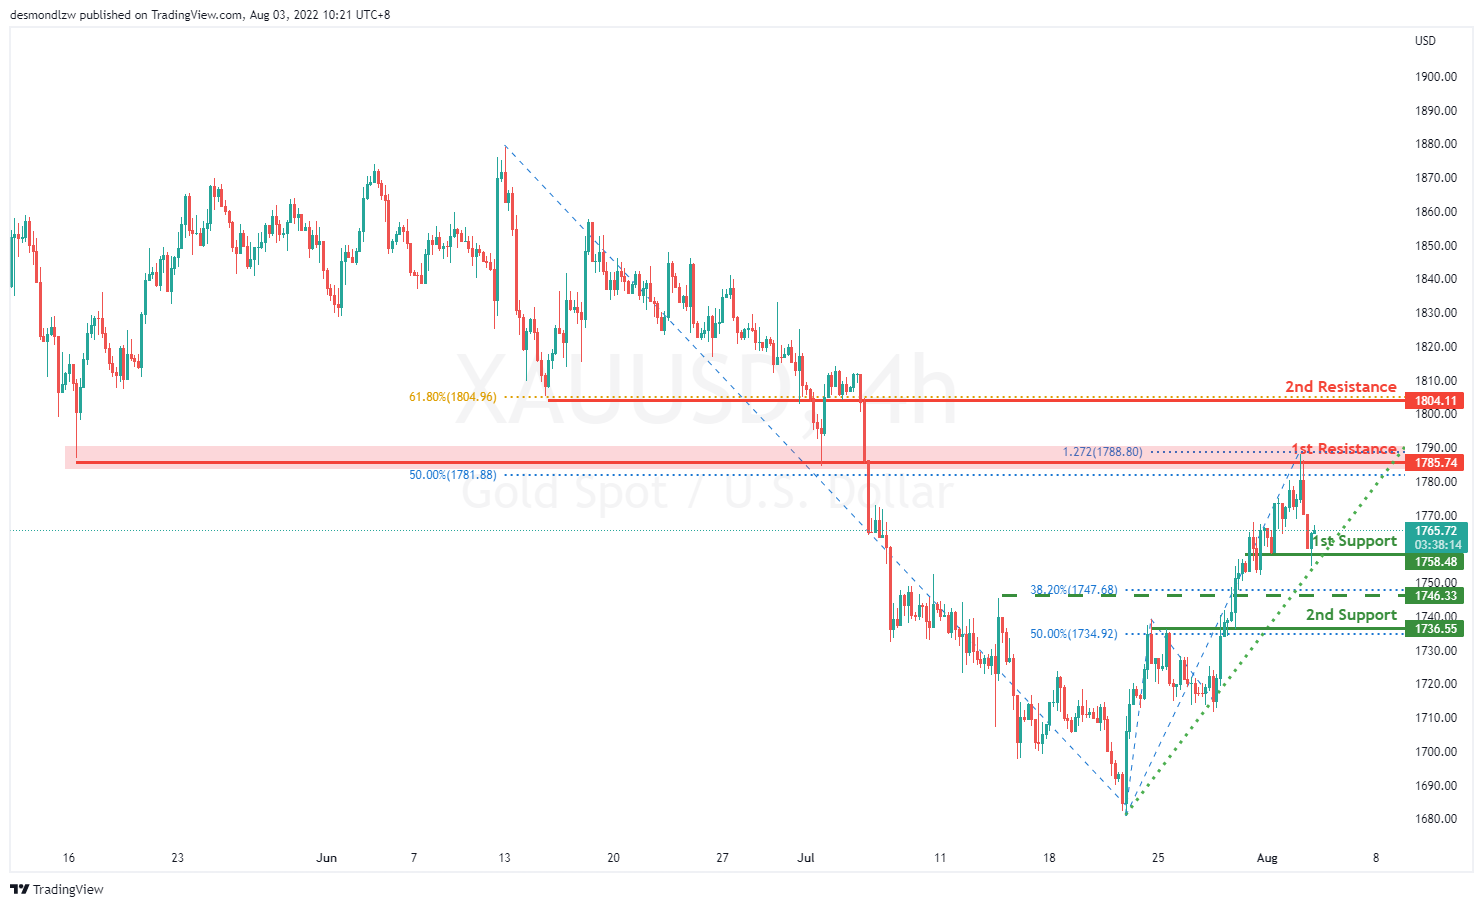
On the H4, with prices going along the ascending trendline, we have a bullish bias that price may rise from the 1st support at 1760.85, which is in line with the 78.6% fibonacci projection to 1st resistance at 1785.74 where the the 127.2% projection and 50% fibonacci retracement are. If the price keeps going up, it may reach the 2nd resistance at 1804.11, which is in line with the 61.8% fibonacci retracement. Alternatively, prices may drop to 2nd support at 1736.55 where the 50% fibonacci retracement is. Take note of the intermediate support at 1746.33, which is in line with 38.2% fibonacci retracement.
Areas of consideration:
- H4 time frame, 1st support at 1760.85
- H4 time frame, 1st resistance at 1785.74
AUD/USD:
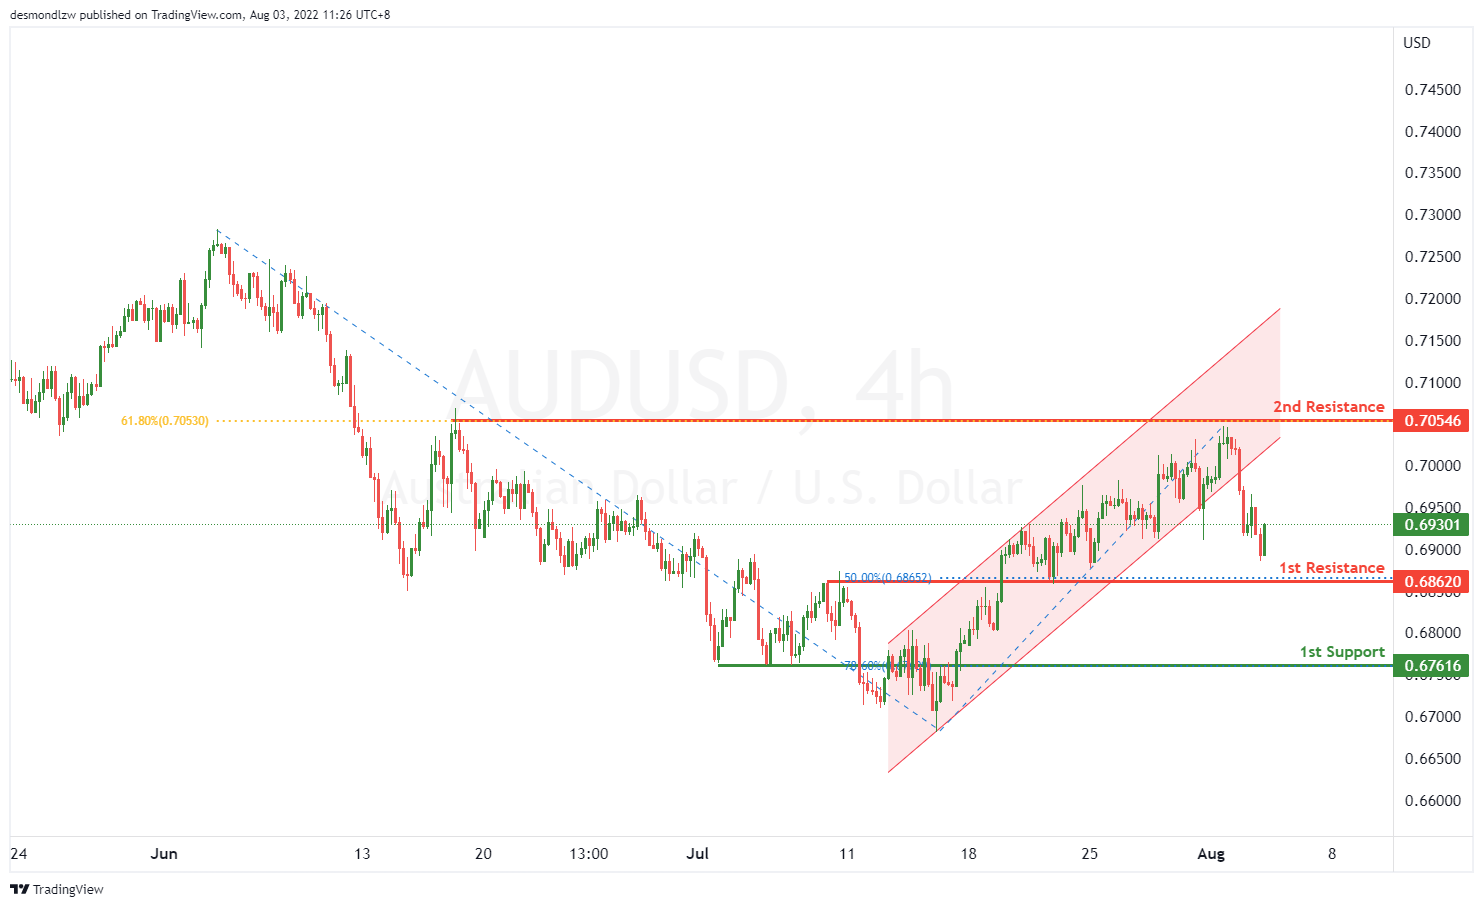
On the H4, with price breaking the ascending trend channel, we have a bearish bias that price will drop from the 1st resistance at 0.68620, where the 50% fibonacci retracement is to the 1st support at 0.67616 where the swing low and 78.6% fibonacci retracement are. Alternatively, price may reverse off 1st resistance and rise to the 2nd resistance at 0.70546 at 61.8% fibonacci retracement.
Areas of consideration
- H4 1st resistance at 0.68620
- H4 1st support at 0.67616
NZD/USD:
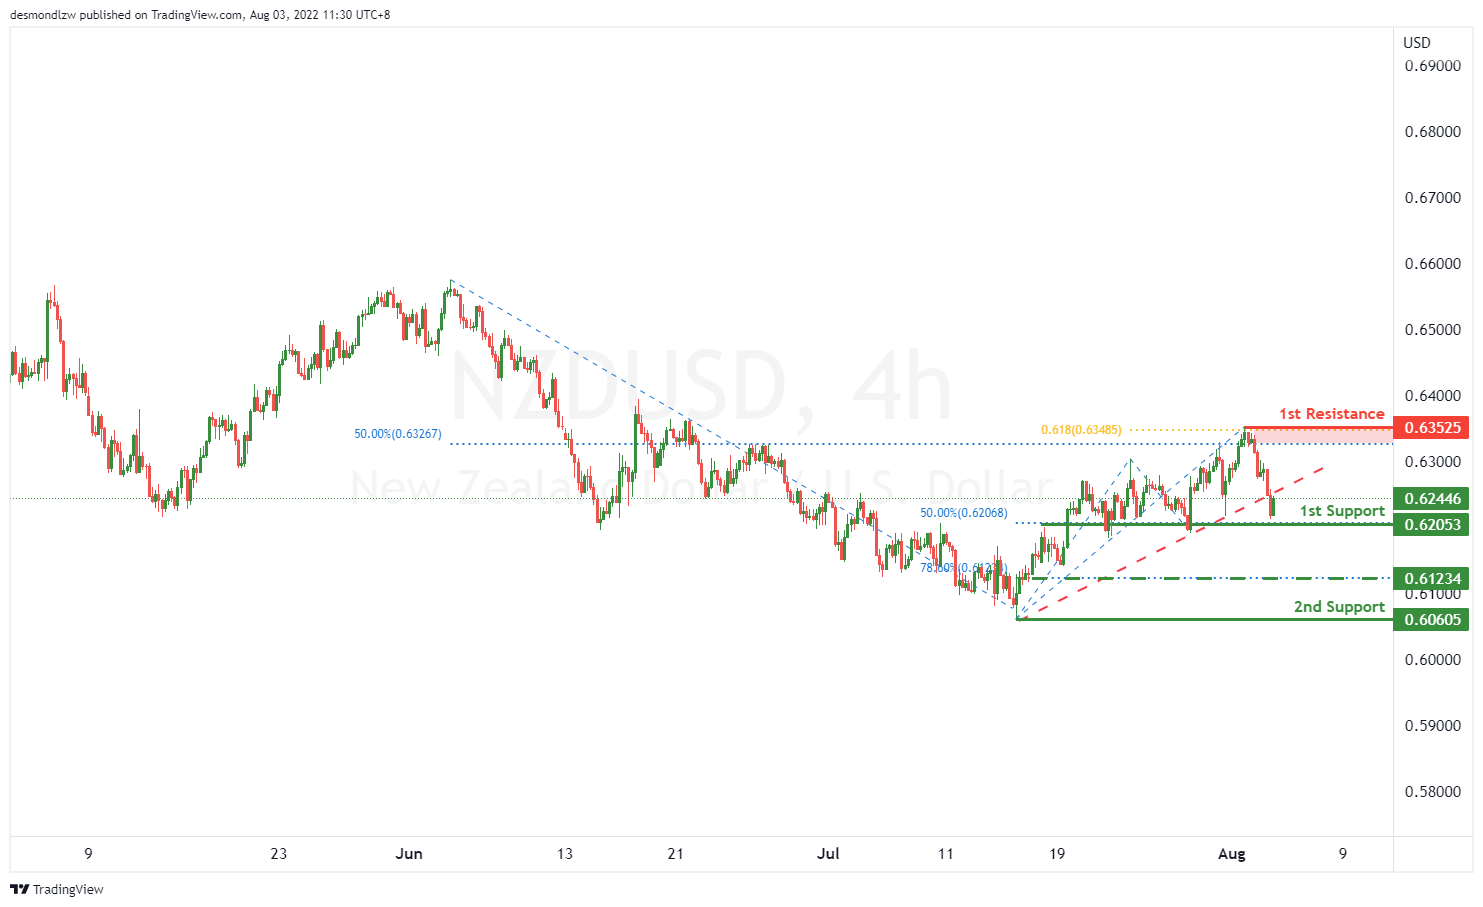
On the H4, with price breaking the ascending trendline, we have a bearish bias that price may drop from the 1st support at 0.62053 where 50% fibonacci retracement is to the 2nd support at 0.60605 where the swing low is. Alternatively, price may reverse off the 1st support and rise to the 1st resistance at 0.63525 at the swing high, 61.8% fibonacci projection and 50% fibonacci retracement. Take note the price of 0.61234 could be the intermediate support, which is in line with the 78.6% fibonacci retracement.
Areas of consideration:
- H4 time frame, 1st support at 0.62053
- H4 time frame, 2nd support at 0.60605
USD/CAD:
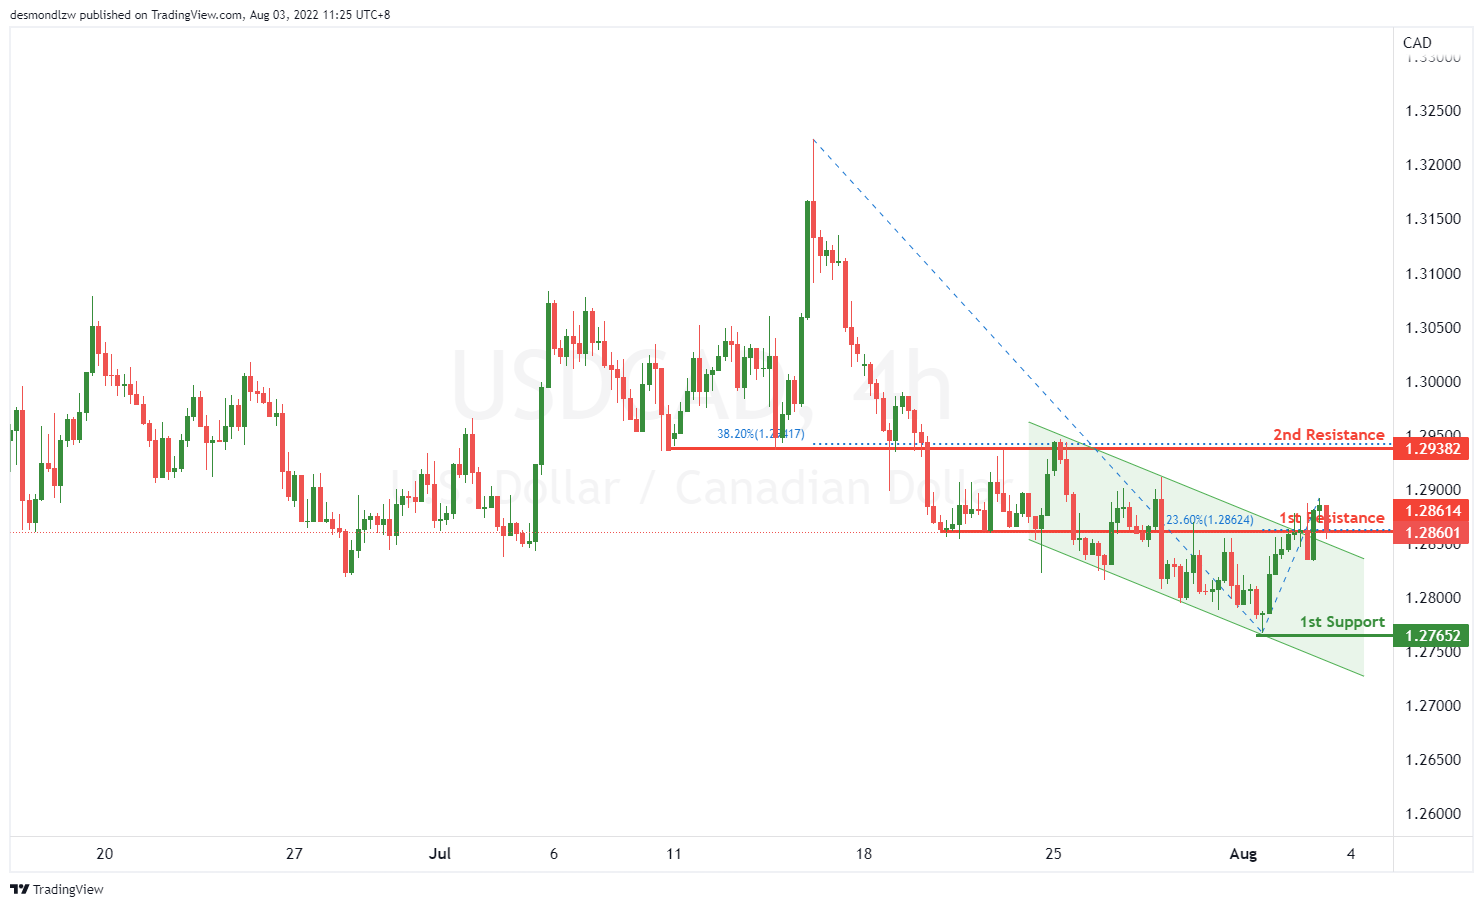
On the H4, with the price breaking the descending trendline, we have a bullish bias that the price may rise from our 1st resistance at 1.28706, which is in line with 23.6% fibonacci retracement to our 2nd resistance at 1.29382, which is in line with the overlap resistance and 38.2% fibonacci retracement. Alternatively, the price may drop to the 1st support at 1.27652, which is in line with the swing low.
Areas of consideration:
- H4 time frame, 1st resistance at 1.28706
- H4 time frame, 2nd resistance at 1.29382
OIL:
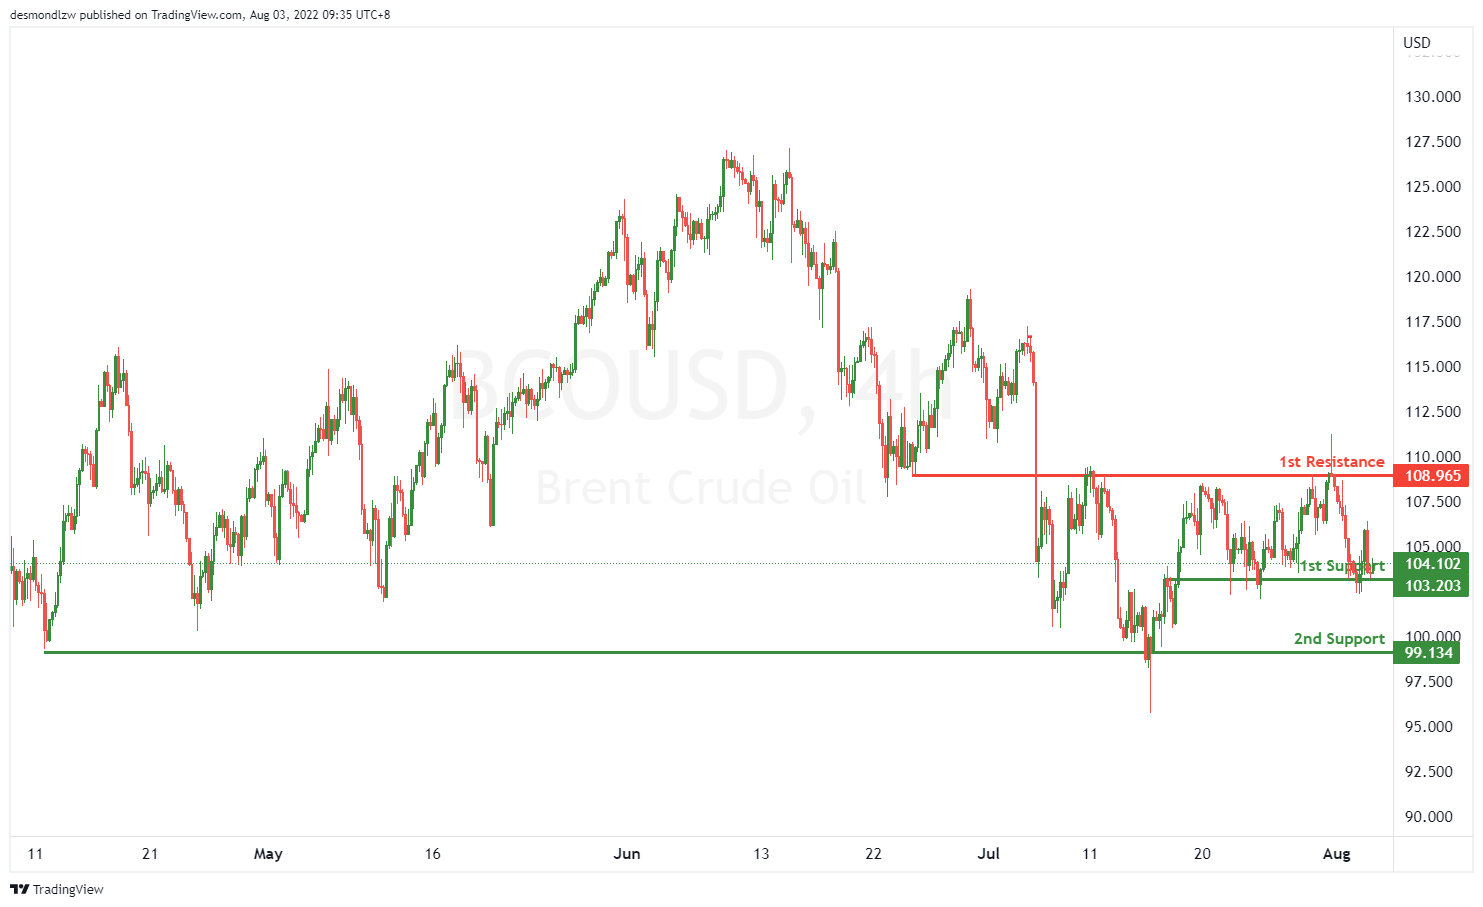
On the H4, with price fluctuating between 1st support and 1st resistance, we have a neutral bias that price might rise from the 1st support at 103.203, where the overlap support is to 1st resistance at 108.965 where the swing lows are. Otherwise, the price may drop to our 2nd support at 99.134, where the overlap support is.
Areas of consideration:
- H4 time frame, 1st support of 103.203
- H4 time frame, 1st resistance of 108.965
Or
- H4 time frame, 1st support of 103.203
- H4 time frame, 2ndt support of 99.134
Dow Jones Industrial Average:
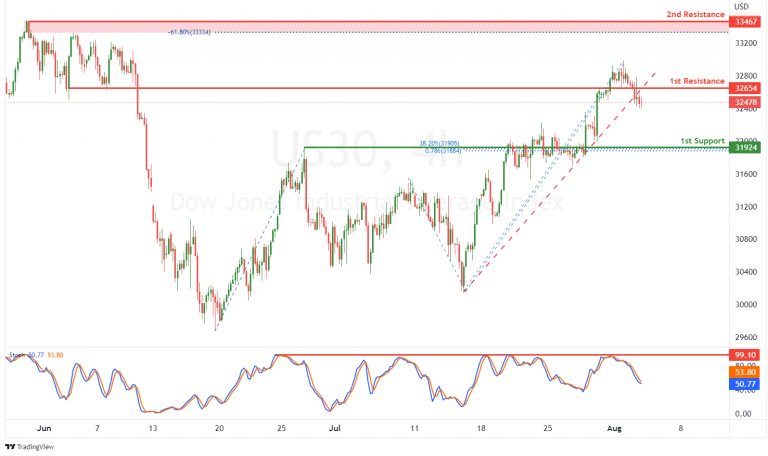
On the H4, with price breaking out of an ascending trendline and reversing off the stochastic resistance, we have a bearish bias that price will drop from our 1st resistance at 32654 where the pullback support is to the 1st support at 31924 where the pullback support, 38.2% fibonacci retracement and 78.6% fibonacci projection are. Alternatively, price could break 1st resistance structure and rise to 2nd resistance at 33467 where the swing high resistance and -61.8% fibonacci expansion are.
Areas of consideration:
- H4 time frame, 1st resistance of 32654
- H4 time frame, 1st support at 31924
DAX:
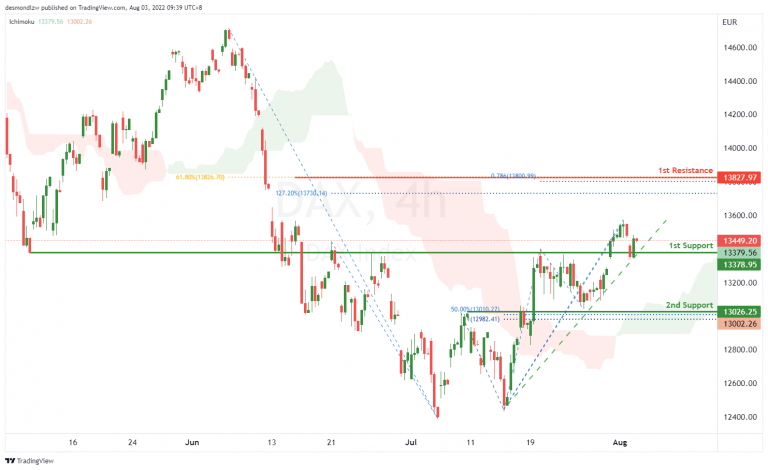
On the H4, with price moving above the ichimoku indicator and along the ascending trendline, we have a bullish bias that price will rise from 1st support at 13378.95 in line with overlap support to the 1st resistance at 13827.97 where the 61.8% fibonacci retracement, 127.2% fibonacci extension and 78.6% fibonacci projection are. Alternatively, price could break 1st support structure and drop to 2nd support at 13026.25 where the pullback support, 50% fibonacci retracement and 100% fibonacci projection are.
Areas of consideration:
- H4 time frame, 1st resistance of 13827.97
- H4 time frame, 1st support at 13378.95
ETHUSD:
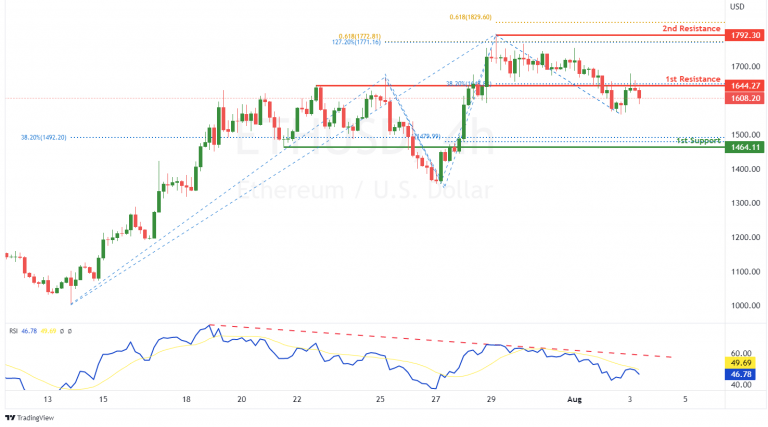
On the H4, with RSI moving along a descending trendline, we have a bearish bias that price will drop from our 1st resistance at 1644.27 where the overlap resistance and 38.2% fibonacci retracement are to the 1st support at 1464.11 where the pullback support, 100% fibonacci projection and 38.2% fibonacci retracement are. Alternatively, price could break 1st resistance structure and rise to 2nd resistance at 1792.30 where the swing high resistance, 61.8% fibonacci projection, 127.2% fibonacci extension and 61.8% fibonacci projection are.
Areas of consideration:
- H4 time frame, 1st resistance of 1644.27
- H4 time frame, 1st support at 1464.11
BTCUSD:
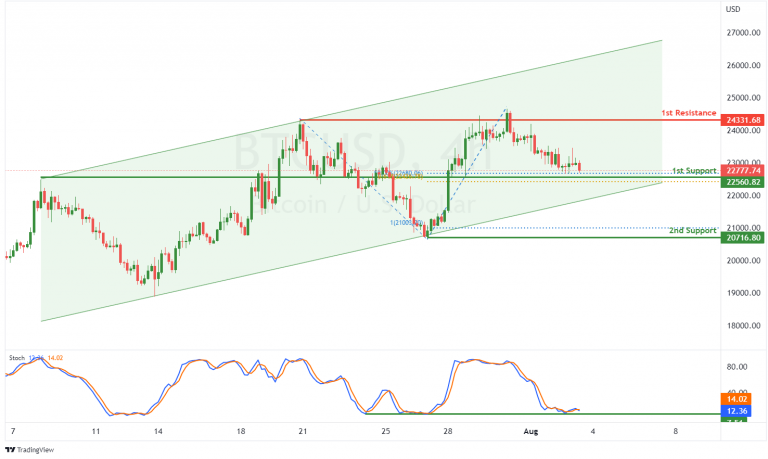
On the H4, with price moving within a bullish channel and bouncing up from the stochastic support, we have a bullish bias that price will rise from our 1st support at 22560.82 where the pullback support, 50% fibonacci retracement and 61.8% fibonacci projection are to the 1st resistance at 24331.68 where the pullback resistance is. Alternatively, price could break 1st support structure and drop to 2nd support at 20716.80 where the swing low support and 100% fibonacci projection are.
Areas of consideration:
- H4 time frame, 1st resistance of 24331.68
- H4 time frame, 1st support at 22560.82
S&P 500:
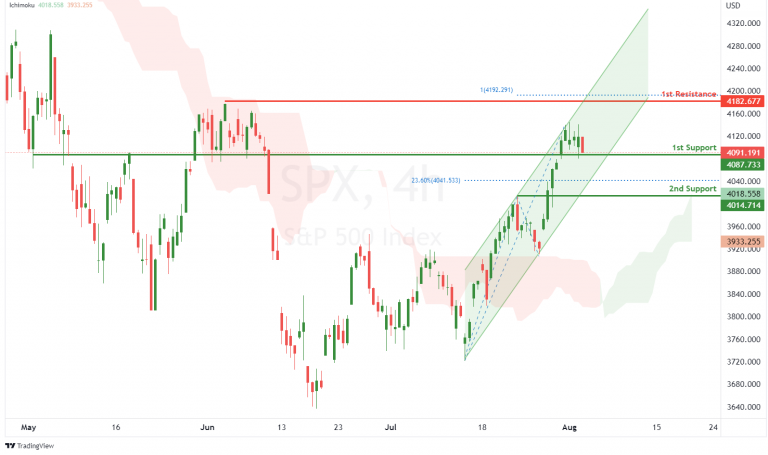
On the H4, with price moving above the ichimoku indicator and within an ascending channel, we have a bullish bias that price will rise from our 1st support at 4087.733 where the pullback support is to the 1st resistance at 4182.677 where the swing high resistance and 100% fibonacci projection are. Alternatively, price could break 1st support and drop to 2nd support at 4014.714 where the pullback support and 23.6% fibonacci retracement are.
Areas of consideration:
- H4 time frame, 1st resistance of 4182.677
- H4 time frame, 1st support at 4087.733
GBP/USD Daily Outlook
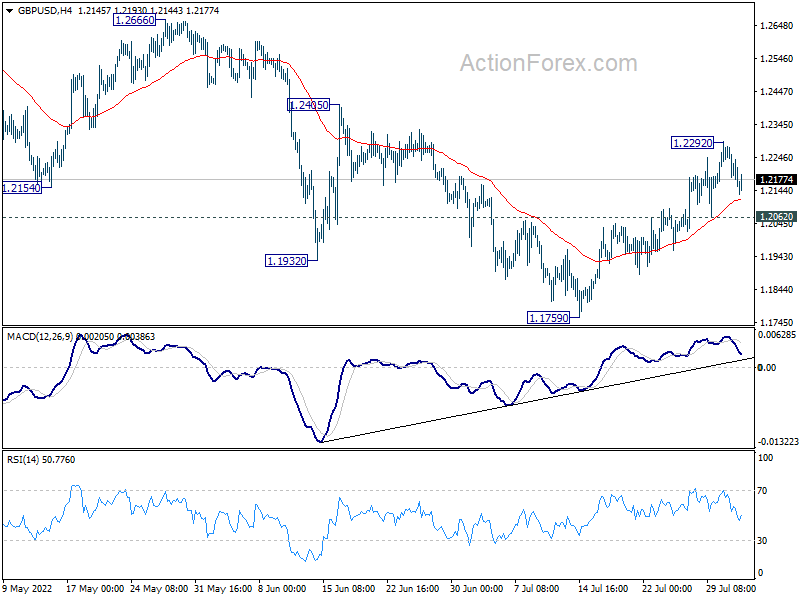
Daily Pivots: (S1) 1.2122; (P) 1.2200; (R1) 1.2242; More...
Intraday bias in GBP/USD remains neutral for consolidation below 1.2292 temporary top. Further rally is expected as long as 1.2062 minor support holds. Above 1.2292 will target 1.2405 resistance first. Firm break there will target 1.2666 key resistance next. On the downside, however, break of 1.2062 minor support will argue that the rebound is over, and turn bias back to the downside for retesting 1.1759 low instead.
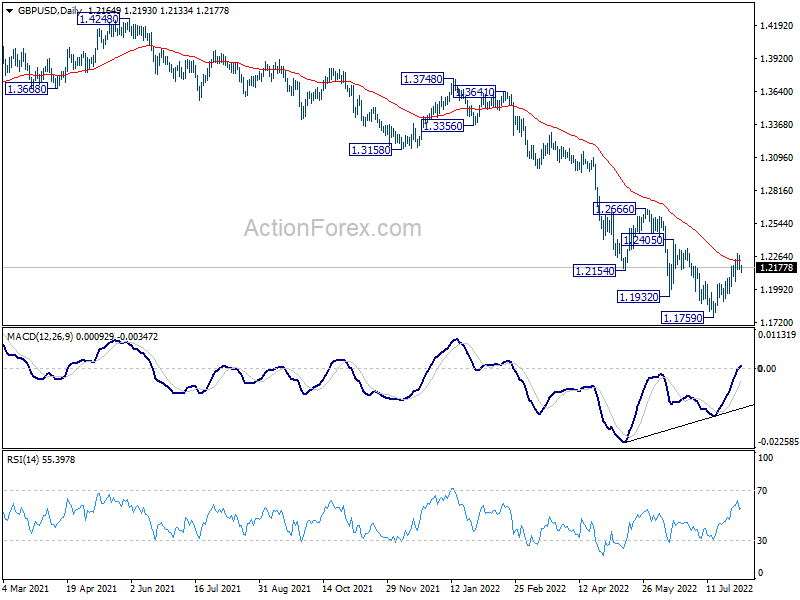
In the bigger picture, fall from 1.4248 (2018 high) could be a leg inside the pattern from 1.1409 (2020 low), or resuming the longer term down trend. Deeper decline is expected as long as 1.2666 resistance holds. Next target is 1.1409 low. However, firm break of 1.2666 will bring stronger rise back to 55 week EMA (now at 1.2957).
Dollar’s Momentum Doesn’t Warrant a Reversal Yet
Overall, the development in the financial markets are rather mixed for now, still awaiting further development in Taiwan Strait tensions. Yen's rally was somewhat choked by the recovery in US benchmark yields overnight. Dollar is attempting a rebound, but momentum doesn't warrant a reversal yet. Sterling is the relatively stronger European major, but the break out against Euro looks half-hearted. Investors might continue to hold their bets until US House Speaker Nancy Pelosi leaves Taiwan.
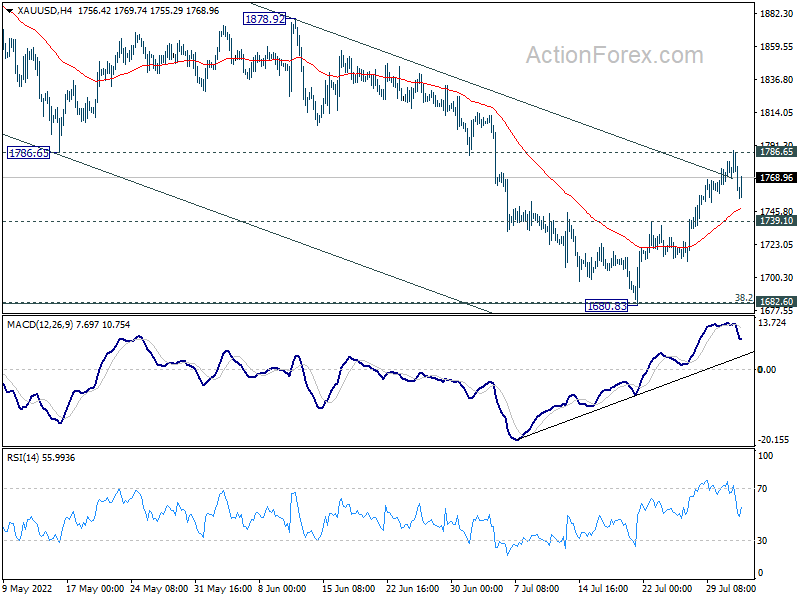
Technically, Gold was rejected by 1786.65 support turned resistance on first attempt, but it's resiliently holding on for now. Further rise will remain in favor as long as 1739.10 support holds. Sustained break of 1786.65 and 55 day EMA will affirm the case and bullish reversal, and target 1878.92 resistance and above next. If happens, Gold's next rally could come with another rebound of selloff in the greenback.
In Asia, at the time of writing, Nikkei is up 0.41%. Hong Kong HSI is up 0.61%. China Shanghai SSE is up 0.40%. Singapore Strait Times is up 0.33%. Japan 10-year JGB yield is up 0.014 at 0.191. Overnight, DOW dropped -1.23%. S&P 500 dropped -0.67%. NASDAQ dropped -0.16%. 10-year yield rose 0.135 to 2.741.
Fed Mester: We're not in a recession, have more work to do on inflation
Cleveland Fed President Loretta Mester said in a Washington Post interview yesterday, "I don't believe we're in a recession... We don't have a slowdown in labor markets, and that's two key factors that go into calling a recession."
"Our policy has been to raise interest rates in order to cool down the demand side of the economy.... but certainly it hasn't slowed enough, (a), to call it a recession; and (b), to even see that moderation in demand showing through yet to a moderation and a cooling-off of price increases and inflation," she added.
"We have more work to do because we have not seen that turn in inflation. It's got to be a sustained several months of evidence that inflation has first peaked - we haven't even seen that yet - and that it's moving down," she also noted.
Fed Bullard: Rates need to go a bit higher than I said before
St. Louis Fed President James Bullard said yesterday that inflation has "come in hotter" than he expected during Q2. Thus, "I think we're going to have to go a little bit higher than what I said before." He added that the federal funds rate will have to go to 3.75-4.00% by the end of the year, comparing to the current 2.25-2.50%.
"Since modern central banks have more credibility than their counterparts in the 1970s, it appears that both the Fed and the ECB may be able to disinflate in an orderly manner and achieve a relatively soft landing," Bullard also noted.
Fed Daly: Need to keep committed until actually seeing inflation down in data
San Francisco Fed President Mary Daly said Fed is "nowhere near almost done", with inflation. "We have made a good start and I feel really pleased with where we've gotten to at this point."
"It really would be premature to unwind all of that and say the job is done," she said. "I also think that we've been with this high inflation for a while, and really getting too confident that we've already solved the problem," Daly said, adding that the Fed needs to "keep committed until we actually see it in the data."
Fed Evans: 50bps hike next is reasonable, 75bps also ok
Chicago Fed President Charles Evan said that is things "weren't improving", the 50bps rate hike in September is a "reasonable assessment", but 75 bps "could also be ok". He added "I doubt that more would be called for."
"We wanted to get to neutral expeditiously. We want to get a little restrictive expeditiously," Evans added. "We want to see if the real side effects are going to start coming back in line … or if we have a lot more ahead of us."
Australia AiG construction dropped to 45.3, RBA tightening will end the boom
Australia AiG Performance of Construction Index dropped -0.9 to 45.3 in July. Activity dropped -3.5 to 42.7. Employment rose 2.2 to 53.0. New orders dropped -2.7 to 43.1. Supplier deliveries rose 3.2 to 42.2. Input prices dropped -2.2 to 93.8. Selling prices rose 4.4 to 87.1.
HIA Economist, Thomas Devitt, said: "Confidence in the housing sector has been adversely impacted by rising rates which will compound the rise in the cost of construction. This has not yet materialised in slowing sales or approvals of new homes and there is still a large volume of building work in the pipeline to complete. Recent declines in confidence, as shown in this month's Australian PCI, reflect an anticipation on the part of builders of less new work entering the pipeline in coming months as the RBA's current tightening cycle will, inevitably, bring an end to the boom."
New Zealand employment flat in Q2, wage grow strongest since 2008
New Zealand employment was essentially flat in Q2, below expectation of 0.4% rise. Unemployment rate ticked up from 3.2% to 3.3%, against expectation a fall to 3.1%. Labor force participation rate dropped -0.1% to 70.8%.
Wage inflation (salary and wage rates, including overtime) in all sectors rose 1.1% qoq, 3.5% yoy. It grew 1.3% qoq, 3.4% yoy in private sector, and 0.6% qoq, 3.0% yoy in public sector.
"Measures of spare labour market capacity have fallen over the year and remained low for several quarters, continuing to show a tight labour market," work and wellbeing statistics senior manager Becky Collett said.
"The June quarter had the largest increase in LCI salary and wages rates since late-2008. Over the year, a steadily increasing number of wages have been raised to better match market rates, as well as attracting or retaining staff," business employment insights manager Sue Chapman said.
China Caixin PMI services rose to 55.5, composite dropped to 54.0
China Caixin PMI Services rose from 54.5 to 55.5 in July, above expectation of 54.0. That's the highest level since April 2021. PMI Composite dropped from 55.3 to 54.0.
Wang Zhe, Senior Economist at Caixin Insight Group said: "In general, the eased Covid situation and restrictions facilitated a continuous recovery in the economy. The services sector, which had been previously hit harder by the outbreaks than manufacturing, showed stronger improvement. Supply and demand continued to improve with supply stronger than demand. The labor market shrank greatly, adding to employment pressures. Business costs steadily climbed while prices charged remained stable, posing challenges for company profits. The market held on to positive sentiment, even with concerns about the outlook for Covid and the economy."
Looking ahead
Germany trade balance, Swiss CPI, Eurozone PMI services final, PPI and retail sales, and UK PMI services final will be released in European session. Later in the day, US will release ISM services and factory orders.
GBP/USD Daily Outlook
Daily Pivots: (S1) 1.2122; (P) 1.2200; (R1) 1.2242; More...
Intraday bias in GBP/USD remains neutral for consolidation below 1.2292 temporary top. Further rally is expected as long as 1.2062 minor support holds. Above 1.2292 will target 1.2405 resistance first. Firm break there will target 1.2666 key resistance next. On the downside, however, break of 1.2062 minor support will argue that the rebound is over, and turn bias back to the downside for retesting 1.1759 low instead.
In the bigger picture, fall from 1.4248 (2018 high) could be a leg inside the pattern from 1.1409 (2020 low), or resuming the longer term down trend. Deeper decline is expected as long as 1.2666 resistance holds. Next target is 1.1409 low. However, firm break of 1.2666 will bring stronger rise back to 55 week EMA (now at 1.2957).
Economic Indicators Update
| GMT | Ccy | Events | Actual | Forecast | Previous | Revised |
|---|---|---|---|---|---|---|
| 22:30 | AUD | AiG Performance of Construction Index Jul | 45.3 | 46.2 | ||
| 22:45 | NZD | Employment Change Q2 | 0.00% | 0.40% | 0.10% | |
| 22:45 | NZD | Unemployment Rate Q2 | 3.30% | 3.10% | 3.20% | |
| 22:45 | NZD | Labour Cost Index Q/Q Q2 | 1.30% | 1.10% | 0.70% | |
| 01:45 | CNY | Caixin Services PMI Jul | 55.5 | 54 | 54.5 | |
| 06:00 | EUR | Germany Trade Balance (EUR) Jun | -1.1B | -1.0B | ||
| 06:30 | CHF | CPI M/M Jul | 0.00% | 0.50% | ||
| 06:30 | CHF | CPI Y/Y Jul | 3.60% | 3.40% | ||
| 07:45 | EUR | Italy Services PMI Jul | 50 | 51.6 | ||
| 07:50 | EUR | France Services PMI Jul F | 52.1 | 52.1 | ||
| 07:55 | EUR | Germany Services PMI Jul F | 49.2 | 49.2 | ||
| 08:00 | EUR | Italy Retail Sales M/M Jun | 0.20% | 1.90% | ||
| 08:00 | EUR | Eurozone Services PMI Jul F | 50.6 | 50.6 | ||
| 08:30 | GBP | Services PMI Jul F | 53.3 | 53.3 | ||
| 09:00 | EUR | Eurozone PPI M/M Jun | 1.00% | 0.70% | ||
| 09:00 | EUR | Eurozone PPI Y/Y Jun | 35.70% | 36.30% | ||
| 09:00 | EUR | Eurozone Retail Sales M/M Jun | 0.10% | 0.20% | ||
| 13:45 | USD | Services PMI Jul F | 47 | 47 | ||
| 14:00 | USD | ISM Services PMI Jul | 53.5 | 55.3 | ||
| 14:00 | USD | Factory Orders M/M Jun | 0.80% | 1.60% | ||
| 14:30 | USD | Crude Oil Inventories | -1.4M | -4.5M |