

Sample Category Title
GBP/USD Mid-Day Outlook
Daily Pivots: (S1) 1.2177; (P) 1.2236; (R1) 1.2314; More...
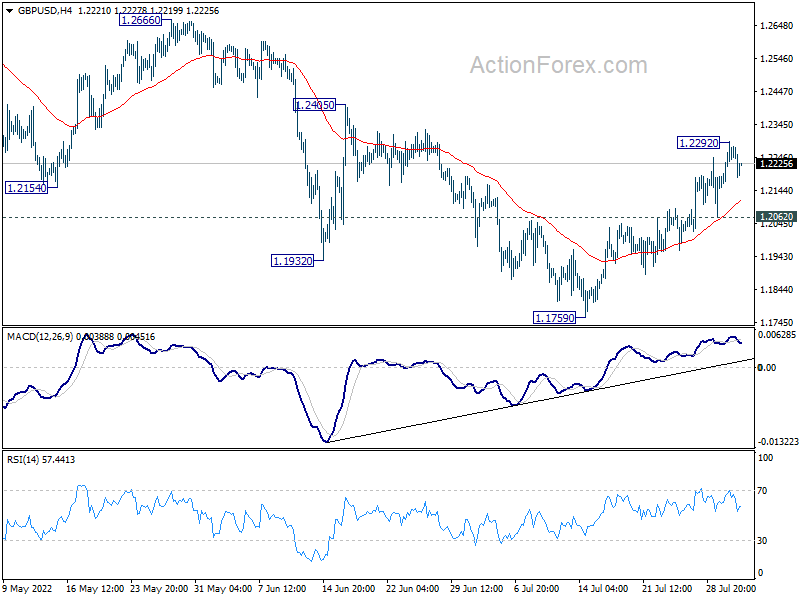
Intraday bias in GBP/USD is turned neutral with current retreat. But further rally is expected as long as 1.2062 minor support holds. Above 1.2292 will target 1.2405 resistance first. Firm break there will target 1.2666 key resistance next. On the downside, however, break of 1.2062 minor support will argue that the rebound is over, and turn bias back to the downside for retesting 1.1759 low instead.
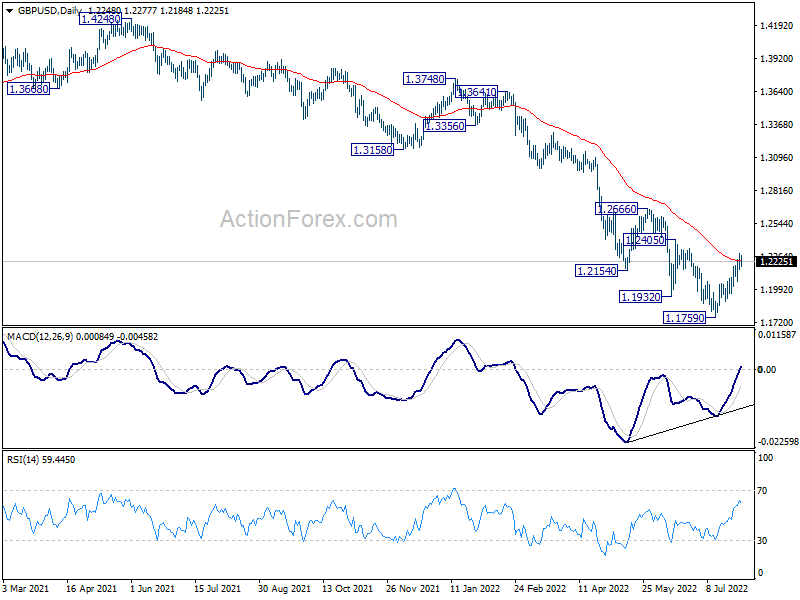
In the bigger picture, fall from 1.4248 (2018 high) could be a leg inside the pattern from 1.1409 (2020 low), or resuming the longer term down trend. Deeper decline is expected as long as 1.2666 resistance holds. Next target is 1.1409 low. However, firm break of 1.2666 will bring stronger rise back to 55 week EMA (now at 1.2957).
USD/JPY Mid-Day Outlook
Daily Pivots: (S1) 130.96; (P) 132.26; (R1) 132.92; More...
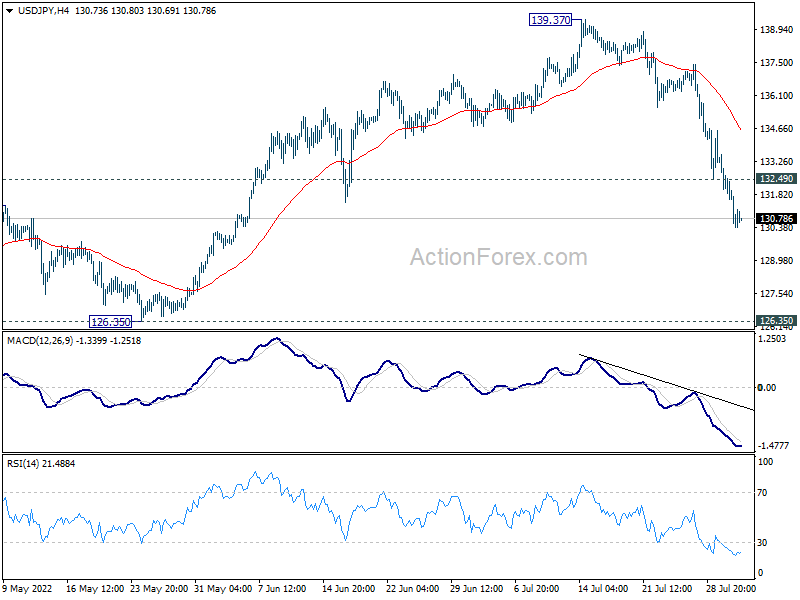
Intraday bias in USD/JPY remains on the downside as fall from 139.37 is in progress. Deeper decline would be seen towards 126.35 support. But strong support is expected above there, at least on first attempt, to bring rebound. On the upside, above 132.49 minor resistance will turn intraday bias neutral first, and bring some consolidations.
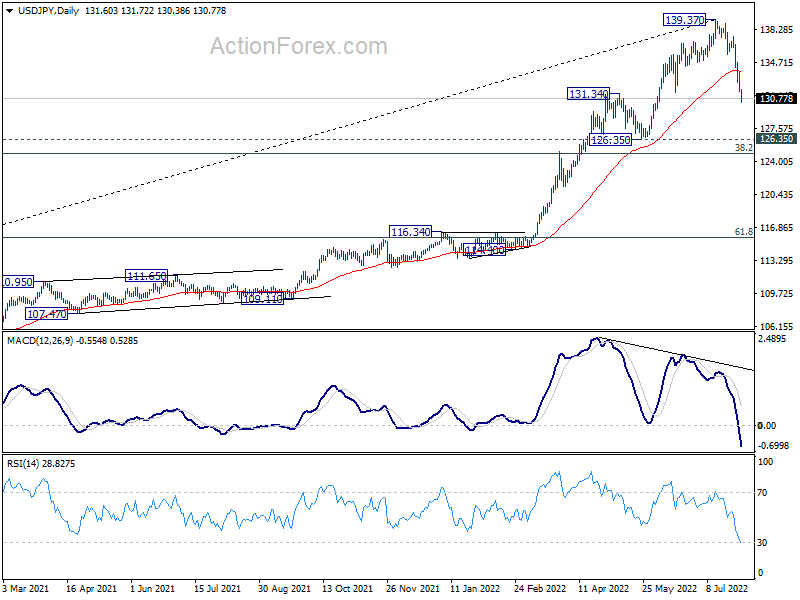
In the bigger picture, a medium term top should be in place at 139.37, on bearish divergence condition in daily MACD. Fall from there could be correcting whole up trend from 101.18 (2020 low). While deeper decline cannot be ruled out, outlook will stays bullish as long as 55 week EMA (now at 121.84) holds. Long term up trend is expected to resume through 139.37 at a later stage, after the correction finishes.
USD/CHF Mid-Day Outlook
Daily Pivots: (S1) 0.9473; (P) 0.9505; (R1) 0.9528; More...
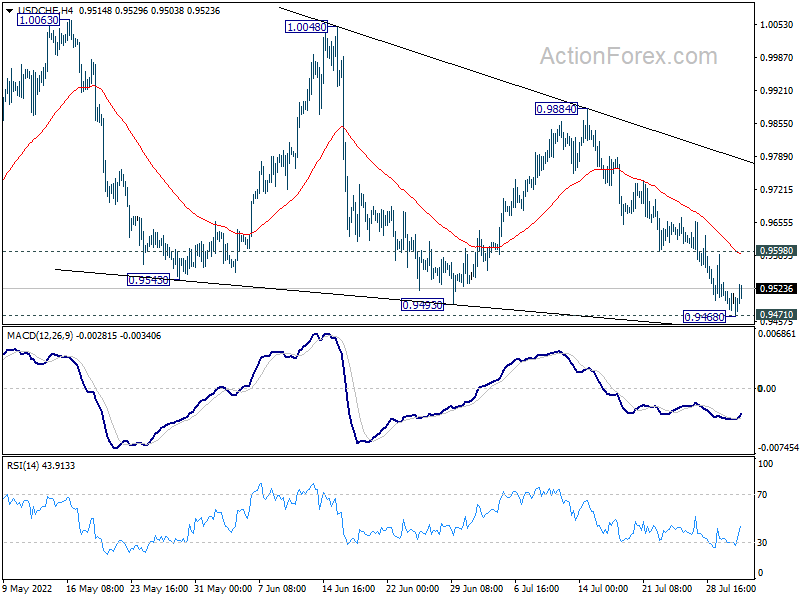
USD/CHF recovers slightly today after touching 0.9471 resistance turned support. Strong support should be seen around current level to bring a strong rebound. On the upside, above 0.9598 minor resistance will turn bias back to the upside for recovery towards 55 day EMA (now at 0.9651) and above. However, sustained break of 0.9471 will carry larger bearish implication and target 0.9193 support next.
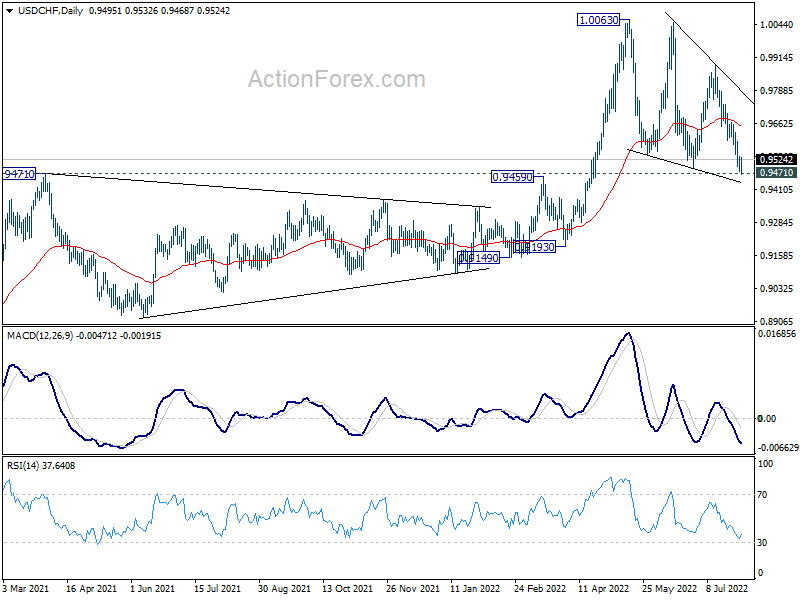
In the bigger picture, medium term up trend from 0.8756 (2021 low) is still in progress. On resumption, next target is 1.0342 (2016 high). Sustained break there will resume long term up trend from 0.7065 (2011 low). This will remain the favored case as long as 0.9471 resistance turned support holds. However, firm break of 0.9471 will raise the chance that such up trend is over. Sustained trading below 55 week EMA (now at 0.9424) could bring deeper medium term fall back to 0.9149 support and below.
Dollar Rebounding, But Yen Still the Strongest
Markets are generally in cautious mode today. While Asian markets tumbled, major European indexes are just in slight red. Dollar rebounds notably after US House Speaker Nancy Pelosi finally took the flight from Malaysia to Taiwan. Investors are still awaiting whether China would take any "retaliation". Meanwhile, Yen remains the strongest one, followed by Dollar and then Canadian. Aussie is the runaway looser, followed by Kiwi and Sterling. Euro is mixed for now, underwhelming Swiss Franc slightly.
Technically, just as EUR/USD is attempting an upside breakout, it's quickly knocked down. For now, further rise will remain in favor as long as 1.0095 support holds. There is still a second chance for EUR/USD. Nevertheless, USD/CHF is recovering after touching 0.9471 key support holds. Further rise and break of 0.9598 resistance will confirm short term bottoming. If that happens, EUR/USD could be dragged down together.
In Europe, at the time of writing, FTSE is up 004%. DAX is down -0.59%. CAC is down -0.46%. Germany 10-year yield is down -0.065 at 0.712. Earlier in Asia, Nikkei dropped -1.42%. Hong Kong HSI dropped -2.36%. China Shanghai SSE dropped -2.26%. Singapore Strait Times rose 0.01%. Japan 10-year JGB yield dropped -0.0092 to 0.177.
Swiss SECO consumer sentiment dropped to -42, worse than pandemic low
Swiss SECO Consumer Sentiment dropped sharply from -27 to -42 in Q3, worse than expectation of -34. It's even below the -39 reading after the onset of the pandemic in April 2020. Expected economic development dropped further from -31.4 to -53.5, far below its long-term average at -9. Expected financial situation dropped from -24.9 to -34.8, undershooting previous low of -26 in January 1995.
Also released, SVME PMI dropped slightly from 59.1 to 58.0 in July, above expectation of 57.9.
RBA hikes 50bps, normalization to continue but not on pre-set path
RBA raises the cash rate target by 50bps to 1.85% as widely expected. It also maintains hawkish bias, and noted, "the Board expects to take further steps in the process of normalising monetary conditions over the months ahead".
Nevertheless, the normalization is "not on a pre-set path". "The size and timing of future interest rate increases will be guided by the incoming data and the Board's assessment of the outlook for inflation and the labour market," it added.
RBA forecasts inflation to hit around 7.75% over 2022, then slow to a little above 4% over 2023, and then around 3% in 2024. GDP growth is projected to be at 3.25% over 2022 and 1.75% over the next two years. Unemployment rate is forecast to climb from current 3.5% to around 4% at the end of 2024.
"Behaviour of household spending" continues to be a "key source of uncertainty". The central bank will "paying close attention to how these various factors balance out as it assesses the appropriate setting of monetary policy."
USD/CHF Mid-Day Outlook
Daily Pivots: (S1) 0.9473; (P) 0.9505; (R1) 0.9528; More...
USD/CHF recovers slightly today after touching 0.9471 resistance turned support. Strong support should be seen around current level to bring a strong rebound. On the upside, above 0.9598 minor resistance will turn bias back to the upside for recovery towards 55 day EMA (now at 0.9651) and above. However, sustained break of 0.9471 will carry larger bearish implication and target 0.9193 support next.
In the bigger picture, medium term up trend from 0.8756 (2021 low) is still in progress. On resumption, next target is 1.0342 (2016 high). Sustained break there will resume long term up trend from 0.7065 (2011 low). This will remain the favored case as long as 0.9471 resistance turned support holds. However, firm break of 0.9471 will raise the chance that such up trend is over. Sustained trading below 55 week EMA (now at 0.9424) could bring deeper medium term fall back to 0.9149 support and below.
Economic Indicators Update
| GMT | Ccy | Events | Actual | Forecast | Previous | Revised |
|---|---|---|---|---|---|---|
| 23:50 | JPY | Monetary Base Y/Y Jul | 2.80% | 4.10% | 3.90% | |
| 01:30 | AUD | Building Permits M/M Jun | -0.70% | 4.30% | 9.90% | 11.20% |
| 04:30 | AUD | RBA Interest Rate Decision | 1.85% | 1.85% | 1.35% | |
| 07:00 | CHF | SECO Consumer Climate Q3 | -42 | -34 | -27 | |
| 07:30 | CHF | SVME PMI Jul | 58 | 57.9 | 59.1 | |
| 13:30 | CAD | Manufacturing PMI Jul | 54.6 |
Oil Decline Could Accelerate
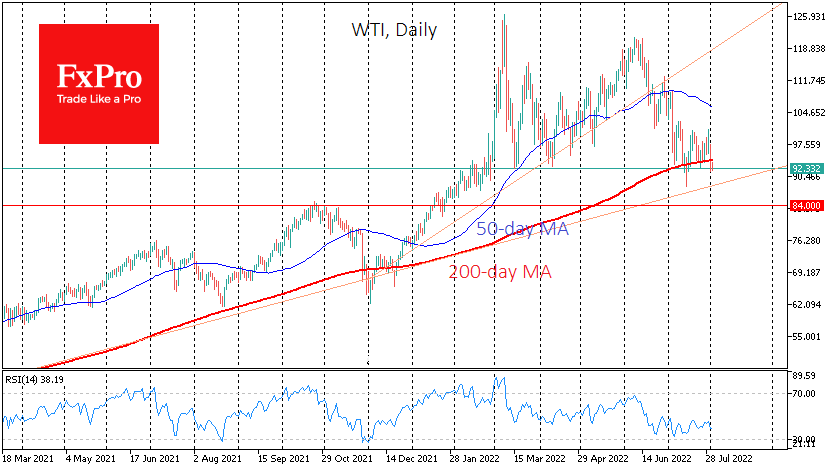
WTI oil lost more than 4.5% on Monday, returning to the area of last month’s lows and marking a new stage of the downtrend.
Oil dynamics are tightly linked to the expected economic growth rate and appear weakly linked to gas prices. The trend in oil has already turned downwards in the first half of June, while gas has been rising strongly for most of July, only beginning to correct in the last few days.
The WTI price slumped sharply by more than 4% on Monday and stayed below its 200-day moving average. Earlier in July, this curve acted as a strong support line several times.
For Brent, it is even more symbolic, as yesterday’s sell-off took it below $100. The British benchmark has managed to stay above its 200-day average, but getting well below the important round level could trigger a sell-off in the weaker hands. That is, from those speculators who have been making bullish bets.
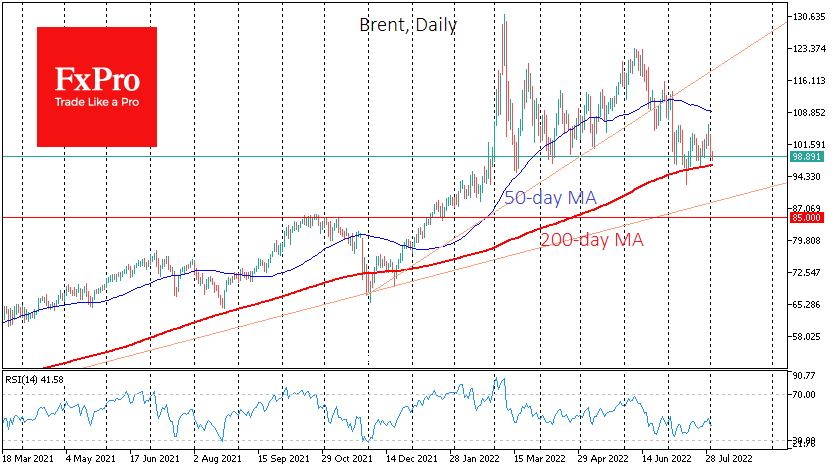
The global economic slowdown, in our view, is a more significant factor influencing the oil price than fears of supply cuts. If we are correct, we might see a local sellers’ victory this time and consolidation below the 200-day average, which we have not seen since November 2020.
This week, US jobs data could be critical in determining the direction of oil in the future. In case of weak economic data, commodity prices may increase their decline. A new upward momentum cannot be ruled out if the following jobs report surprises with its strength. However, the latter scenario looks less likely.
A collapse in WTI crude under the 200-day average would open a direct route to $84, the cyclical highs of last November. For Brent, a further bearish sentiment would open up the potential for a correction to $85-86.
NZD Slides, Employment Report Next
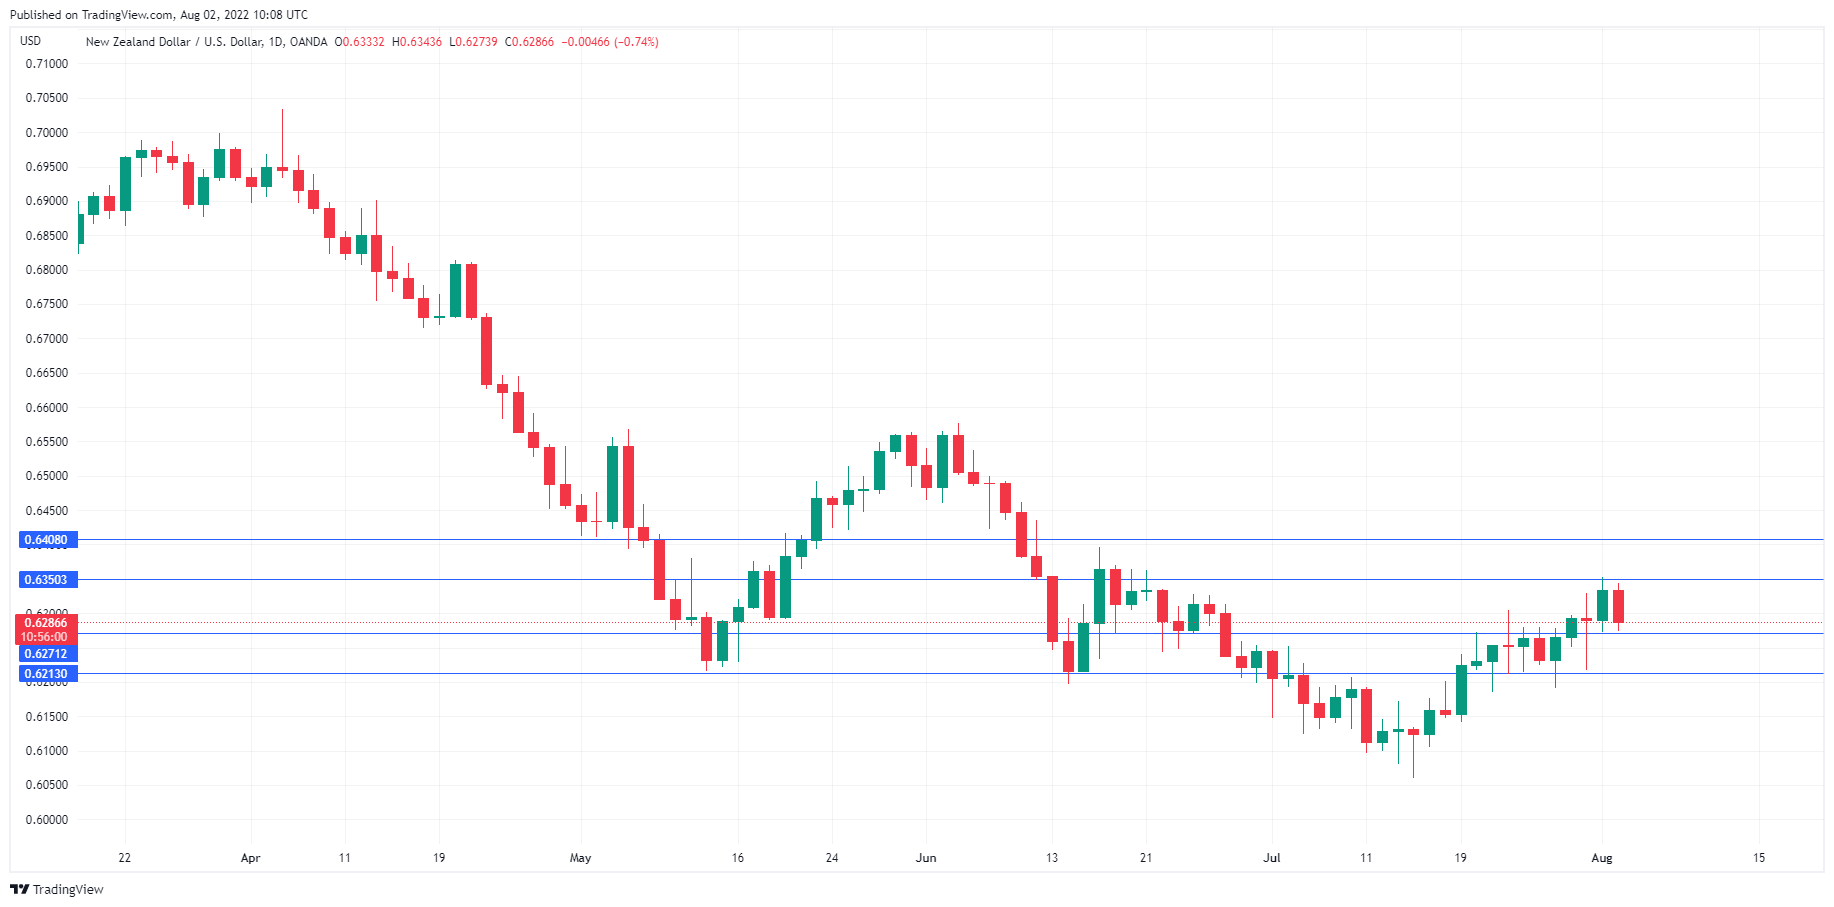
The New Zealand dollar has reversed directions today and recorded sharp losses. NZD/USD is trading at 0.6285, down 0.75% on the day. Risk appetite has fallen, with US Speaker of the House Nancy Pelosi’s controversial trip to Taiwan sending risk appetite lower. The safe-haven Japanese yen has extended its gains, while risk-related currencies like the Australian and New Zealand dollars are seeing red today.
New Zealand releases the employment report for Q2 on Wednesday. The labour market has been solid but unspectacular – in each of the last two quarters, Employment Change climbed by a negligible 0.1%, while the unemployment rate remained steady at 3.2%. Employment Change is expected to rise to 0.4% and the unemployment rate is forecast to tick lower to 3.1%. With the markets expecting only a slight change in the second quarter, I don’t expect the New Zealand dollar to react unless the forecasts are wide off the mark.
RBNZ eyes Inflation Expectations
The Reserve Bank of New Zealand continues to grapple with soaring inflation, which rose to 7.3% in Q2, up from 6.9% in Q1. The central bank has raised rates to 2.50%, but with inflation well above the inflation target of around 2%, rates will have to keep rising in order to reel in inflation. The RBNZ is also concerned about inflation expectations, which if left unchecked will strengthen inflation and exacerbate the Bank’s efforts to curb inflation. Inflation Expectations accelerated for eight straight quarters and hit 3.29% in Q1, up from 3.27% and a 31-year high. We’ll get a look at Inflation Expectations for Q2 next week, and if the current trend continues and the reading accelerates, it will put further pressure on the RBNZ to respond with a large rate hike at the August 17th meeting.
NZD/USD Technical
- NZD/USD is putting strong pressure on support at 0.6271. Below, there is support at 0.6213
- There is resistance at 0.6350 and 0.6408
EURJPY Retreats Sharply, Eyeing 200-day SMA
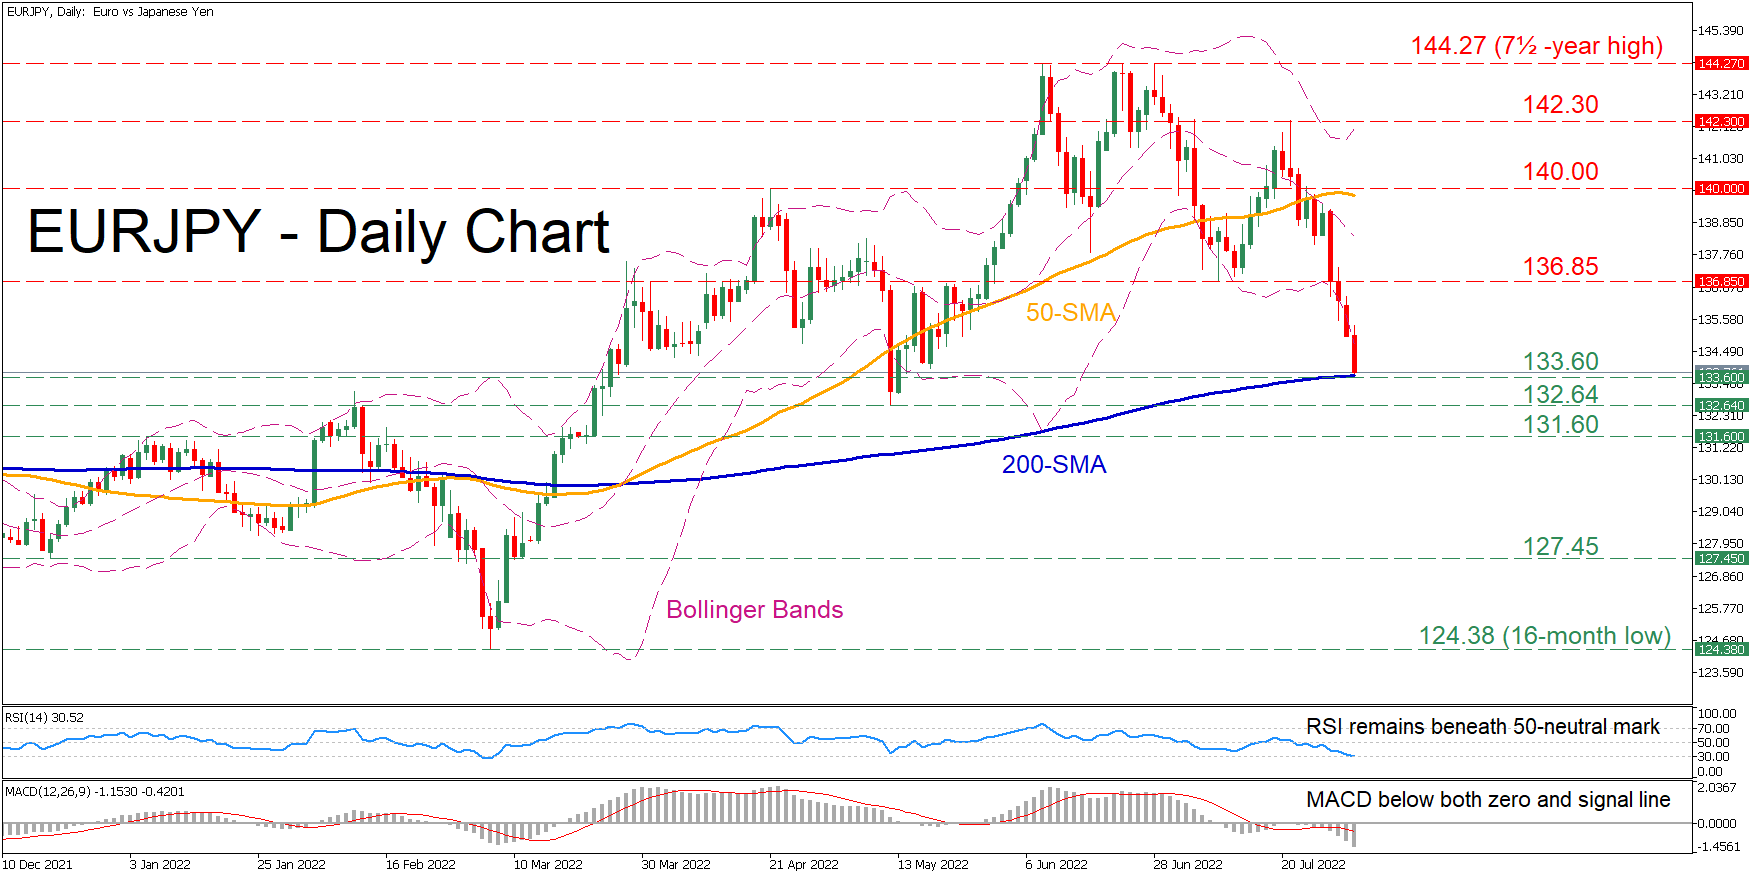
EURJPY has been experiencing a decline in the last few daily sessions after its latest advance paused at the 142.30 region. Moreover, the price is currently trading below its lower Bollinger band and is battling with the crucial 200-day simple moving average (SMA), a violation of which could accelerate the downfall.
The short-term oscillators suggest that negative momentum is strengthening. Specifically, the MACD histogram is losing ground beneath both zero and its red signal line, while the RSI is approaching the 30-oversold area.
Should selling pressure intensify further, the 200-day SMA, currently at 133.60, could act as the first line of defence. Sliding beneath that floor, the price may descend towards the May low of 132.64 before it challenges the 131.60 barrier. Failing to halt there, the bears could then aim for 127.45.
To the upside, if buyers re-emerge and reverse the drop, initial resistance could be encountered at the inside swing low of 136.85. Breaching this ceiling, the spotlight could then turn to the 140.00 psychological mark before the focus shifts to the recent reversal point of 142.30. A jump above the latter might set the stage for the 7½-year high of 144.27.
Overall, EURJPY's outlook has turned bearish both in the short and medium term, while a dive beneath the 200-day SMA could open the door for a sustained downtrend.
GBPUSD Elliott Wave Zig Zag Pattern Forecasting The Path
Hello fellow traders. In this technical blog we’re going to take a quick look at the Elliott Wave charts of GBPUSD . As our members know, GBPUSD is in process of forming Elliott Wave Zig Zag Pattern in the cycle from the 07.14 low. In the further text we are going to explain the Elliott Wave Pattern and the Forecast.
Before we take a look at the real market example, let’s explain Elliott Wave Zigzag pattern.
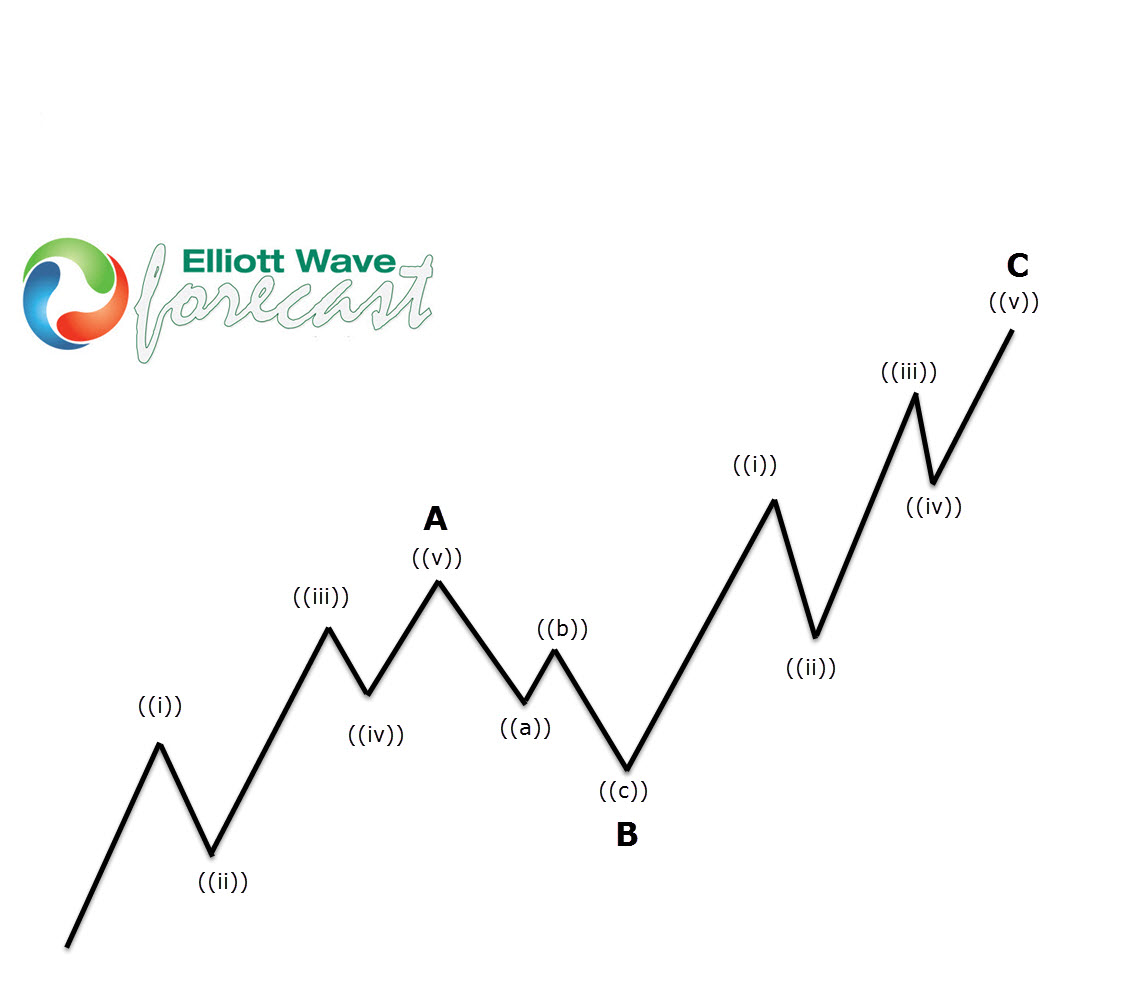
Elliott Wave Zigzag is the most popular corrective pattern in Elliott Wave theory . It’s made of 3 swings which have 5-3-5 inner structure. Inner swings are labeled as A,B,C where A =5 waves, B=3 waves and C=5 waves. That means A and C can be either impulsive waves or diagonals. (Leading Diagonal in case of wave A or Ending in case of wave C) . Waves A and C must meet all conditions of being 5 wave structure, such as: having RSI divergency between wave subdivisions, ideal Fibonacci extensions and ideal retracements.
Now, let’s see what Elliott Wave Zig Zag looks like in real market example
GBPUSD H1 Elliott Wave Analysis 07.26.2022
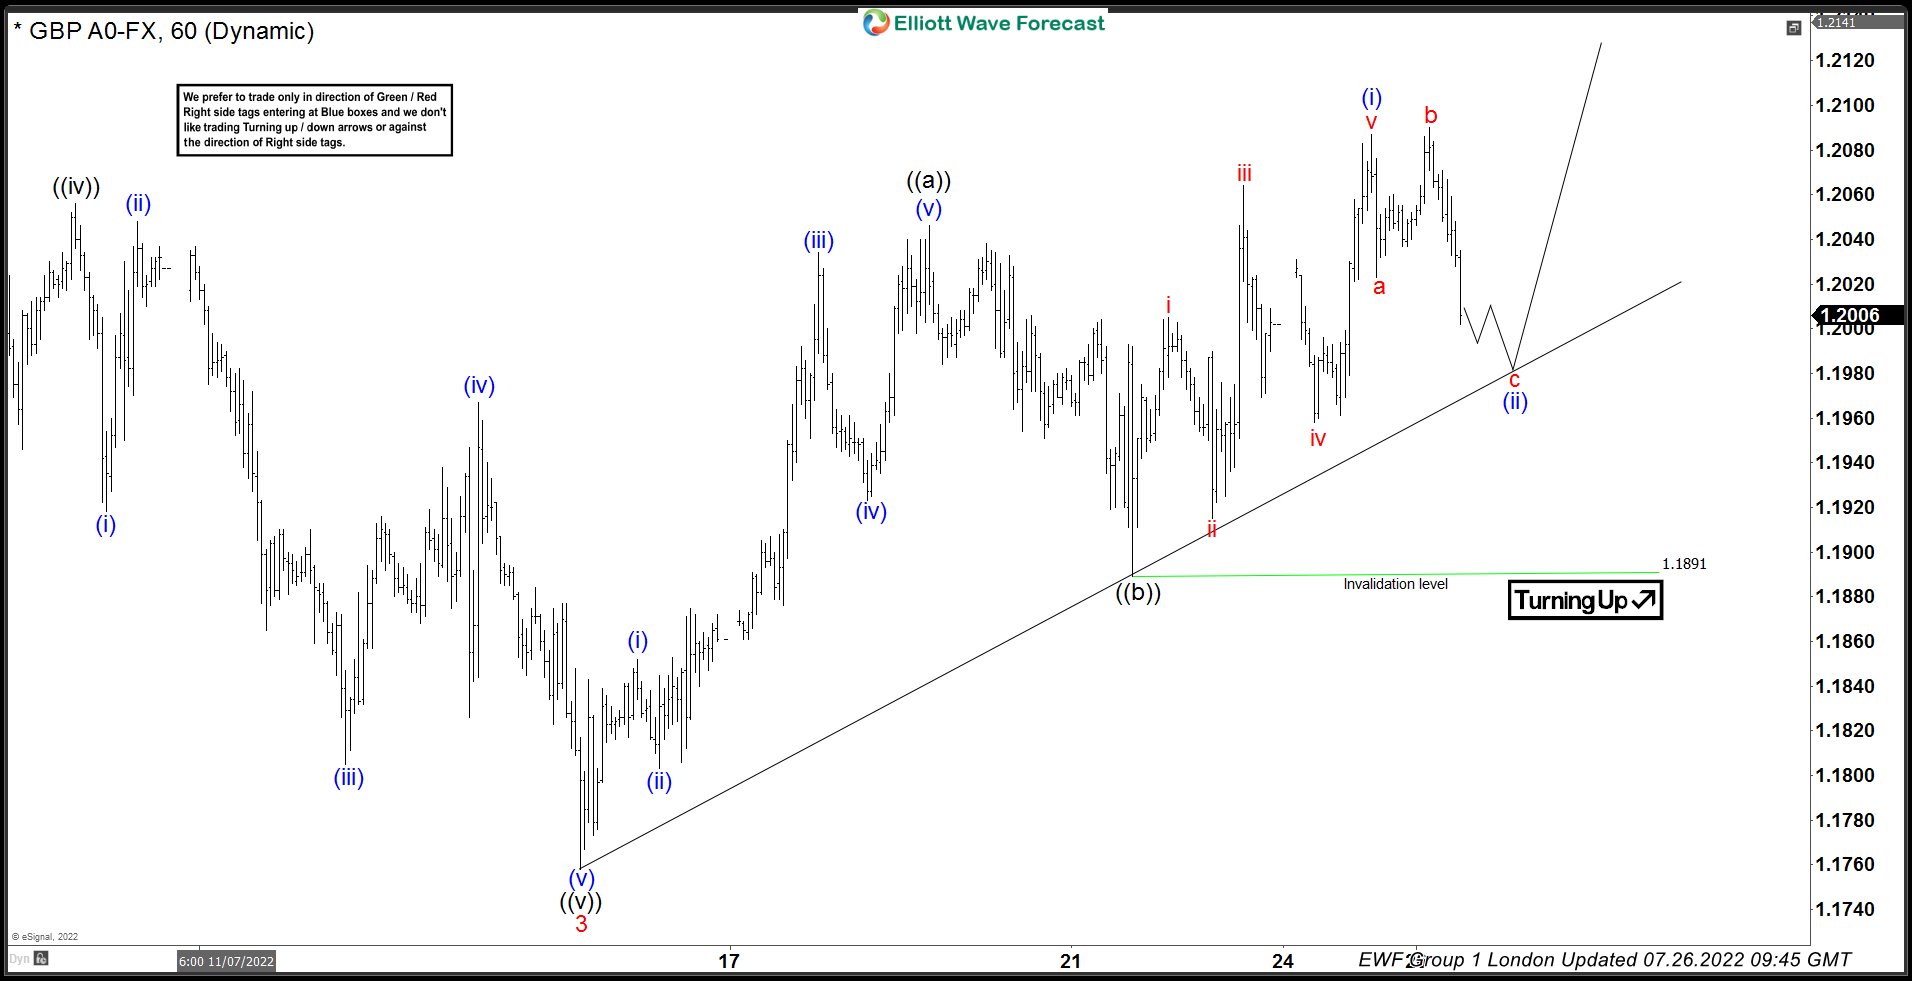
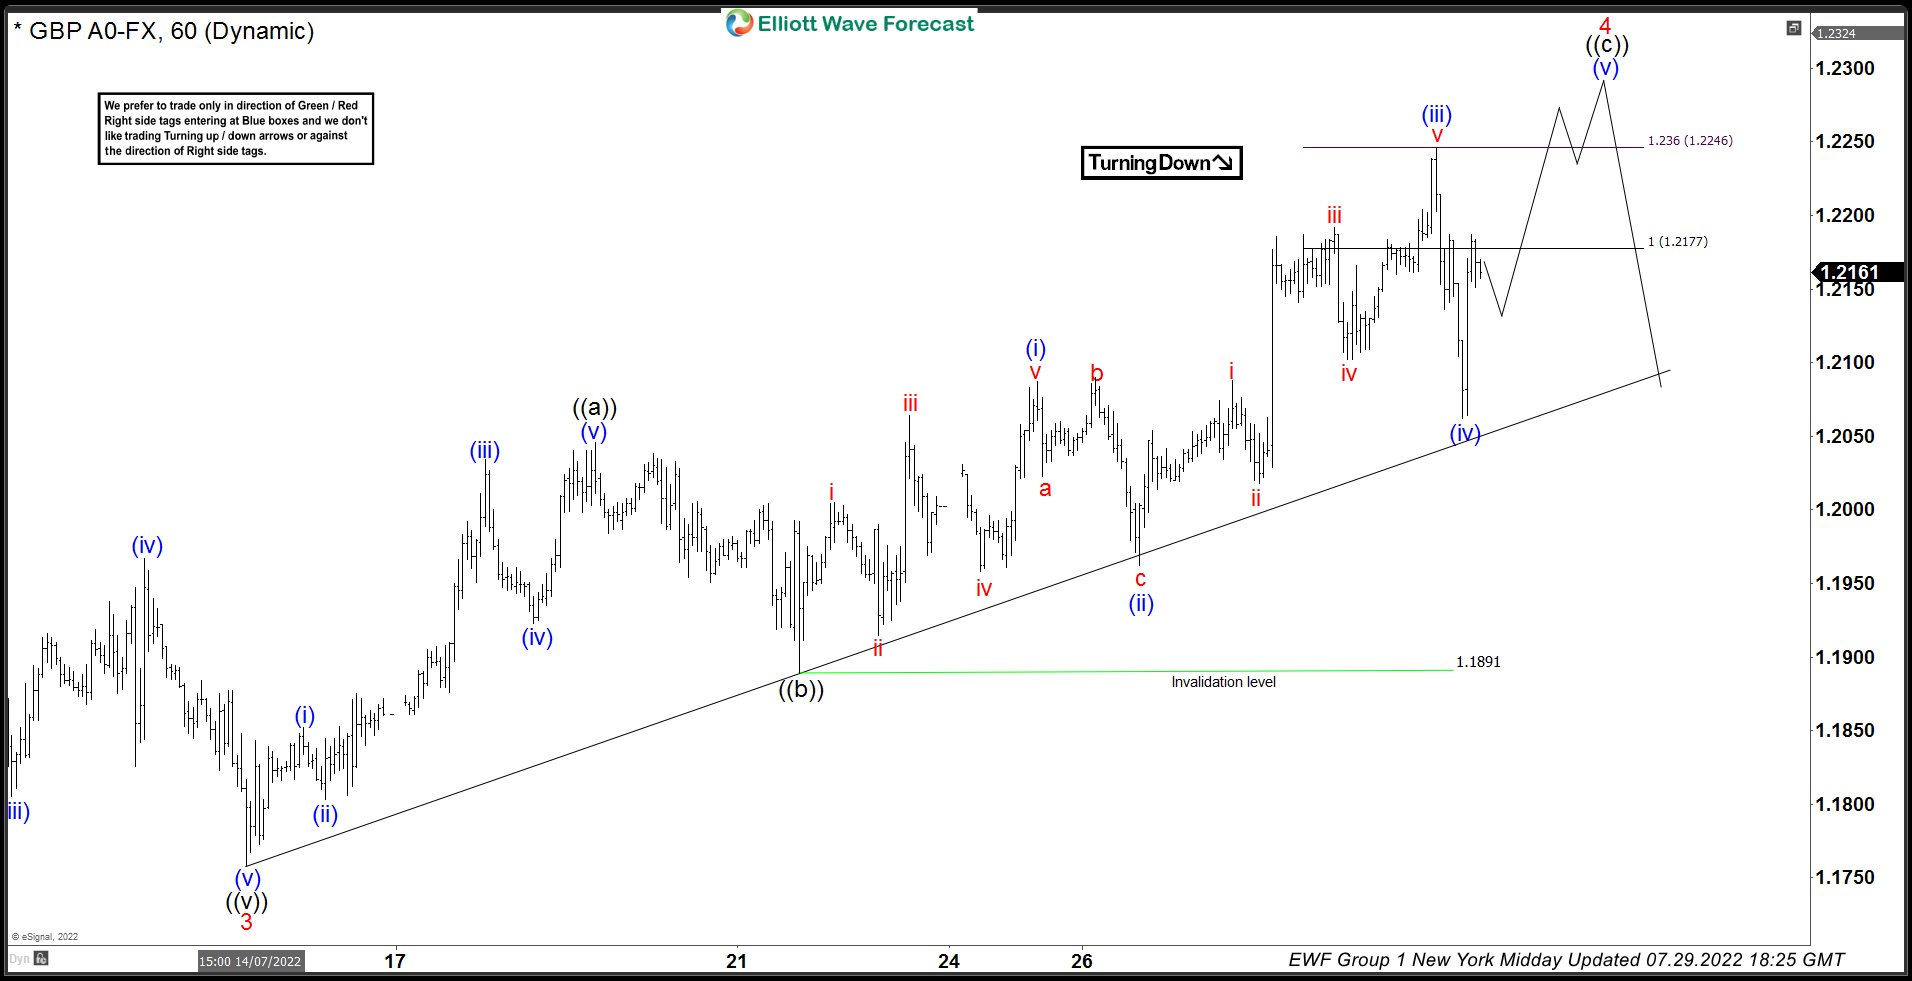
GBPSD is showing higher high sequences from the 07/14 low. We got 5 waves up in the first leg ((a)). Then the price has given us corrective pattern (7 swings) in ((b)) black, after which we got rally toward new highs again. Current price structure suggests we are in ((c)) leg up as far as 1.1891 pivot holds. Recovery looks incomplete at the moment, calling for further strength toward 1.2170-1.2344 . As the first leg of correction has 5 waves structure, we assume recovery is having form of Elliott Wave Zig Zag. Consequently we expect to see 5 waves up in the ((C)) leg as well. At the moment we are doing (ii) of ((c)) which should be ending soon around trend line.
GBPUSD H1 Elliott Wave Analysis 07.29.2022
1.189 pivot held well during the short term correction and Wave (ii) found support around the trend line as we expected. We got rally in the pair and target area is already reached at 1.2170-1.2344. However there is no any sign yet suggesting cycle is over. If we take a close look at the rally from the 1.1891 low, we can count 3 waves up so far. So, another leg up would be ideal to have 5 waves in ((c)) leg. We believe (iv) blue is done at 1.2056 and we are doing (v) blue toward 1.2289-1.236.
How Concerned Should Traders Be Over Pelosi’s Visit to Taiwan?
So far this week, safe-haven flows have been the theme of the markets. The yen strengthened substantially, and the Nikkei fell. US stocks were down on the first day of trading. Of course there are other factors affecting market sentiment, but it's evident that geopolitics is playing its hand as well. Currencies could be extra volatile over the next few days.
The first part is the move away from the risk appetite that we are already seeing. After the event is resolved, then there could be a reversal in those flows, and a rebound in the markets. So keeping track of what's going on can give some good insight into what will happen in reverse through the latter part of the week.
What's the big deal?
US House of Representatives Speaker Nancy Pelosi is expected to arrive in Taiwan later today, and meet the country's President early tomorrow. Both of those are in Taiwanese time, so that would be through the night for European and US traders. Pelosi would be the highest ranking US official to visit the disputed island in 25 years, making it a symbolically important event.
Note how that was all written in conditional tens? There is no official confirmation that the visit will happen. Pelosi herself tweeted her itinerary earlier in the week, and didn't include Taiwan. China is very unhappy with the visit, and has threatened to retaliate. Ominously, among the potential retaliatory measures are "military" options. The editor of the Global Times, which is understood to represent the Chinese government, tweeted earlier today underscored that military retaliation was likely.
But, what does that mean?
Despite press consternation, actual actions that are seen as real possibilities are generally seen as more symbolic - like the visit. China is already conducting life-fire exercises in the South China Sea. Reportedly they could fire life ammunition in the Taiwan Strait, which hasn't happened since 1995.
Concrete measures that could impact the markets are expected to be more discreet. Yesterday, China banned food imports from over 100 Taiwanese companies in a measure that's seen as retaliation for hosting the US House Speaker.
So, why all the consternation?
Taiwan Semi's shares dropped substantially ahead of the visit, as Taiwan's semiconductor industry is seen as the key issue. Chips have been in short supply, despite almost two years of trying to ramp up production around the world. Any possible interruption to semiconductor supply is likely to get investors worried.
But the bottom line is that markets don't like uncertainty, and either outcome of the visit could have important implications. If Pelosi goes through with the visit, which is the most likely scenario, retaliatory measures from China will have to be taken into account. If Pelosi doesn't go (and there is still no official confirmation), it could be seen as the US backing down in the face of Chinese pressure, and that could change the geopolitical situation.
Taiwan is the last stop on Pelosi's South East Asia trip, and she's expected back in Washington by Thursday. Then we'll know how the whole thing will turn out. In the meantime, risk aversion might be the major theme of the markets, particularly those exposed to Asia.
Bitcoin Retreats from Upper Boundary of Uptrend Channel
Bitcoin has lost 2.1% in the past 24 hours, pulling back to $22.9K. Ethereum has fallen 6.5% over the same period, to $1580. Top altcoins fell from 2.7% (XRP) to 12% (Polkadot).
Total cryptocurrency market capitalization, according to CoinMarketCap, fell 3.7% to $1.05 trillion during the day. The cryptocurrency Fear and Greed Index fell further to 31 by Tuesday morning, marking the exhaustion of last week’s bullish momentum.
Although BTCUSD formally rewrote local highs at the end of last month, as in two other episodes since early July, price gains are quickly losing momentum, and the surge is followed by selling pressure.
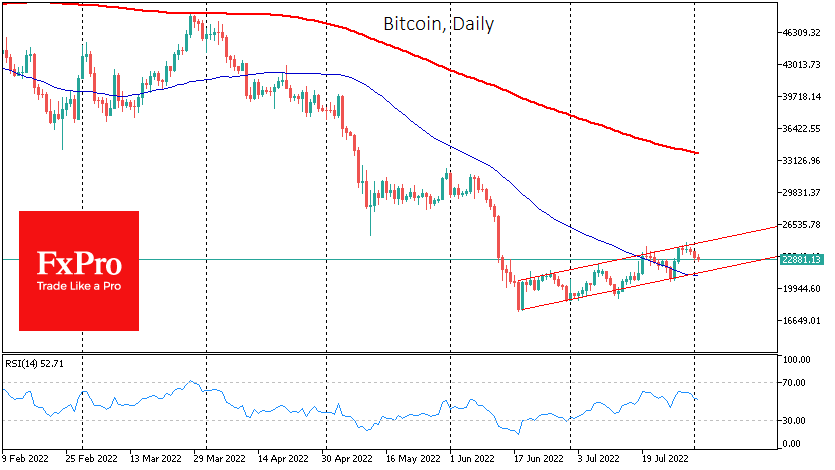
These cryptocurrency market dynamics point to a continued impressive cryptocurrency supply overhang, although Bitcoin confirmed the upward channel in July. The rate is potentially heading towards the channel’s lower boundary, coinciding with the 50-day moving average and is now near $21.7K. A decisive dip below $21.0K would be evidence of a break of this upward consolidation and could trigger a true market capitulation. For now, however, there are more signs that the market is gradually warming to buying.
According to CoinShares, net capital inflows into crypto funds last week amounted to $81 million, of which $85 million came from BTC investments. At the same time, investments in funds, which allow opening shorts on bitcoin, decreased by $2.6 million. The total monthly inflow in crypto funds for July amounted to $474 million and was the highest in the current year.
Capriole Investments noted that the past two months had seen a capitulation in many of the most critical metrics for bitcoin. This is a great time to invest in BTC and digital assets. The crypto fund expects the next 6-12 months to provide the best opportunity to enter this market for years to come.
MineXMR, the largest mining pool in the Monero ecosystem, announced its closure on 12 August. In February, Monero community members were concerned about the concentration of mining capacity in the MineXMR pool, which carried a potential 51% attack risk.