Sample Category Title
AUD/USD Daily Report
Daily Pivots: (S1) 0.6982; (P) 0.7014; (R1) 0.7060; More...
AUD/USD edged higher to 0.7045 but quickly retreated again. Intraday bias stays neutral for the moment. On the upside, break of 0.7045 will resume the rebound from 0.6680 to 0.7282 key resistance next. On the downside, however, break of 0.6858 minor support will argue that the rebound is over. Intraday bias will then be back on the downside for retesting 0.6680 low.
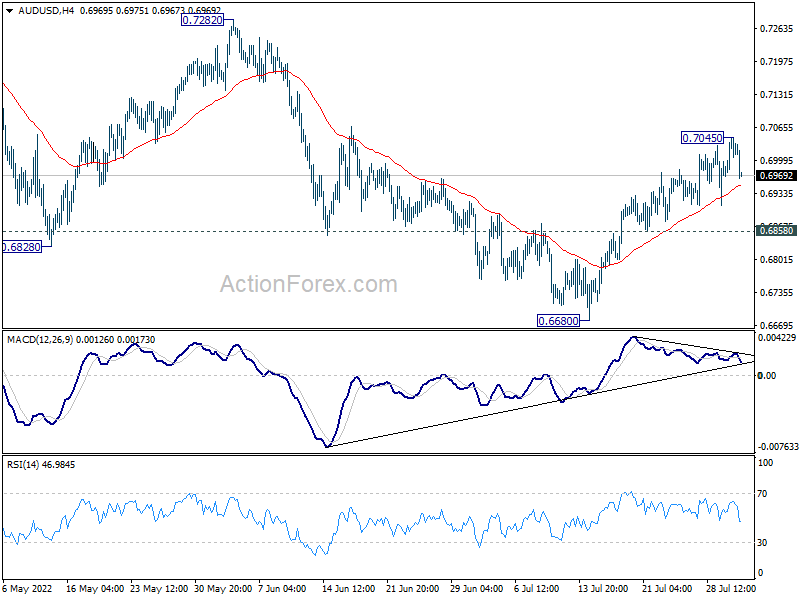
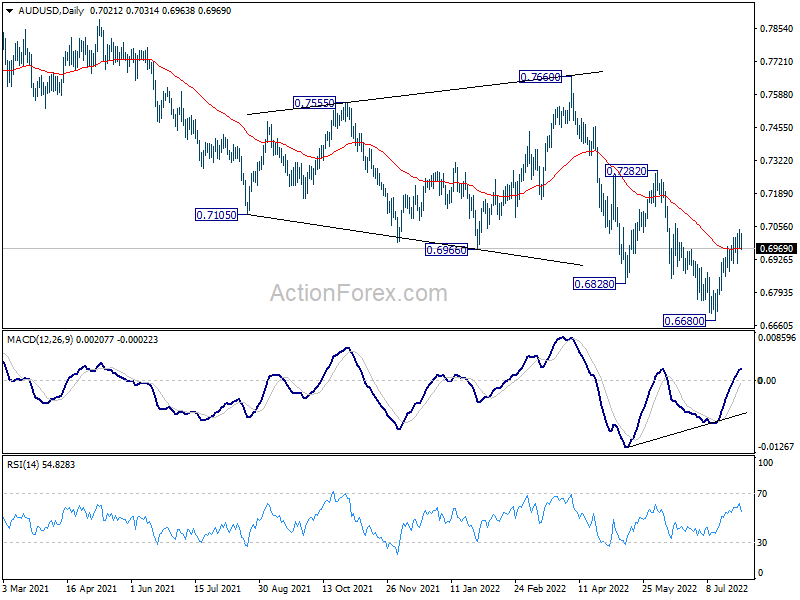
In the bigger picture, price actions from 0.8006 (2021 high) could still be a corrective pattern to rise from 0.5506 (2020 low). But current downside acceleration, as seen in weekly MACD), is raising the chance that it's a bearish impulsive move. In either case, outlook will remain bearish as long as 0.7282 resistance holds. Next target is 61.8% retracement of 0.5506 to 0.8006 at 0.6461.
Aussie Down after RBA Hike,Yen Power Continues
Yen's strong rally continues in Asian session today, with help from risk-off sentiment as well as extended decline in US benchmark yields. Stocks are trading lower while investors are cautiously waiting for any concrete action by China over US House Speaker Nancy Pelosi's visit to Taiwan. Dollar and Euro are also mildly firmer with Swiss Franc. On the other hand, Australian Dollar is leading other commodities Lower. RBA's expected rate hike and a slightly more cautious statement provides little support to the Aussie.
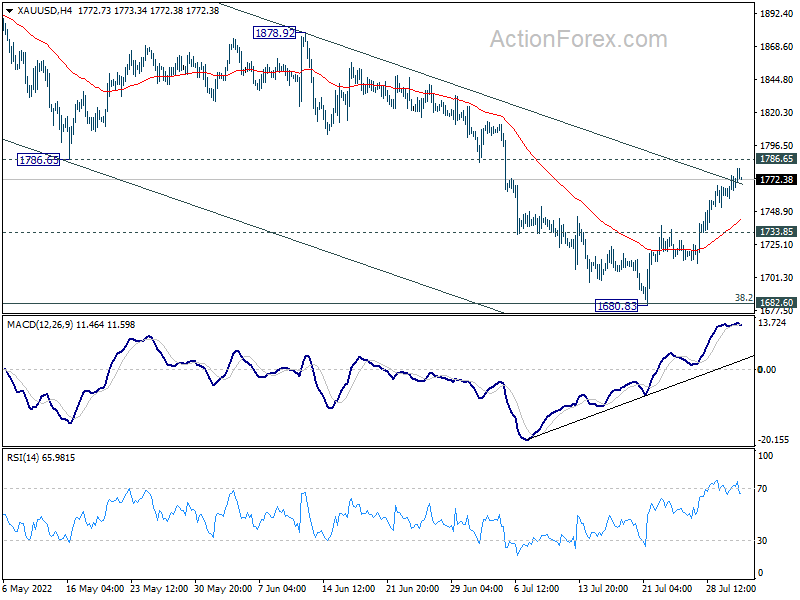
Technically, EUR/USD finally breaks out of range to resume the rebound from 0.9951, even though momentum is unconvincing. Next focus is 1.0348 support turned resistance. Firm break there will add to the case of a larger scale rally, even that could still be a corrective move. Meanwhile, Gold is also extending the rise from 1680.83, with break of channel resistance. Firm break of 1786.65 will solidify the case of near term bullish reversal. Both EUR/USD's and Gold's next move might help each other.
In Asia, at the time of writing, Nikkei is down -1.43%. Hong Kong HSI is down -2.71%. China Shanghai SSE is down -2.86%. Singapore Strait Times is down -0.16%. 10-year JGB yield is down -0.0131. Overnight, DOW dropped -0.14%. S&P 500 dropped -0.28%. NASDAQ dropped -0.18%. 10-year yield dropped -0.036 to 2.606 (and it's down further at around 2.55 in Asia).
RBA hikes 50bps, normalization to continue but not on pre-set path
RBA raises the cash rate target by 50bps to 1.85% as widely expected. It also maintains hawkish bias, and noted, "the Board expects to take further steps in the process of normalising monetary conditions over the months ahead".
Nevertheless, the normalization is "not on a pre-set path". "The size and timing of future interest rate increases will be guided by the incoming data and the Board's assessment of the outlook for inflation and the labour market," it added.
RBA forecasts inflation to hit around 7.75% over 2022, then slow to a little above 4% over 2023, and then around 3% in 2024. GDP growth is projected to be at 3.25% over 2022 and 1.75% over the next two years. Unemployment rate is forecast to climb from current 3.5% to around 4% at the end of 2024.
"Behaviour of household spending" continues to be a "key source of uncertainty". The central bank will "paying close attention to how these various factors balance out as it assesses the appropriate setting of monetary policy."
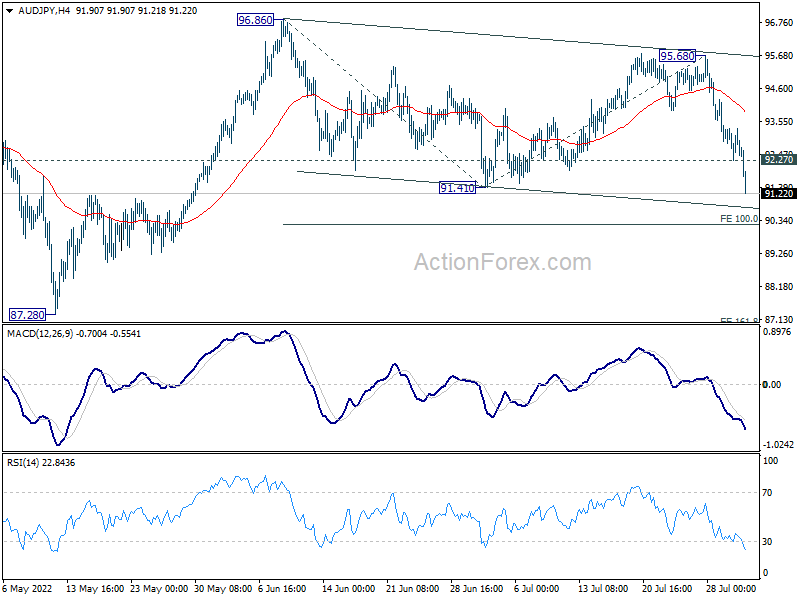
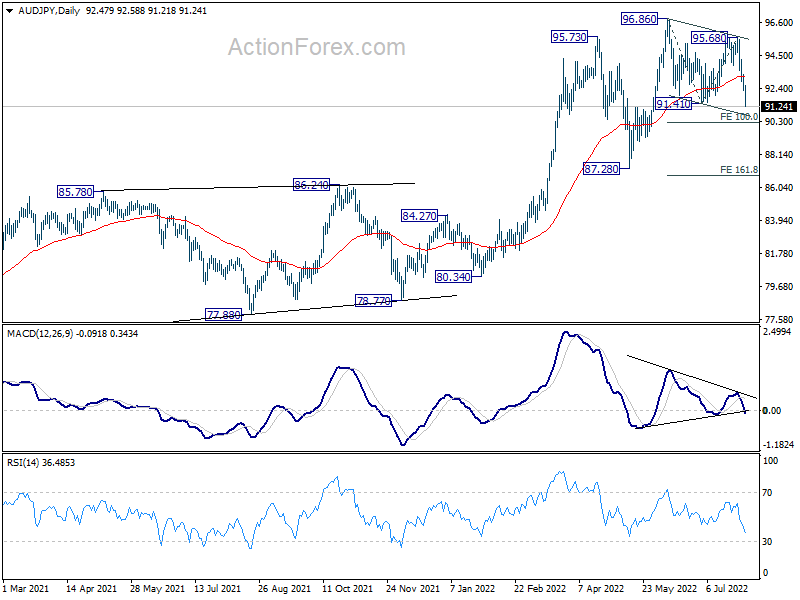
AUD/JPY falls after RBA, heading to 90 projection level
AUD/JPY's decline continues today after RBA delivered the 50bps rate hike as expected, and turned a bit cautious about the policy normalization path ahead. Of course, Yen's persistent, broad-based rally elsewhere is a factor pressing the cross.
With 91.41 support taken out, immediate focus is now on 100% projection of 96.86 to 91.41 from 95.68 at 90.23. Firm break there will be a sign of downside acceleration. That would also raise that chance that it's already in correction to the medium term up trend. In this bearish case, current decline should target next support zone between 95.78 and 87.28 next.
Nevertheless, above 92.27 minor resistance will indicate stabilization first, before taking the next move.
Looking ahead
Swiss will release SECO consumer climate and SVME PMI in european session. Canada will release PMI manufacturing later in the day.
AUD/USD Daily Report
Daily Pivots: (S1) 0.6982; (P) 0.7014; (R1) 0.7060; More...
AUD/USD edged higher to 0.7045 but quickly retreated again. Intraday bias stays neutral for the moment. On the upside, break of 0.7045 will resume the rebound from 0.6680 to 0.7282 key resistance next. On the downside, however, break of 0.6858 minor support will argue that the rebound is over. Intraday bias will then be back on the downside for retesting 0.6680 low.
In the bigger picture, price actions from 0.8006 (2021 high) could still be a corrective pattern to rise from 0.5506 (2020 low). But current downside acceleration, as seen in weekly MACD), is raising the chance that it's a bearish impulsive move. In either case, outlook will remain bearish as long as 0.7282 resistance holds. Next target is 61.8% retracement of 0.5506 to 0.8006 at 0.6461.
Economic Indicators Update
| GMT | Ccy | Events | Actual | Forecast | Previous | Revised |
|---|---|---|---|---|---|---|
| 23:50 | JPY | Monetary Base Y/Y Jul | 2.80% | 4.10% | 3.90% | |
| 01:30 | AUD | Building Permits M/M Jun | -0.70% | 4.30% | 9.90% | 11.20% |
| 04:30 | AUD | RBA Interest Rate Decision | 1.85% | 1.85% | 1.35% | |
| 07:00 | CHF | SECO Consumer Climate Q3 | -34 | -27 | ||
| 07:30 | CHF | SVME PMI Jul | 57.9 | 59.1 | ||
| 13:30 | CAD | Manufacturing PMI Jul | 54.6 |
AUD/JPY falls after RBA, heading to 90 projection level
AUD/JPY's decline continues today after RBA delivered the 50bps rate hike as expected, and turned a bit cautious about the policy normalization path ahead. Of course, Yen's persistent, broad-based rally elsewhere is a factor pressing the cross.
With 91.41 support taken out, immediate focus is now on 100% projection of 96.86 to 91.41 from 95.68 at 90.23. Firm break there will be a sign of downside acceleration. That would also raise that chance that it's already in correction to the medium term up trend. In this bearish case, current decline should target next support zone between 95.78 and 87.28 next.
Nevertheless, above 92.27 minor resistance will indicate stabilization first, before taking the next move.
RBA hikes 50bps, normalization to continue but not on pre-set path
RBA raises the cash rate target by 50bps to 1.85% as widely expected. It also maintains hawkish bias, and noted, "the Board expects to take further steps in the process of normalising monetary conditions over the months ahead".
Nevertheless, the normalization is "not on a pre-set path". "The size and timing of future interest rate increases will be guided by the incoming data and the Board's assessment of the outlook for inflation and the labour market," it added.
RBA forecasts inflation to hit around 7.75% over 2022, then slow to a little above 4% over 2023, and then around 3% in 2024. GDP growth is projected to be at 3.25% over 2022 and 1.75% over the next two years. Unemployment rate is forecast to climb from current 3.5% to around 4% at the end of 2024.
"Behaviour of household spending" continues to be a "key source of uncertainty". The central bank will "paying close attention to how these various factors balance out as it assesses the appropriate setting of monetary policy."
(RBA) Statement by Philip Lowe, Governor: Monetary Policy Decision
At its meeting today, the Board decided to increase the cash rate target by 50 basis points to 1.85 per cent. It also increased the interest rate on Exchange Settlement balances by 50 basis points to 1.75 per cent.
The Board places a high priority on the return of inflation to the 2–3 per cent range over time, while keeping the economy on an even keel. The path to achieve this balance is a narrow one and clouded in uncertainty, not least because of global developments. The outlook for global economic growth has been downgraded due to pressures on real incomes from higher inflation, the tightening of monetary policy in most countries, Russia's invasion of Ukraine and the COVID containment measures in China.
Inflation in Australia is the highest it has been since the early 1990s. In headline terms, inflation was 6.1 per cent over the year to the June quarter; in underlying terms it was 4.9 per cent. Global factors explain much of the increase in inflation, but domestic factors are also playing a role. There are widespread upward pressures on prices from strong demand, a tight labour market and capacity constraints in some sectors of the economy. The floods this year are also affecting some prices.
Inflation is expected to peak later this year and then decline back towards the 2–3 per cent range. The expected moderation in inflation reflects the ongoing resolution of global supply-side problems, the stabilisation of commodity prices and the impact of rising interest rates. Medium-term inflation expectations remain well anchored, and it is important that this remains the case. The Bank's central forecast is for CPI inflation to be around 7¾ per cent over 2022, a little above 4 per cent over 2023 and around 3 per cent over 2024.
The Australian economy is expected to continue to grow strongly this year, with the pace of growth then slowing. Employment is growing strongly, consumer spending has been resilient and an upswing in business investment is underway. National income is also being boosted by a rise in the terms of trade, which are at a record high. The Bank's central forecast is for GDP growth of 3¼ per cent over 2022 and 1¾ per cent in each of the following two years.
The labour market remains tighter than it has been for many years. The unemployment rate declined further in June to 3.5 per cent, the lowest rate in almost 50 years. Job vacancies and job ads are both at very high levels and a further decline in unemployment is expected over the months ahead. Beyond that, some increase in unemployment is expected as economic growth slows. The Bank's central forecast is for the unemployment rate to be around 4 per cent at the end of 2024. Our liaison program and business surveys continue to point to a lift in wages growth from the low rates of recent years as firms compete for staff in the tight labour market.
A key source of uncertainty continues to be the behaviour of household spending. Higher inflation and higher interest rates are putting pressure on household budgets. Consumer confidence has also fallen and housing prices are declining in some markets after the large increases in recent years. Working in the other direction, people are finding jobs and obtaining more hours of work. Many households have also built up large financial buffers and the saving rate remains higher than it was before the pandemic. The Board will be paying close attention to how these various factors balance out as it assesses the appropriate setting of monetary policy.
Today's increase in interest rates is a further step in the normalisation of monetary conditions in Australia. The increase in interest rates over recent months has been required to bring inflation back to target and to create a more sustainable balance of demand and supply in the Australian economy. The Board expects to take further steps in the process of normalising monetary conditions over the months ahead, but it is not on a pre-set path. The size and timing of future interest rate increases will be guided by the incoming data and the Board's assessment of the outlook for inflation and the labour market. The Board is committed to doing what is necessary to ensure that inflation in Australia returns to target over time.
Technical Outlook and Review
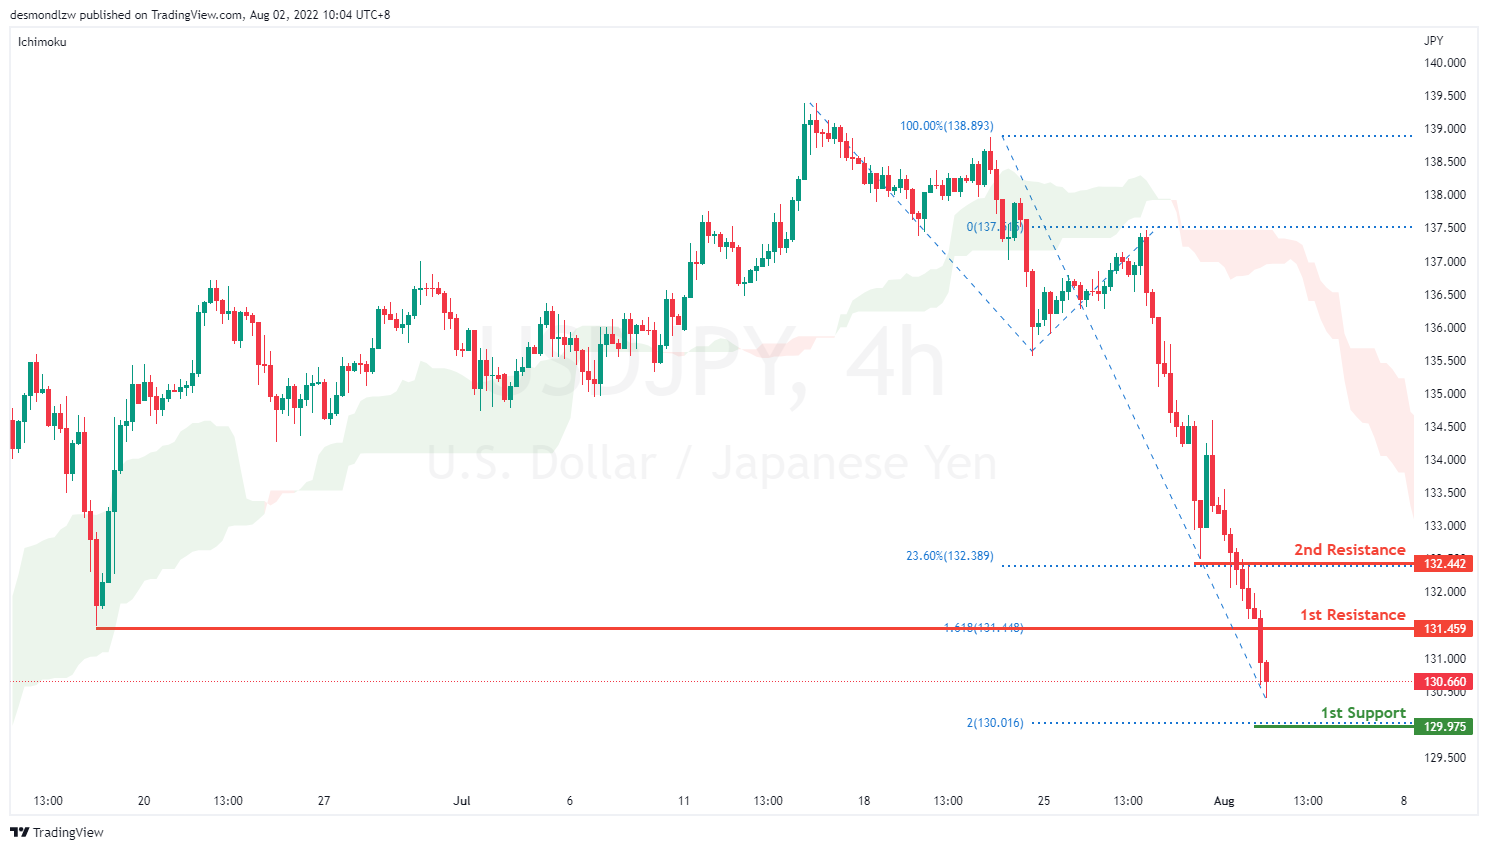
USD/JPY:
On the H4, price is bearish biased and moving strongly in an ascending trendline. It is still respecting the Ichimoku indicator, and has already broken the key support level at 131.527. The chart has confirmed a strong downside momentum and is now going to test at 129.898 which coincides with 200% Fibonacci Projection. Alternatively, price could bounce back to test at its previous swing low 131.459 which is also Fibonacci 161.8% Extension
Areas of consideration:
- H4 time frame, 1st resistance at 131.459
- H4 time frame, 1st support at 129.898
DXY:
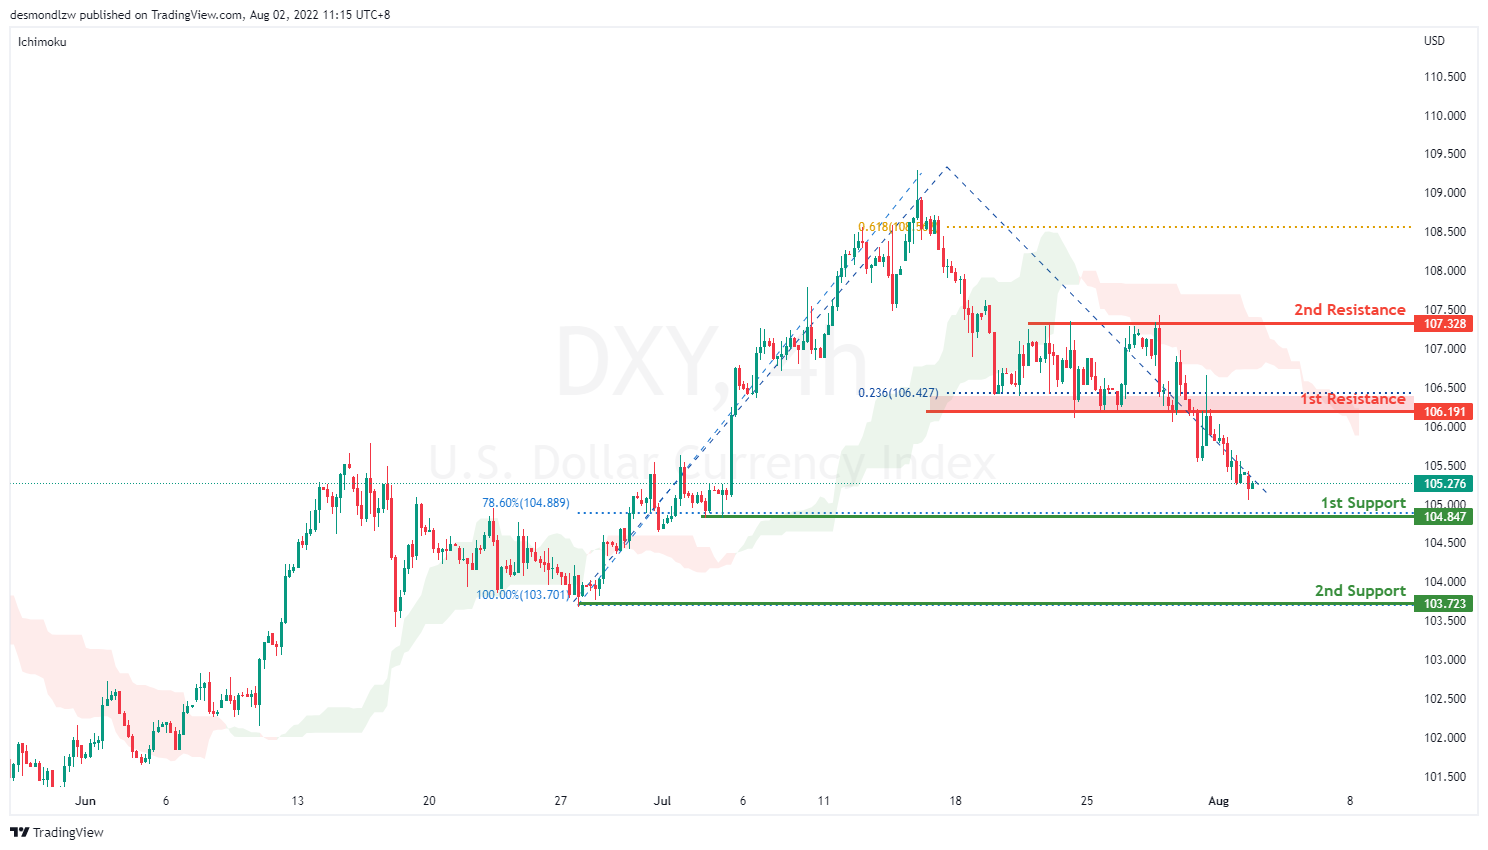
On the H4, prices have broken the ascending trend into a bearish biased trend. Prices have been strong in its bearish momentum, still respecting the Ichimoku cloud. It is moving towards the 78.6% Fibonacci retracement. If price were to break this support level, it will pull back further to test at 100% Fibonacci level, 103.651 which also coincides with the previous swing lows. Alternatively, price could bounce back and test at the first resistance, 23.6% Fibonacci extension at 106.194
Areas of consideration:
- H4 time frame, 1st resistance at 106.194
- H4 time frame, 1st support at 104.896
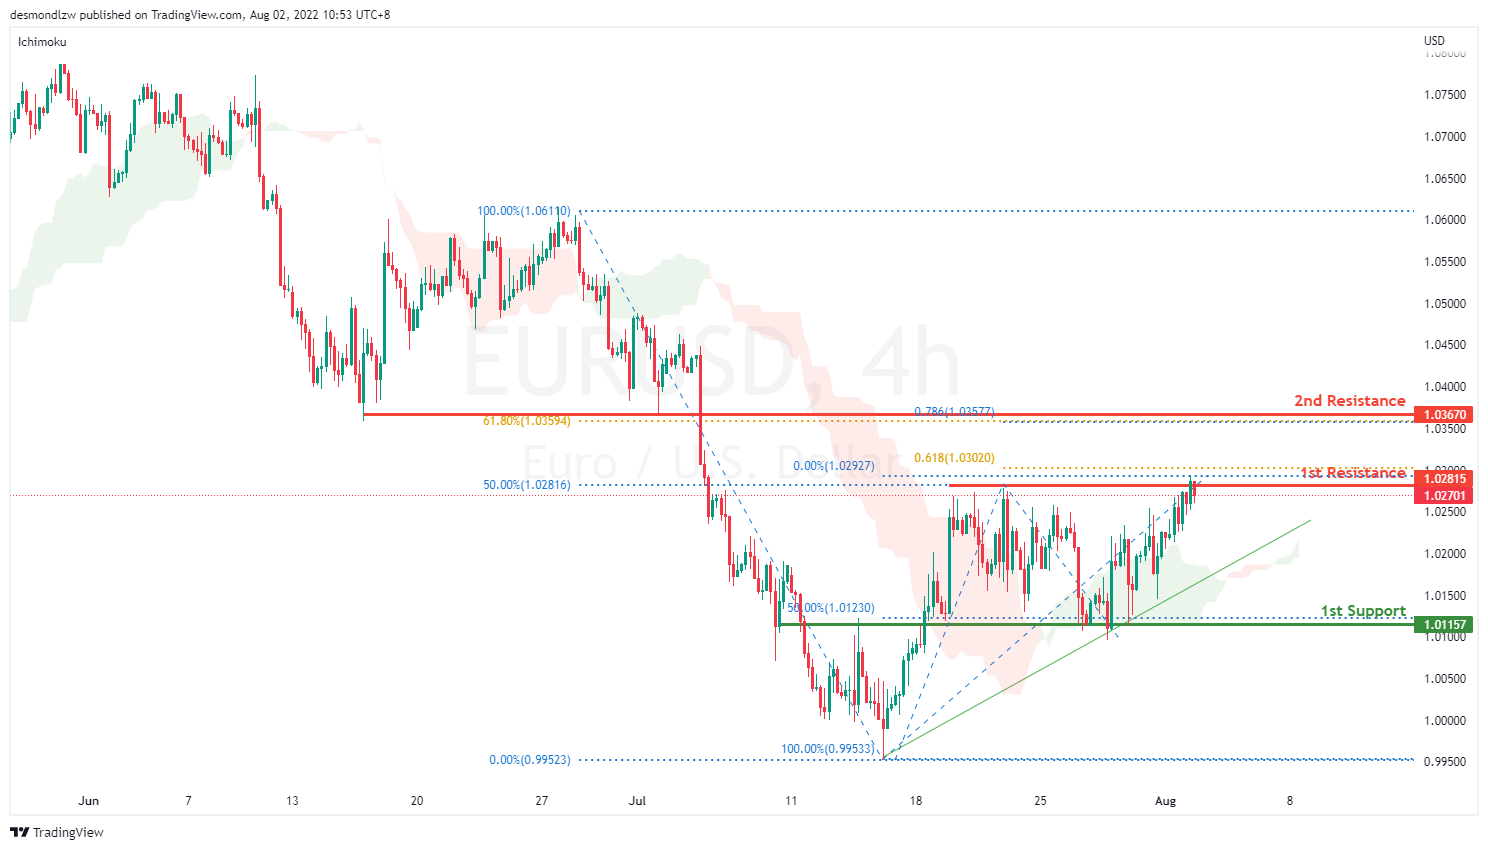
EUR/USD :
On the H4, prices have broken the bearish trend moving into a bullish biased trend. Price is now testing at the resistance 1.028, 50% Fibonacci retracement level. If price continues in the ascending trend, it will pullback further to test at the second resistance which is also a key swing low level and 61.8% Fibonacci retracement at 103.6. Alternatively, if prices bounces off the resistance level, it will test at the first support 1.011.
Areas of consideration :
- H4 1st resistance at 1.028
- H4 1st support at 1.014
GBP/USD:
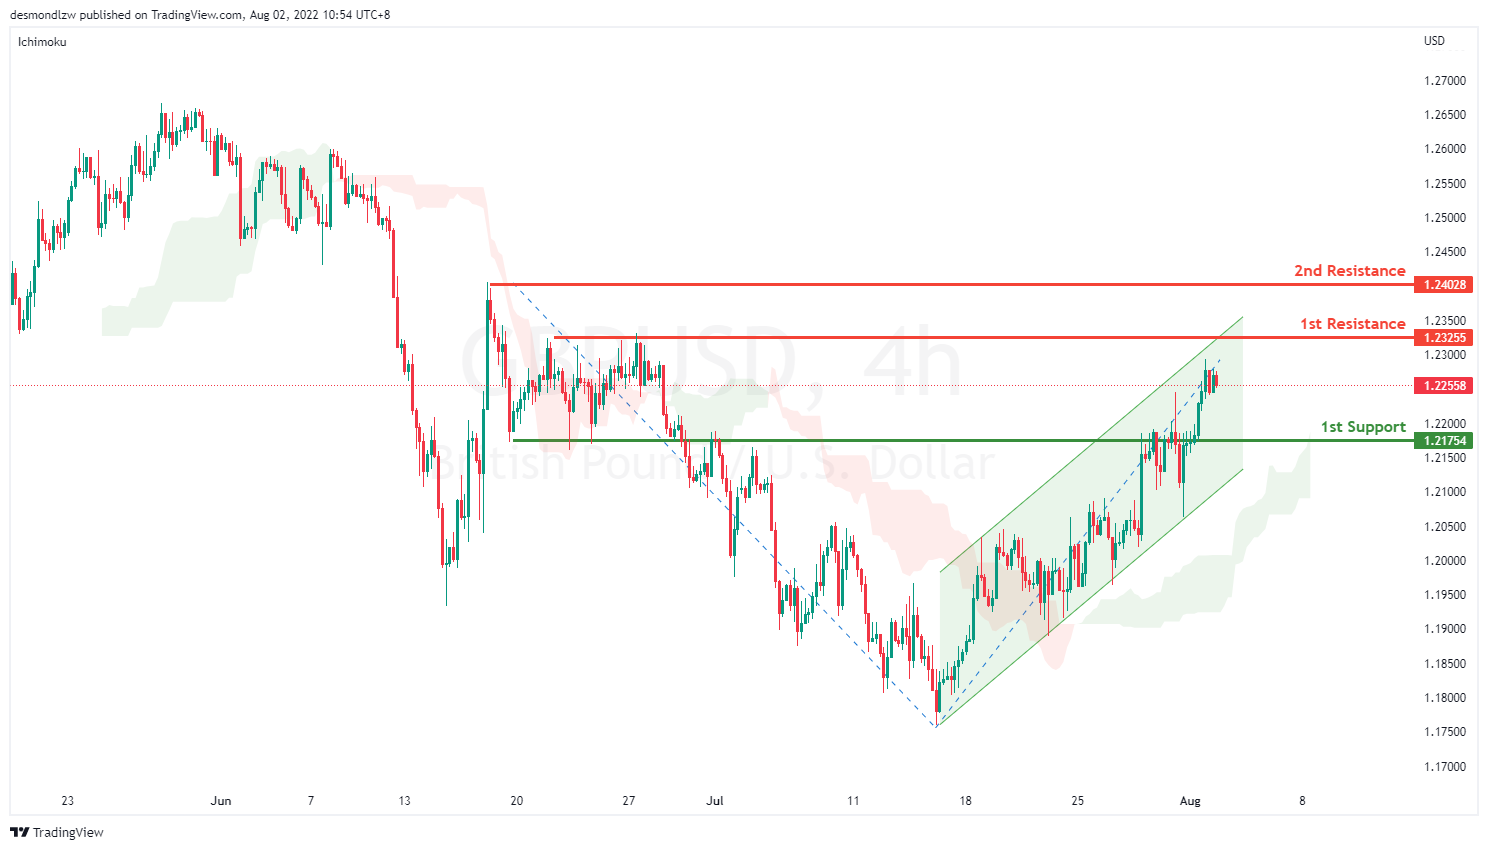
On the H4, with prices moving in an ascending channel and respecting the Ichimoku cloud, we are bullish biased. Price is now testing the first resistance at 1.232. Once prices break the first resistance and there is upside confirmation, we would expect bullish momentum to carry price to 2nd resistance at 1.240. Alternatively, price could drop to 1st support at 1.217
Areas of consideration:
- H4 1st resistance at 1.232
- H4 1st support at 1.217
USD/CHF:
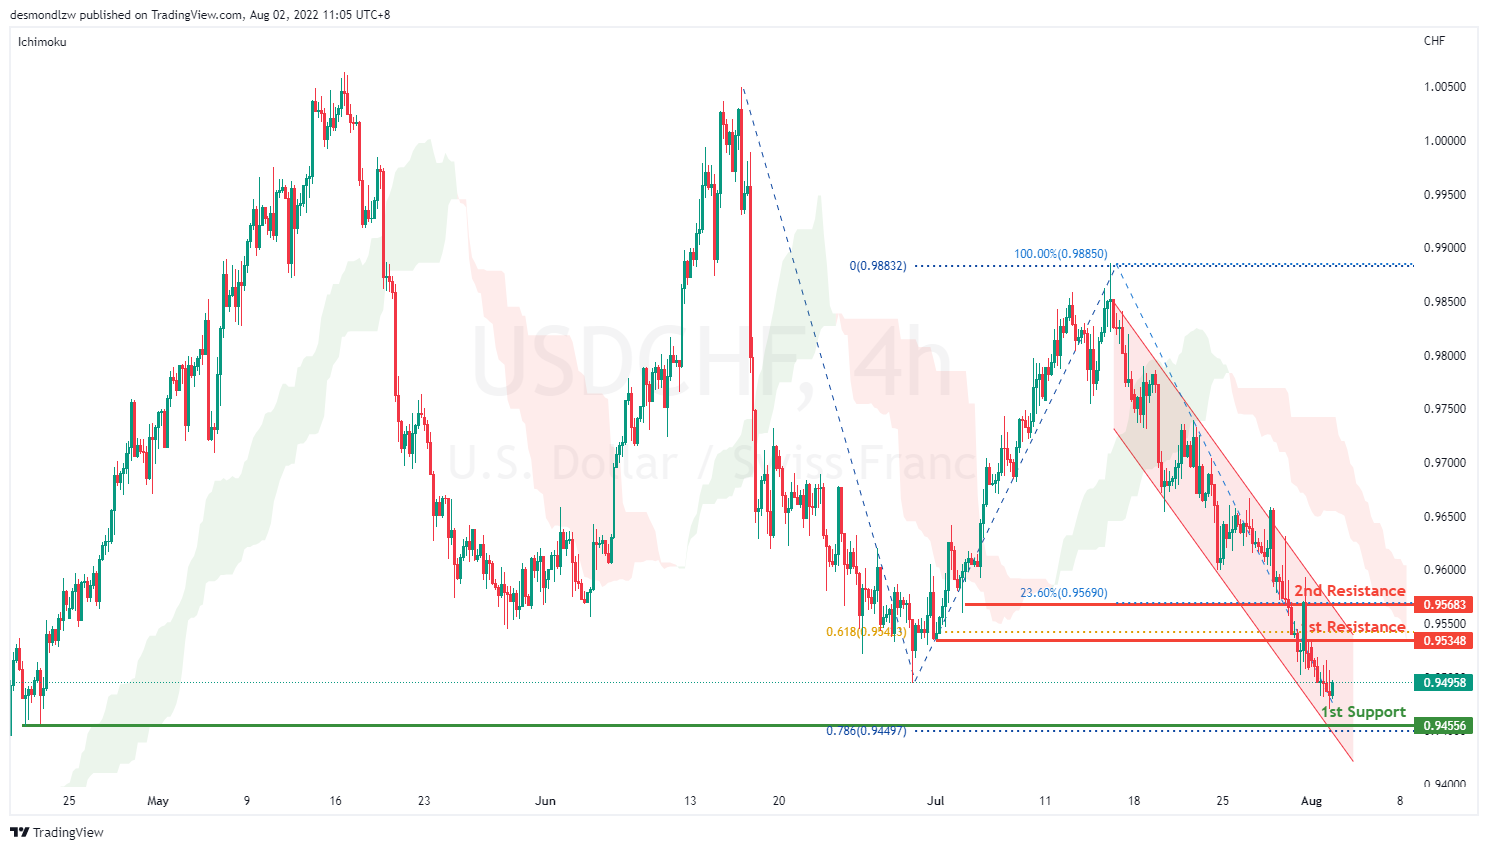
On the H4, prices are moving in a strong bearish momentum, respecting the descending channel. We have a bearish bias that price might drop to test at our first support, 0.945 which is our key support level. If price breaks reject support, it will pullback to test at 61.8% Fibonacci extension which is still respecting the channel. Price may bounce off from the 1st support to test at the first resistance at 0.953, subsequently testing the second resistance which is at the 23.6% Fibonacci retracement and overlap resistance.
Areas of consideration
- H4 1st resistance at 0.959
- H4 1st support at 0.945
XAU/USD (GOLD):
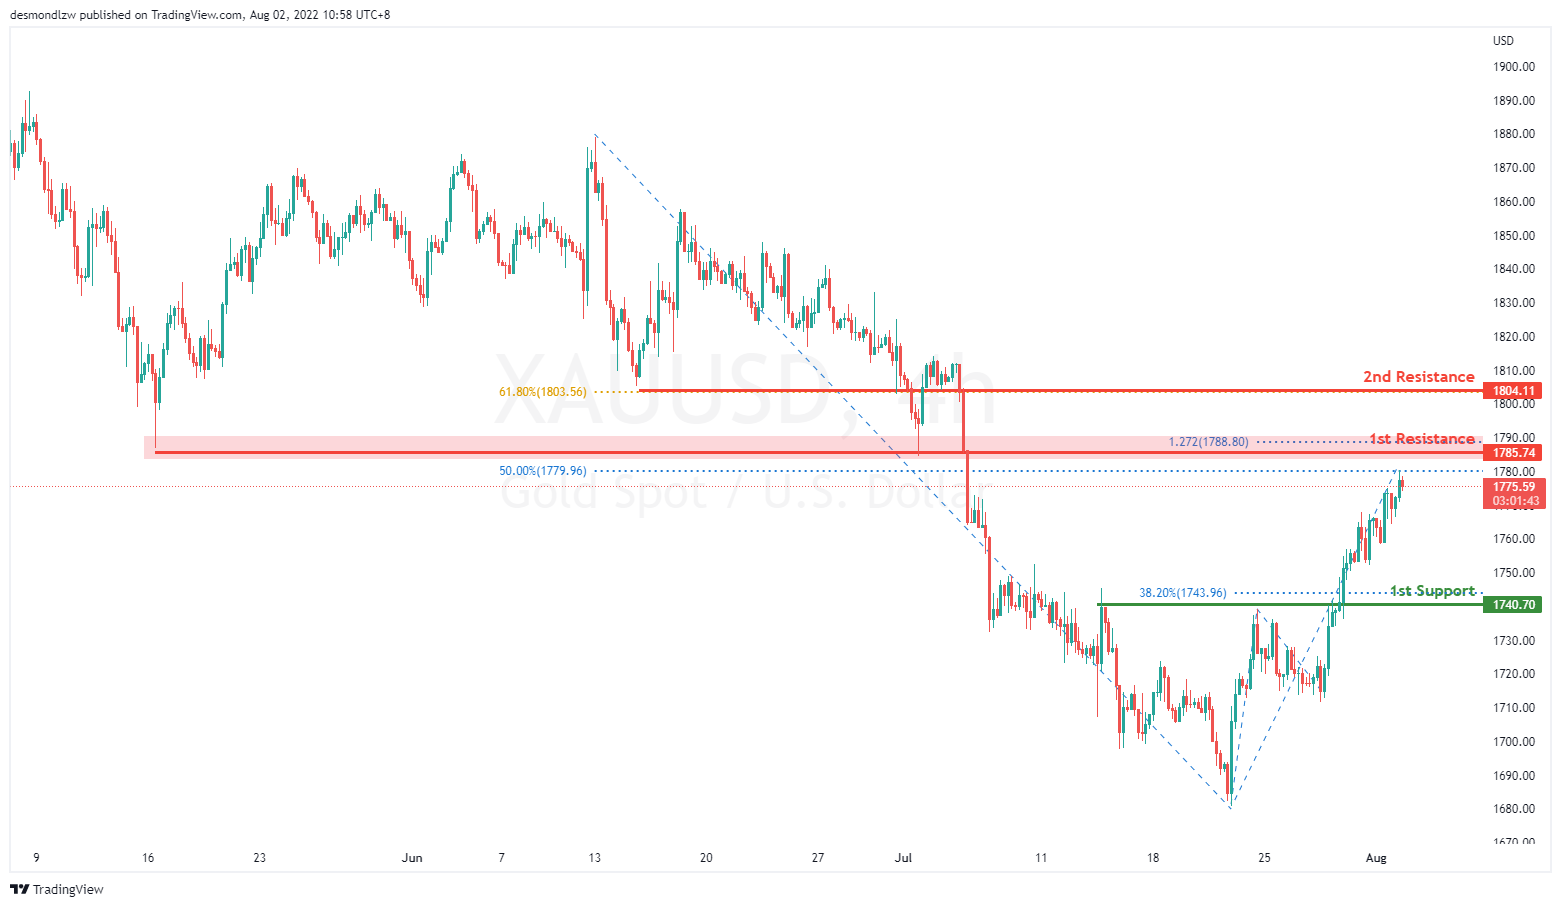
On the H4, with prices going up, we have a bullish bias that price may rise from the 1st resistance at 1785.74 where the the 127.2% projection and 50% fibonacci retracement are to 2nd resistance at 1804.11, which is in line with 61.8% fibonacci retracement. Alternatively, prices could break 1st resistance and drop to 1st support at 1740.70 where the overlap support and 38.2% fibonacci retracement are.
Areas of consideration:
- H4 time frame, 1st Resistance at 1785.74
- H4 time frame, 2nd Resistance at 1820.40
AUD/USD:
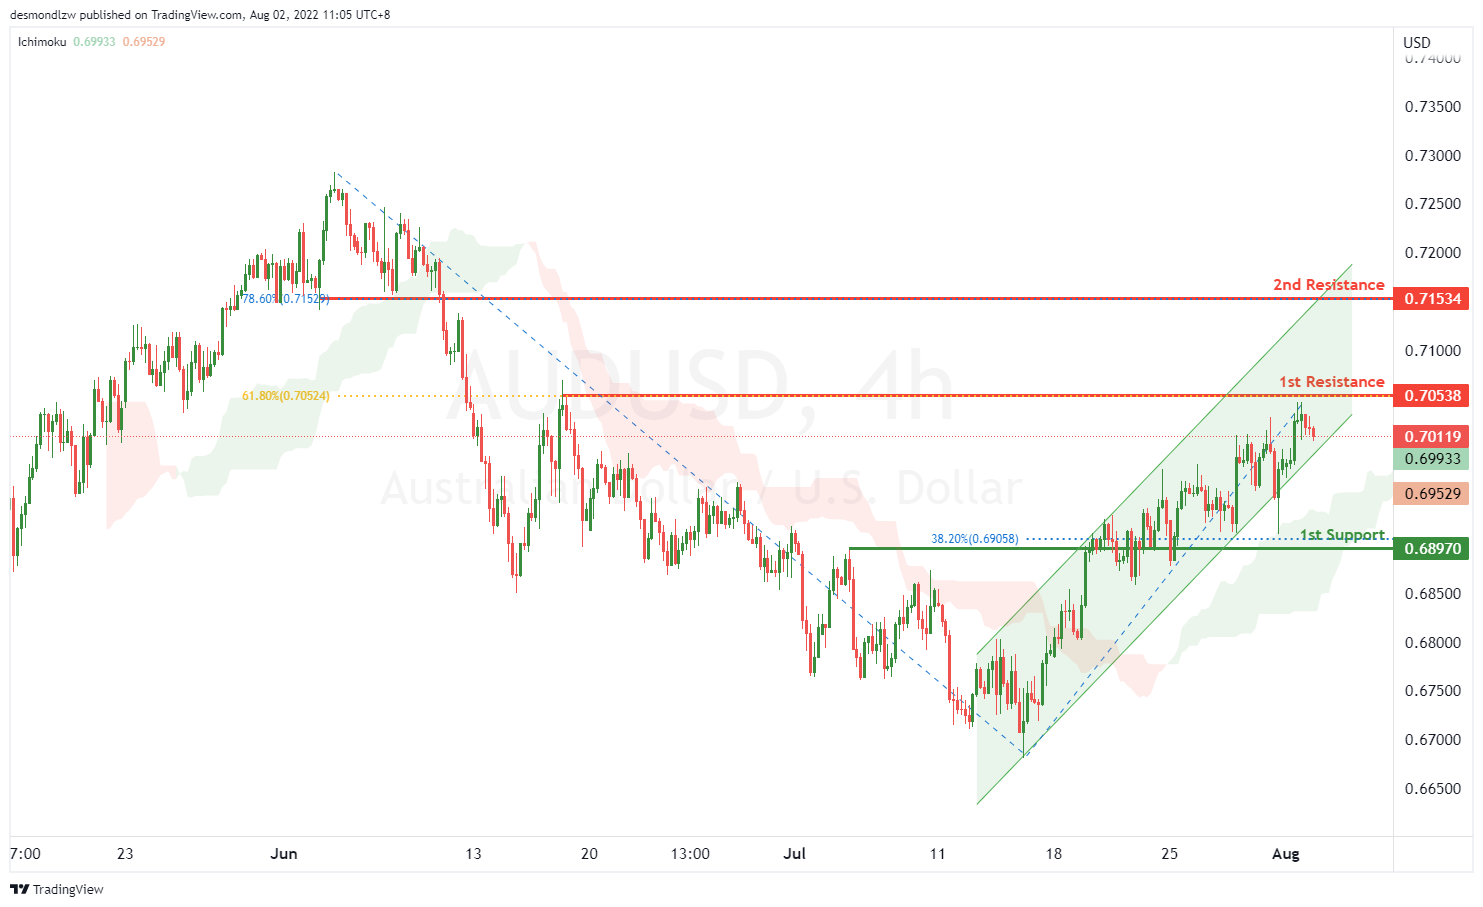
On the H4, with price moving above the ichimoku cloud and going along the ascending trend channel, we have a bullish bias that price will rise from the 1st resistance at 0.70538, where the 61.8% fibonacci retracement is to the 2nd resistance at 0.71534 at the swing high and 78.6% fibonacci retracement. Alternatively, price may reverse off 1st resistance and drop to the 1st support at 0.68970 at 38.2% fibonacci retracement.
Areas of consideration
- H4 1st resistance at 0.70538
- H4 2nd resistance at 0.71534
NZD/USD:
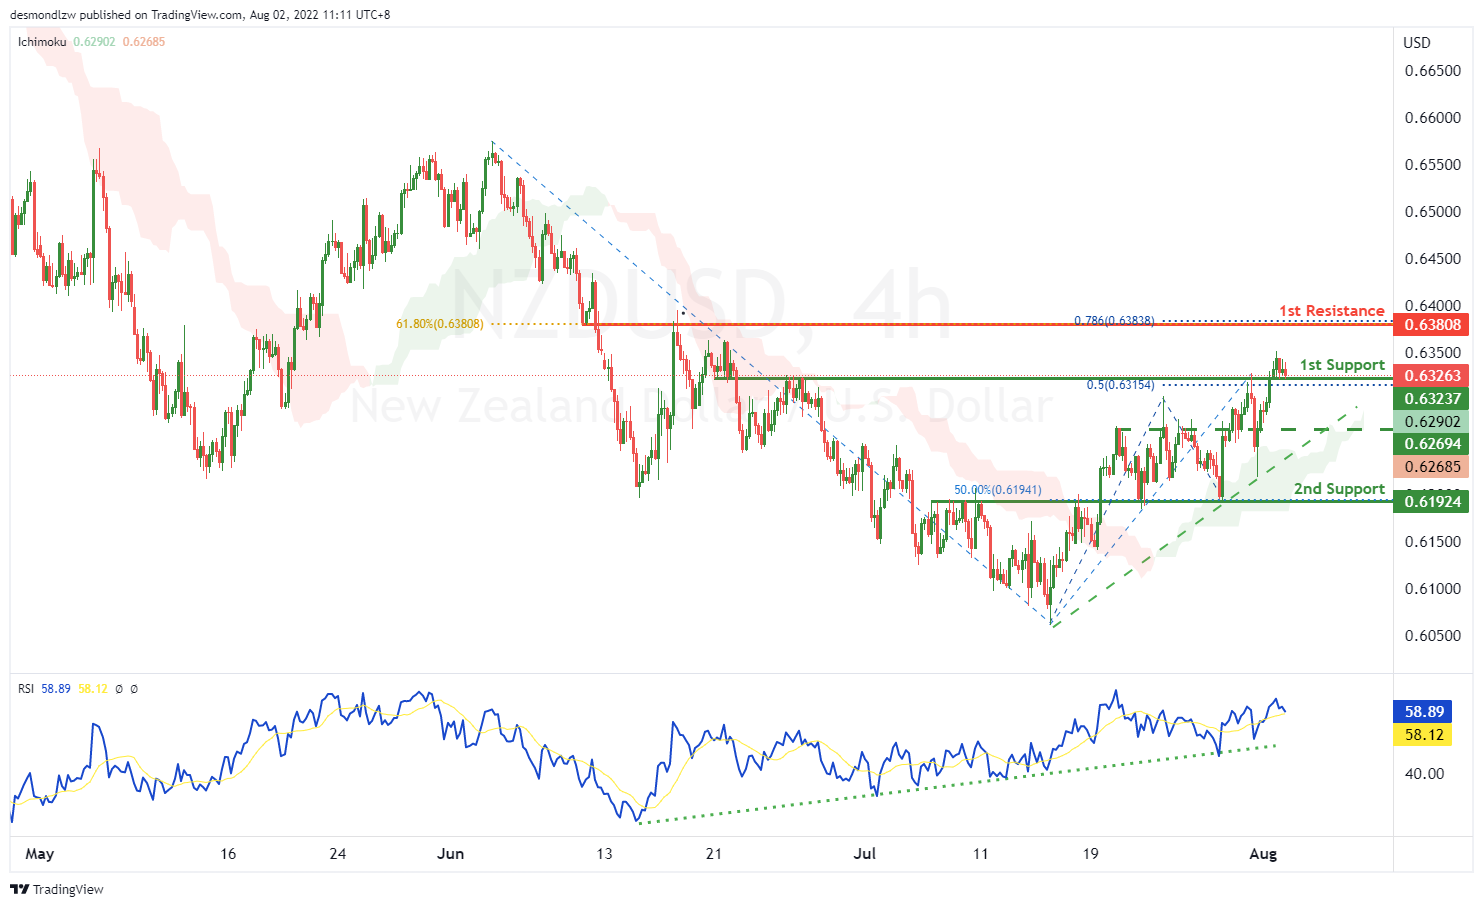
On the H4, with price going along the ascending trendline, RSI showing an ascending trendline and moving above the ichimoku cloud, we have a bullish bias that price will rise from the 1st resistance at 0.63447 where 61.8% fibonacci projection is to the 2nd resistance at 0.64648 where the 78.6% fibonacci retracement is. Alternatively, price may reverse off the 1st resistance and drop to the 1st support at 0.61924 at the multiple swing lows and 50% fibonacci retracement. Take note the price of 0.62694 could be the intermediate support, as the price is testing this area.
Areas of consideration:
- H4 time frame, 1st resistance at 0.63447
- H4 time frame, 2nd resistance at 0.64648
USD/CAD:
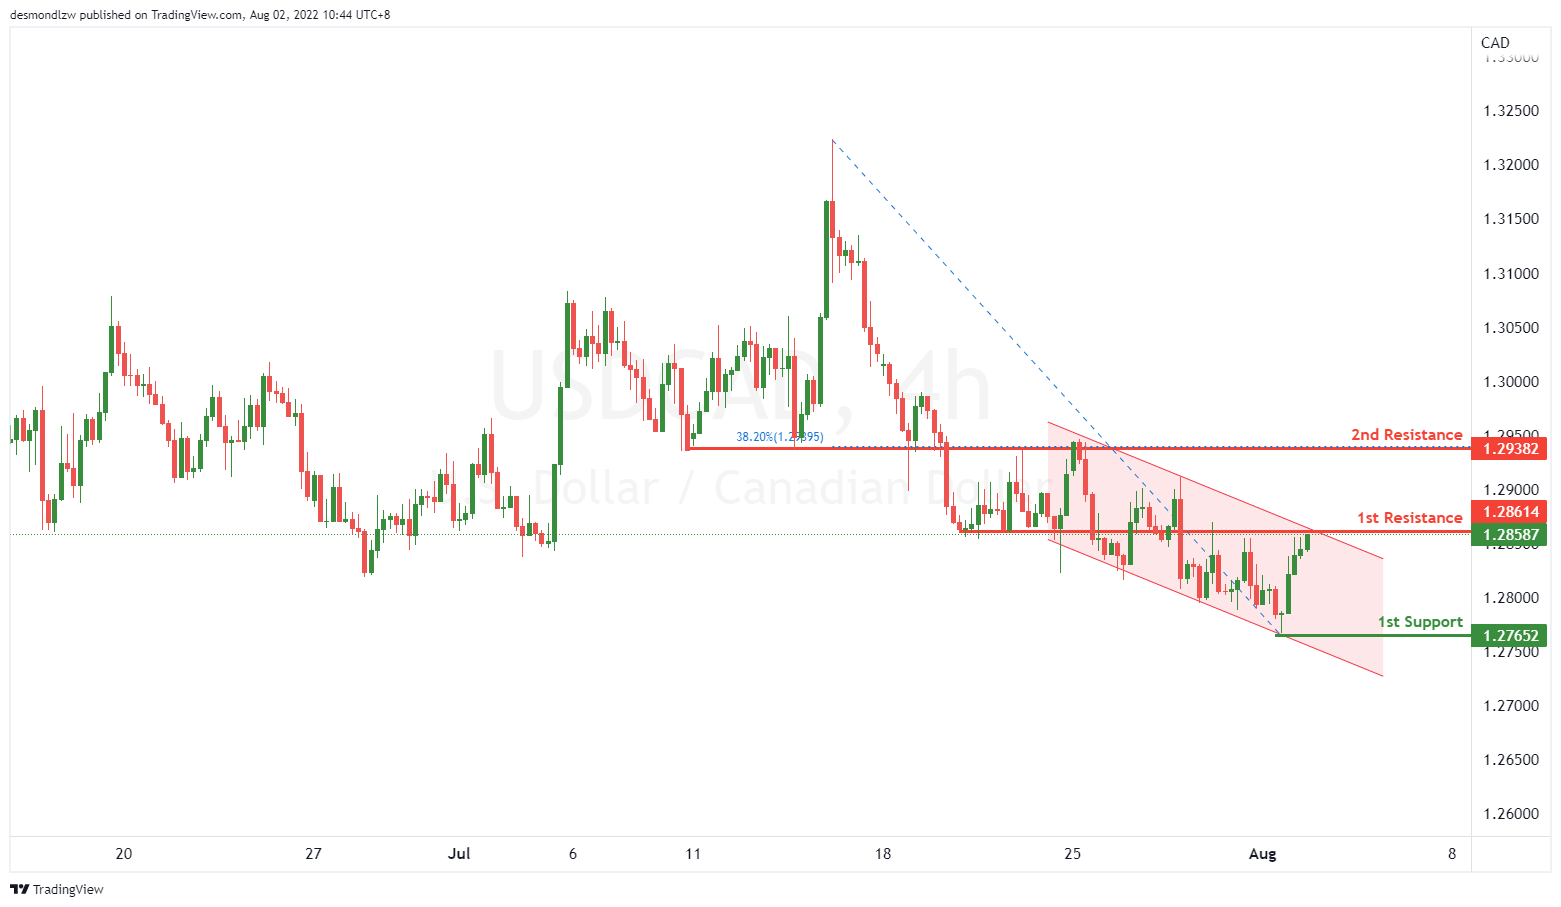
On the H4, with the price going along the descending trendline, we have a bearish bias that the price may drop from our 1st resistance at 1.28614, which is in line with swing lows to our 1st support at 1.27652, which is in line with the swing low. Alternatively, the price may rise to the 2nd resistance at 1.29382, which is in line with the overlap resistance and 38.2% fibonacci retracement.
Areas of consideration:
- H4 time frame, 1st resistance at 1.28614
- H4 time frame, 2nd resistance at 1.29382
OIL:
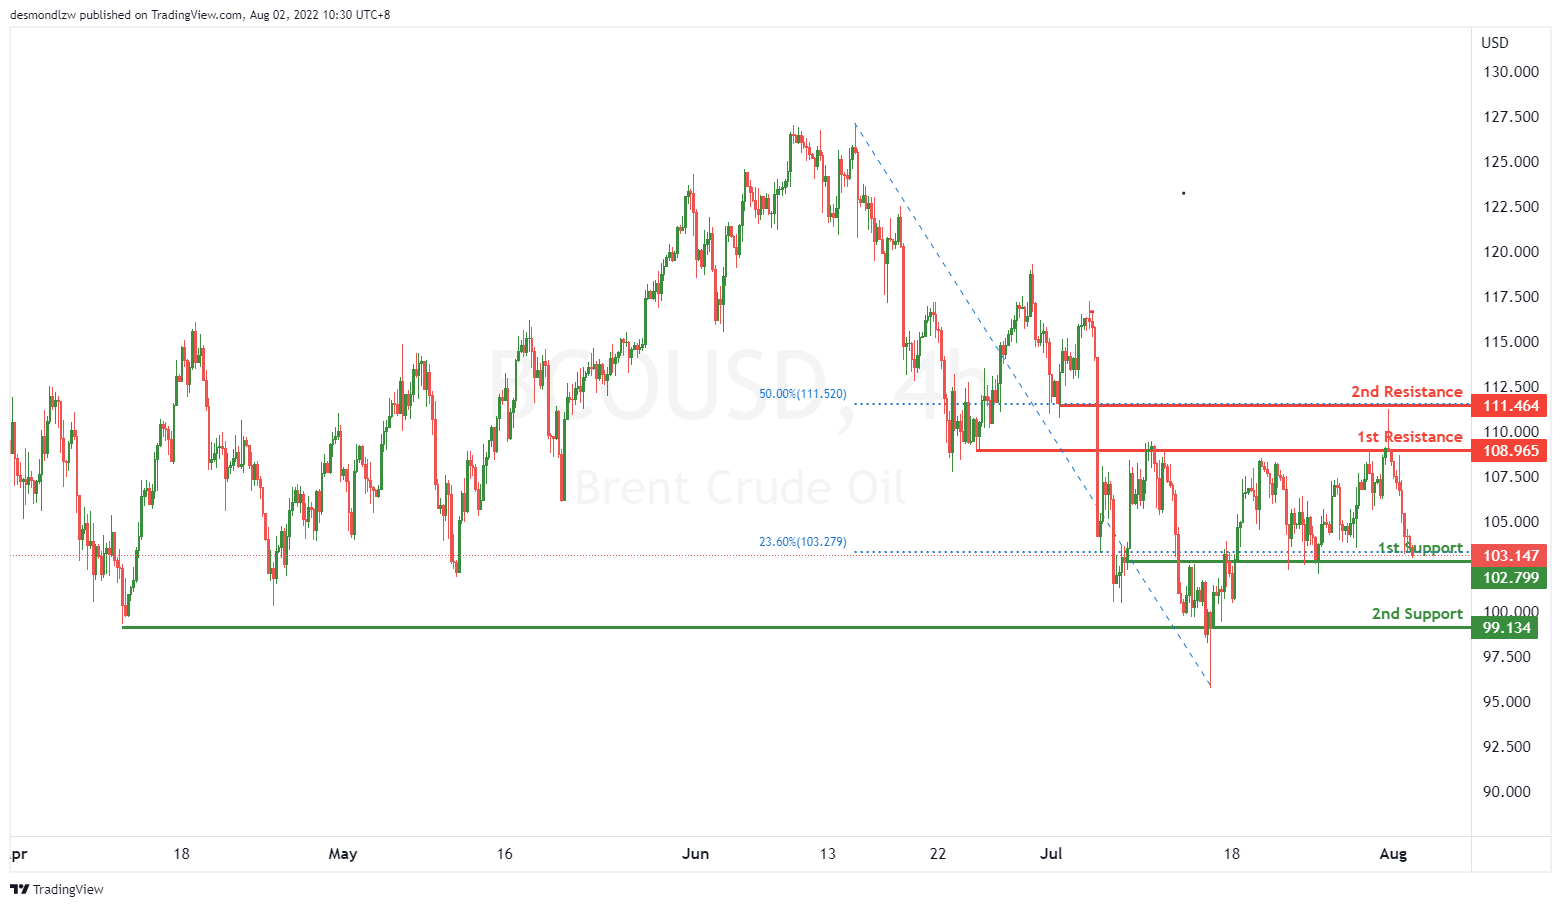
On the H4, with price moving around the 1st support and 1st resistance, we have a neutral bias that price might drop from the 1st support at 102.799, where the swing low and 23.6% fibonacci retracement are to 2nd support where the swing lows are. Otherwise, the price may rise to our 1st resistance at 108.965, where the overlap resistance is. If the price breaks the 1st resistance, it may rise to the 2nd resistance at 111.464, where the 50% fibonacci retracement is.
Areas of consideration:
- H4 time frame, 1st support of 102.799
- H4 time frame, 2nd support of 99.134
Or
- H4 time frame, 1st resistance of 108.965
- H4 time frame, 1st support of 102.799
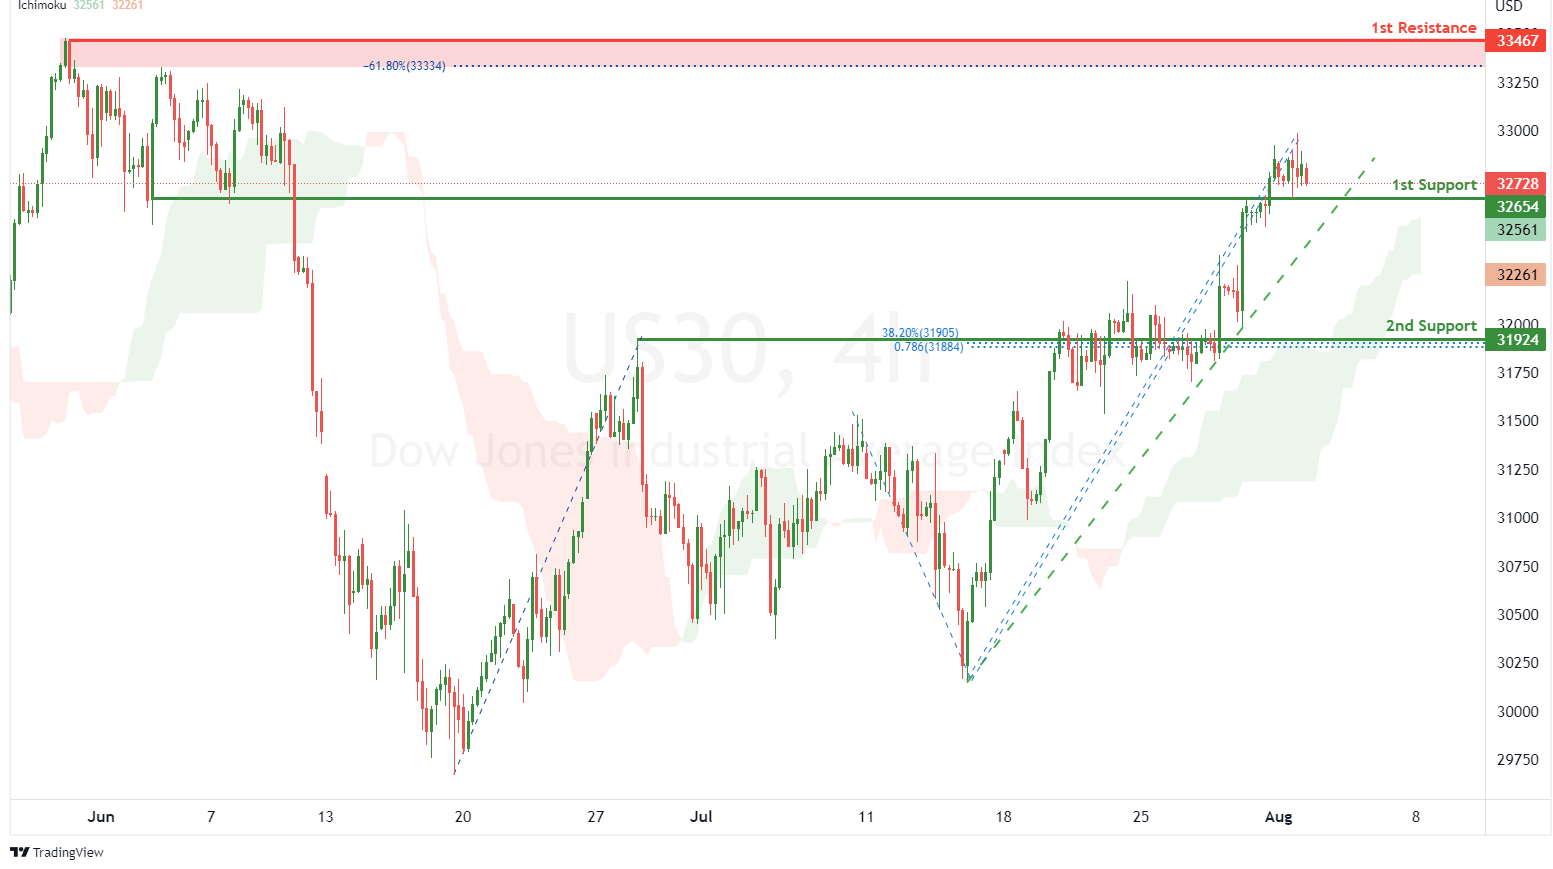
Dow Jones Industrial Average:
On the H4, with price moving along an ascending trendline and above the ichimoku indicator, we have a bullish bias that price will rise from our 1st support at 32654 where the pullback support is to the 1st resistance at 33467 where the swing high resistance and -61.8% fibonacci expansion are. Alternatively price could break 1st support structure and drop to 2nd support at 31924 where the pullback support, 38.2% fibonacci retracement and 78.6% fibonacci projection are.
Areas of consideration:
- H4 time frame, 1st resistance of 33467
- H4 time frame, 1st support at 32654
DAX:
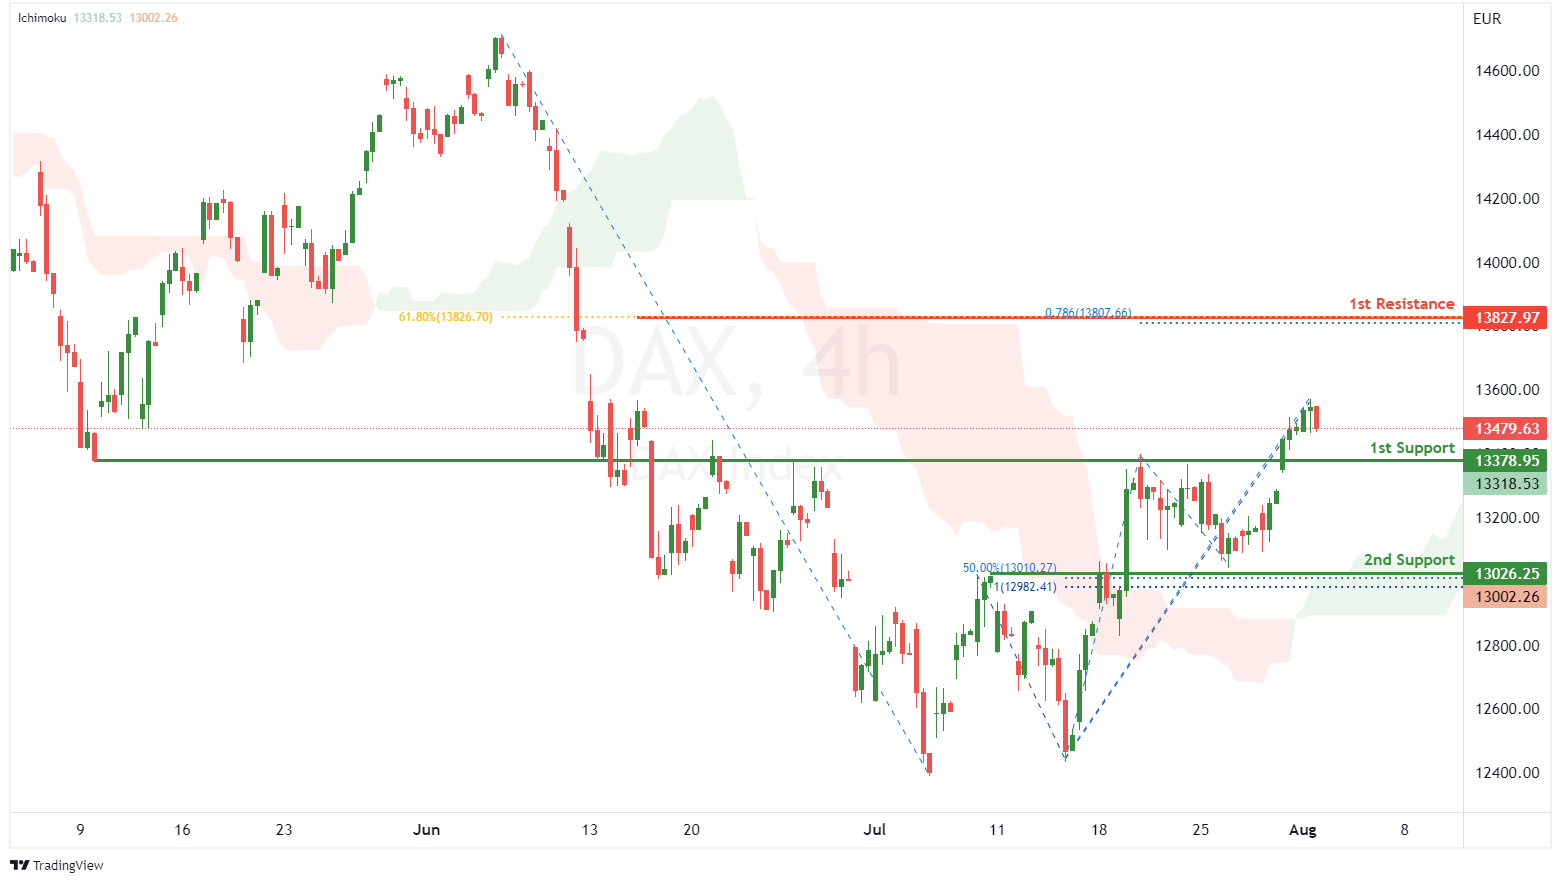
On the H4, with price moving above the ichimoku indicator, we have a bullish bias that price will rise from 1st support at 13378.95 in line with overlap support to the 1st resistance at 13827.97 where the 61.8% fibonacci retracement and 78.6% fibonacci projection are. Alternatively, price could break 1st support structure and drop to 2nd support at 13026.25 where the pullback support, 50% fibonacci retracement and 100% fibonacci projection are.
Areas of consideration:
- H4 time frame, 1st resistance of 13827.97
- H4 time frame, 1st support at 13378.95
ETHUSD:
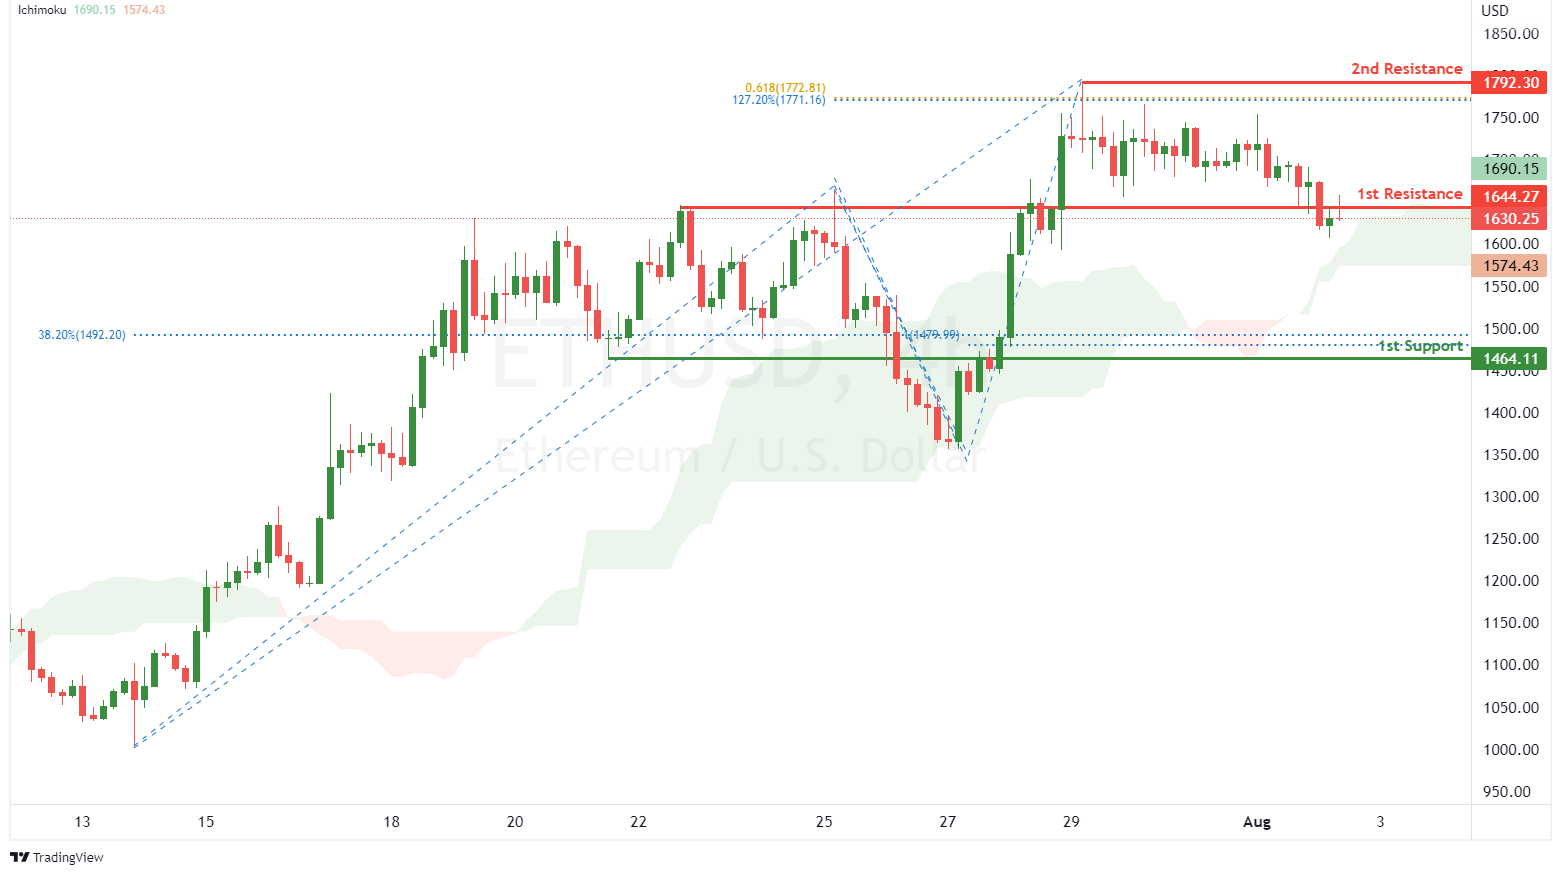
On the H4, with price moving above the ichimoku indicator, we have a bullish bias that price will rise to our 1st resistance at 1644.27 where the overlap resistance is. Once there is upside confirmation of price breaking 1st resistance structure, we would expect bullish momentum to carry price to 2nd resistance at 1792.30 where the swing high resistance, 127.2% fibonacci extension and 61.8% fibonacci projection are. Alternatively, price could drop to 1st support at 1464.11 where the pullback support, 100% fibonacci projection and 38.2% fibonacci retracement are.
Areas of consideration:
- H4 time frame, 1st resistance of 1644.27
- H4 time frame, 1st support at 1464.11
BTCUSD:
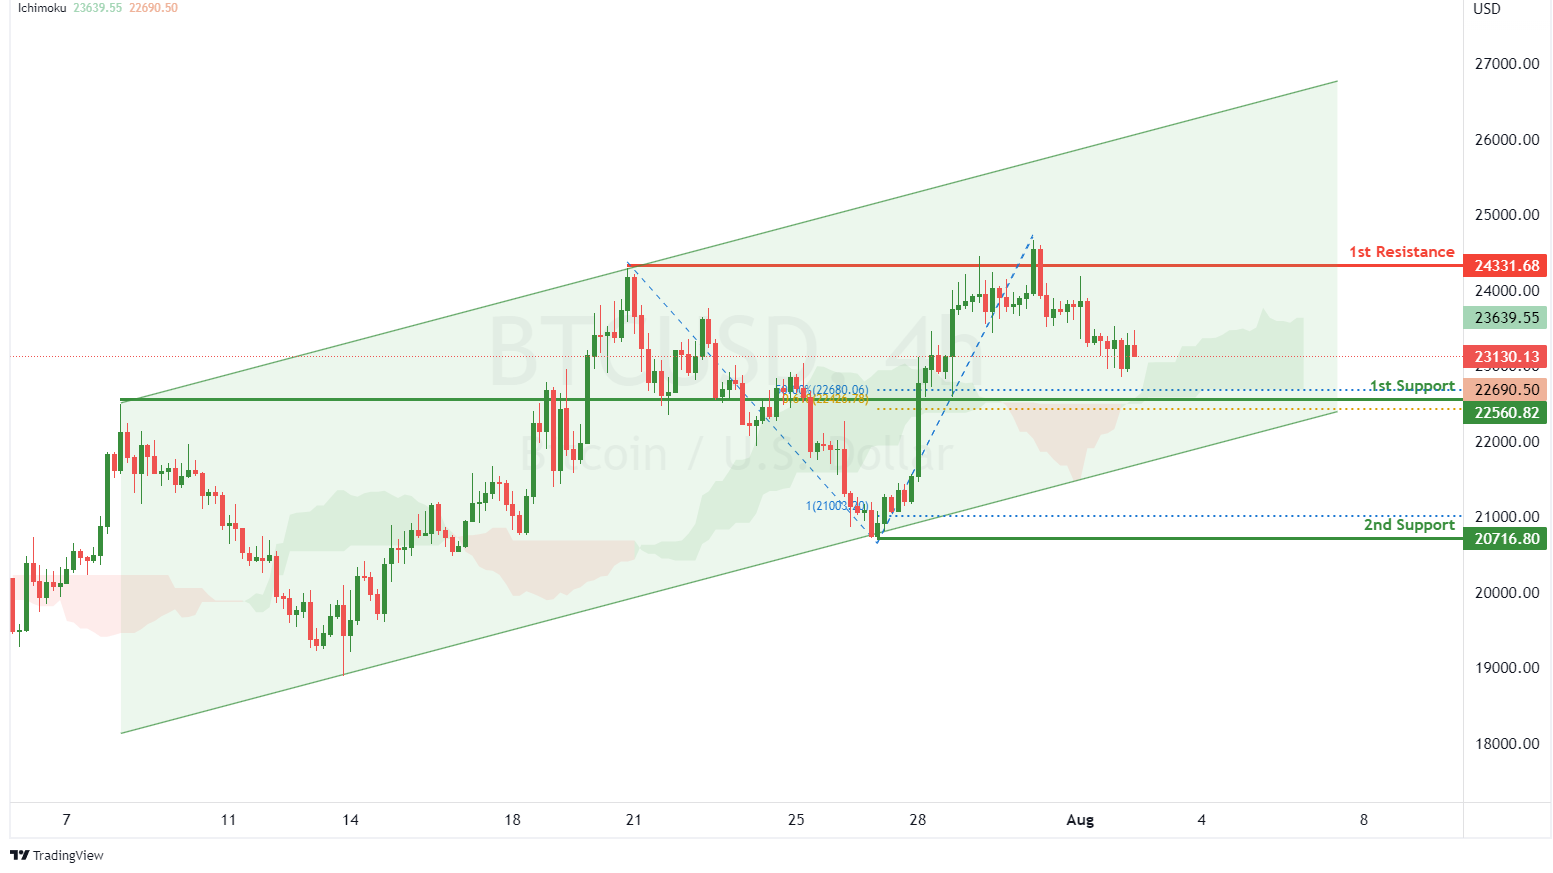
On the H4, with price moving within a bullish channel and above the ichimoku indicator, we have a bullish bias that price will rise from our 1st support at 22560.82 where the pullback support, 50% fibonacci retracement and 61.8% fibonacci projection are to the 1st resistance at 24331.68 where the pullback resistance is. Alternatively, price could break 1st support structure and drop to 2nd support at 20716.80 where the swing low support and 100% fibonacci projection are.
Areas of consideration:
- H4 time frame, 1st resistance of 24331.68
- H4 time frame, 1st support at 22560.82
S&P 500:
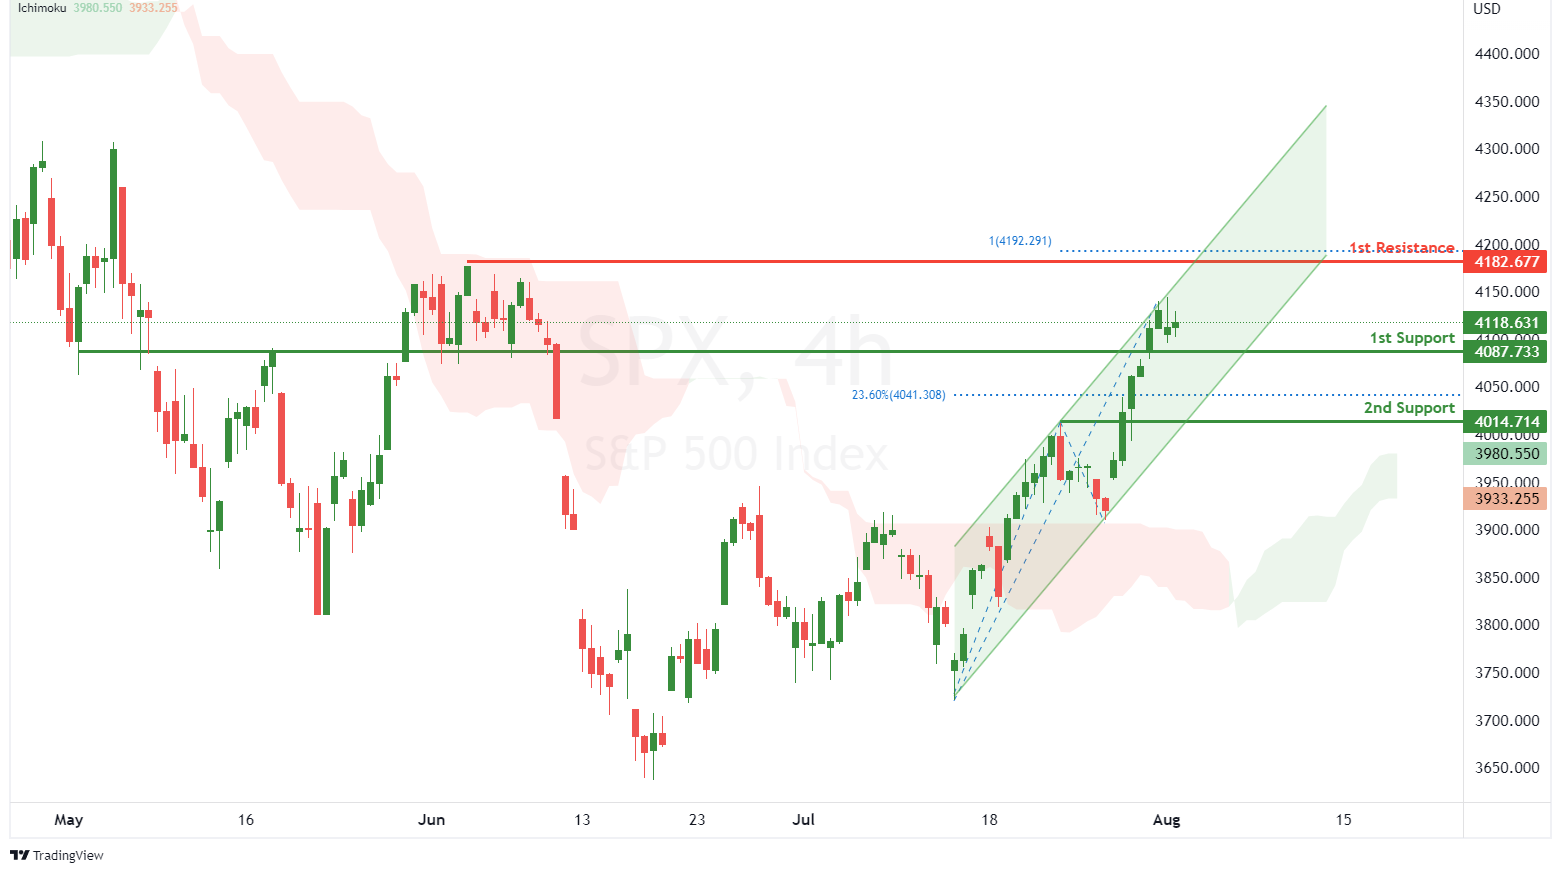
On the H4, with price moving above the ichimoku indicator and within an ascending channel, we have a bullish bias that price will rise from our 1st support at 4087.733 where the pullback support is to the 1st resistance at 4182.677 where the swing high resistance and 100% fibonacci projection are. Alternatively, price could break 1st support and drop to 2nd support at 4014.714 where the pullback support and 23.6% fibonacci retracement are.
Areas of consideration:
- H4 time frame, 1st resistance of 4182.677
- H4 time frame, 1st support at 4087.733
GBP/USD Breaks Hurdle, Yen Gains Momentum
Key Highlights
- GBP/USD climbed higher above the 1.2150 resistance zone.
- EUR/USD might rise steadily above the 1.0285 resistance.
- USD/JPY declined heavily below the 134.00 support zone.
- Crude oil price is moving lower towards the $90 support zone.
GBP/USD Technical Analysis
The British Pound started a fresh recovery wave above the 1.2050 resistance against the US Dollar. GBP/USD climbed above 1.2120 to move into a positive zone.
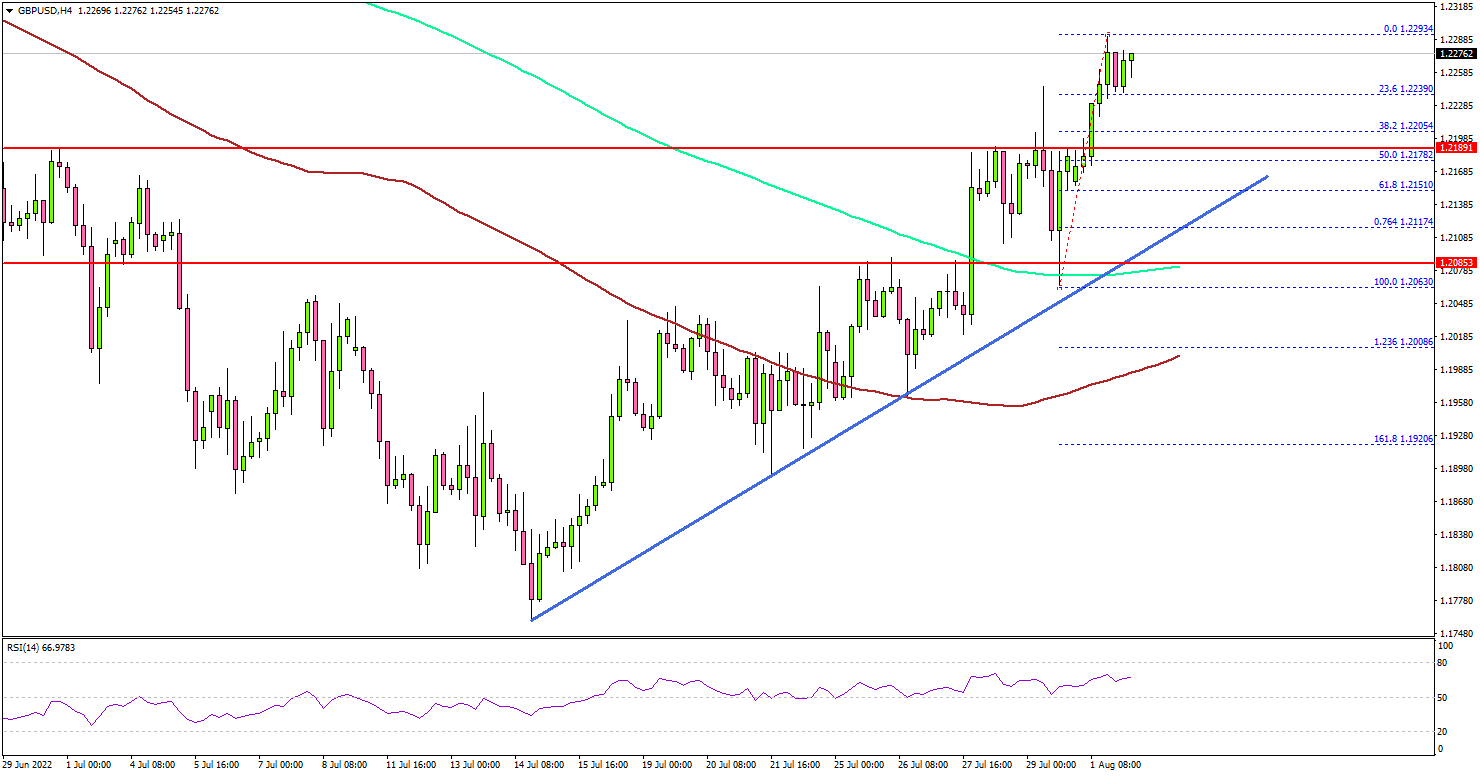
Looking at the 4-hours chart, the pair was able to settle above the 1.2150 level, the 100 simple moving average (red, 4-hours), and the 200 simple moving average (green, 4-hours).
It opened the doors for more gains above the 1.2200 resistance zone. The pair even moved above the 1.2250 level and seems like it could rise further above the 1.2300 resistance zone. The next major resistance is near the 1.2350 level, above which the pair could accelerate higher.
Conversely, GBP/USD might fail to climb above 1.2300 and start a downside correction. An immediate support is near the 1.2200 zone.
The first major support is near the 1.2170 level and a key bullish trend line on the 4-hours chart. Any more losses might send the pair towards the 1.2050 zone.
Looking at crude oil price, there was a rejection near the $104 zone and the price is now moving lower. The main support sits near the $90 level.
Economic Releases
UK Nationwide Housing Prices for July 2022 (YoY) – Forecast +11.5%, versus +10.7% previous.
Eco Data 8/2/22
[php_everywhere instance="1"]
Swiss Franc Rebound Continues
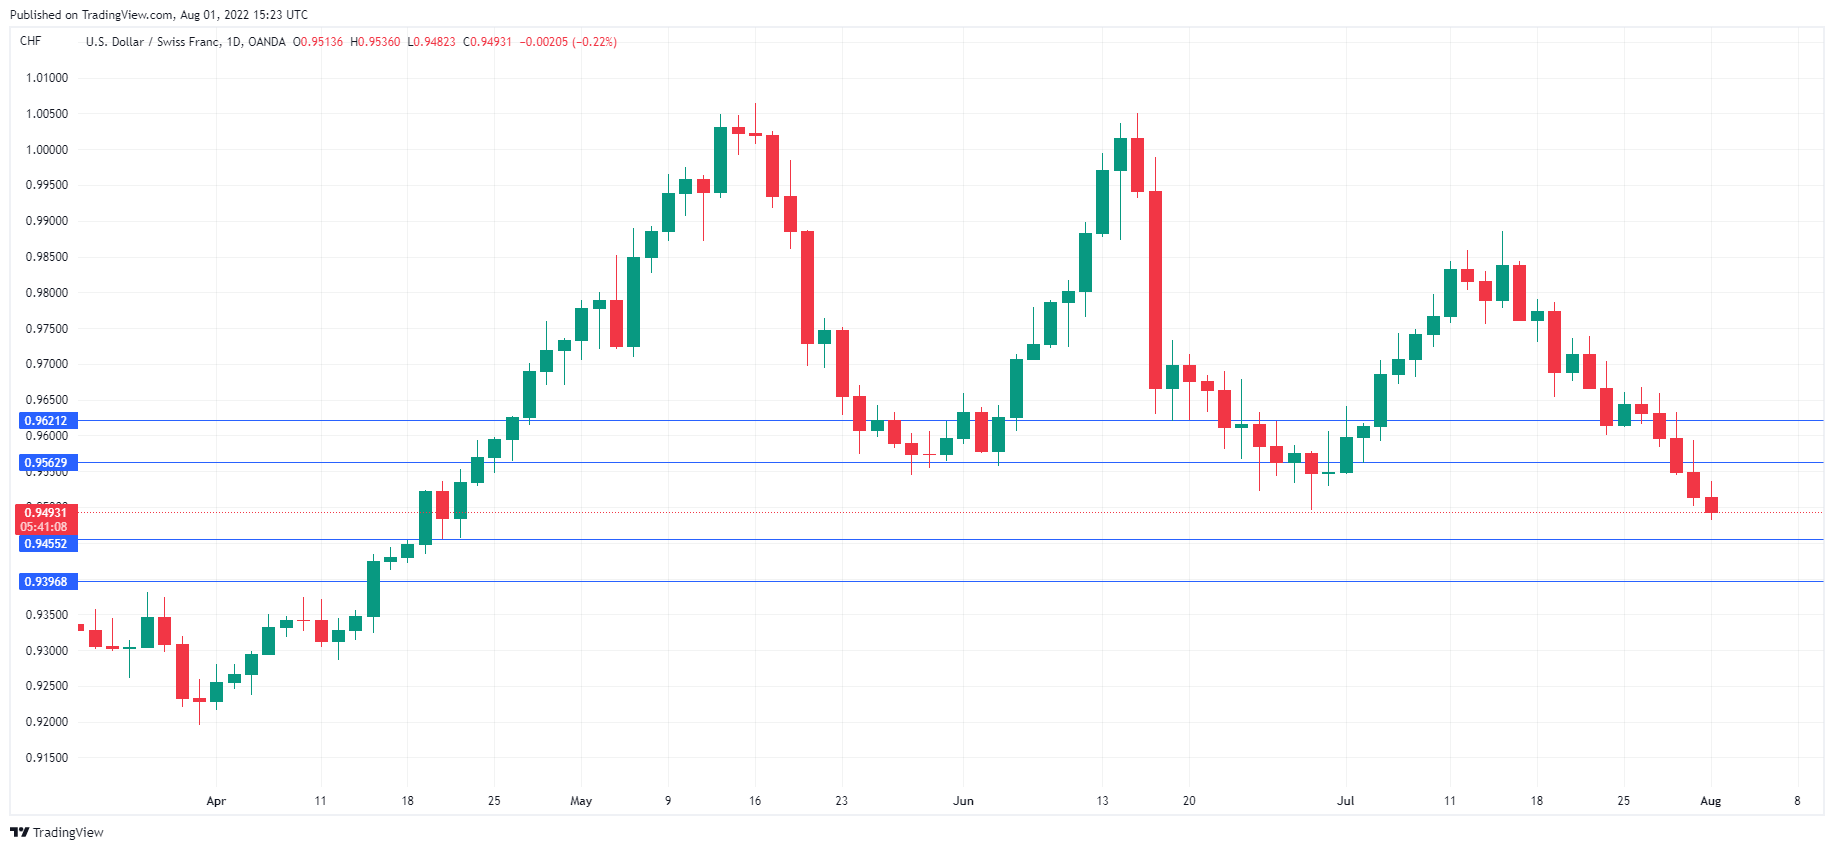
USD/CHF dips below 0.9500
The Swiss franc is showing little movement today, but USD/CHF has fallen below the 0.9500 line for the first time since May. The US dollar pushed the Swiss franc above the parity line in June, but since then the Swiss franc has steadily strengthened. After inflation rose to 2.9% in May (a rate that other major economies could only dream about), the Swiss National Bank (SNB) shocked the markets and raised rates from -0.75% to -0.25% at its June meeting.
This move boosted the value of the Swiss franc, but the SNB decided that this was a necessary price in order to curb inflation. Inflation has not yet peaked, as CPI rose to 3.4% in June, a 28-year high. This marked the first time that inflation has topped the 3% since 2008 and has raised speculation that the SNB could raise rates into positive territory before the next rate meeting, scheduled for early September.
The SNB, unlike most major central banks, is not shy about resorting to currency intervention. The SNB has intervened when it deemed the Swiss franc’s value as too high, which is detrimental to Switzerland’s export-reliant economy. The weakening in the global economy and decrease in demand has hurt the Swiss economy. With the US dollar on an extended downturn, SNB policymakers may consider intervening if the Swiss franc continues to appreciate.
Last week’s Swiss releases were mixed. KOF Economic Barometer for July fell to 90.1, down sharply from 95.2 in June (exp. 95.2). Retail Sales for June bounced back with a 1.2% gain, following a -1.3% reading in May. On Tuesday, we’ll get a look at the July inflation report, with an estimate of -0.1% MoM, following a 0.5% gain for June.
USD/CHF Technical
- USD/CHF has support at 0.9496 and 0.9412
- There is resistance at 0.9605 and 0.9689
Crude Oil Prices Continue to Be Under Pressure
The commodity sector remains rather tense on Monday; Brent is trading at $102.75.
Global geopolitics is what investors are focused on right now. Any complications in this area muddy the water one way or another, and it’s bad news. Last weekend, the Kosovo situation escalated – a gas pipeline “Balkan Stream” is going through Serbia, which doesn’t recognise the independence of Kosovo. The pipeline delivers natural gas from “TurkStream” to Hungary.
Later this week, OPEC and OPECF+ will have meetings. The OPEC+ agreement is ending in August and the organisations are set to discuss options to increase oil production. First of all, it depends on Saudi Arabia, a country that still has the potential for oil extraction expansion. However, Saudis don’t seem to be interested in it.
The latest report from Baker Hughes showed that over the past week, the Oil Rig Count in the US gained 6 units, up to 605. In Canada, the indicator increased by 13 units, up to 137.
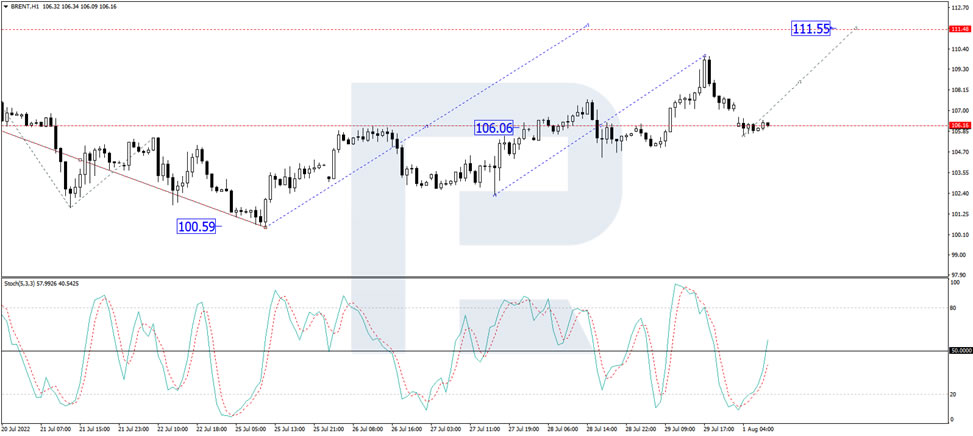
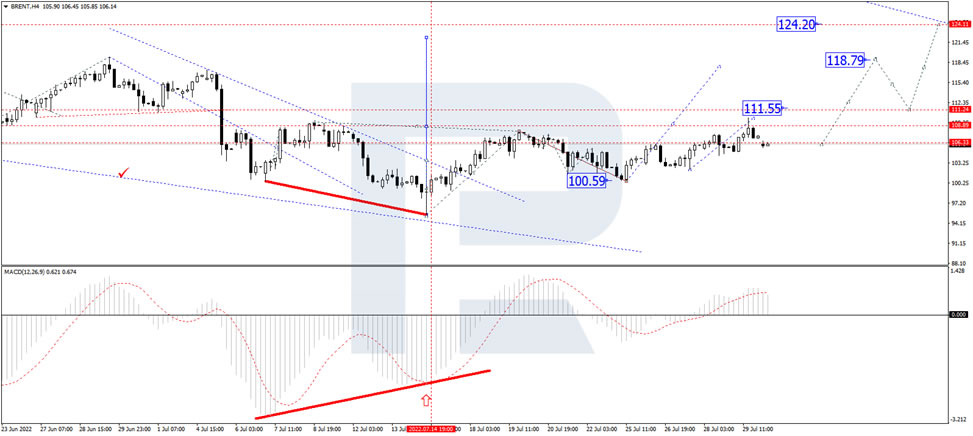
On the H4 chart, Brent is forming the third ascending wave with the target at 111.55 and may later correct down to 106.16. After that, the instrument may resume trading upwards with the short-term target at 118.80. From the technical point of view, this scenario is confirmed by the MACD Oscillator: its signal line is moving above 0 inside the histogram area. Both the line and the price chart may yet continue to move upwards.
As we can see in the H1 chart, after finishing the descending correctional structure at 106.16, Brent is consolidating above this level. Possibly, the asset may break the range to the upside and start another growth with the target at 111.55, or even extends this structure up to 118.70. From the technical point of view, this idea is confirmed by the Stochastic Oscillator: after breaking 20, its signal line is heading towards 50. Later, the line may break the latter level and continue growing to reach 80.