Sample Category Title
NZDJPY Wave Analysis
- NZDJPY reversed from support level 83.10
- Likely to rise to resistance level 84.30
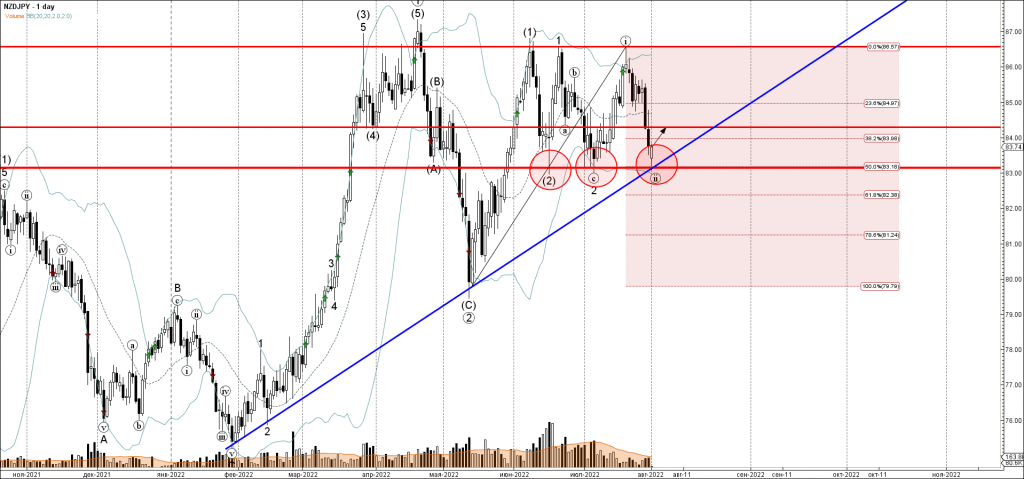
NZDJPY currency pair recently reversed up from the strong support level 83.10 (low of the earlier waves (2) and 2), support trendline from February, lower daily Bollinger Band and the 50% Fibonacci correction of the upward impulse from May.
The upward reversal from the support level 83.10 stopped the previous short-term correction (ii).
Given the clear daily uptrend, NZDJPY currency pair can be expected to rise further in the next impulse wave (iii) toward the next resistance level 84.30.
NZDCHF Wave Analysis
- NZDCHF reversed from support level 0.5940
- Likely to rise to resistance level 0.6050
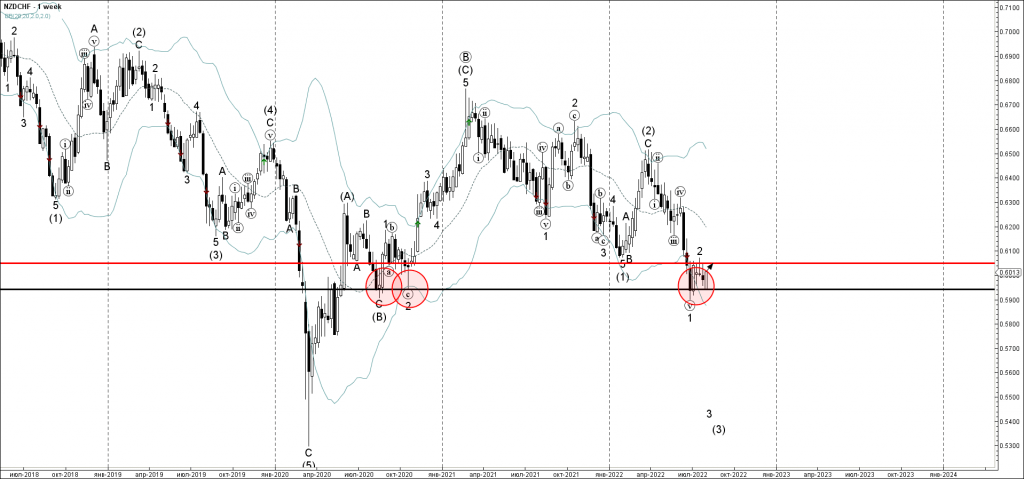
NZDCHF currency pair recently reversed up from the strong support level 0.5940 (which has been reversing the pair from the middle of July).
The upward reversal from the support level 0.5940 stopped the previous impulse waves 3 and (3).
Given the bullish NZD sentiment seen today, NZDCHF currency pair can be expected to rise further toward the next resistance level 0.6050 (top of the previous correction 2).
Correction or Dollar Reversal? The NFP Will Show Us
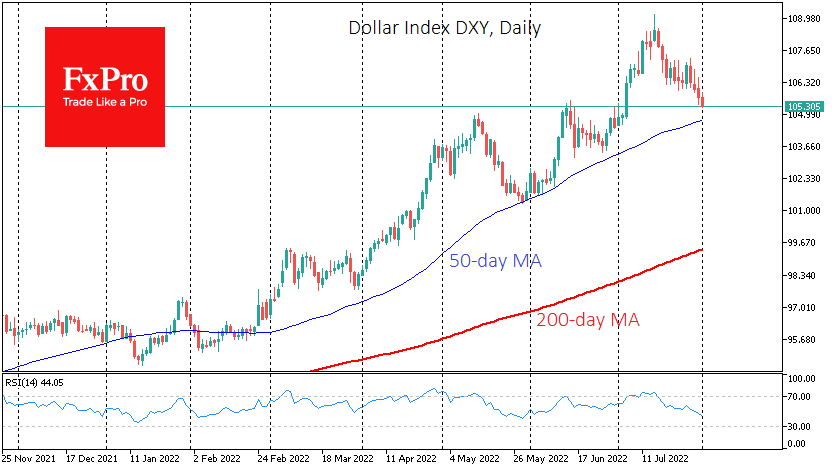
The last two weeks of July have seen a pullback in the markets towards risky assets, with the dollar retreating from multi-year highs against major currencies.
Over the past two weeks, signs of an economic slowdown in the US have reinforced the markets’ bets that the Fed will start cutting interest rates as early as the middle of next year, much more quickly than previously thought.
Although US officials do not recognise the onset of a recession after two quarters of GDP falling, markets are largely indifferent to such formalities. They are more focused on data and economic forecasts.
If one looks at the market dynamics, one would conclude that the markets consider the current pace of policy tightening too severe for the economy. Over the last two quarters, the US economy has lost 0.6%, and although suffering from the energy crisis Europe added 1.2% in the first half of the year.
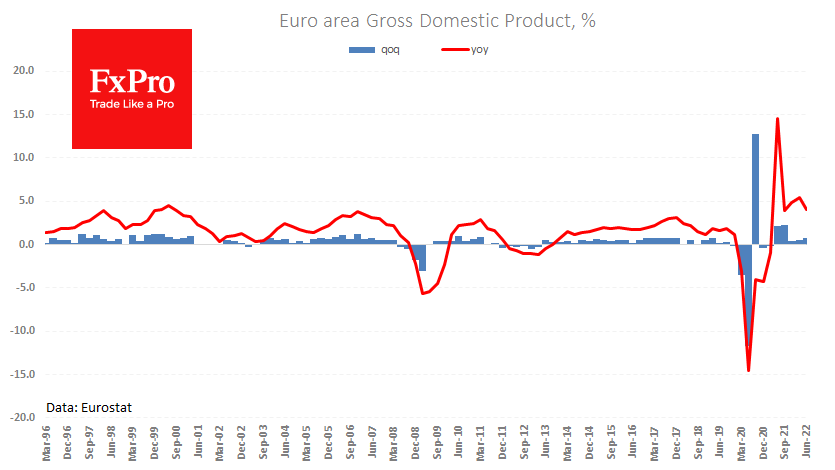
US policymakers, including Powell and Yellen, point out that the economy is actively creating jobs, with a historically very high employment rate. But it is up to us to determine whether these observations are a relic this week.
From the following monthly employment report, the markets expect an increase in employment of 250k, but at the same time a fall in wage growth, which will only further widen the gap to inflation. During the week, market investors and traders will try to pick up signals from indirect indicators such as the ISM manufacturing and service sector indices and weekly jobless claims.
How strong the labour market was in July may determine whether we see a minor corrective pullback in the dollar before further gains or a global reversal of more than a year uptrend in USD.
Gold Edges Higher, Descending Trendline in Focus
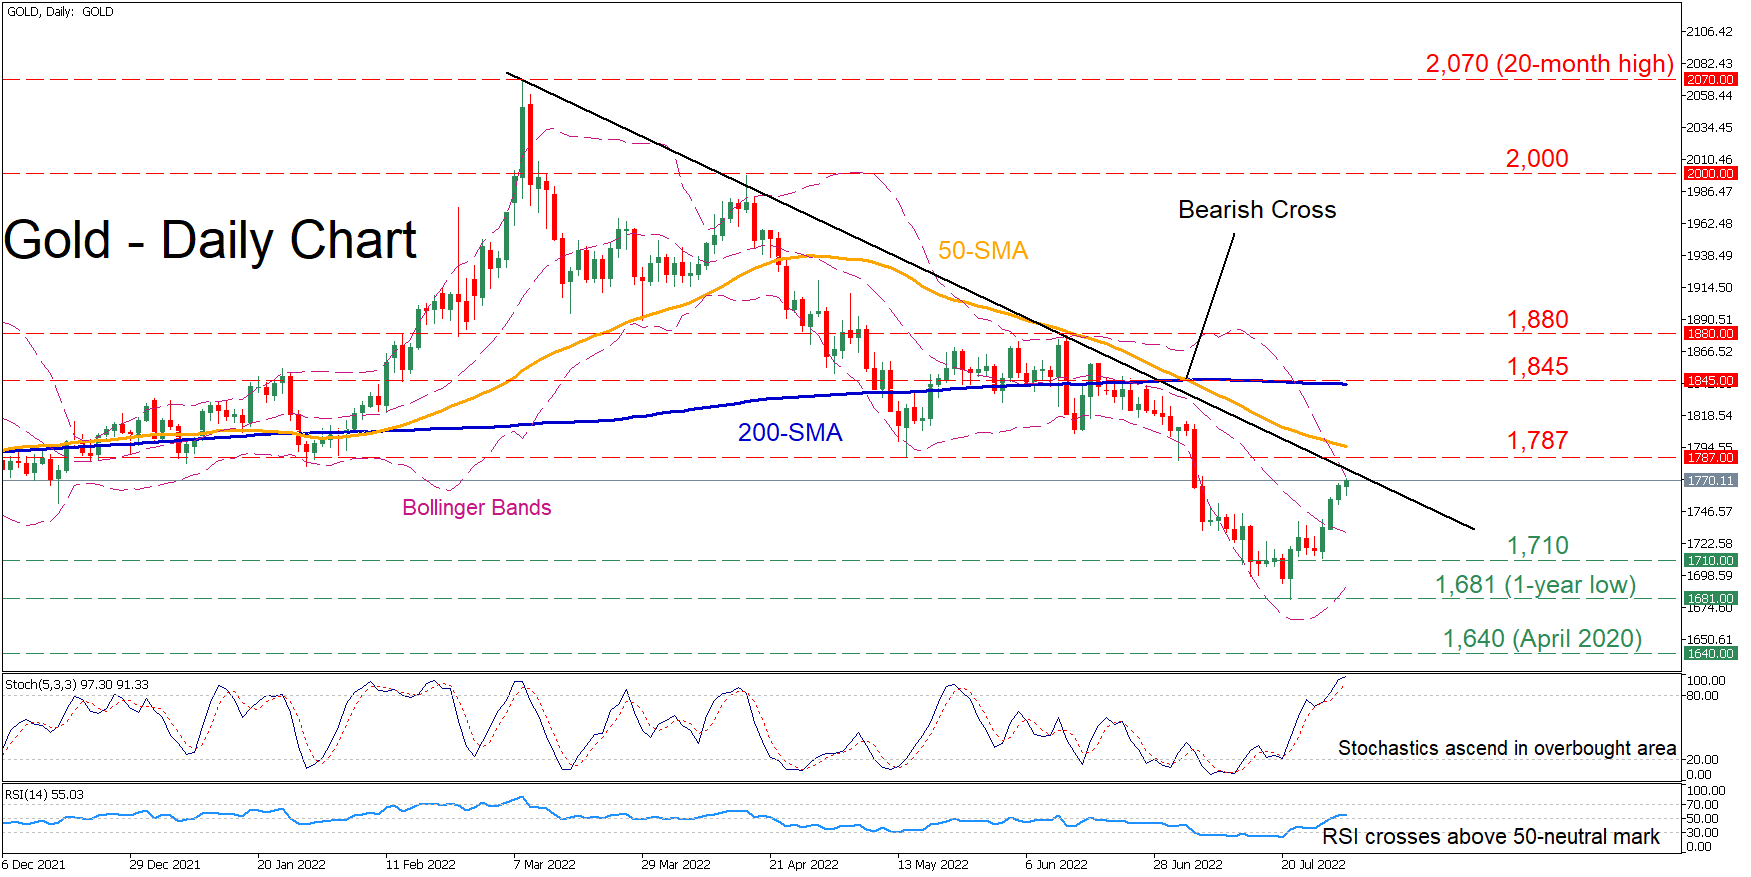
Gold has been experiencing a sustained downtrend since early March, creating a profound structure of lower highs and lower lows. However, the precious metal managed to cease its decline at the one-year low of 1,681 and is currently in recovery mode, targeting its upper Bollinger band and the restrictive trendline.
The momentum indicators are reflecting a positive near-term bias. Specifically, the stochastic oscillator is sloping upwards within the 80-overbought zone, while the RSI has jumped above its 50-neutral threshold.
Should buying interest intensify further, the price may encounter initial resistance at the 1,787 barrier. Any further advances may then stall at the 200-day simple moving average, currently at 1,845. Slicing through this region, the June peak of 1,880 could be the next obstacle for the bulls overcome.
On the flipside, should the rebound falter, immediate support might be provided by the recent low of 1,710. A violation of this zone could shift the attention to the one-year low of 1,681. Failing to halt there, the price could descend to challenge 1,640, which acted both as support and resistance in April 2020.
Overall, even though the market is trying to push for some recovery in the past few daily sessions, gold maintains both its bearish short- and long-term outlooks. For the former to alter, the price needs to decisively cross above the 1,880 ceiling.
Euro Edges Despite Weak German Data
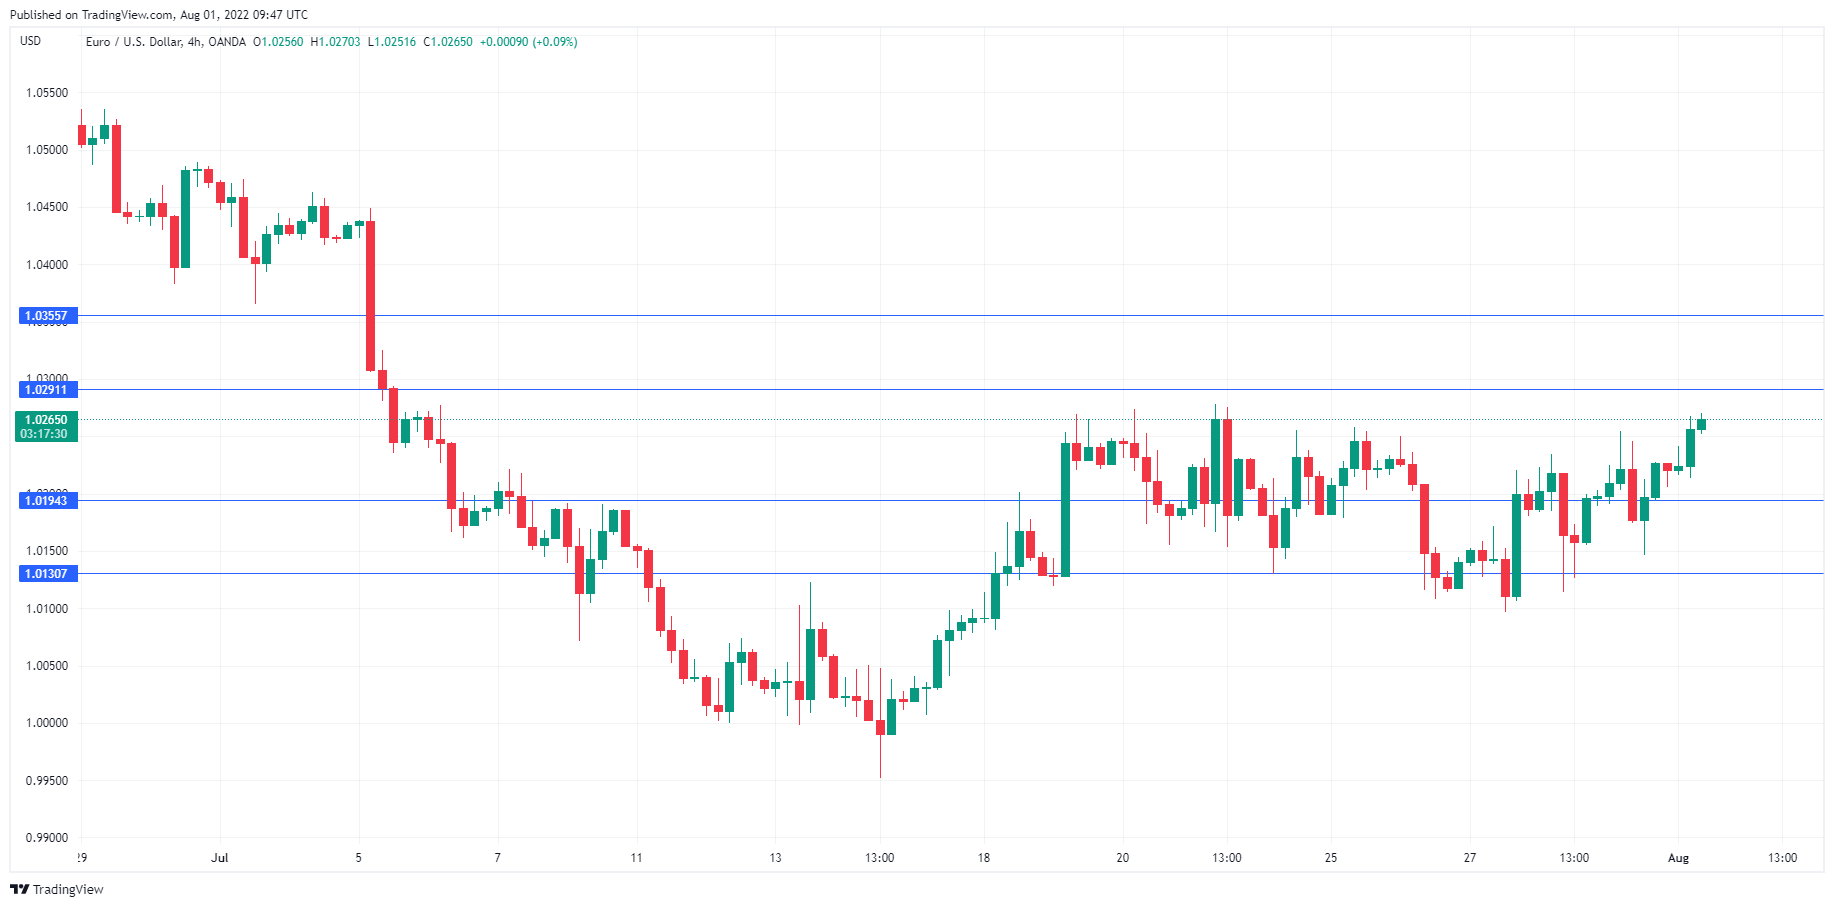
The euro is in positive territory today extending the gains seen on Monday. In the European session, EUR/USD is trading at 1.0262, up 0.35% on the day.
German manufacturing declines
The data out of the eurozone was none too encouraging today, but the euro shrugged off the numbers. Manufacturing PMIs across the eurozone recorded declines, with readings below the 50.0 level. In Germany, the July PMI came in at 49.3, down from 52.0 in June. The manufacturing sector has been struggling for months, so the drop into contraction territory is not all that surprising. Still, this is the first time in over two years that Germany’s manufacturing sector has recorded a decline, which is bound to worry the markets.
Manufacturing across Europe is struggling, as demand has fallen after the post-Covid surge. High inflation and the uncertain economic outlook (think Ukraine war and energy crisis), are additional headwinds for manufacturing, which could continue to post declines in the coming months if the eurozone economy doesn’t improve.
There was no relief from German retail sales for June, which came in at -1.6% MoM, down from the 1.2% gain in May and shy of the 0.2% estimate. On an annualized basis, retail sales fell 8.8%, after a 1.1% gain in May, and worse than the forecast of -8.0%. The German consumer is in a surly mood due to the cost of living crisis and is holding tight onto her purse strings. Weak consumer spending will, unfortunately, only exacerbate the weakness we’re seeing in the German economy.
Eurozone inflation hits new record
Eurozone inflation is expected to rise to 8.9% in July YoY, up from 8.6% in June. Energy prices continue to be the main driver behind surging inflation, with a massive 39% jump compared to July 2021. Inflation is much more broad-based than just energy prices, as food, alcohol, services and industrial goods are also rising in price. This will make it difficult for the ECB to reel in inflation, with the danger that inflation expectations will become unanchored as broad-based inflationary pressures continue to accelerate.
EUR/USD Technical
- EUR/USD is putting pressure on 1.0291. Above, there is resistance at 1.0355
- There is support at 1.0194 and 1.0130
Eurozone unemployment rate unchanged at 6.6% in Jun, EU at 7.2%
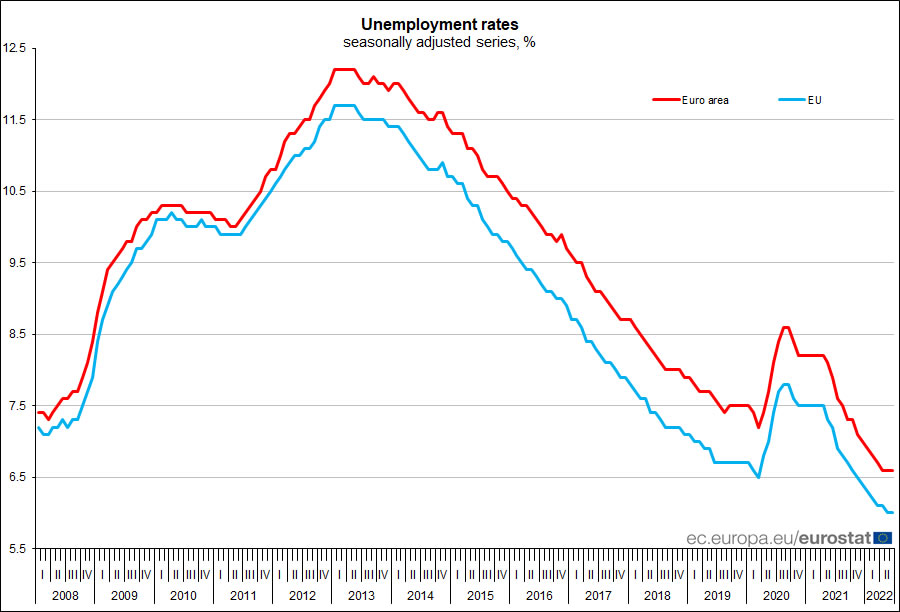
Eurozone unemployment rate was unchanged at 6.6% in June, matched expectations. EU unemployment rate was also stable at 7.2%.
Eurostat estimates that 12.931 million men and women in the EU, of whom 10.925 million in the euro area, were unemployed in June 2022. Compared with June 2021, unemployment decreased by 2.311 million in the EU and by 1.957 million in the euro area.
UK PMI manufacturing finalized at 52.1, shifted into reverse gear
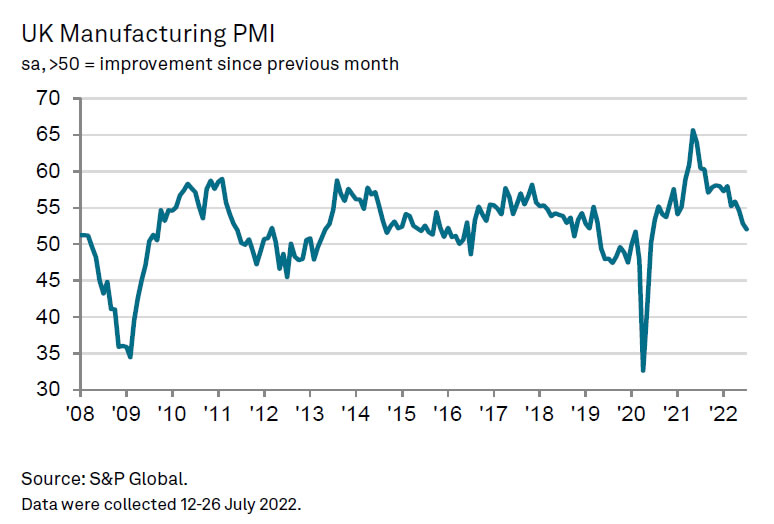
UK PMI Manufacturing was finalized at 52.1 in July, down from 52.8 in June. That's also the lowest level in 25 months. S&P Global said that output fell in consumer and intermediate goods industries. Job created accelerated as companies addressed staff shortages.
Rob Dobson, Director at S&P Global Market Intelligence, said:
"The UK manufacturing sector shifted into reverse gear at the start of the third quarter. Output contracted for the first time since May 2020, as new order intakes suffered the first back-to-back monthly decreases for two years.
"Rising market uncertainty, the cost of living crisis, war in Ukraine, ongoing supply issues and inflationary pressures are all hitting demand for goods at the same time, while lingering post-Brexit issues and the darkening global economic backdrop are hampering exports.
"With the Bank of England implementing further interest rate hikes to combat inflation, the outlook is beset with downside risks. With this in mind, the continued low degree of optimism among manufacturers is of little surprise."
Bitcoin Takes Another Step Up
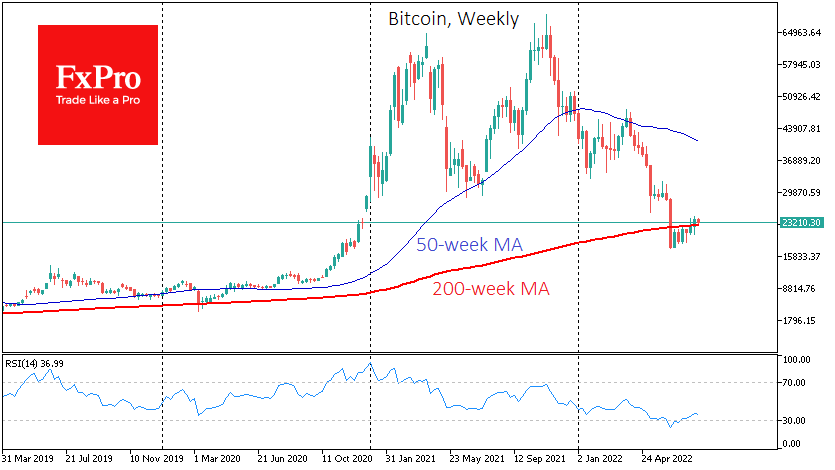
Bitcoin has added 6% over the past seven days, to $24.6K at one point, but now corrected to $23.2K. Ethereum has added 11% to $1700. Top-10 altcoins rose from 4% (Cardano) to 22% (Polkadot).
The total crypto market capitalisation, according to CoinMarketCap, rose 7.5% over the week to $1084bn. Bitcoin’s dominance index fell 0.5 points to 41%.
The Crypto Fear and Greed Index rolled back to 33 by Monday, ranging from 26 on Tuesday to 42 on Saturday during the previous week.
Bitcoin added 27% over July, posting its biggest gain amid the strengthening of stock indices in nine months. Bitcoin failed to recover even half of its June losses. However, the last month and a half have seen a careful price recovery.
Last week closed above the 200-week moving average, a dip below which was a historical anomaly and called into question the long-term growth trend of cryptocurrencies.
Regarding seasonality, August is considered less favourable for bitcoin than July. Over the past 11 years, bitcoin has ended the month up only five times and down six times. The average rise was 26%, while the average decline was 15%. In the first case, BTC could end August at around $30K, recouping the June decline in two months. In the second, it could be about $20K.
Dan Morehead, Pantera Capital CEO, believes the crypto market has passed its peak after liquidating assets of bankrupt companies in May and June. In his view, even during the height of the crisis, almost all DeFi protocols worked effectively while the centralised credit-linked companies collapsed.
Eurozone PMI manufacturing finalized at 49.8, sinking into increasingly steep downturn
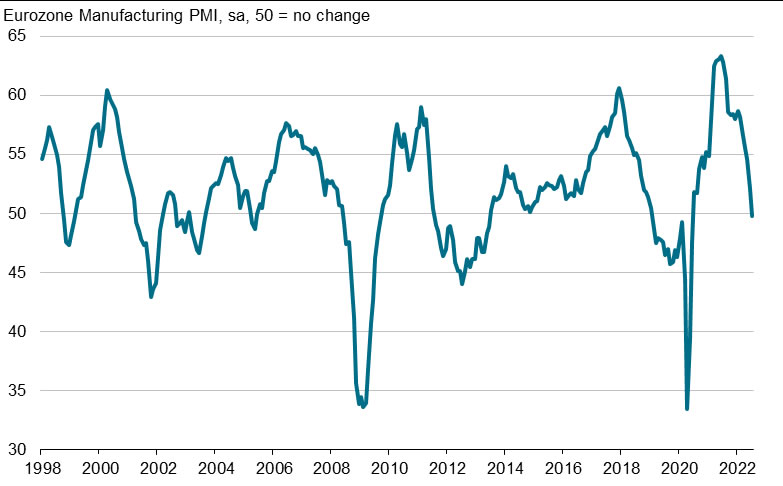
Eurozone PMI Manufacturing was finalized at 49.8 in July, down from 52.1. That's also a 25-month low. PMI Manufacturing Output Index was finalized at 46.3, down from June's 49.3, a 26-month low.
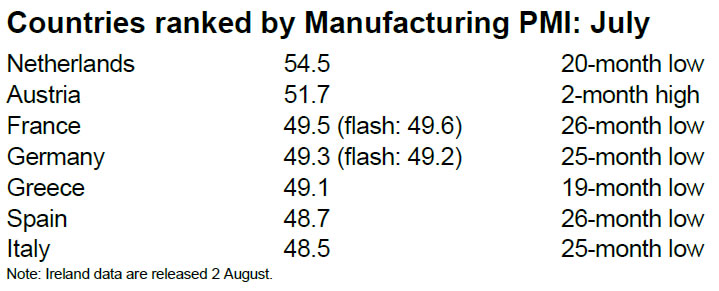
Looking at some member states, PMI manufacturing in the Netherlands dropped to 20-month low at 54.5. Austria recovered to 2-month high at 51.7. France (49.6, 26-month low), Germany (49.3, 25-month low), Greece (49.1, 19-month low), Spain (48.7, 26-month low), and Italy (48.5, 25-month low) were all in contraction.
Chris Williamson, Chief Business Economist at S&P Global Market Intelligence said: "Eurozone manufacturing is sinking into an increasingly steep downturn, adding to the region's recession risks....
"Production is falling at especially worrying rates in Germany, Italy and France, but is also now in decline in all other surveyed countries except the Netherlands, and even here the rate of growth has slowed sharply...
"The energy crisis adds to the risks that not only will weaker demand and destocking cause manufacturing production to decline at an increased rate in the coming months, but reduced energy supply will act as an additional drag on the sector."
NZD/USD: Intermediate Ending Diagonal Likely to Complete Primary Impulse
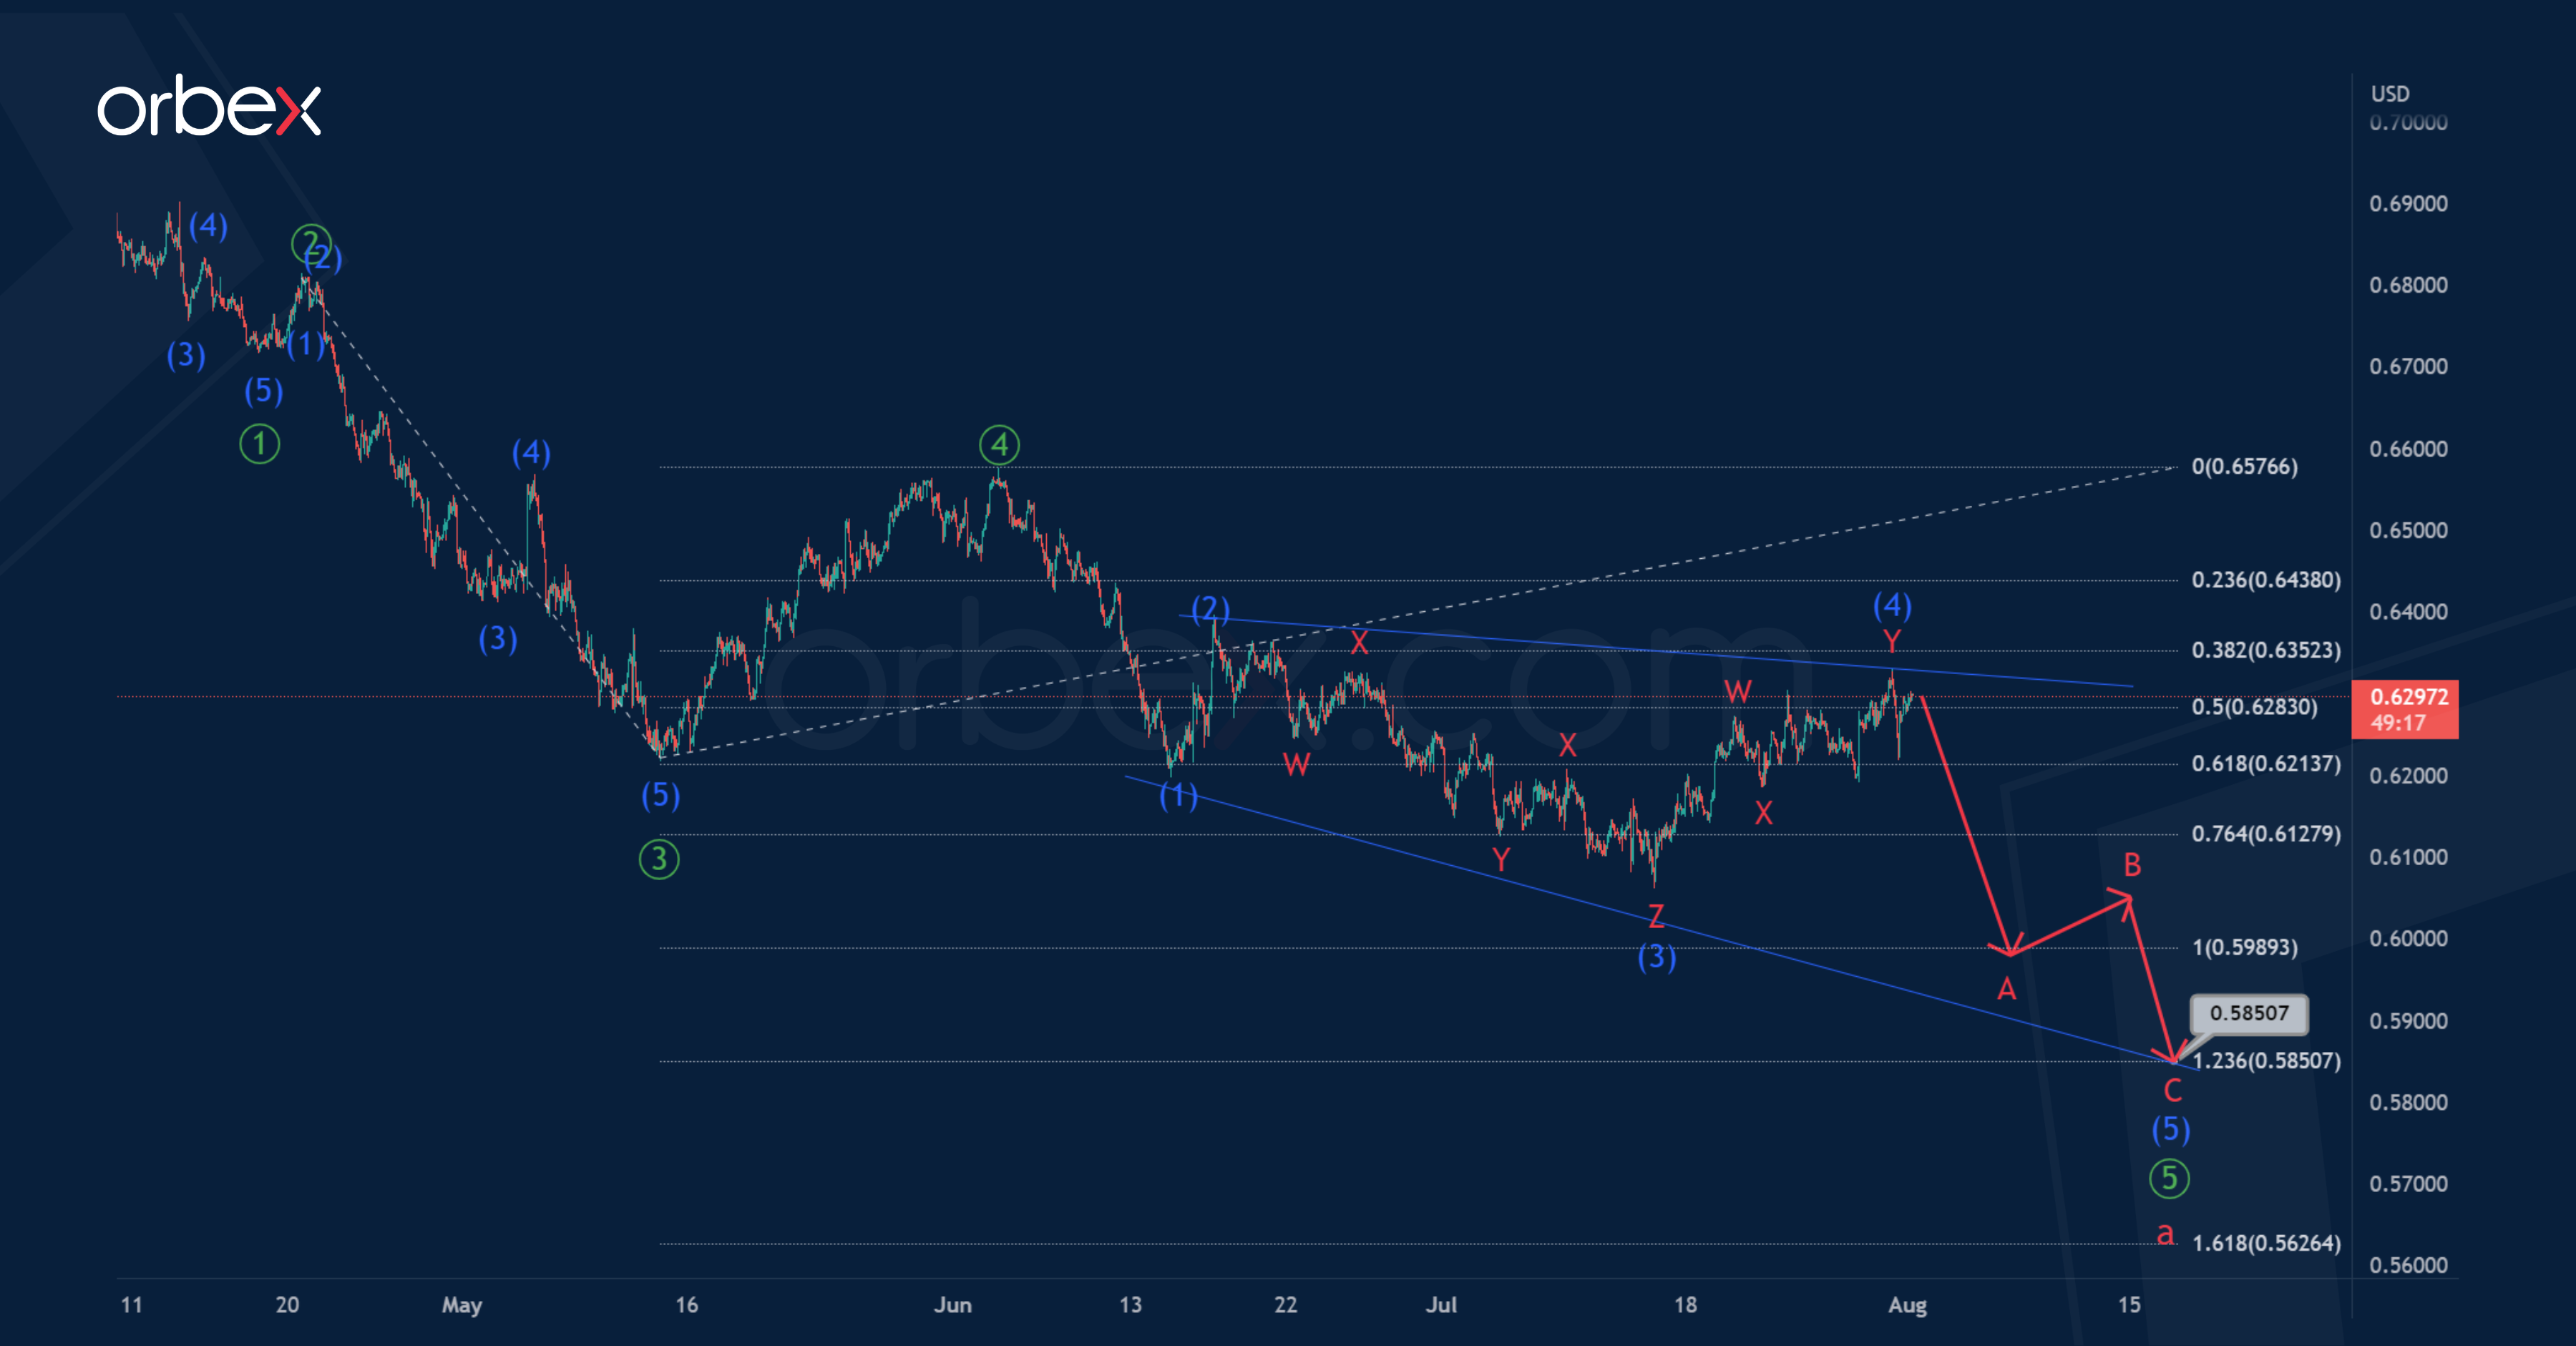
The current NZDUSD structure on the 1H timeframe suggests the formation of a new bearish trend, which may take the form of a primary impulse ①-②-③-④-⑤. This impulse can give rise to a global zigzag a-b-c of the cycle degree.
Perhaps the first four parts of the potential impulse are fully completed. In the near future, it is expected to decline in the sub-wave ⑤ to 0.585. This sub-wave can take the form of an intermediate ending diagonal (1)-(2)-(3)-(4)-(5)
At the specified level, wave ⑤ will be at 123.6% of primary impulse ③.
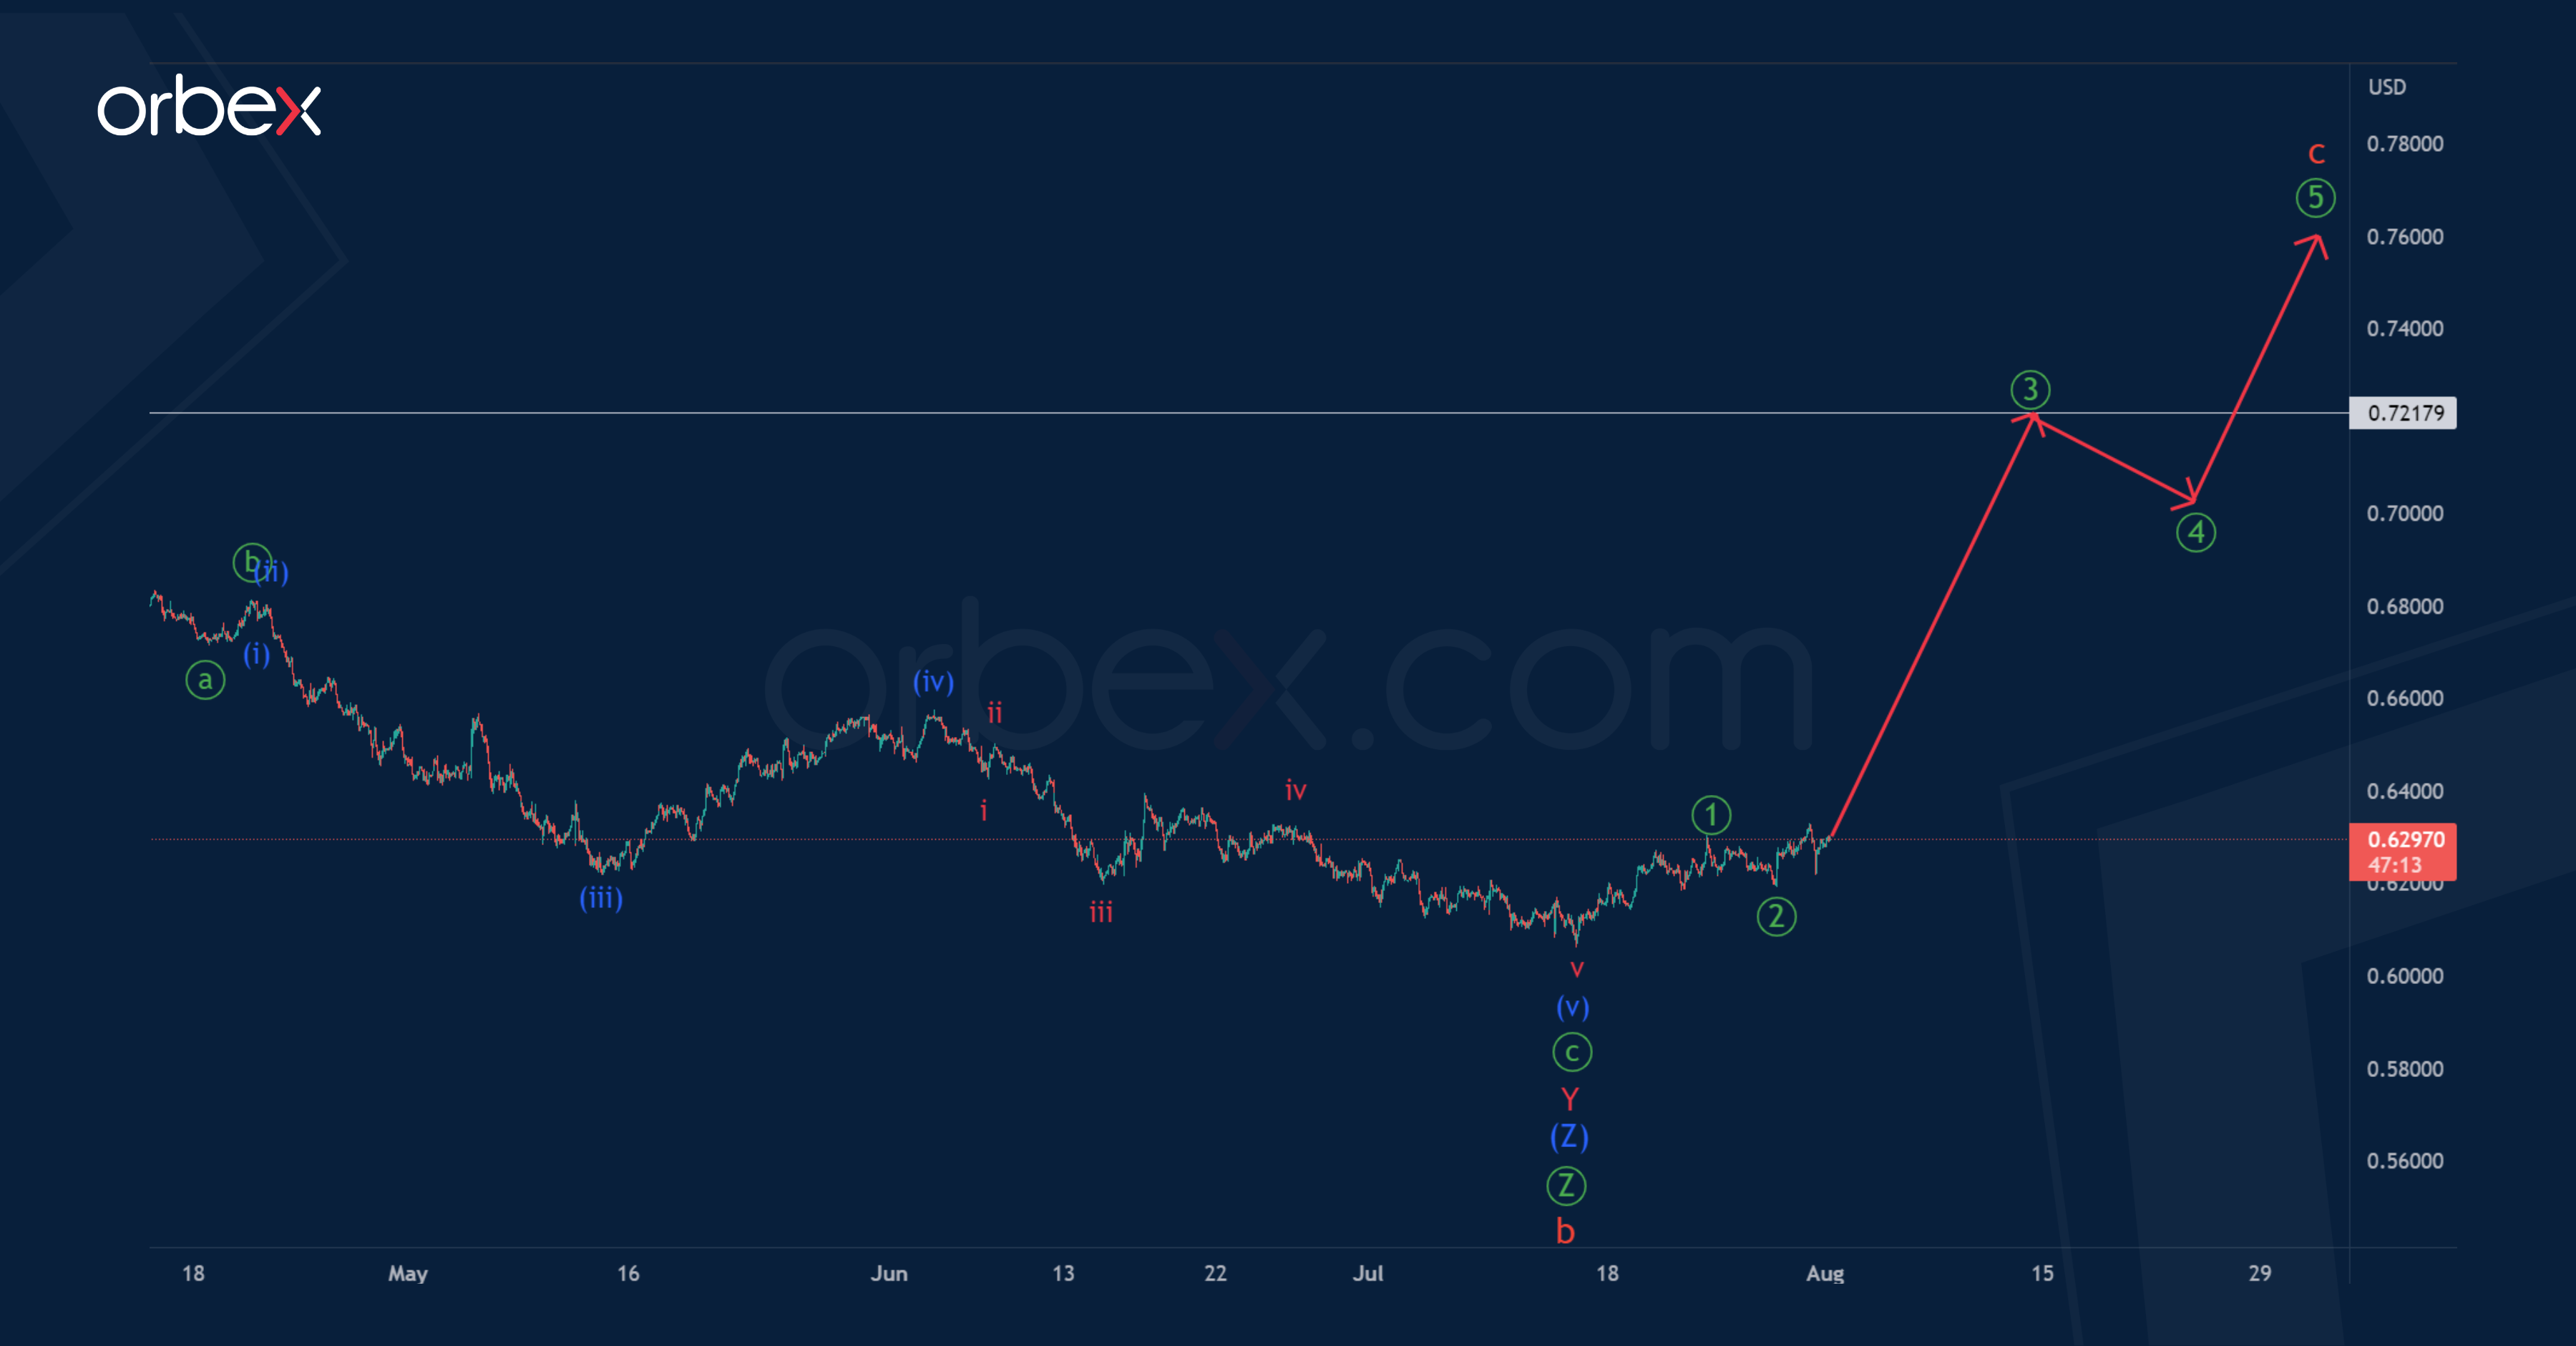
Alternatively, it is assumed that the market continues to build a large bullish zigzag of the cycle degree, as part of which correction b has come to an end. The final primary wave Ⓩ, which is part of correction b, took the form of a triple zigzag (W)-(X)-(Y)-(X)-(Z) of the intermediate degree.
Thus, in the next coming trading weeks, price growth and the development of a bullish cycle wave c above 0.721 are possible. Wave c is likely to take the form of an impulse ①-②-③-④-⑤. At the specified price point, the construction of the primary impulse wave ③ is likely to end.
The level of 0.721 is the previous maximum marked by the primary wave Ⓧ, which is not visible on the current chart.