Sample Category Title
GBP/USD Daily Outlook
Daily Pivots: (S1) 1.2078; (P) 1.2162; (R1) 1.2261; More...
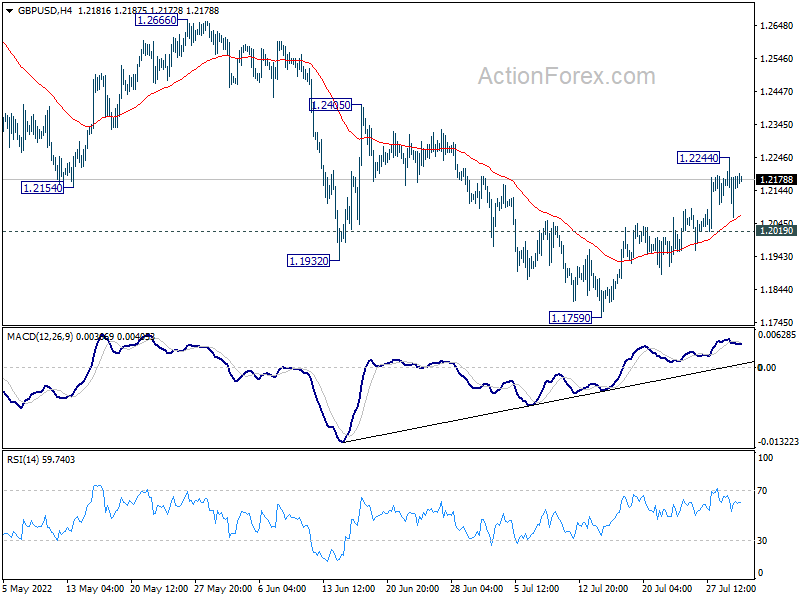
Intraday bias in GBP/USD remains neutral for consolidation below 1.2244 temporary top. On the upside, break of 1.2244 will resume the rebound from 1.1759 for 1.2405 resistance. Firm break there will target 1.2666 key resistance next. On the downside, break of 1.2019 minor support will turn bias back to the downside for retesting 1.1759 low instead.
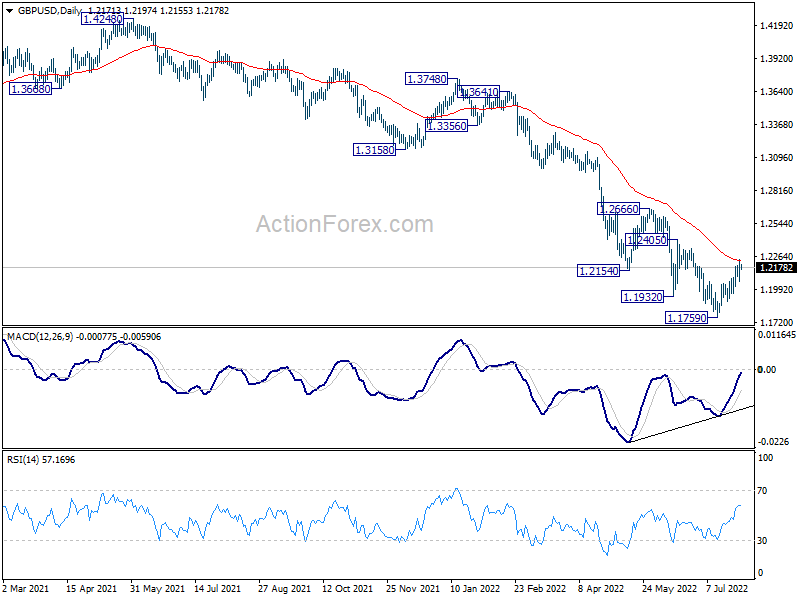
In the bigger picture, fall from 1.4248 (2018 high) could be a leg inside the pattern from 1.1409 (2020 low), or resuming the longer term down trend. Deeper decline is expected as long as 1.2666 resistance holds. Next target is 1.1409 low. However, firm break of 1.2666 will bring stronger rise back to 55 week EMA (now at 1.2957).
EUR/USD Daily Outlook
Daily Pivots: (S1) 1.0164; (P) 1.0209; (R1) 1.0272; More...
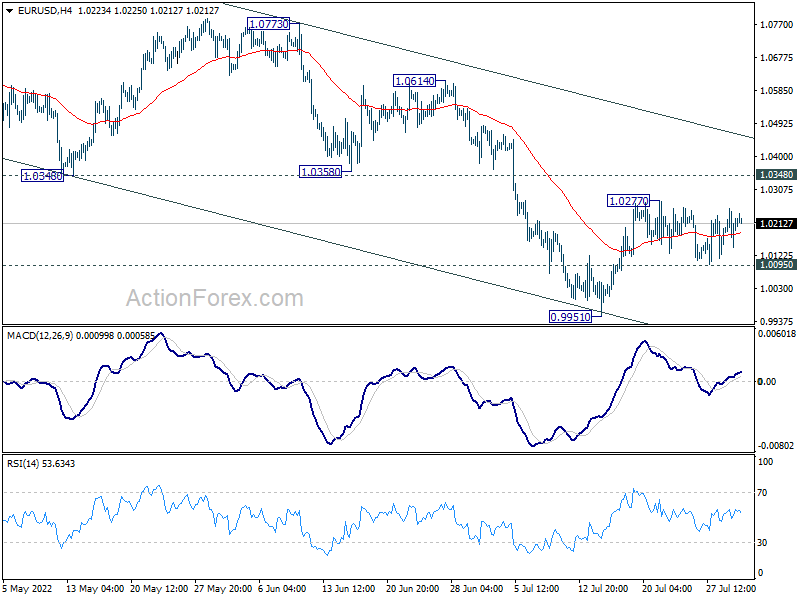
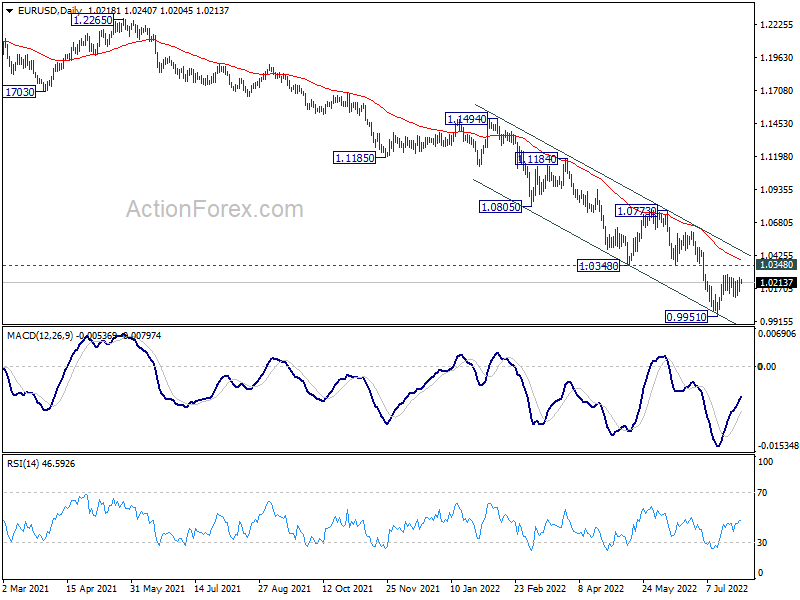
Intraday bias in EUR/USD remains neutral as range trading continues. On the upside, above 1.0277 minor resistance will target 1.0348 resistance first. Break there will target channel resistance at 1.0469. On the downside, break of 1.0095 minor support will bring retest of 0.9951 low instead.
In the bigger picture, down trend from 1.6039 (2008 high) is still in progress. Next target is 100% projection of 1.3993 to 1.0339 from 1.2348 at 0.8694. In any case, outlook will stay bearish as long as 1.0773 resistance holds, in case of strong rebound.
AUD/USD Daily Report
Daily Pivots: (S1) 0.6925; (P) 0.6978; (R1) 0.7046; More...
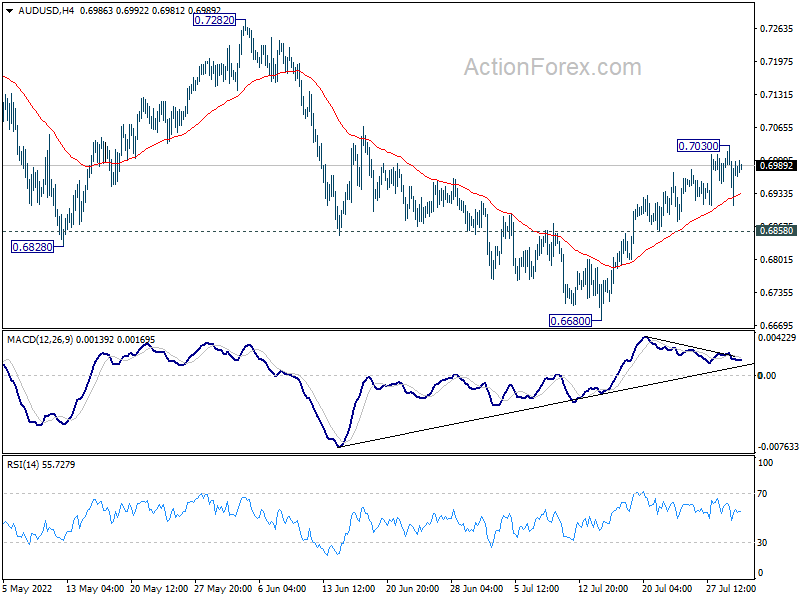
Intraday bias in AUD/USD remains neutral at this point. On the upside, break of 0.7030 will resume the rebound from 0.6680 to 0.7282 key resistance next. On the downside, however, break of 0.6858 minor support will argue that the rebound is over. Intraday bias will then be back on the downside for retesting 0.6680 low.
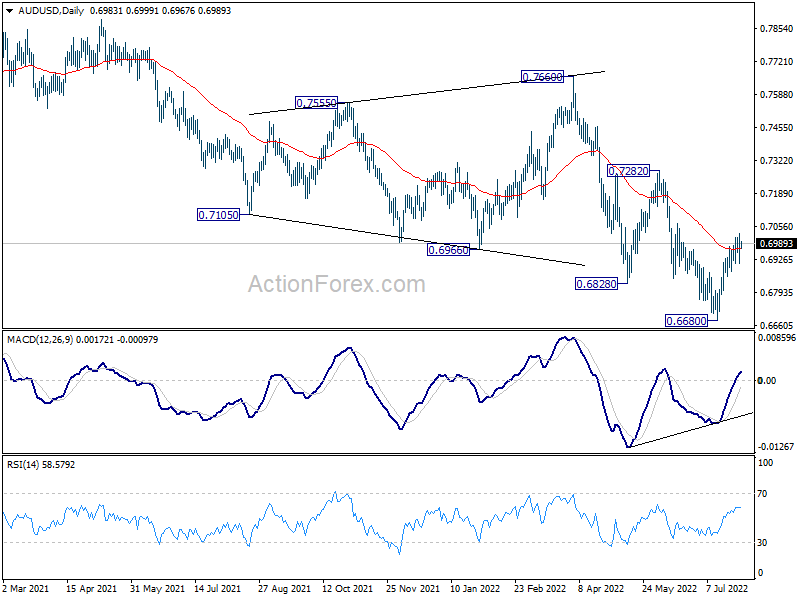
In the bigger picture, price actions from 0.8006 (2021 high) could still be a corrective pattern to rise from 0.5506 (2020 low). But current downside acceleration, as seen in weekly MACD), is raising the chance that it's a bearish impulsive move. In either case, outlook will remain bearish as long as 0.7282 resistance holds. Next target is 61.8% retracement of 0.5506 to 0.8006 at 0.6461.
USD/CAD Daily Outlook
Daily Pivots: (S1) 1.2772; (P) 1.2813; (R1) 1.2838; More...
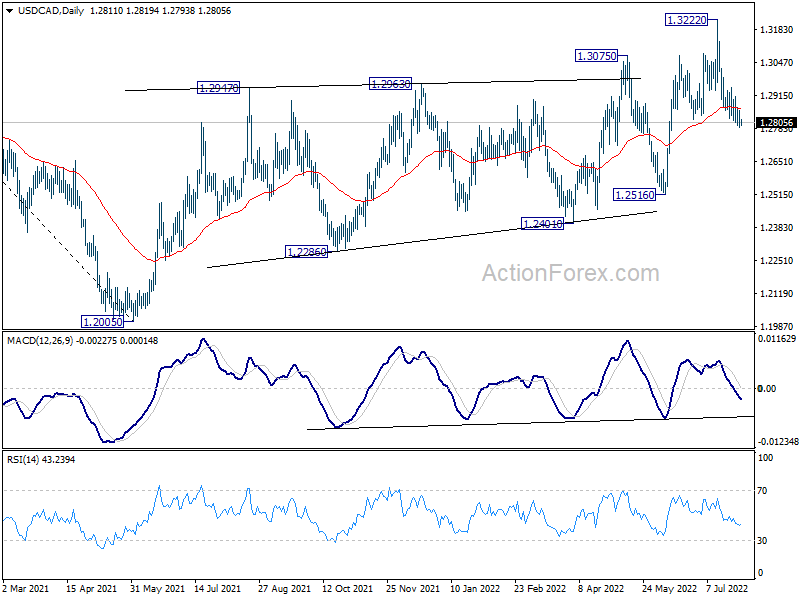
Intraday bias in USD/CAD remains on the downside at this point. Current fall from 1.3222 would target 1.2818 support. On the upside, above 1.2945 minor resistance will revive near term bullishness, and turn bias back to the upside for retesting 1.3222 instead.
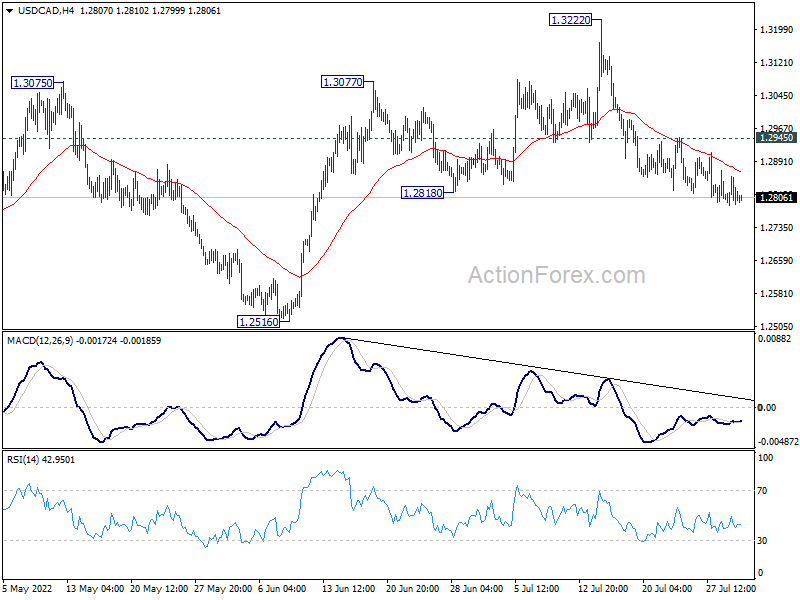
In the bigger picture, down trend from 1.4667 (2020 high) should have completed at 1.2005, after defending 1.2061 long term cluster support. Rise from there should target 61.8% retracement of 1.4667 to 1.2005 (2021 low) at 1.3650. This will remain the favored case now as long as 1.2516 support holds.
EUR/CHF Daily Outlook
Daily Pivots: (S1) 0.9702; (P) 0.9728; (R1) 0.9755; More....
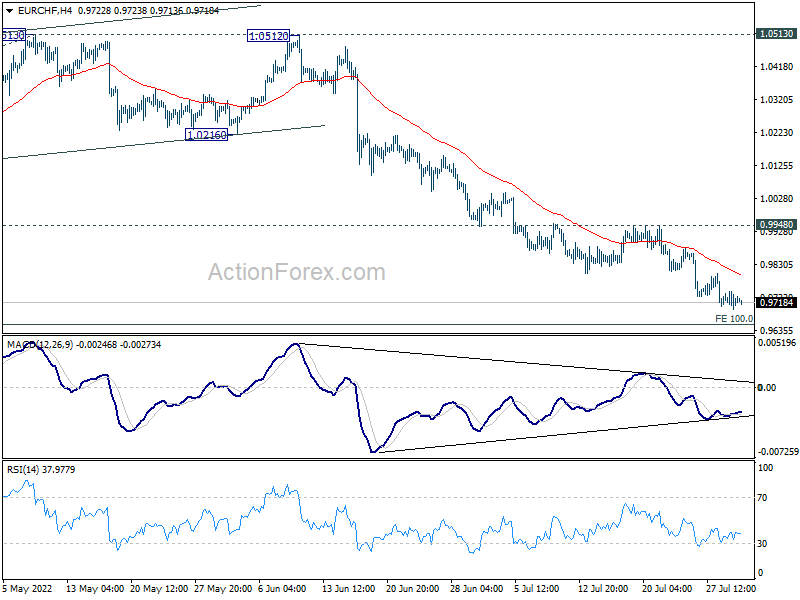
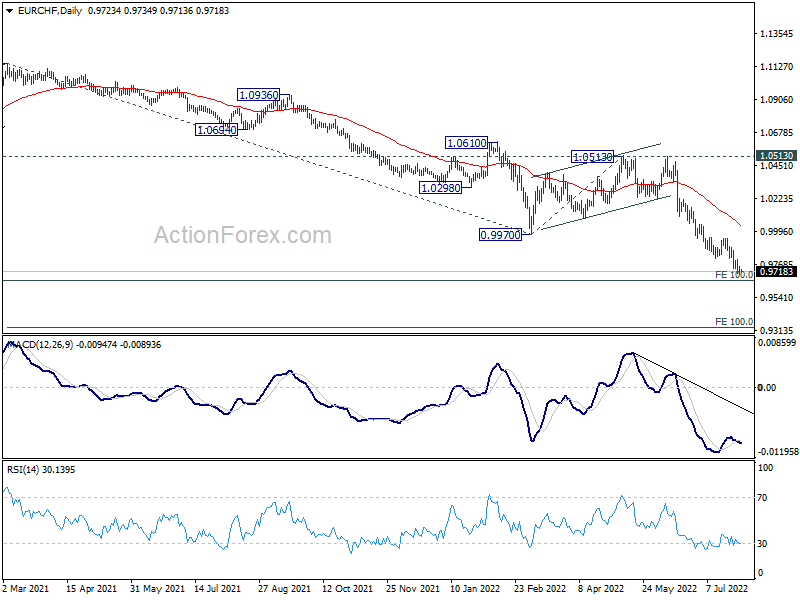
EUR/CHF's down trend is still in progress and intraday bias stays on the downside for 0.9650 long term projection level. Some support might be seen there to bring rebound. But break of 0.9948 resistance is needed to indicate short term bottoming. Otherwise, outlook will stay bearish. Firm break of 0.9650 will target 100% projection of 1.1149 to 0.9970 from 1.0513 at 0.9334.
In the bigger picture, long term down trend from 1.2004 (2018 high) is expected to target 100% projection of 1.2004 to 1.0505 to 1.1149 at 0.9650. Firm break there will target 138.2% projection at 0.9033. On the upside, break of 1.0513 resistance is needed to indicate medium term bottoming. Otherwise, outlook will stay bearish in case of strong rebound.
EUR/GBP Daily Outlook
Daily Pivots: (S1) 0.8370; (P) 0.8393; (R1) 0.8416; More...
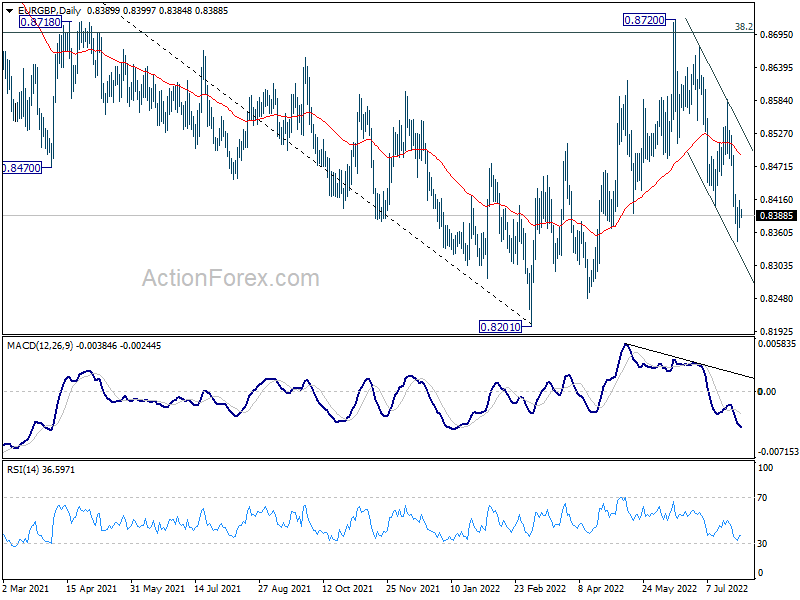
Intraday bias in EUR/GBP remains neutral for consolidation above 0.8344 temporary low. While stronger recovery cannot be ruled out, further decline is expected as long as 0.8585 resistance holds. Below 0.8344 will resume the fall from 0.8720 for retesting 0.8201 low.
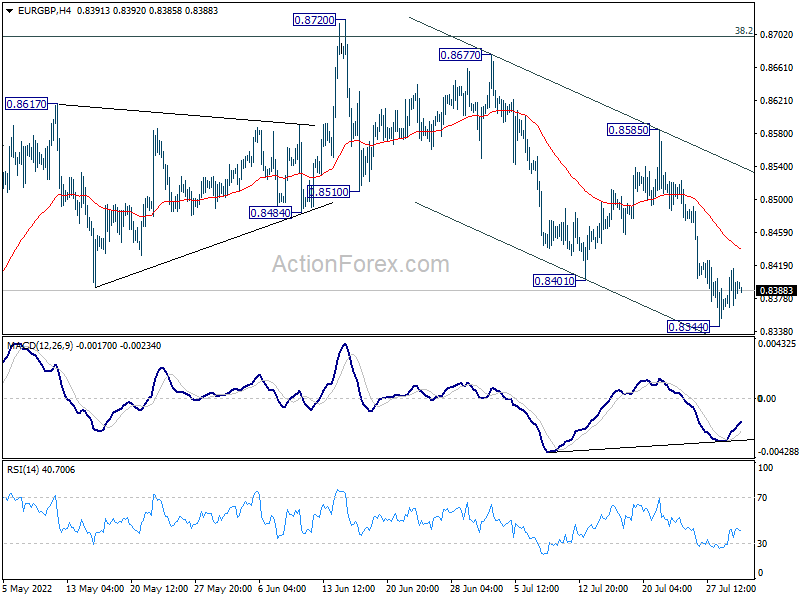
In the bigger picture, current development suggests rejection by 38.2% retracement of 0.9499 to 0.8201 at 0.8697. Medium term term bearishness is maintained. Break of 0.8201 will resume larger down trend from 0.9499 (2020 high). Nevertheless, sustained break of 0.8697 will affirm the case that rise from 0.8201 is a medium term up trend itself.
EUR/AUD Daily Outlook
Daily Pivots: (S1) 1.4557; (P) 1.4622; (R1) 1.4690; More...
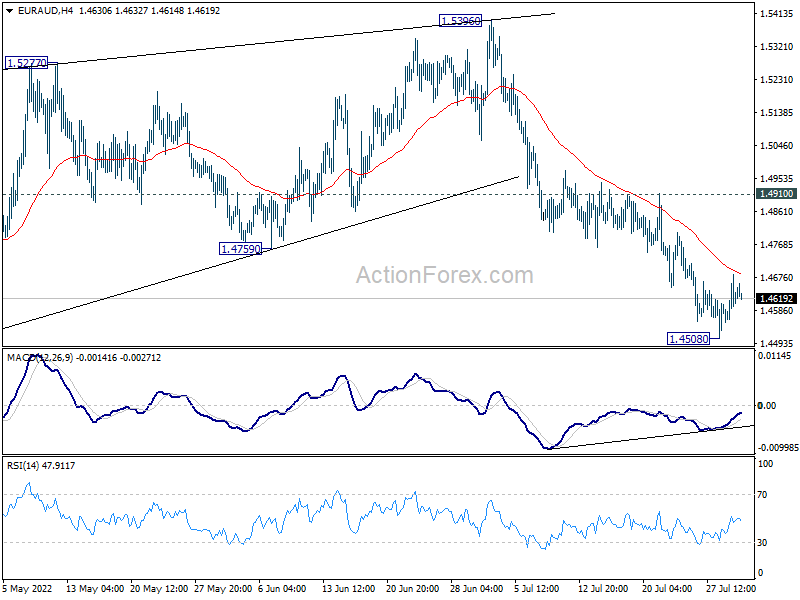
Intraday bias in EUR/AUD is mildly on the upside further recovery. But upside should be limited below 1.4910 resistance to bring fall resumption. On the downside, break the 1.4508 will resume the decline from 1.5396 to retest 1.4318 low.
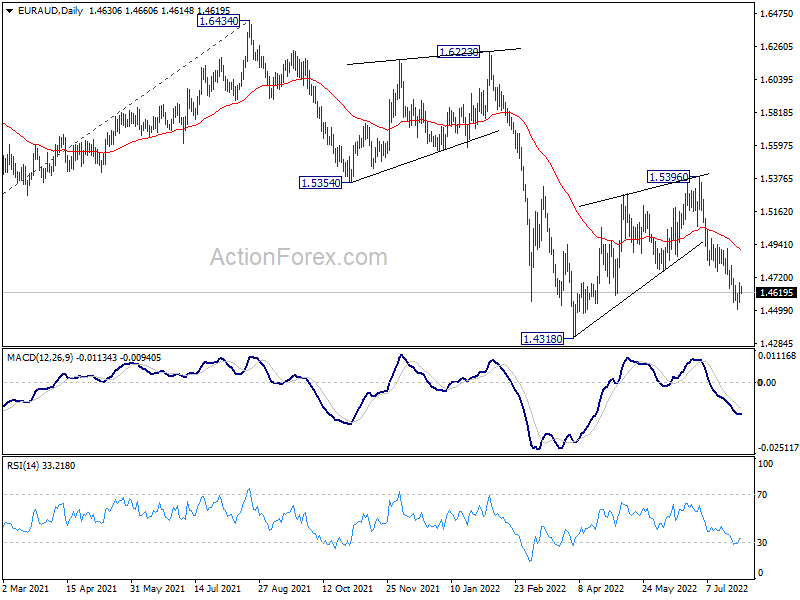
In the bigger picture, rejection by 1.5354 support turned resistance, as well as 55 week EMA (now at 1.5378), maintain medium term bearishness. That is, larger down trend from 1.9799 is not completed yet. Break of 1.4318 low will target 61.8% projection of 1.9799 to 1.5250 from 1.6434 at 1.3623, which is close to 1.3624 long term support (2017 low). This will remain the favored case now as long as 1.5396 resistance holds.
GBP/JPY Daily Outlook
Daily Pivots: (S1) 161.27; (P) 162.59; (R1) 163.63; More...
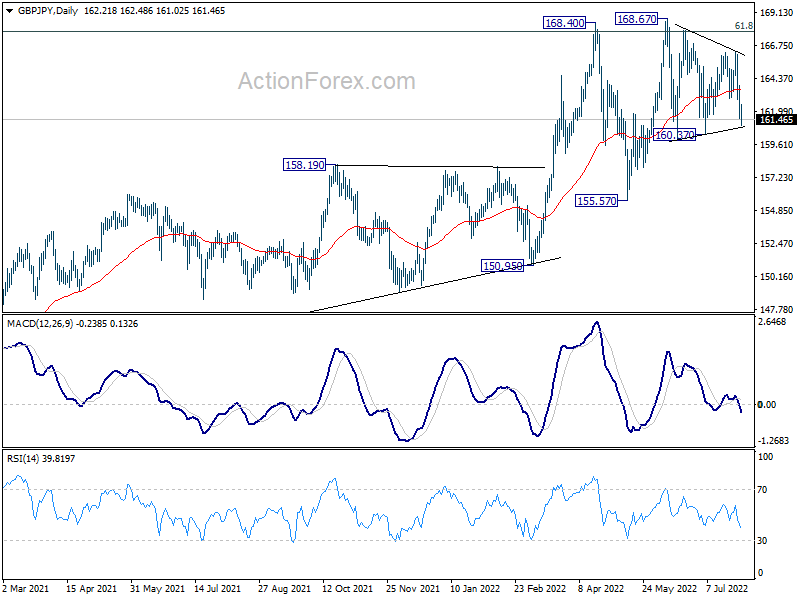
Intraday bias in GBP/JPY stays on the downside for 160.37 support. Decisive break there will argue that deeper fall is underway towards 162.67 support next. On the upside, though, break of 163.88 minor resistance will turn intraday bias neutral again first.
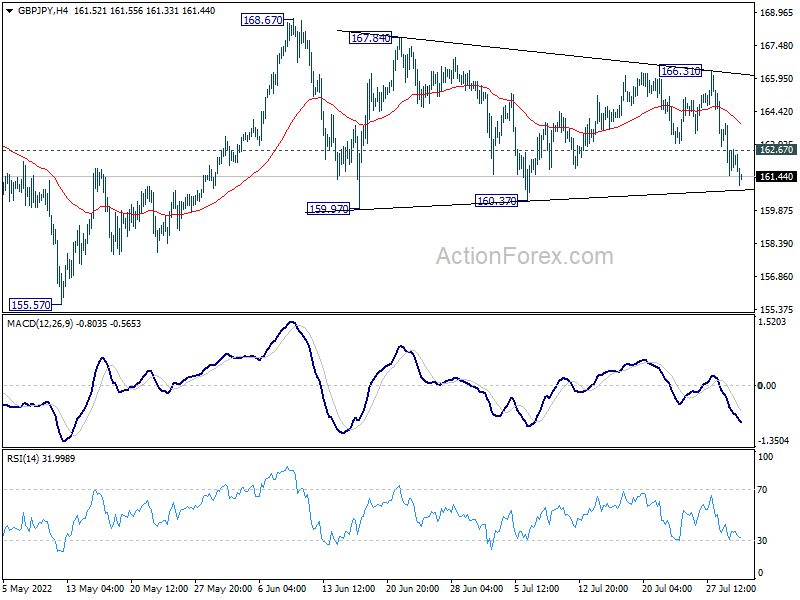
In the bigger picture, up trend from 123.94 (2020 low) is still in progress. Sustained break of 61.8% retracement of 195.86 (2015 high) to 122.75 (2016 low) at 167.93 will be a long term bullish signal, and could pave the way back to 195.86 high. This will now remain the favored case as long as 155.57 support holds, even in case of deep pull back.
Technical Outlook and Review
USD/JPY:
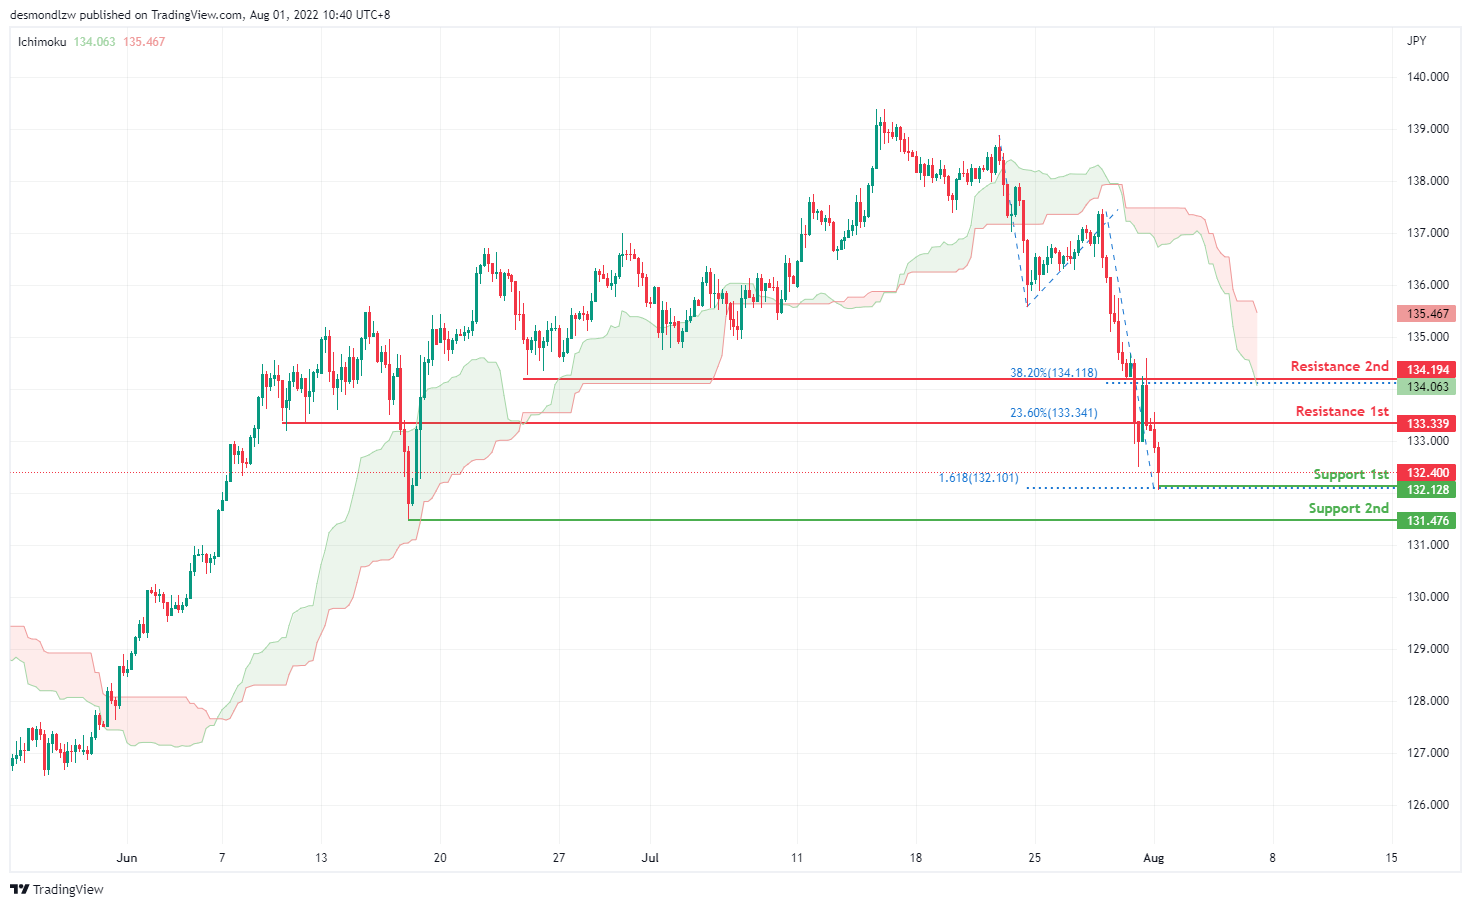
On the H4, with price broken out of the ascending trendline and moving below the Ichimoku indicator, we have a bearish bias that price will drop to our 1st support where 161.8 Fibonacci extension sits. The chart has confirmed a downside momentum and is now going to test the next key support level at 131.476. Alternatively, price could bounce back to test at its previous wing low at 133.339 which coincides with Fibonacci 23.6% retracement
Areas of consideration:
- H4 time frame, 1st resistance at 133.339
- H4 time frame, 1st support at 132.282
DXY:
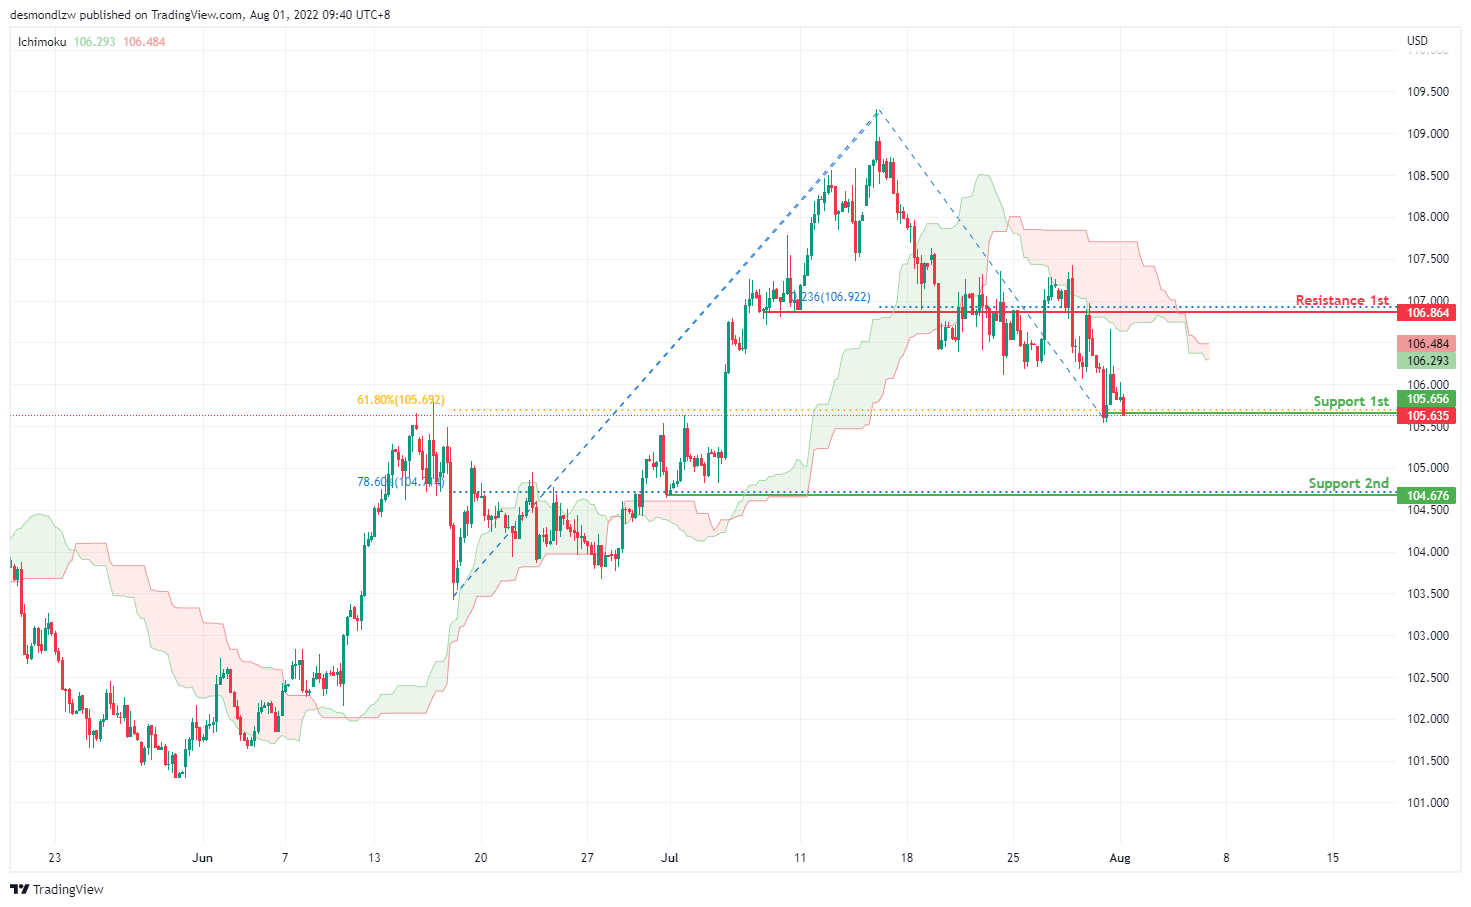
On the H4, prices have broken the ascending trend into a bearish biased trend. Prices have been strong in its bearish momentum, still respecting the Ichimoku cloud. It is currently testing at the first support 105.657, 61.8% Fibonacci retracement. If price were to break this support level, it will pullback further to test at 78.6% Fibonacci level, 104.676. Alternatively, price could bounce back and test at the first resistance, 23.6% Fibonacci extension
Areas of consideration:
- H4 time frame, 1st resistance at 106.864
- H4 time frame, 1st support at 105.656
EUR/USD :
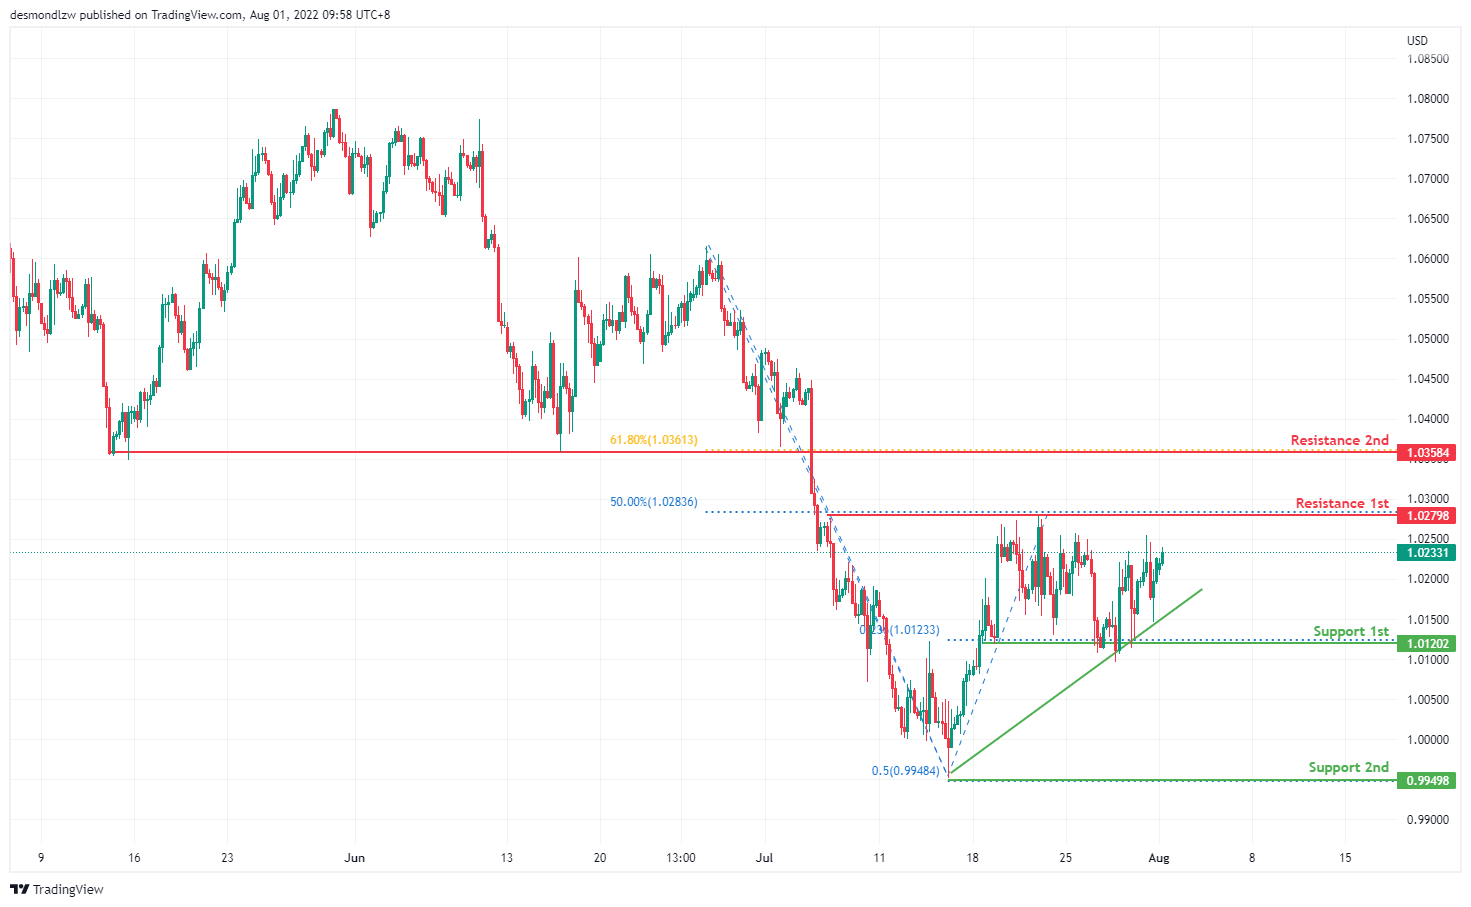
On the H4, prices have broken the bearish trend moving into a bullish biased trend. Price is now pulling back to test at the first resistance 1.027, 50% Fibonacci retracement level as it failed to break the first support at 1.012 which coincides with 23.6% Fibonacci extension. If price continues in the ascending trend, it will pullback further to test at the second resistance which is also a key swing low level. Alternatively, if prices continues with the bearish trend, it will test at the first support 1.012, subsequently the second support at 50% Fibonacci extension
Areas of consideration :
- H4 1st resistance at 1.027
- H4 1st support at 1.012
GBP/USD:
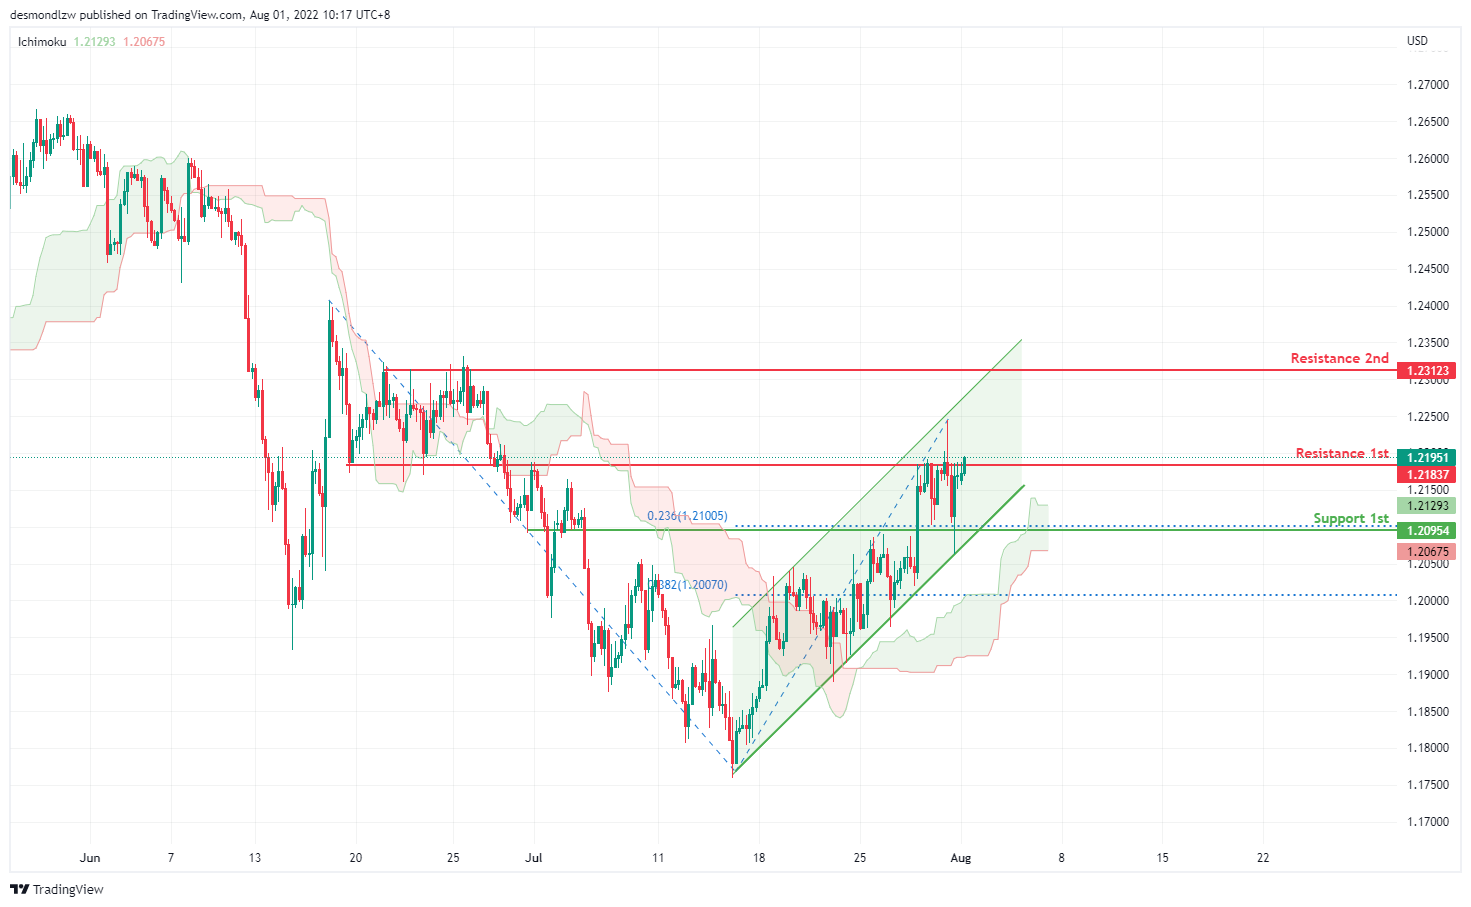
On the H4, with prices moving within an ascending channel and respecting the Ichimoku cloud, we are bullish bias. Price is now testing at the first resistance, 1.219 where the overlap support is. pullback resistance and 100% Fibonacci projection are. Once prices break the first resistance and there is upside confirmation, we would expect bullish momentum to carry price to 2nd resistance at 1.231 is. Alternatively, price could drop to 1st support at 1.209 where the 23.6% Fibonacci extension and pullback support is
Areas of consideration:
- H4 1st resistance at 1.219
- H4 1st support at 1.209
USD/CHF:
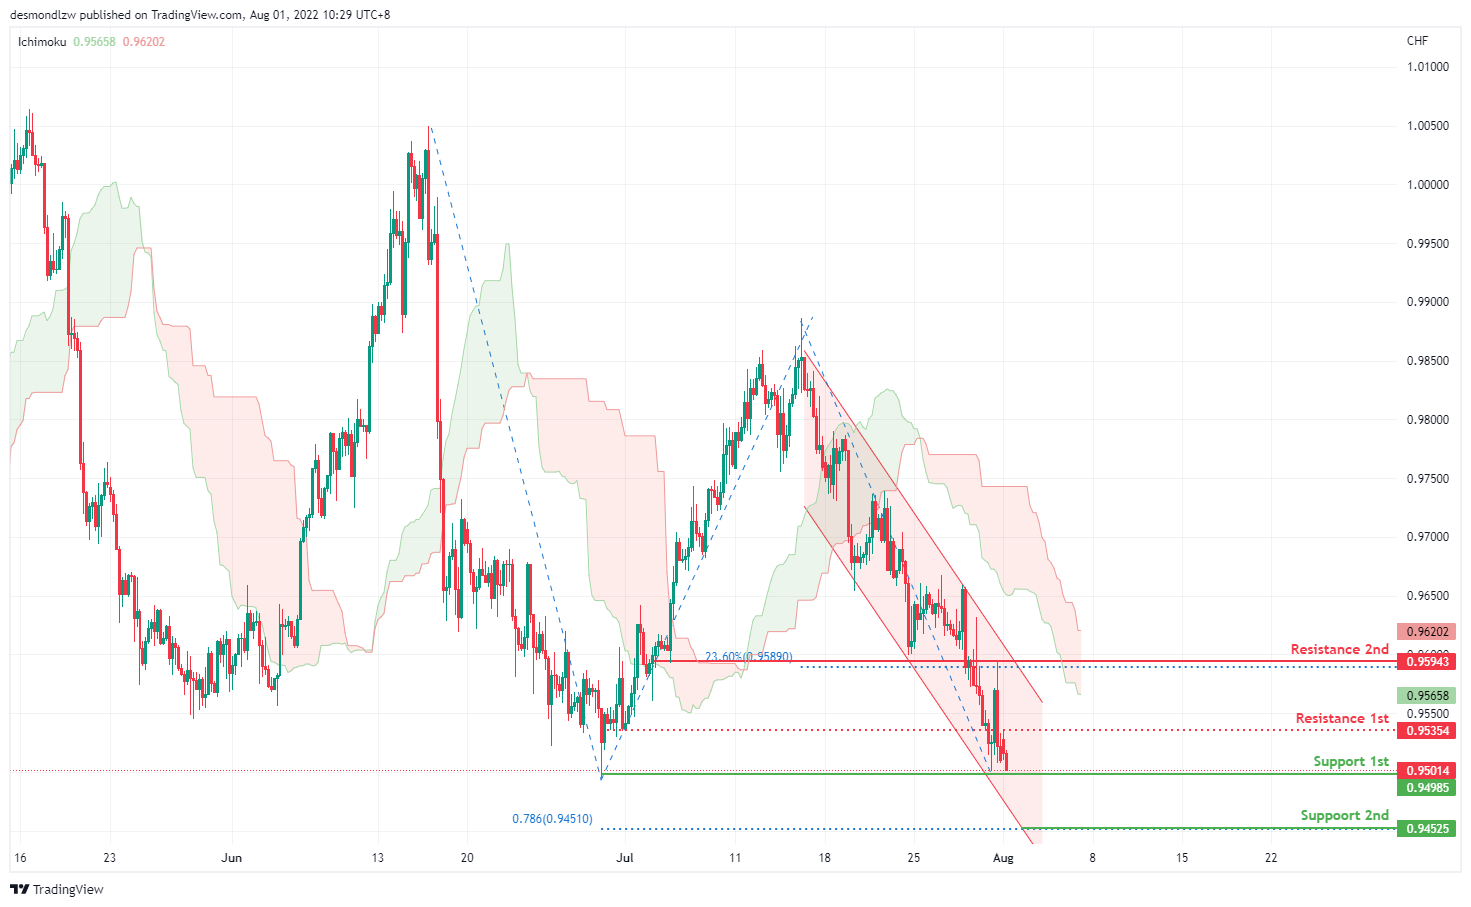
On the H4, prices are moving in a strong bearish momentum, respecting the descending channel. We have a bearish bias that price might drop to test at our first support, 0.950 which is our key support level. If price breaks the support, it will pullback further to test at 78.6% Fibonacci extension which is still respecting the channel. Alternatively, price may bounce off from the 1st support to test at the first intermediate resistance at 0.9535, subsequently testing the second resistance which is at the 23.6% Fibonacci retracement and overlap resistance.
Areas of consideration
- H4 1st resistance at 0.959
- H4 1st support at 0.950
XAU/USD (GOLD):
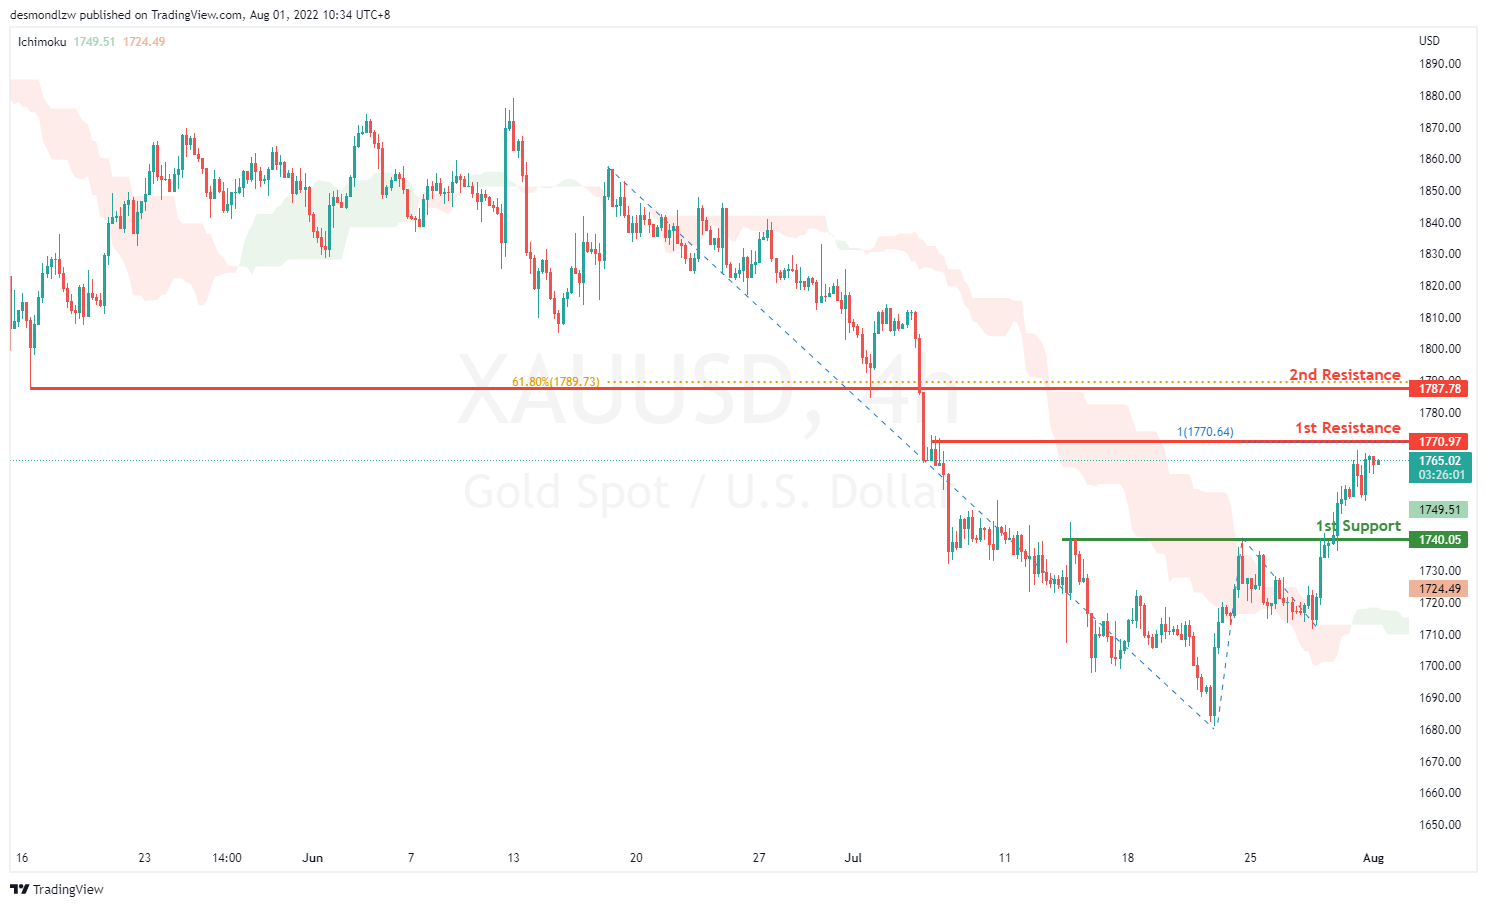
On the H4, with prices breaking out the ichimoku indicator, we have a bullish bias that price will drop and rise from the 1st resistance at 1770.97 where the the 100% projection is to 2nd resistance at 1787.78 in line with pullback resistance and 61.8% fibonacci retracement. Alternatively, prices could break 1st resistance and drop to 1st support at 1740.05 where the multiple swing highs are.
Areas of consideration:
- H4 time frame, 1st Resistance at 1770.97
- H4 time frame, 2nd Resistance at 1787.78
AUD/USD:
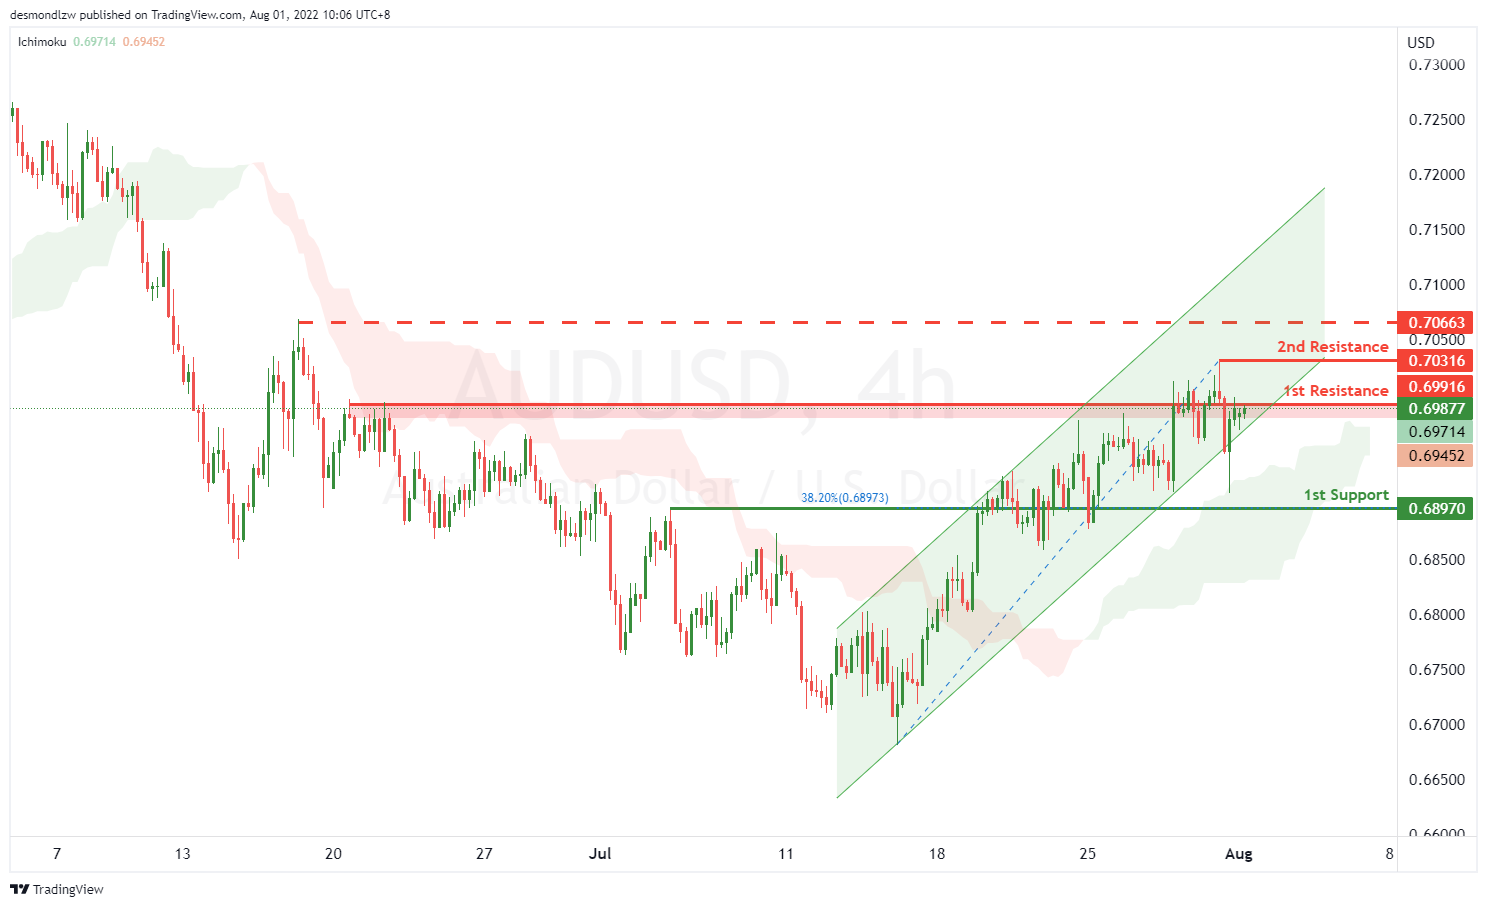
On the H4, with price moving above the ichimoku cloud and going along the ascending trend channel, we have a bullish bias that price will rise from the 1st resistance at 0.69916 to the 2nd resistance at 0.70316 at the swing high. Alternatively, price may reverse off 1st resistance and drop to the 1st support at 0.68970 at 38.2% fibonacci retracement. Take note if the price break the 1st resistance, it may rise to the resistance at 0.70663, which is in line with the swing high.
Areas of consideration
- H4 1st resistance at 0.69916
- H4 1st support at 0.70316
NZD/USD:
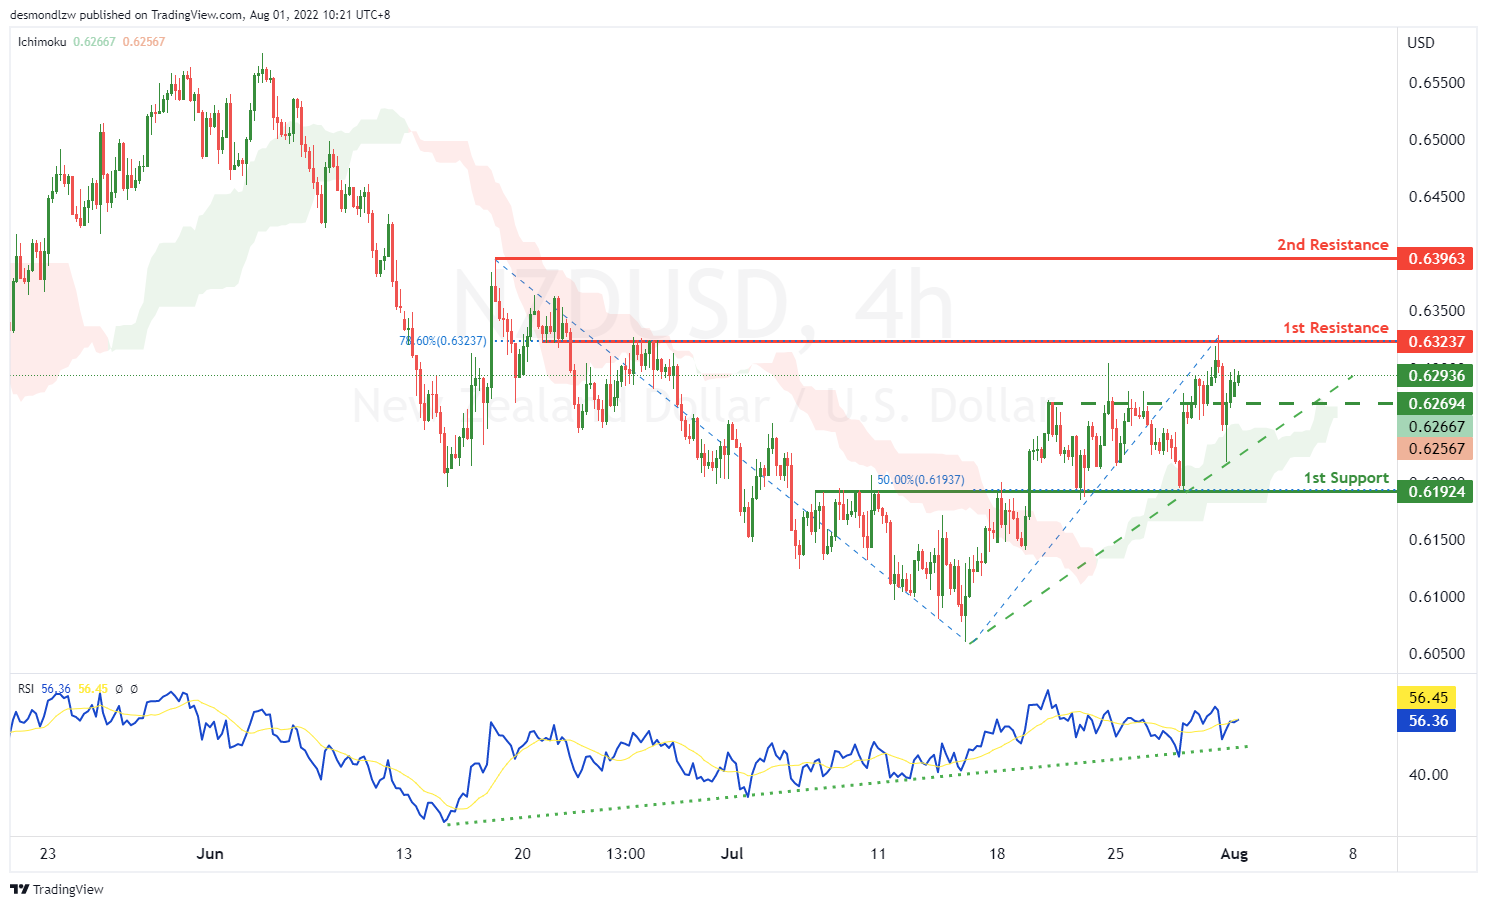
On the H4, with price going along the ascending trendline, RSI showing an ascending trendline and moving above the ichimoku cloud, we have a bullish bias that price will rise from the 1st resistance at 0.63237 at the overlap resistance in line with the 78.6% fibonacci retracement to the 2nd resistance at 0.63963 at the swing high. Alternatively, price may reverse off the 1st resistance and drop to the 2nd support at 0.61924 at the multiple swing lows and 50% fibonacci retracement. Take note the price of 0.62694 could be the intermediate support, which is in line with multiple swing highs.
Areas of consideration:
- H4 time frame, 1st resistance at 0.63237
- H4 time frame, 2nd resistance at 0.6396
USD/CAD:
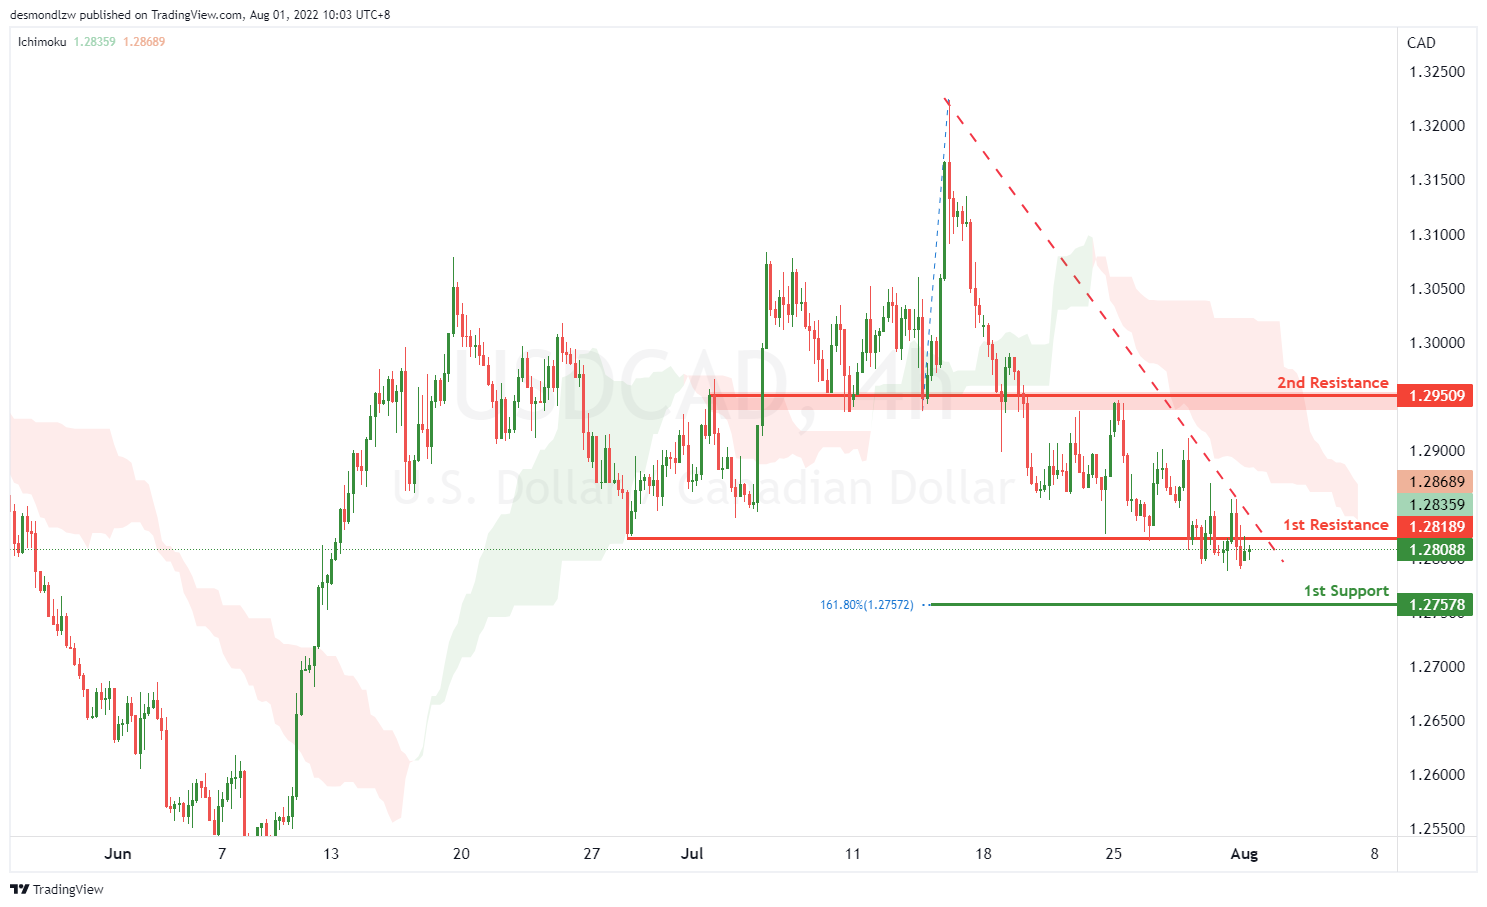
On the H4, with the price going along the descending trendline, we have a bearish bias that the price may drop from our 1st resistance at 1.28189, which is in line with swing low to our 1st support at 1.27578, which is in line with the 161.8% fibonacci extension. Alternatively, the price may rise to the 1st resistance at 1.29509, which is in line with the overlap resistance.
Areas of consideration:
- H4 time frame, 1st resistance at 1.28189
- H4 time frame, 1st support at 1.27578
OIL:
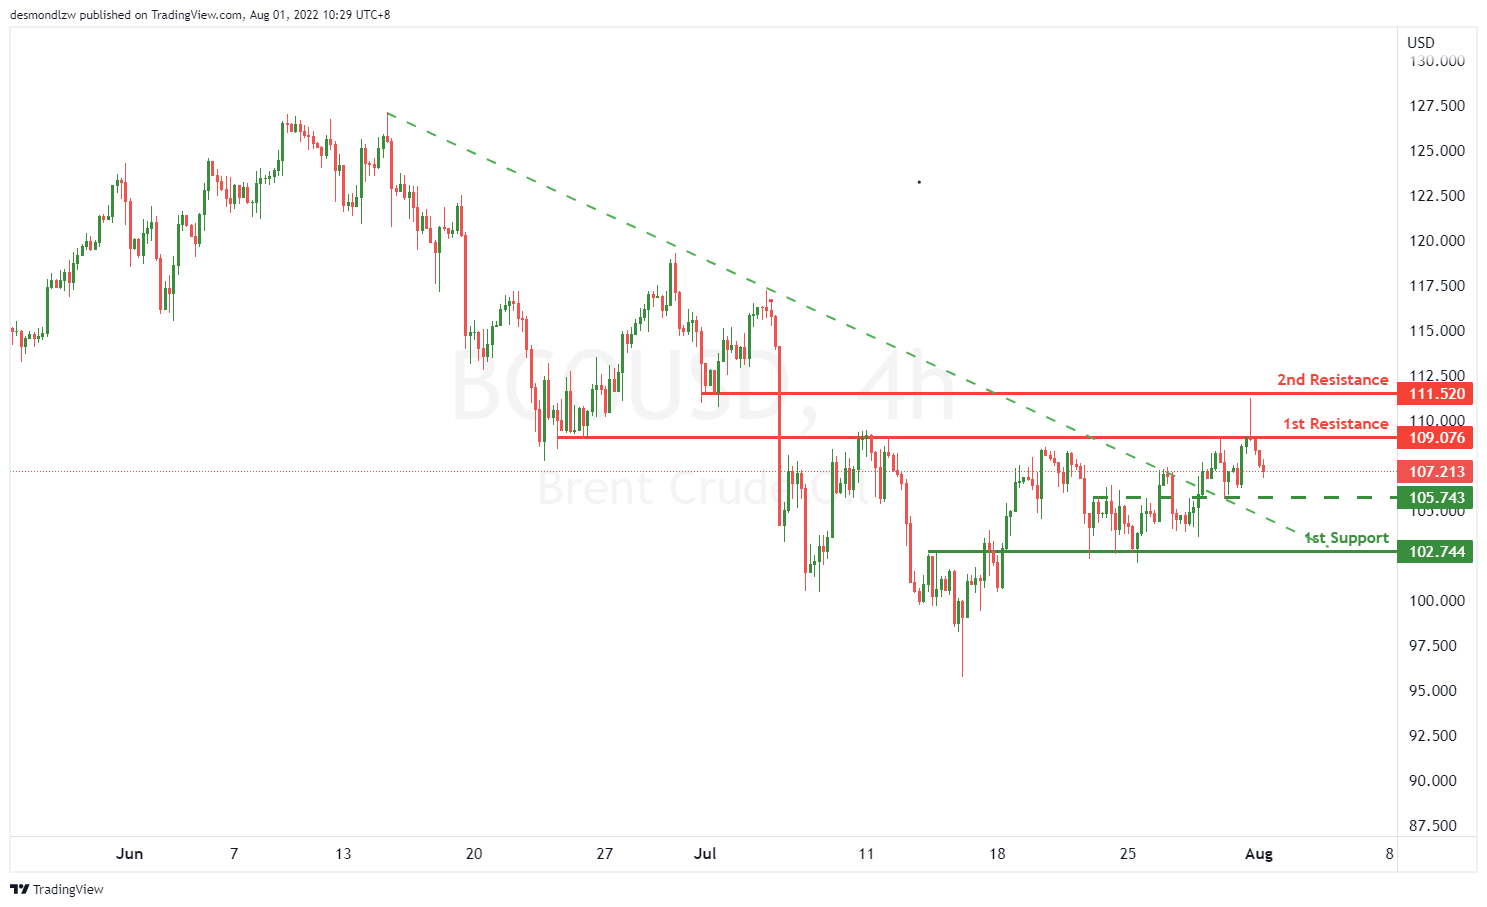
On the H4, with price breaking the bearish trendline, we have a bullish bias that price might rise from our 1st resistance at 109.076, which is in line with the overlap resistance to our 2nd resistance at 111.520, which is in line with swing low. Alternatively, take note if the price break the intermediate support at 105.743, which is in line with multiple swing highs and lows, the price may drop to 1st support at 102.744, which is in line with overlap support.
Areas of consideration:
- H4 time frame, 1st resistance of 109.076
- H4 time frame, 2nd resistance of 111.520
Dow Jones Industrial Average:
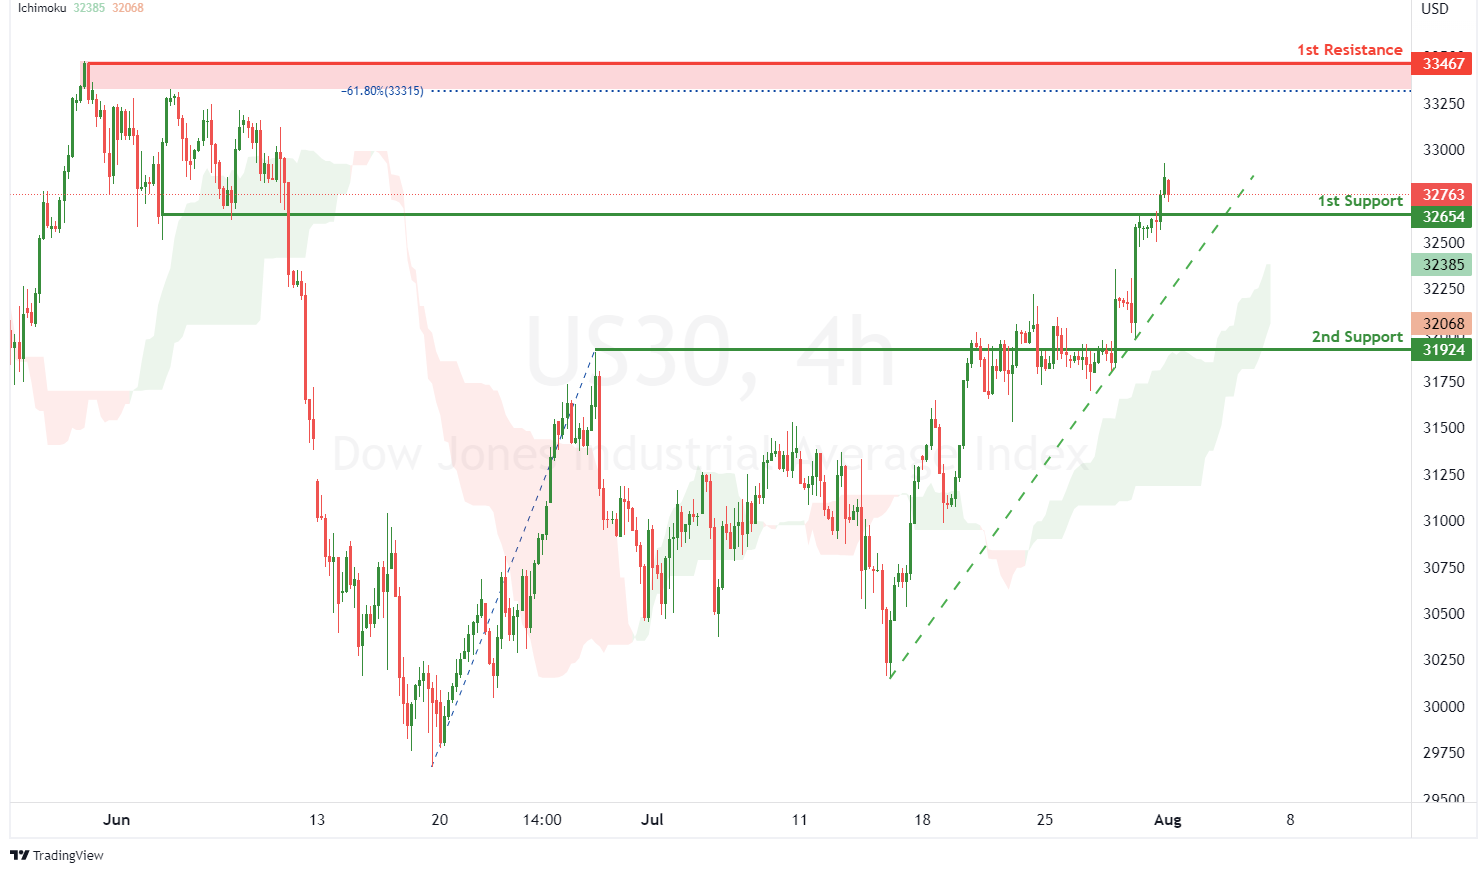
On the H4, with price moving along an ascending trendline and above the ichimoku indicator, we have a bullish bias that price will rise from our 1st support at 32654 where the pullback support is to the 1st resistance at 33467 where the swing high resistance and -61.8% fibonacci expansion are. Alternatively price could break 1st support structure and drop to 2nd support at 31924 where the pullback support is.
Areas of consideration:
- H4 time frame, 1st resistance of 33467
- H4 time frame, 1st support at 32654
DAX:
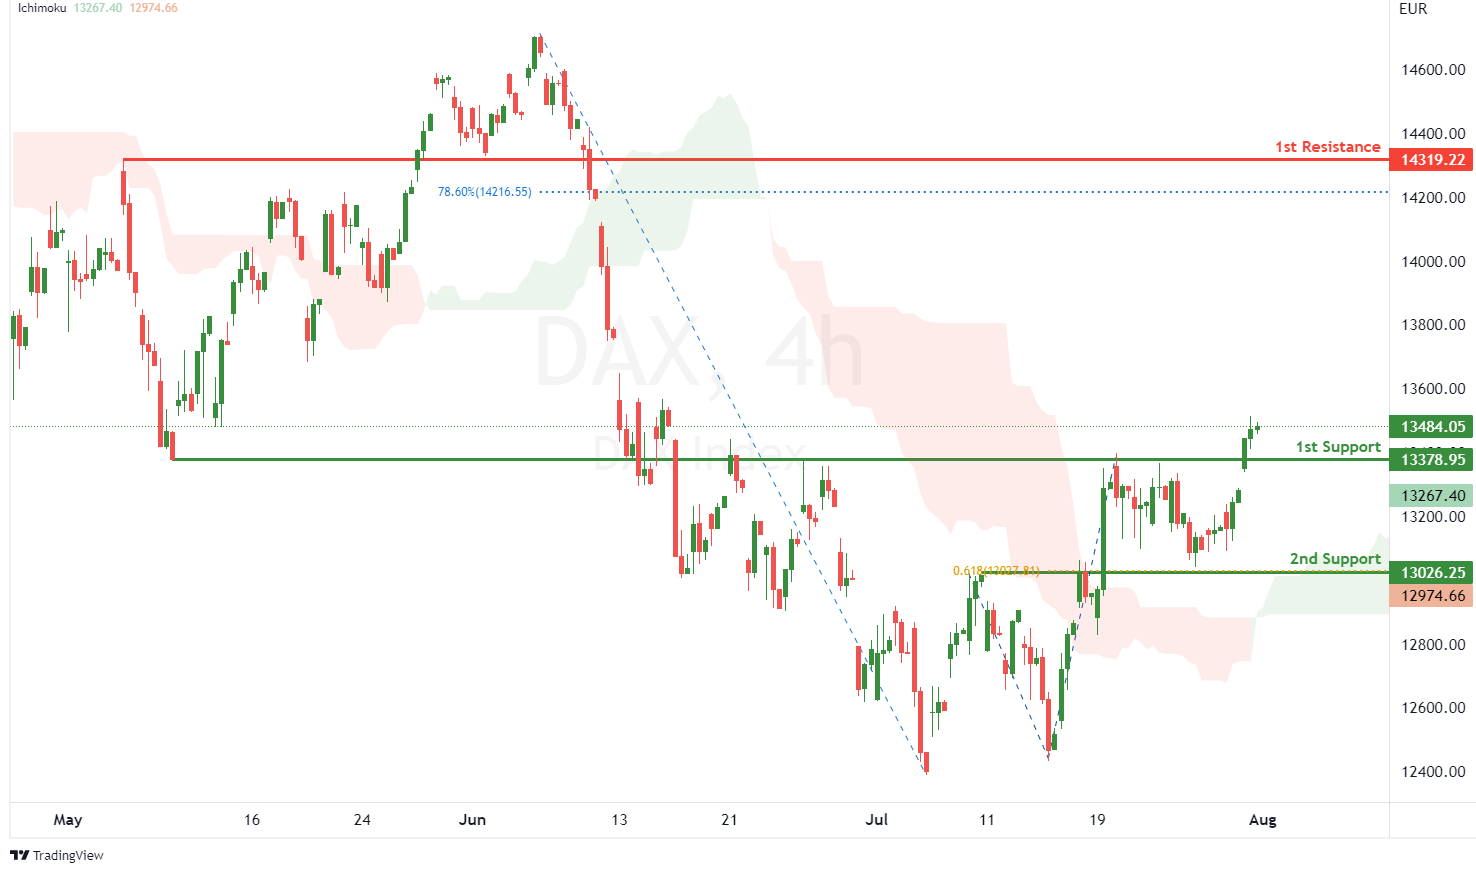
On the H4, with price moving above the ichimoku indicator, we have a bullish bias that price will rise from 1st support at 13378.95 in line with overlap support to the 1st resistance at 14319.22 where the pullback resistance and 78.6% fibonacci retracement are. Alternatively, price could break 1st support structure and drop to 2nd support at 13026.25 where the pullback support and 61.8% fibonacci projection are.
Areas of consideration:
- H4 time frame, 1st resistance of 14319.22
- H4 time frame, 1st support at 13378.95
ETHUSD:
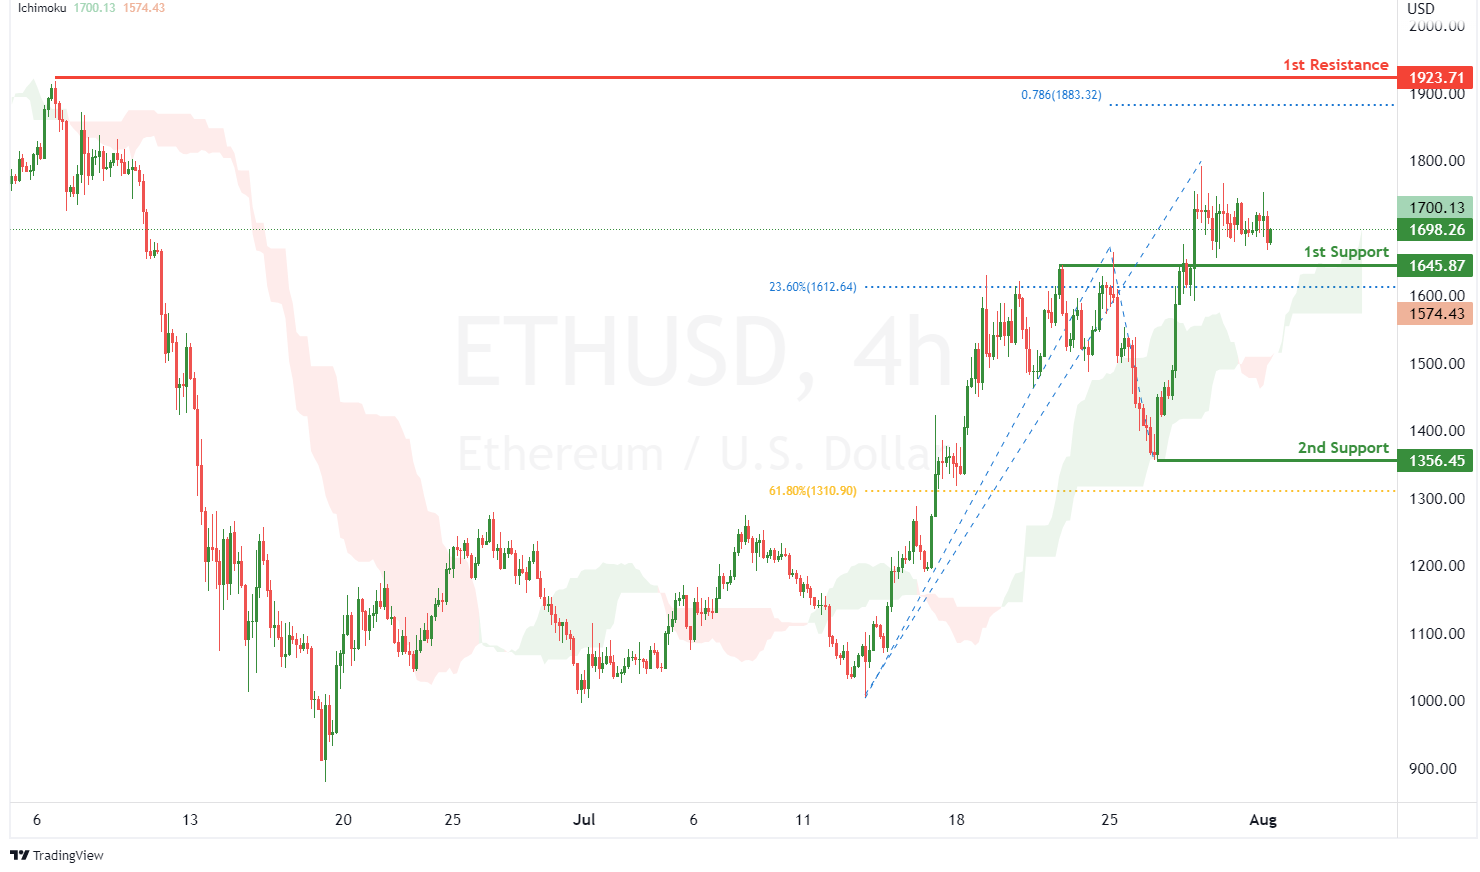
On the H4, with price moving above the ichimoku indicator, we have a bullish bias that price will rise from our 1st support at 1645.87 where the pullback support and 23.6% fibonacci retracement are to the 1st resistance at 1923.71 where the swing high resistance and 78.6% fibonacci projection are. Alternatively, price could break 1st support and drop to 2nd support at 1356.45 where the swing low support and 61.8% fibonacci retracement are.
Areas of consideration:
- H4 time frame, 1st resistance of 1923.71
- H4 time frame, 1st support at 1645.87
BTCUSD:
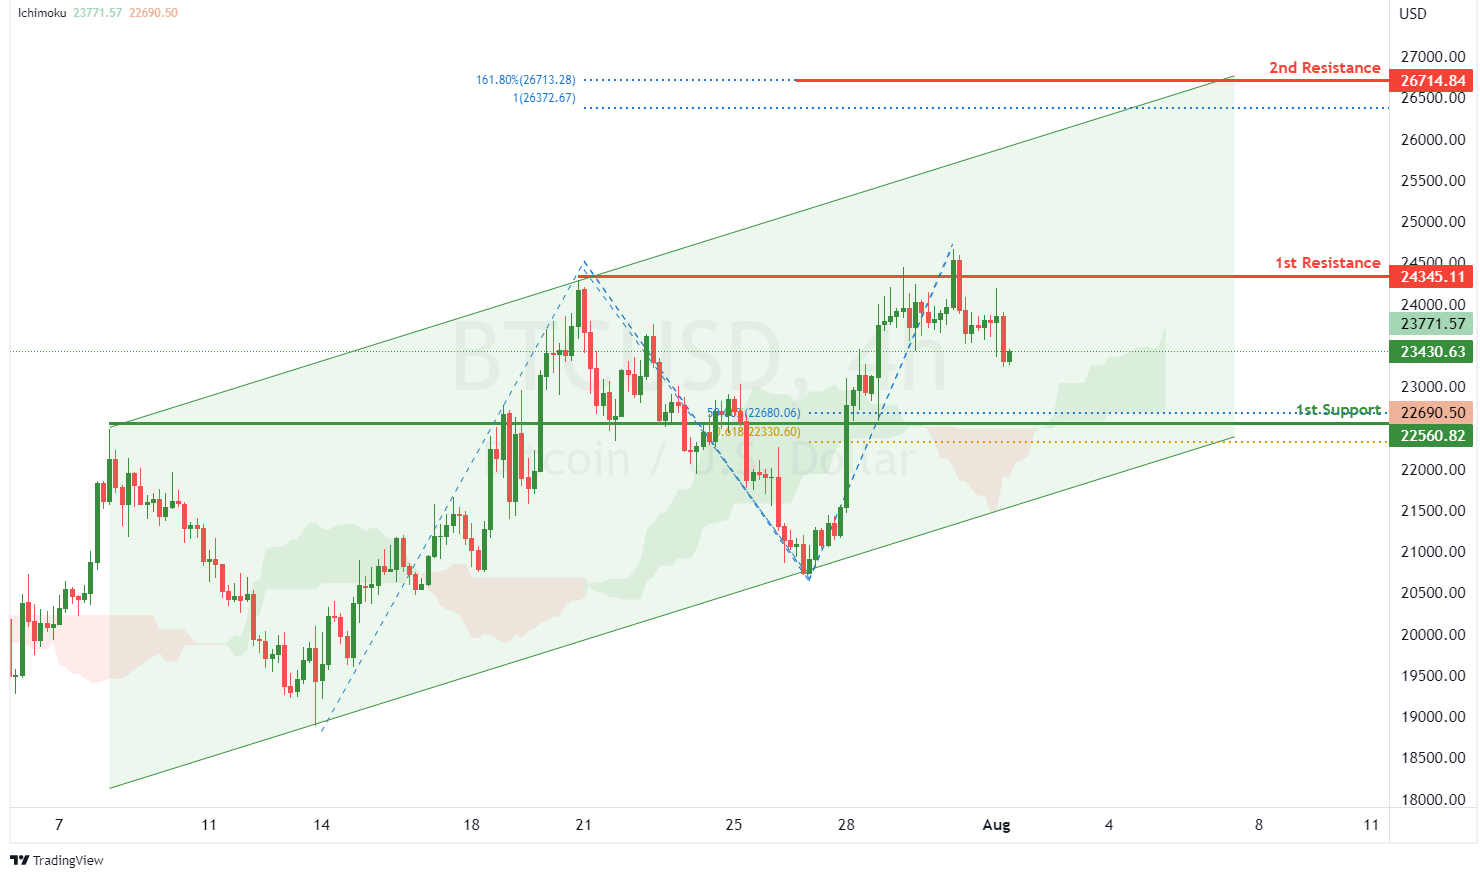
On the H4, with price moving within a bullish channel and above the ichimoku indicator, we have a bullish bias that price might rise to our 1st resistance at 24345.11 where the pullback resistance is. Once there is upside confirmation of price breaking 1st resistance structure, we would expect bullish momentum to carry price to 2nd resistance at 26714.84 where the 161.8% fibonacci extension and 100% fibonacci projection are. Alternatively, price could drop to 1st support at 22560.82 where the pullback support, 50% fibonacci retracement and 61.8% fibonacci projection are.
Areas of consideration:
- H4 time frame, 1st resistance of 24345.11
- H4 time frame, 1st support at 22560.82
S&P 500:
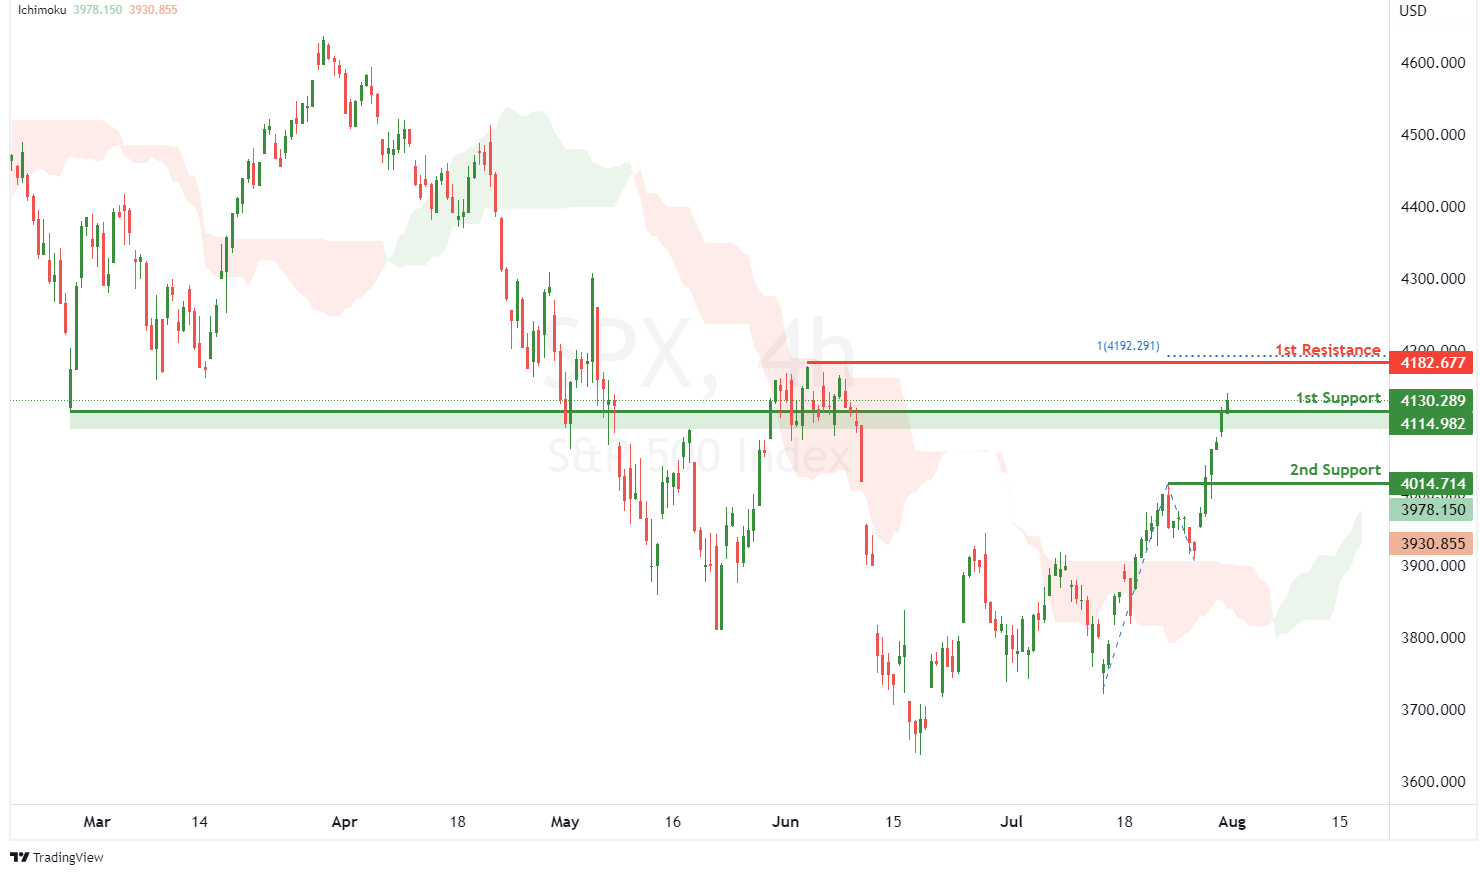
On the H4, with price moving above the ichimoku indicator, we have a bullish bias that price will rise from our 1st support at 4114.982 where the pullback support is to the 1st resistance at 4182.677 where the swing high resistance and 100% fibonacci projection are. Alternatively, price could break 1st support and drop to 2nd support at 4014.714 where the pullback support is.
Areas of consideration:
- H4 time frame, 1st resistance of 4182.677
- H4 time frame, 1st support at 4114.982
EUR/JPY Daily Outlook
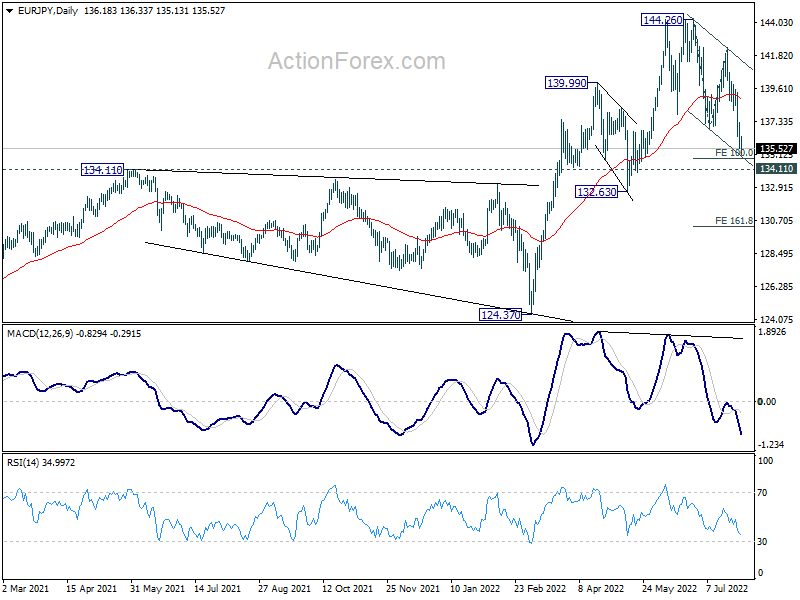
Daily Pivots: (S1) 135.43; (P) 136.38; (R1) 137.21; More....
EUR/JPY's decline continues today and intraday bias stays on the downside for 100% projection of 144.26 to 136.85 from 142.31 at 134.90, and possibly below. Strong support should be seen from 134.11 to complete the correction from 144.26. On the upside, above 137.31 minor resistance will turn intraday bias neutral first. However, sustained break of 134.11 will carry larger bearish implications and target 161.8% projection at 130.32.
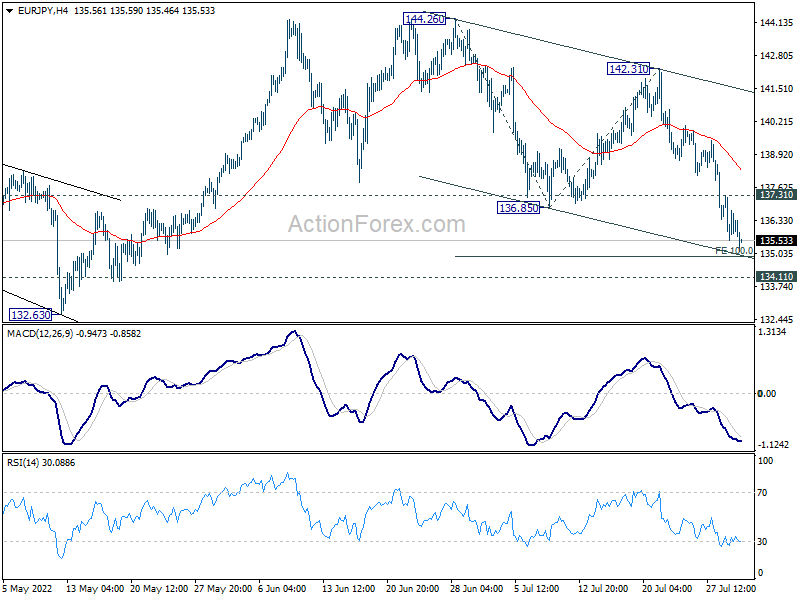
In the bigger picture, up trend from 114.42 (2020 low) is seen as the third leg of the pattern from 109.30 (2016 low). Further rally is in favor as long as 134.11 resistance turned support holds, even in case of deep pull back. Next target is 149.76 (2015 high). However, sustained break of 134.11 will be a sign of medium term bearish reversal and turn focus to 124.37 support for confirmation.